ni-mh batteries, 2 battery capacity versus discharge · pdf fileni-mi battery (green) having a...
TRANSCRIPT
© Festo Didactic 86354-00 23
When you have completed this exercise, you will be familiar with the effects of the discharge rate and battery temperature on the capacity and voltage of a Ni-MI battery. You will know how to calculate the energy supplied during a discharge cycle. You will also know what the specific energy and the energy density of a battery are, and how to determine these two parameters.
The Discussion of this exercise covers the following points:
Battery cell voltage versus discharge rate
Temperature versus available capacity
Memory effect
Energy supplied during a discharge cycle
Specific energy and energy density
Battery cell voltage versus discharge rate
Figure 14 shows a family of discharge characteristic curves of a Ni-MI battery obtained at various discharge rates. Notice that these curves represent the voltage measured across each cell in the battery. The final voltage or cutoff voltage (1 V in the present case) does not vary as a function of the discharge rate. Also note that this family of curves is relative to the discharge characteristic
curve obtained at a discharge rate of 0.2 , i.e., the discharge rate commonly used to establish the nominal capacity of Ni-MI batteries.
Battery Capacity Versus Discharge Rate
Exercise 2
EXERCISE OBJECTIVE
DISCUSSION OUTLINE
DISCUSSION

Exercise 2 – Battery Capacity Versus Discharge Rate Discussion
24 © Fes t o Di dac t i c 86354- 00
Figure 14. Family of discharge characteristic curves of a Ni-MI battery obtained at various discharge rates.
Table 3 shows the discharge time and relative battery capacity for each discharge characteristic curve in Figure 14. The capacity of a Ni-MI battery decreases little as the discharge rate increases. In fact, even with a discharge rate of 3 (15 times the optimal discharge rate of 0.2 ), the relative battery capacity is still only 15% below its nominal capacity.
Table 3. Discharge time and relative battery capacity versus discharge rate.
Discharge rate 0.2 1 2 3
Discharge time (h) 5 0.95 0.45 0.28
Relative battery capacity (% of )
100 95 90 85
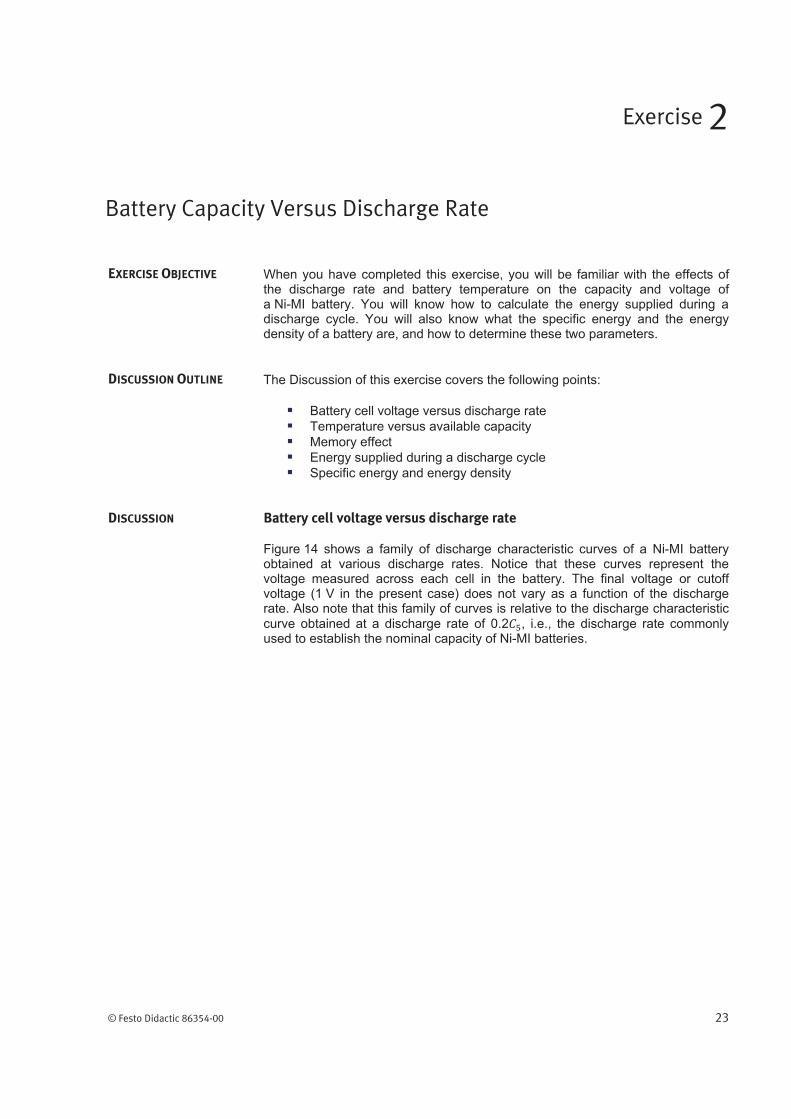
Figure 15 shows a curve of the relative capacity of a Ni-MI battery as a function of the discharge rate. Notice that the relative capacity of the Ni-MI battery is still more than 80% of the nominal capacity even when the discharge rate is as high
as 3 . In comparison, the relative capacity of a lead-acid battery at a discharge rate of 3 is generally only 50% to 60% of the rated capacity.
Percent of ampere-hour capacity
Ce
ll V
olta
ge
(V
)
3
2
1
0.2
Cutoff voltage
Exercise 2 – Battery Capacity Versus Discharge Rate Discussion
© Festo Didactic 86354-00 25
Figure 15. Relative capacity of a Ni-MI battery versus discharge rate.
Temperature versus available capacity
Figure 16 illustrates the effect of temperature on the available relative capacity of Ni-MI batteries at various discharge rates. As shown in the figure, Ni-MI batteries maintain their capacity over a wide range of discharge rates when operated at room temperature (20°C or 68°F and higher). However, the available capacity decreases fairly rapidly as the temperature goes below room
temperature, especially at high discharge rates (1 and higher). This is due to the progressively increasing internal resistance of Ni-MI batteries at lower temperatures.
Discharge rate
Re
lative
ca
pa
city (
%)
85% at 3

Exercise 2 – Battery Capacity Versus Discharge Rate Discussion
26 © Fes t o Di dac t i c 86354- 00
Figure 16. Relative capacity of a Ni-MI battery versus temperature at various discharge rates.
Memory effect
The memory effect is a reversible drop in voltage and loss of capacity that may occur when a Ni-MI battery is repeatedly discharged partially and recharged without the benefit of a full discharge in between. This phenomenon is also called voltage depression and can be reversed by performing a few subsequent full-discharge cycles. Figure 17 shows the effect of partial-discharge cycles on the cell voltage and capacity of a Ni-MI battery, as well as the reversal of this effect through repetitive full-discharge cycles.
Temperature (°C)
Temperature (°F)
3
2
1
0.2
Re
lative
ca
pa
city (
%)

Exercise 2 – Battery Capacity Versus Discharge Rate Discussion
© Festo Didactic 86354-00 27
Figure 17. Voltage depression during partial cycling on a Ni-MI battery.
In Figure 17, after a full-discharge cycle (cycle 1), the Ni-MI battery went through a series of 18 partial-discharge cycles (cycles 2 to 18). On the subsequent full-discharge cycle (cycle 19), the observed voltage and capacity are significantly lower than those observed in cycle 1. However, after a few full-discharge cycles (cycles 20 and 21), the voltage and capacity of the battery are nearly restored to their initial values.
Energy supplied during a discharge cycle
Each discharge characteristic curve can be used to determine the amount of energy that a battery releases during a complete discharge. This is carried out by determining the average battery voltage during the complete discharge, multiplying this voltage by the discharge current to find the average power, and then multiplying the calculated average power by the discharge time. The released energy is expressed in watt-hours (W·h).
Example
Suppose a Ni-MI battery having a capacity of 50 Ah is discharged at a rate
of 0.2 , i.e., a constant current of 10 A. Also suppose that the average voltage during the discharge is 12 V. In this case, the average power the battery delivers is equal to: 12 V 10 A 120 W. The energy supplied during the complete discharge cycle of 5 hours is thus equal to: 120 W 5 h 600 Wh.
Specific energy and energy density
The energy contained in a battery is often expressed as a ratio related to either the battery weight or volume. The ratio of battery energy to battery weight, called specific energy, is calculated by dividing the energy supplied by the battery
A watt-hour (W·h) is a unit
of energy, equal to the work
done by a power of one
watt (1 W) acting for one
hour. Note that the symbol
“Wh” is also widely used to
represent the watt-hour.
Time (hrs)
Vo
lta
ge
(V
)
Cycle Discharge
1 Full
2-18 Partial
19 Full
20-21 Full
Cycle 19
Cycle 20 Cycle 21
Cycle 1
Cycle 18
Cycle 13
Cycle 8
Cycle 2
Cycle 3

Exercise 2 – Battery Capacity Versus Discharge Rate Discussion
28 © Fes t o Di dac t i c 86354- 00
during a complete discharge cycle by the battery’s weight. The specific energy of Ni-MI batteries currently available does not exceed 80 Wh/kg (36.3 Wh/lb). This is about twice as much as lead-acid batteries (40 Wh/kg or 18.1 Wh/lb), but only half the specific energy of Li-ion batteries (160 Wh/kg or 75.6 Wh/lb).
The ratio of battery energy to battery volume, called energy density, is calculated by dividing the energy supplied by the battery during a complete discharge cycle by the battery’s volume. The energy density of currently available Ni-MI batteries does not exceed 300 Wh/L (4.92 Wh/in
3). This is about four times
the energy density of lead-acid batteries (75 Wh/L or 1.23 Wh/in3), but about 80%
of the energy density of Li-ion batteries (360 Wh/L or 5.90 Wh/in3).
The specific energy and energy density of a battery usually depend on the discharge rate. In the case of Ni-MI batteries, both decrease only slightly as the discharge rate increases because the battery capacity decreases very little when the discharge rate increases. Ni-MI batteries thus generally offer better
performances than lead-acid batteries at high discharge rates (more than 1 ), i.e., in most deep-cycle applications such as electric bikes, mobility scooters, golf carts, and city cars.
Figure 18 shows the size comparison between a lead-acid battery (black) and a Ni-MI battery (green) having a similar battery capacity (2.3 Ah for the lead-acid battery and 2.0 Ah for the Ni-MI battery). The figure clearly demonstrates that, given a similar battery capacity, Ni-MI batteries occupy a much smaller volume than lead-acid batteries. Likewise, for a similar battery capacity, Ni-MI batteries have a much smaller weight compared to lead-acid batteries. For instance, in the picture below, the lead-acid battery weighs 950 g (2.10 lb), while the Ni-MI battery weighs 285 g (0.63 lb).
Figure 18. Size comparison between a lead-acid battery (black) and a Ni-MI battery (green) having similar battery capacities (2.3 Ah and 2.0 Ah, respectively).

Exercise 2 – Battery Capacity Versus Discharge Rate Procedure Outline
© Festo Didactic 86354-00 29
The Procedure is divided into the following sections:
Set up and connections
Battery voltage and energy supplied during a discharge at 1 5
Battery voltage and energy supplied during a discharge at 2 5
Battery capacity versus discharge rate
Specific energy and energy density
High voltages are present in this laboratory exercise. Do not make or modify any
banana jack connections with the power on unless otherwise specified.
Set up and connections
In this section, you will set up and connect the equipment.
a All exercises should ideally be performed at an ambient temperature between 20°C (68°F) and 25°C (77°F).
1. Refer to the Equipment Utilization Chart in Appendix A to obtain the list of equipment required to perform this exercise.
Make sure that the serial number of the Ni-MI Batteries module you are using corresponds to the Ni-MI Batteries module serial number you noted in step 24 of Exercise 1. This ensures that the results you will obtain during the discharge cycles in this exercise are consistent with the results you obtained
during the 0.5 discharge cycle in Exercise 1.
Install the required equipment in the Workstation.
2. Before you continue this section, make sure that both batteries in the Ni-MI Batteries module are fully charged by performing the “Battery state-of-charge evaluation” described in the procedure of Exercise 1.
3. Make sure the main power switch on the Four-Quadrant Dynamometer/ Power Supply is set to the O (off) position, then connect its Power Input to an ac power outlet.
4. Connect the USB port of the Four-Quadrant Dynamometer/ Power Supply to a USB port of the host computer.
5. Turn the Four-Quadrant Dynamometer/Power Supply on, then set the Operating Mode switch to Power Supply.
PROCEDURE OUTLINE
PROCEDURE

Exercise 2 – Battery Capacity Versus Discharge Rate Procedure
30 © Fes t o Di dac t i c 86354- 00
6. Turn the host computer on, then start the LVDAC-EMS software.
In the LVDAC-EMS Start-Up window, make sure the Four-Quadrant Dynamometer/Power Supply is detected. Select the network voltage and frequency that correspond to the voltage and frequency of the local ac power network, then click the OK button to close the LVDAC-EMS Start-Up window.
7. Connect the battery of the Ni-MI Batteries module you used for the 0.5 discharge (see step 24 of Exercise 1) to the Four-Quadrant Dynamome-ter/Power Supply, as shown in Figure 19.
Connect the thermistor inputs of the Four-Quadrant Dynamometer/Power Supply to the thermistor of the Ni-MI battery to be discharged (without connecting the series resistor).
Figure 19. Ni-MI battery connected to the Four-Quadrant Dynamometer/Power Supply operating as a battery discharger.
Battery voltage and energy supplied during a discharge at 1 5
In this section, you will measure the battery voltage and energy supplied related to a Ni-MI battery during discharge at a rate of 1 . You will use the obtained data to plot a battery discharge curve later in the exercise.
8. In LVDAC-EMS, open the Four-Quadrant Dynamometer/Power Supply window, then make the following settings:
Set the Function parameter to Battery Discharger.
Set the Discharge Current parameter to 2 A (1 ).
Set the Discharge Duration parameter to 70 min.
Set the Cutoff Voltage parameter to 10.0 V (value recommended by the battery manufacturer).
*
*
(*) Meter in the Four-Quadrant Dynamometer/Power Supply window of LVDAC-EMS
12 V Ni-MH battery
N
Four-Quadrant Dynamometer/Power Supply

Exercise 2 – Battery Capacity Versus Discharge Rate Procedure
© Festo Didactic 86354-00 31
Also, reset the Energy Meter to make sure that the amount of energy discharged from the battery is currently equal to 0.00 Wh.
9. In LVDAC-EMS, open the Data Table window. Set the timer to make 140 records with an interval of 30 seconds between each record. This setting corresponds to a 70-minute period of observation.
Set the Data Table to record the voltage, current, and energy indicated by the meters in the Four-Quadrant Dynamometer/Power Supply window, and the time associated with each record.
10. In the Four-Quadrant Dynamometer/Power Supply window, start the Battery Discharger then immediately start the timer in the Data Table window to begin recording data.
11. About 15 minutes after the battery discharge began, measure the battery voltage using an external multimeter. Compare the voltage measured with the multimeter with that indicated by the voltmeter on the Four-Quadrant Dynamometer/Power Supply. If the values differ, correct the cutoff voltage of the Battery Discharger accordingly. For example, if the module voltmeter underestimates the battery voltage by 0.3 V, reduce the cutoff voltage to 9.7 V to ensure the discharge terminates when the battery voltage is actually 10.0 V.
12. Once the Battery Discharger stops, stop the timer in the Data Table window to stop recording data, then save the recorded data.
13. Record the duration of the discharge cycle at a rate of 1 .
Discharge duration: min
Battery voltage and energy supplied during a discharge at 2 5
In this section, you will measure the battery voltage and energy supplied related to a Ni-MI battery during discharge at a rate of 2 . You will use the obtained data to plot a battery discharge curve later in the exercise.
14. Replace the battery connected to the Four-Quadrant Dynamometer/Power Supply by the other battery (fully charged) of the Ni-MI Batteries module.
Connect the thermistor inputs of the Four-Quadrant Dynamometer/Power Supply to the thermistor of the Ni-MI battery to be discharged (without connecting the series resistor).
Exercise 2 – Battery Capacity Versus Discharge Rate Procedure
32 © Fes t o Di dac t i c 86354- 00
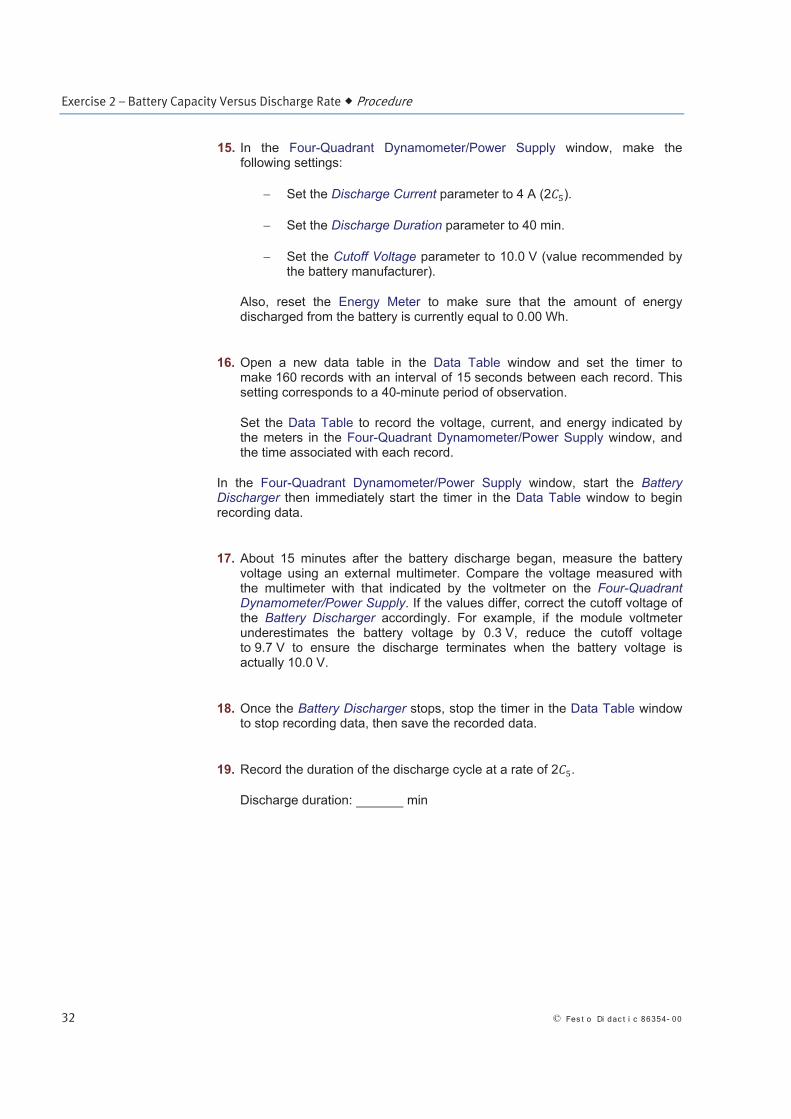
15. In the Four-Quadrant Dynamometer/Power Supply window, make the following settings:
Set the Discharge Current parameter to 4 A (2 ).
Set the Discharge Duration parameter to 40 min.
Set the Cutoff Voltage parameter to 10.0 V (value recommended by the battery manufacturer).
Also, reset the Energy Meter to make sure that the amount of energy discharged from the battery is currently equal to 0.00 Wh.
16. Open a new data table in the Data Table window and set the timer to make 160 records with an interval of 15 seconds between each record. This setting corresponds to a 40-minute period of observation.
Set the Data Table to record the voltage, current, and energy indicated by the meters in the Four-Quadrant Dynamometer/Power Supply window, and the time associated with each record.
In the Four-Quadrant Dynamometer/Power Supply window, start the Battery Discharger then immediately start the timer in the Data Table window to begin recording data.
17. About 15 minutes after the battery discharge began, measure the battery voltage using an external multimeter. Compare the voltage measured with the multimeter with that indicated by the voltmeter on the Four-Quadrant Dynamometer/Power Supply. If the values differ, correct the cutoff voltage of the Battery Discharger accordingly. For example, if the module voltmeter underestimates the battery voltage by 0.3 V, reduce the cutoff voltage to 9.7 V to ensure the discharge terminates when the battery voltage is actually 10.0 V.
18. Once the Battery Discharger stops, stop the timer in the Data Table window to stop recording data, then save the recorded data.
19. Record the duration of the discharge cycle at a rate of 2 .
Discharge duration: min

Exercise 2 – Battery Capacity Versus Discharge Rate Procedure
© Festo Didactic 86354-00 33
Battery capacity versus discharge rate
In this section, you will plot the discharge curves of a Ni-MI battery using the data recorded during the discharge tests at rates of , 1 , and . You will also determine the battery capacity at various discharge rates and plot the graph of the battery capacity versus discharge rate.
20. Export your data recorded at discharge rates of 0.5 (obtained in Exercise 1), 1 , and 2 to a spreadsheet application. Using the data measured until the voltage cutoff is reached during each discharge, plot the battery discharge curves at 0.5 , 1 , and 2 (battery voltage versus time).
21. From the curves you plotted in the previous step, determine the discharge time to the specified cutoff voltage, expressed in hours, for each discharge
rate (0.5 , 1 , and ). Record your results in the appropriate cells of Table 4.
a The discharge time, capacity in Ah, and capacity in % for a discharge rate of 0.2 are already provided in Table 4.
22. Calculate the capacity of the battery at , 1 , and from the curves you plotted in the previous step. Use the following suggested equation: capacity discharge current discharge time to the specified cutoff voltage. Record your results (expressed in Ah) in the appropriate cells of Table 4.
23. Express your calculated capacity values as a percentage of the nominal
capacity of the battery. Record your results in the appropriate cells of Table 4.
Table 4. Capacity and discharge time of a Ni-MI battery in relation to the discharge current.
Discharge rate
Discharge current
(A)
Discharge time
(min)
Capacity
(Ah)
Capacity
(%)
0.2 0.40 305 2.03 102
0.5 1.00
1 2.00
2 4.00
Exercise 2 – Battery Capacity Versus Discharge Rate Procedure
34 © Fes t o Di dac t i c 86354- 00
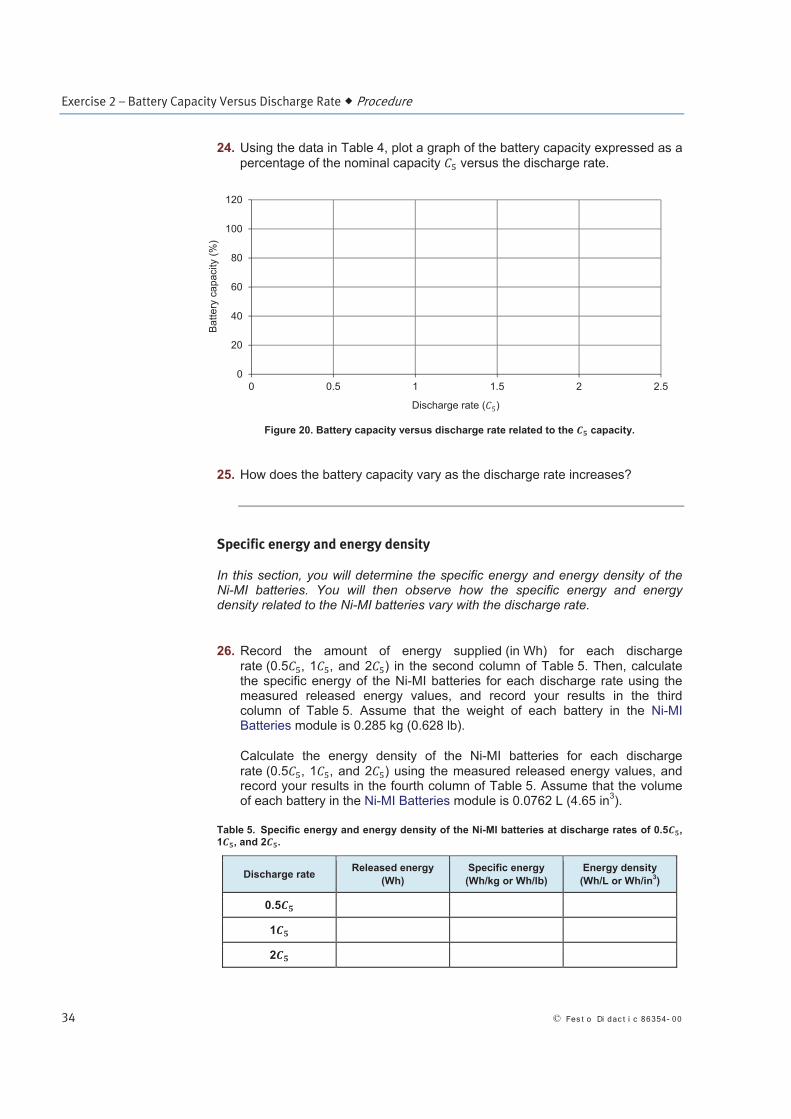
24. Using the data in Table 4, plot a graph of the battery capacity expressed as a
percentage of the nominal capacity versus the discharge rate.
Figure 20. Battery capacity versus discharge rate related to the capacity.
25. How does the battery capacity vary as the discharge rate increases?
Specific energy and energy density
In this section, you will determine the specific energy and energy density of the Ni-MI batteries. You will then observe how the specific energy and energy density related to the Ni-MI batteries vary with the discharge rate.
26. Record the amount of energy supplied (in Wh) for each discharge rate (0.5 , 1 , and 2 ) in the second column of Table 5. Then, calculate the specific energy of the Ni-MI batteries for each discharge rate using the measured released energy values, and record your results in the third column of Table 5. Assume that the weight of each battery in the Ni-MI Batteries module is 0.285 kg (0.628 lb).
Calculate the energy density of the Ni-MI batteries for each discharge
rate (0.5 , 1 , and 2 ) using the measured released energy values, and record your results in the fourth column of Table 5. Assume that the volume of each battery in the Ni-MI Batteries module is 0.0762 L (4.65 in
3).
Table 5. Specific energy and energy density of the Ni-MI batteries at discharge rates of 0.5 ,
1 , and 2 .
Discharge rate Released energy
(Wh)
Specific energy
(Wh/kg or Wh/lb)
Energy density
(Wh/L or Wh/in3)
0.5
1
2
0
20
40
60
80
100
120
0 0.5 1 1.5 2 2.5
Discharge rate ( )
Ba
tte
ry c
ap
acity (
%)
Exercise 2 – Battery Capacity Versus Discharge Rate Conclusion
© Festo Didactic 86354-00 35
27. How do the specific energy and energy density vary when the discharge rate increases?
28. Close LVDAC-EMS, then turn off all the equipment. Disconnect all leads and return them to their storage location.
In this exercise, you became familiar with the effects of the discharge rate and battery temperature on the capacity and voltage of a Ni-MI battery. You learned how to calculate the energy supplied during a discharge cycle. You also learned what the specific energy and the energy density of a battery are, and how to determine these two parameters.
1. When a Ni-MI battery discharges at a high current rate (1 and more), what happens to the voltage measured across the battery and to its relative battery capacity?
2. What is the effect of ambient temperature on the relative capacity of a Ni-MI battery at low discharge rates (about 0.2 )? At high discharge
rates (about 3 )?
3. What is the memory effect and how is it possible to cancel its effect?
CONCLUSION
REVIEW QUESTIONS

Exercise 2 – Battery Capacity Versus Discharge Rate Review Questions
36 © Fes t o Di dac t i c 86354- 00
4. Suppose a Ni-MI battery having a capacity of 15 Ah is discharged at a rate of 0.2 , i.e., a constant current of 3 A. Also suppose that the average voltage during the discharge is 10 V. Calculate the amount of energy supplied by the battery during the complete discharge cycle of 5 hours.
5. Suppose that a 12 V Ni-MI battery releases a total of 12 Wh during a full-discharge cycle. If it has a weight of 0.18 kg (0.40 lb) and a volume of 0.05 L (3.05 in
3), what are its specific energy and energy density?