nib bank ltd. - hbl asset managementhblasset.com/assets/uploads/2017/09/fund-manager-report-july...
TRANSCRIPT

NIB Bank Ltd. A wholly owned subsidiary of
July 2015
ECONOMIC REVIEW
Headline inflation (CPI) clocked in at 1.80% Y/Y for the first month of FY16 (vs. 3.16% Y/Y recorded for the month of Jun’15 and vs. 7.88% Y/Y recorded for the month of Jul’14). On a sequential basis, CPI increased by 0.40% M/M during the month. A sequential subdued growth in CPI was due to a 0.05% M/M increase in food prices (perishable food items – down by -1.37% M/M, while non-perishable food items - up 0.29% M/M). During the month, the SBP announced its first monetary policy of FY16, maintaining the benchmark discount rate at 7% for next two months. According to PBS released data, current account for Jun’15 posted a deficit of USD 343mn, lower than USD 473mn recorded in May’15, largely supported by record-high remittanc-es of USD 1.82bn (+21% Y/Y) during Jun’15; however widening trade deficit gap of USD 2.3bn pulled the balance in negative. For full year FY15 CAD rounded at USD 2.28bn (0.80% of GDP), in line with provisional budgetary estimates for FY15. During FY15 FDI declined by 58.2% Y/Y to USD 709mn, while FIPI declined by 32% Y/Y to USD 1.69bn, bringing net investment inflows to USD 2.87bn for FY15, down 35% Y/Y. Going forward, on the macro front, IMF is expected to release funds under EFF (8th review talks are under way) and govt. may get waiver on gas price hike for 1QFY16 due to floods which have affected Southern Punjab, upper Sindh and Baltistan regions (affecting 3.5-4.0mn people vs. 2.5mn in 2014 floods). International oil prices declined further on the back of the US-Iran deal, resulting in further decline in local oil prices; however govt. aims not to fully pass on the benefit of lower oil prices to masses, and finance the gap to reduce circular debt. On top of it, the stock of circular debt, under capping plan agreed upon by the IMF is to be brought down to PKR 204.4bn by Fy18 from PKR 303bn in FY15.
During the period under review, SBP conducted T-bill auctions twice with a cumulative target of PKR 275bn against maturity of PKR~148.9bn. Cumulative participation in the auction was PKR~407.6bn with a major amount accepted in six months tenor while total amount accepted was PKR~322.9bn (excluding non-competitive bids). The cut-offs yields in the last auction were 6.9308%, 6.9513% and 6.9595% for 3m, 6m tenor and 12m tenor respectively. SBP also conducted a PIB auction on July 15, 2015; against a target of PKR100bn, participation of PKR~175.5bn (face value) was witnessed while the government accepted an amount of PKR~50.7bn. Participation was skewed towards the 3year and 5year tenors (95% of total bids). The cut-off yields were 8.0940% and 8.9911% for the 3y and 5y tenors respectively while bids for the 10y tenor were rejected.
The KSE100 Index gained 3.90% in Jul’15 (vs. gain of 4.06% in Jun’15) while activity at the bourse was robust with average volumes of 447mn shares, up 19% M/M. This took CY15TD gains to 11.24% (KSE-100 stands as the 3rd best performing markets in Frontier space). On the foreign counter, net outflow of USD -95.80mn was recorded in 7mCY15, versus net inflow of USD340.11mn during 7MCY14 (net out flow of USD 21.28mn was recorded in Jul’15 vs. net inflow of USD 7.69mn recorded in Jun’15). The major development during the month was the US-Iran Deal, which resulted in further decline in international oil prices. This, coupled with positives noted in IMF’s staff report under EFF program wherein IMF lowered its estimates of FY16 CPI to 4.75% and CAD to 0.40% of GDP, supported the market’s positive sentiment. On the political front, the Judicial Commission formed to investigate rigging in the 2013 elections, ruled in favor of the PML-N which boosted investor confidence and trading activity expanded across the board. Major FIPI inflows were witnessed in Commercial banks, Chemicals, and Power Generation & Distribution sector.
MONEY MARKET REVIEW
EQUITY MARKET REVIEW
01 | FUND MANAGER’S REPORT
Risk Disclaimer: All investments in mutual fund are subject to market risks. Past performance is not necessarily indicative of the future results. Please read the Offering Document to Understand the investment policies and the risk involved

July 2015
PICIC CASH FUND (PICIC-CF)
INVESTMENT OBJECTIVE:
FUND INFORMATION FUND MANAGER COMMENTS MATURITY PROFILE
To provide competitive returns to its investors through active investments in low risk portfolio of short duration, while maintaining . The Fundaims to maximize returns through efficient utilization of investment and liquidity management tools.
NIB Bank Ltd. A wholly owned subsidiary of 02 | FUND MANAGER’S REPORT
During the month, the Fund size increased to PKR 3,673mn from PKR3,249mn in Jun’15. The Fund earned an annualized return of 6.39% for the month against the benchmark of 5.03%. The fund increased its exposure in T-bills from 55% in June'15 to 75% as of July'15. The overall weighted average maturity stood at 64 days against 83 days during the preceeding month. Going forward, the fund would look for potential placement opportunities besides investing in T-bills to augment the Fund's return.
Weighted Average Maturity
ASSET QUALITY
64 Days
Asset Allocation Jul’15
Cash
T-Bills
Placement with Banks and DFI’s
Other including receivables
Total
75
15
10
0
100
Jun’15
55
31
13
1
100
(% of Total Assets)
Inception to date return**
Month to Date return
Year to Date return (FYTD)
12M Trailing return
FUND BENCHMARK
INVESTMENT COMMITTEE MEMBERS
12.02
6.39
6.39
10.31
7.96
5.03
5.03
6.61
KEY RATES (%)
NON COMPLIANCE
Source: SBP, Bloomberg
PERFORMANCE ANNUALIZED (%)
Jul’15
10.51
8.37
9.08
11.44
11.68
6.83
7.16
7.59
9.67
9.39
KIBOR ( 1M)*
KIBOR ( 3M)
KIBOR ( 6M)
Latest T-bills Cut-off (3M)
Latest T-bills Cut-off (6M)
Latest T-bills Cut-off (12M)
PIB Cut-Off (3Yr)
PIB Cut-Off (5Yr)
PIB Cut-Off (10Yr)
CPI Inflation
Discount Rate
FY 15
FY 14
FY 13
FY 12
FY 11
FUND BENCHMARK
PERFORMANCE (%)
Feb-15Aug-14 Sep-14
Fund Returns
Benchmark
Note: 1-Performance data does not include cost of sales loads. 2- Computation of performance is dividend adjusted NAV to NAV basis
*Average (BID) for the period** From 14th December 2010
The scheme has maintained provisions against WWF liability of Rs 15,485,491 if the same were not made the NAV per unit/return of the scheme would be higher by Re 0.4252/4.99% (YTD). For details, investors are advised to read the Note 7 of the latest financial statements of the scheme.
Fund TypeCategoryLaunch DateNet Assets NAV per UnitTrusteeAuditorBenchmark
Dealing DaysCut off timePricing MechanismManagement FeeAMC RatingFund Stability RatingFront-end LoadMin.SubscriptionFund ManagerListingLeverageRisk Profile
Open-endMoney Market SchemeDecember 14th 2010PKR 3,673 millionPKR 100.8537CDCA.F.Ferguson & Co.Average of 3M AA Rated Bank DepositMonday-Friday4:00 pm (Mon to Fri)Backward0.5% per annumAM2-(JCR-VIS) 13/02/2015AA(f) (JCR-VIS) 22/12/2014Class D: 1% of NAVPKR 5,000Tauqir ShamshadISENilLow
AA+, 15%
AA, 10%
Govt. Securities,75%
AssetQuality
(% of totalassets)
6.43
6.74
6.79
6.93
6.95
6.96
8.09
8.99
9.25
1.80
7.00
Oct-14 Nov-14 Dec-14 Jan-15
8.848.94 8.94 9.11 9.54 8.80 10.22
6.52
Mar-15
7.49
6.18
Apr-15
8.45
5.657.75 7.75 7.75 7.75 7.33 7.00
high liquidity
COI / LOP
Pak Brunei Investment Company Limited
* The Non-compliance is due to a decline in Fund Size
Regulatory Limit(%)
Current Exposure(% of Total Asset)
Current Exposure(% of Net Asset)
Excess Exposure(% of Total Asset)
Excess Exposure(% of Net Asset)
10 14.86 14.97 4.86 4.97
Monthly Fund Perfomance Annualized (%)
ANNUALIZED
May-15
7.26
5.22
Jun-15
24.48
5.35
Jul-15
6.39
5.03
Risk Disclaimer: “This publication is for informational purposes only and nothing herein should be construed as a solicitation, recommendation or an offer to buy or sell any fund. All investments in mutual funds are subject to market risks. Past performance is not necessarily indicative of future results. Please read the Offering Document to understand the investment policies and risks involved.
Syed Ali Zafar Mehdi, Chief Investment Officer
Tauqir Shamshad, Head of Fixed Income
Suleman Chhagla, Chief Executive Officer
Mutual Fund Association of Pakistan (MUFAP) Recommended Format

PICIC INCOME FUND (PICIC-IF)
INVESTMENT OBJECTIVE:
NIB Bank Ltd. A wholly owned subsidiary of 03 | FUND MANAGER’S REPORT
Source: SBP, Bloomberg
Inception to date return
Month to Date return
Year to Date return (FYTD)
12M Trailing return
INVESTMENT COMMITTEE MEMBERS
13.20
8.17
8.17
11.56
10.60
6.79
6.79
8.48
KEY RATES (%)
TOP TFCs / SUKUK HOLDING (% OF TOTAL ASSETS)
Engro Fertilizer Limited Sukuk 3.59
3.04Soneri Bank Ltd (Pre-IPO) - TFC
PERFORMANCE ANNUALIZED (%)Jul’15
11.75
8.78
9.52
11.85
11.66
8.74
9.57
9.67
12.13
13.20
KIBOR ( 1M)*
KIBOR ( 3M)
KIBOR ( 6M)
Latest T-bills Cut-off (3M)
Latest T-bills Cut-off (6M)
Latest T-bills Cut-off (12M)
PIB Cut-Off (3Yr)
PIB Cut-Off (5Yr)
PIB Cut-Off (10Yr)
CPI Inflation
Discount Rate
FY 15
FY 14
FY 13
FY 12
FY 11
FUND BENCHMARK
Feb-15Aug-14 Sep-14 Oct-14 Nov-14 Dec-14 Jan-15
Fund Returns
Benchmark
Note: 1-Performance data does not include cost of sales loads. 2- Computation of performance is dividend adjusted NAV to NAV basis
*Average (BID) for the period
The scheme has maintained provisions against WWF liability of Rs 14,403,780 if the same were not made the NAV per unit/return of the scheme would be higher by Re 0.9553 /10.92 % (YTD). For details, investors are advised to read the Note 6 of the latest financial statements of the scheme.
Fund TypeCategoryLaunch DateNet AssetsNAV per UnitTrusteeAuditorBenchmarkDealing DaysCut off timePricing MechanismManagement FeeAMC RatingFund Stability RatingFront-end LoadMin.SubscriptionFund ManagerListingLeverageRisk Profile
Open-endIncome SchemeJuly 24th 2010PKR 1,563 millionPKR 103.6795CDCA.F.Ferguson & Co.Average of 6M KIBORMonday-Friday4:00 pm (Mon to Fri)Forward1.25% per annumAM2-(JCR-VIS) 13/02/2015A+(f) (JCR-VIS) 25/02/2015Class D: 1.25%NAVPKR 5,000Tauqir ShamshadISENilLow to Medium
FUND INFORMATION MATURITY PROFILE
During the month, the Fund size increased to PKR 1,563mn from PKR 1,324mn in Jun’15. The Fund made an annualized return of 8.17% during the month. The Fund’s weighted average maturity decreased to 668 days against 1,023 days in Jun’15. Going forward, we expect return for the month of August to increase as the inflation has remained subdued and the yields on the longer duration securities have started to ease. The fund intends to align the composition of its portfolio accordingly in order to augment the returns for its investors.
Weighted Average Maturity
ASSET QUALITY
668 Days
Asset Allocation
Cash
T-Bills
PIB’s
Corporate Sukuks / TFCs
MTS
Others
Total
Jul’15
10
27
45
7
10
1
100
Jun’15
24
3
61
7
1
4
100
(% of Total Assets)
To provide competitive returns to its investors through active investments in a blend of short, medium and long term debt ins truments. The Fund aims to preserve capital while maximizing returns through efficient utilization of investment and liquidity management tools.
9.3910.05 10.80 14.99 18.74 13.26 18.46
8.24
Mar-15
9.13
7.93
Apr-15
17.61
7.639.93 9.93 9.94 9.61 9.40 8.93
6.43
6.74
6.79
6.93
6.95
6.96
8.09
8.99
9.25
1.80
7.00
Monthly Fund Perfomance Annualized (%)
PERFORMANCE (%)ANNUALIZED
May-15
5.41
6.79
Jun-15
-3.58
6.63
Jul-15
8.17
6.79
FUND BENCHMARK
Risk Disclaimer: “This publication is for informational purposes only and nothing herein should be construed as a solicitation, recommendation or an offer to buy or sell any fund. All investments in mutual funds are subject to market risks. Past performance is not necessarily indicative of future results. Please read the Offering Document to understand the investment policies and risks involved.
AA-, 10%
A+, 7%
Govt. Securities72%
Others, 1%
AssetQuality
(% of totalassets)
MTS(Unrated), 10%
Suleman Chhagla, Chief Executive Officer
Syed Ali Zafar Mehdi, Chief Investment Officer
Tauqir Shamshad, Head of Fixed Income
July 2015
FUND MANAGER COMMENTS
Mutual Fund Association of Pakistan (MUFAP) Recommended Format
AssetQuality
(% of totalassets)
Source: SBP, Bloomberg
TOP TFCs / SUKUK HOLDING (% OF TOTAL ASSETS)
Engro Fertilizer Limited Sukuk 8.57
PICIC ISLAMIC INCOME FUND (PICIC-IIF)
INVESTMENT OBJECTIVE:
FUND INFORMATION MATURITY PROFILE
NIB Bank Ltd. A wholly owned subsidiary of 04 | FUND MANAGER’S REPORT
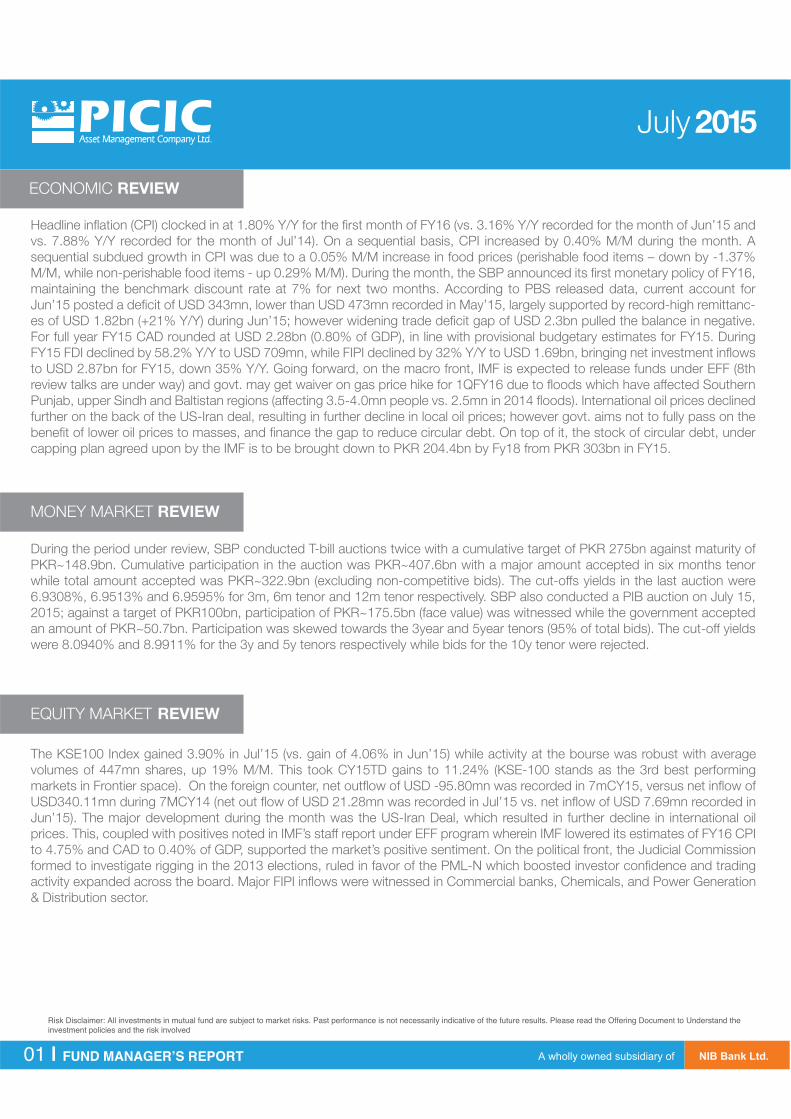
During the month of July, the fund size increased to PKR 457mn against PKR 359mn in June'15. The fund made an annualized of 5.79% for the month while maintaining Days to Maturity of 144. The fund manager intends to increase the exposure in good credit instruments to augment the fund's return.
ASSET QUALITY
ANNUALIZED PERFORMANCE (%)
Inception to date return**
Year to Date return (FYTD)
FY - 15
Month to date return
FY - 14
12M Trailing return
FUND BENCHMARK
INVESTMENT COMMITTEE MEMBERS
8.33
5.79
5.79
8.37
8.95
8.23
6.48
5.37
5.37
6.58
6.49
6.48
8.52 8.18 7.81 9.26
6.54 6.55 6.51 6.84
Aug-14 Sep-14 Oct-14 Nov-14
7.46
6.79
Dec-14
9.03
7.51
Jan-15
6.49
Feb-15
Fund Returns
Benchmark
Note: 1-Performance data does not include cost of sales loads. 2- Computation of performance is dividend adjusted NAV to NAV basis
*Average (bid) for the period**From 29th may 2014
The scheme has maintained provisions against WWF liability of Rs 378,969 if the same were not made the NAV per unit/return of the scheme would be higher by Re 0.0837 / 0.98% (YTD). For details, investors are advised to read the Note 5 of the latest financial statements of the scheme.
Fund TypeCategoryLaunch DateNet AssetsNAV per Unit TrusteeAuditorBenchmark
Dealing DaysCut off timePricing MechanismManagement Fee
AMC RatingFund Stability RatingFront-end LoadMin.SubscriptionFund ManagerListingLeverageRisk ProfileShariah Advisor
Open-endIslamic Income SchemeMay 29th 2014PKR 457 millionPKR 100.8815CDCBDO Ebrahim & Co.
Monday-Friday4:00 pm (Mon to Fri)Forward
AM2-(JCR-VIS) 13/02/2015A(f) (JCR-VIS) 22/12/2014Class B: 0% to 1.50%PKR 5,000Tauqir ShamshadISENilLow
Weighted Average Maturity 144 Days
Asset Allocation
Cash
Jul’15
73
17
0
9
1
100
Jun’15
65
22
0
11
2
100
GoP Ijarah Sukuks
Placement with Banks and DFI’s
Corporate Sukuks
Others
Total
(% of Total Assets)
To provide competitive risk adjusted returns to its investors by investing in a diversified portfolio of long, medium and short term Shariah compliant debt instruments while taking in to account liquidity considerations.
Avg. of 6M profit rate of 3 Islamic Banks or Islamic Windows of Conventional Banks rated A and above
10% of gross Earnings subject to minimum fee of 0.50% and Maximum fee of 1.50% of average daily net assets***
Fortune Islamic Ser-vice
KEY RATES (%) Jul’15
KIBOR ( 1M)*
KIBOR ( 3M)
KIBOR ( 6M)
Latest T-bills Cut-off (3M)
Latest T-bills Cut-off (6M)
Latest T-bills Cut-off (12M)
PIB Cut-Off (3Yr)
PIB Cut-Off (5Yr)
PIB Cut-Off (10Yr)
CPI Inflation
Discount Rate
6.43
6.74
6.79
6.93
6.95
6.96
8.09
8.99
9.25
1.80
7.00
7.06
Mar-15Monthly Fund Perfomance Annualized (%)
8.20
6.61
Apr-15
7.07
6.40
May-15
6.00
6.38
Jun-15
11.53
5.33
Jul-15
5.79
5.37
Risk Disclaimer: “This publication is for informational purposes only and nothing herein should be construed as a solicitation, recommendation or an offer to buy or sell any fund. All investments in mutual funds are subject to market risks. Past performance is not necessarily indicative of future results. Please read the Offering Document to understand the investment policies and risks involved.
AA-, 71%
A+,11%
Govt. Securities17%
Others, 1%
Suleman Chhagla, Chief Executive Officer
Syed Ali Zafar Mehdi, Chief Investment Officer
Tauqir Shamshad, Head of Fixed Income
July 2015
FUND MANAGER COMMENTS
Mutual Fund Association of Pakistan (MUFAP) Recommended Format
PICIC STOCK FUND (PICIC-SF)
INVESTMENT OBJECTIVE:
NIB Bank Ltd. A wholly owned subsidiary of 05 | FUND MANAGER’S REPORT
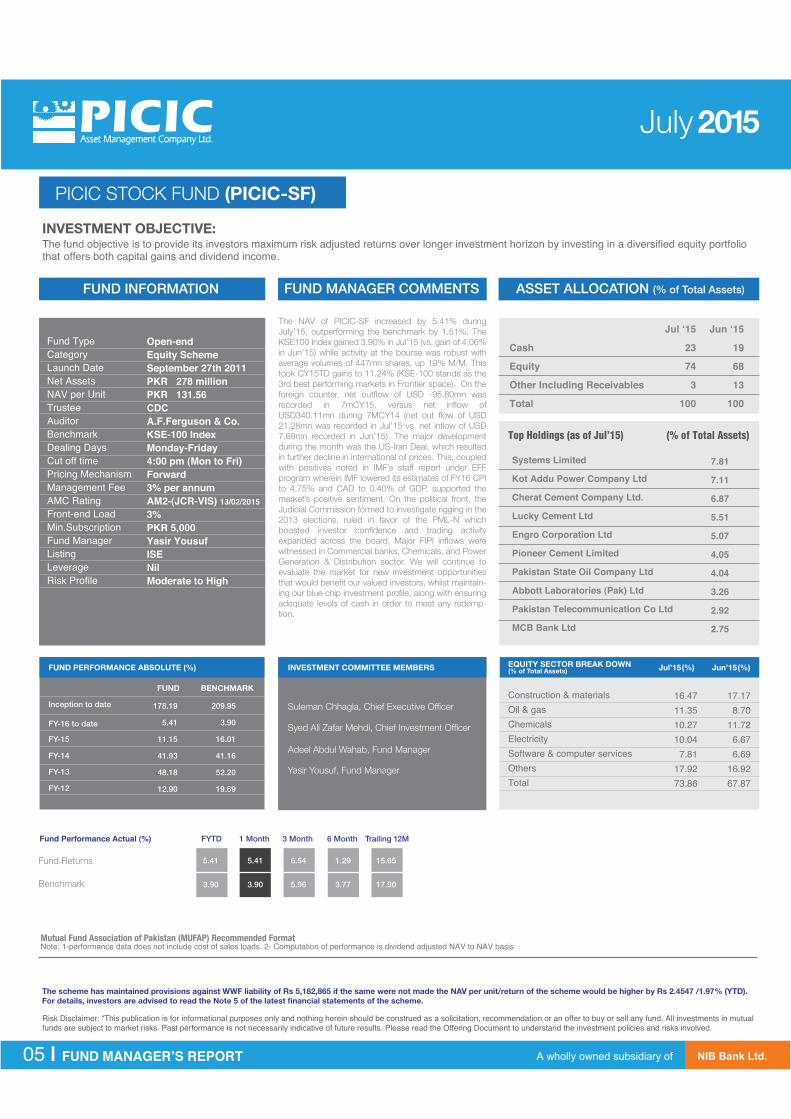
The NAV of PICIC-SF increased by 5.41% during July’15, outperforming the benchmark by 1.51%. The KSE100 Index gained 3.90% in Jul’15 (vs. gain of 4.06% in Jun’15) while activity at the bourse was robust with average volumes of 447mn shares, up 19% M/M. This took CY15TD gains to 11.24% (KSE-100 stands as the 3rd best performing markets in Frontier space). On the foreign counter, net outflow of USD -95.80mn was recorded in 7mCY15, versus net inflow of USD340.11mn during 7MCY14 (net out flow of USD 21.28mn was recorded in Jul’15 vs. net inflow of USD 7.69mn recorded in Jun’15). The major development during the month was the US-Iran Deal, which resulted in further decline in international oil prices. This, coupled with positives noted in IMF’s staff report under EFF program wherein IMF lowered its estimates of FY16 CPI to 4.75% and CAD to 0.40% of GDP, supported the market’s positive sentiment. On the political front, the Judicial Commission formed to investigate rigging in the 2013 elections, ruled in favor of the PML-N which boosted investor confidence and trading activity expanded across the board. Major FIPI inflows were witnessed in Commercial banks, Chemicals, and Power Generation & Distribution sector. We will continue to evaluate the market for new investment opportunities that would benefit our valued investors, whilst maintain-ing our blue chip investment profile, along with ensuring adequate levels of cash in order to meet any redemp-tion.
INVESTMENT COMMITTEE MEMBERS EQUITY SECTOR BREAK DOWN(% of Total Assets)FUND PERFORMANCE ABSOLUTE (%)
Inception to date
FY-15
FY-16 to date
FY-14
FY-13
FY-12
FUND BENCHMARK
Fund Performance Actual (%) FYTD 1 Month 3 Month 6 Month Trailing 12M
Fund Returns
Benchmark
The scheme has maintained provisions against WWF liability of Rs 5,182,865 if the same were not made the NAV per unit/return of the scheme would be higher by Rs 2.4547 /1.97% (YTD). For details, investors are advised to read the Note 5 of the latest financial statements of the scheme.
FUND INFORMATION ASSET ALLOCATION (% of Total Assets)
Fund TypeCategoryLaunch DateNet AssetsNAV per UnitTrusteeAuditorBenchmarkDealing DaysCut off timePricing MechanismManagement FeeAMC RatingFront-end LoadMin.SubscriptionFund ManagerListingLeverageRisk Profile
Cash
Equity
Other Including Receivables
Total
Jul ‘15
23
74
3
100
Jun ‘15
19
68
13
100
Open-endEquity SchemeSeptember 27th 2011PKR 278 millionPKR 131.56 CDCA.F.Ferguson & Co.KSE-100 IndexMonday-Friday4:00 pm (Mon to Fri)Forward3% per annumAM2-(JCR-VIS) 13/02/20153%PKR 5,000Yasir YousufISENilModerate to High
The fund objective is to provide its investors maximum risk adjusted returns over longer investment horizon by investing in a diversified equity portfolio offers both capital gains and dividend income.
Top Holdings (as of Jul’15) (% of Total Assets)
Note: 1-performance data does not include cost of sales loads. 2- Computation of performance is dividend adjusted NAV to NAV basis
Construction & materialsOil & gasChemicalsElectricitySoftware & computer servicesOthersTotal
178.19
5.41
11.15
41.93
48.18
12.90
209.95
3.90
16.01
41.16
52.20
19.69
16.47 11.35 10.27 10.04
7.81 17.9273.86
Jul’15(%)
17.17 8.70
11.72 6.67 6.69
16.9267.87
Jun’15(%)
5.41
3.90
5.41
3.90
6.54
5.96
1.29
3.77
15.65
17.90
Systems Limited
Kot Addu Power Company Ltd
Cherat Cement Company Ltd.
Lucky Cement Ltd
Engro Corporation Ltd
Pioneer Cement Limited
Pakistan State Oil Company Ltd
Abbott Laboratories (Pak) Ltd
Pakistan Telecommunication Co Ltd
MCB Bank Ltd
7.81
7.11
6.87
5.51
5.07
4.05
4.04
3.26
2.92
2.75
that
Risk Disclaimer: “This publication is for informational purposes only and nothing herein should be construed as a solicitation, recommendation or an offer to buy or sell any fund. All investments in mutual funds are subject to market risks. Past performance is not necessarily indicative of future results. Please read the Offering Document to understand the investment policies and risks involved.
Suleman Chhagla, Chief Executive Officer
Adeel Abdul Wahab, Fund Manager
Yasir Yousuf, Fund Manager
Syed Ali Zafar Mehdi, Chief Investment Officer
July 2015
FUND MANAGER COMMENTS
Mutual Fund Association of Pakistan (MUFAP) Recommended Format
Fund Returns
Benchmark
PICIC ISLAMIC STOCK FUND (PICIC-ISF)
INVESTMENT OBJECTIVE:
FUND INFORMATION
NIB Bank Ltd. A wholly owned subsidiary of 06 | FUND MANAGER’S REPORT
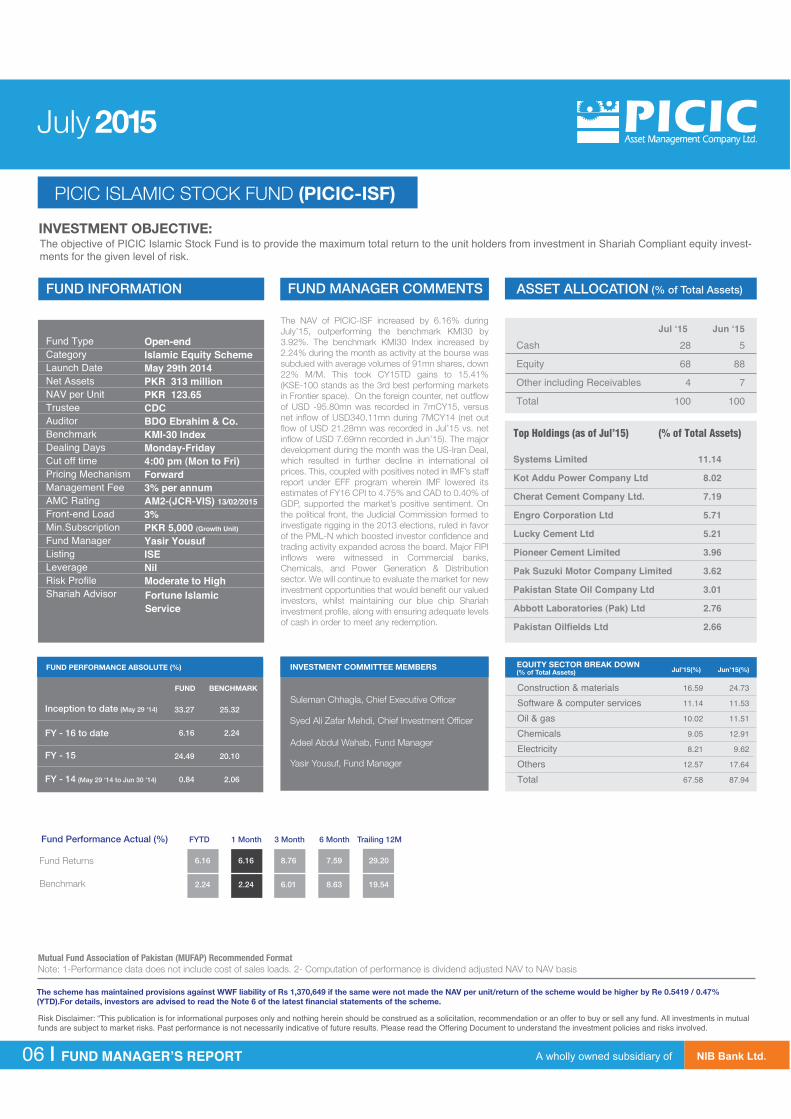
The NAV of PICIC-ISF increased by 6.16% during July’15, outperforming the benchmark KMI30 by 3.92%. The benchmark KMI30 Index increased by 2.24% during the month as activity at the bourse was subdued with average volumes of 91mn shares, down 22% M/M. This took CY15TD gains to 15.41% (KSE-100 stands as the 3rd best performing markets in Frontier space). On the foreign counter, net outflow of USD -95.80mn was recorded in 7mCY15, versus net inflow of USD340.11mn during 7MCY14 (net out flow of USD 21.28mn was recorded in Jul’15 vs. net inflow of USD 7.69mn recorded in Jun’15). The major development during the month was the US-Iran Deal, which resulted in further decline in international oil prices. This, coupled with positives noted in IMF’s staff report under EFF program wherein IMF lowered its estimates of FY16 CPI to 4.75% and CAD to 0.40% of GDP, supported the market’s positive sentiment. On the political front, the Judicial Commission formed to investigate rigging in the 2013 elections, ruled in favor of the PML-N which boosted investor confidence and trading activity expanded across the board. Major FIPI inflows were witnessed in Commercial banks, Chemicals, and Power Generation & Distribution sector. We will continue to evaluate the market for new investment opportunities that would benefit our valued investors, whilst maintaining our blue chip Shariah investment profile, along with ensuring adequate levels of cash in order to meet any redemption.
ASSET ALLOCATION (% of Total Assets)
FUND PERFORMANCE ABSOLUTE (%)
Inception to date (May 29 ‘14)
FY - 16 to date
FY - 15
FY - 14 (May 29 ‘14 to Jun 30 ’14)
FUND BENCHMARK
INVESTMENT COMMITTEE MEMBERS EQUITY SECTOR BREAK DOWN
Fund Performance Actual (%) FYTD 1 Month 3 Month 6 Month
Note: 1-Performance data does not include cost of sales loads. 2- Computation of performance is dividend adjusted NAV to NAV basis
The scheme has maintained provisions against WWF liability of Rs 1,370,649 if the same were not made the NAV per unit/return of the scheme would be higher by Re 0.5419 / 0.47% (YTD).For details, investors are advised to read the Note 6 of the latest financial statements of the scheme.
Fund TypeCategoryLaunch DateNet AssetsNAV per Unit TrusteeAuditorBenchmarkDealing DaysCut off timePricing MechanismManagement FeeAMC RatingFront-end LoadMin.SubscriptionFund ManagerListingLeverageRisk ProfileShariah Advisor
Cash
Equity
Other including Receivables
Total
Jul ‘1528
68
4
100
Jun ‘155
88
7
100
Open-endIslamic Equity SchemeMay 29th 2014PKR 313 millionPKR 123.65 CDCBDO Ebrahim & Co.KMI-30 IndexMonday-Friday4:00 pm (Mon to Fri)Forward3% per annumAM2-(JCR-VIS) 13/02/20153%PKR 5,000 (Growth Unit)
Yasir YousufISE NilModerate to High
Top Holdings (as of Jul’15) (% of Total Assets)
Systems Limited
Kot Addu Power Company Ltd
Cherat Cement Company Ltd.
Engro Corporation Ltd
Lucky Cement Ltd
Pioneer Cement Limited
Pak Suzuki Motor Company Limited
Pakistan State Oil Company Ltd
Abbott Laboratories (Pak) Ltd
Pakistan Oilfields Ltd
11.14
8.02
7.19
5.71
5.21
3.96
3.62
3.01
2.76
2.66
Fortune Islamic Service
The objective of PICIC Islamic Stock Fund is to provide the maximum total return to the unit holders from investment in Shariah Compliant equity invest- ments for the given level of risk.
Jul’15(%)
16.59
11.14
10.02
9.05
8.21
12.57
67.58
Jun’15(%)
24.73
11.53
11.51
12.91
9.62
17.64
87.94
33.27
6.16
24.49
0.84
25.32
2.24
20.10
2.06
Construction & materialsSoftware & computer servicesOil & gasChemicalsElectricityOthersTotal
6.16
2.24
6.16
2.24
8.76
6.01
7.59
8.63
Trailing 12M
29.20
19.54
Risk Disclaimer: “This publication is for informational purposes only and nothing herein should be construed as a solicitation, recommendation or an offer to buy or sell any fund. All investments in mutual funds are subject to market risks. Past performance is not necessarily indicative of future results. Please read the Offering Document to understand the investment policies and risks involved.
(% of Total Assets)
Suleman Chhagla, Chief Executive Officer
Adeel Abdul Wahab, Fund Manager
Yasir Yousuf, Fund Manager
Syed Ali Zafar Mehdi, Chief Investment Officer
July 2015
FUND MANAGER COMMENTS
Mutual Fund Association of Pakistan (MUFAP) Recommended Format

Fund Returns
Benchmark
PICIC ENERGY FUND (PEF)
INVESTMENT OBJECTIVE:
NIB Bank Ltd. A wholly owned subsidiary of 07 | FUND MANAGER’S REPORT
The NAV of PEF increased by 0.91% during July’15, underperforming the benchmark by 2.99%, as a result of overall laggard performance of the Energy sector. We will continue to recalibrate our energy composite portfolio to maximize returns, whilst ensuring adequate levels of cash in order to meet the redemption requests of our valued investors.
INVESTMENT COMMITTEE MEMBERS EQUITY SECTOR BREAK DOWNFUND PERFORMANCE ABSOLUTE (%)
Inception to date*
* Date of Conversion- Jun 25 ‘13
Oil & GasGas, Water & Multi-utilities
Electricity
OthersTotal
59.67 35.23
--
94.89
Jul’15(%)
57.37 35.90
--
93.27
Jun’15(%)
FY-16 to date
FY-15
FY-14
FY-13
FUND
36.02
0.91
8.18
23.92
0.55
69.31
3.90
16.01
41.16
-0.5
BENCHMARK
Fund Performance Actual (%) FYTD
0.91
3.90
0.91
3.90
-0.81
5.96
7.09
3.77
6.44
17.90
1 Month 3 Month 6 Month Trailing 12M
The scheme has maintained provisions against WWF liability of Rs 28,278,477 if the same were not made the NAV per unit/return of the scheme would be higher by Re 0.3355 / 2.71% (YTD). For details, investors are advised to read the Note 6 of the latest financial statements of the scheme.
FUND INFORMATION ASSET ALLOCATION (% of Total Assets)
Fund TypeCategoryLaunch Date (Closed Ended)
Conversion Date (Open Ended)
Net AssetsNAV per UnitTrusteeAuditorBenchmarkDealing DaysCut off timePricing MechanismManagement FeeAMC Rating
Front-end LoadMin.SubscriptionFund ManagerListingLeverageRisk Profile
Cash
Equity
Other Including Receivables
Total
Jul ‘15
5
95
0
100
Jun ‘15
5
93
2
100
Open-endEquity SchemeJanuary 2006June 25, 2013PKR 1,052 millionPKR 12.48 CDCA.F.Ferguson & Co.KSE-100 IndexMonday-Friday4:00 pm (Mon to Fri)Forward2% per annumAM2-(JCR-VIS) 13/02/2015
3%PKR 5,000Adeel Abdul WahabISENilModerate to High
Top Holdings (as of Jul’15) (% of Total Assets)
19.84*
15.22
13.38
13.03
11.22
9.35
5.56
4.67
1.85
0.77
Note: 1-performance data does not include cost of sales loads. 2- Computation of performance is dividend adjusted NAV to NAV basis
*0.01
The fund objective is to invest in securities defined in the energy sector to provide investors access to high quality blue chip stocks in the Energy sector.
Kot Addu Power Company Ltd
Lalpir Power Limited
Nishat Chunian Power Ltd
Attock Petroleum Ltd
Nishat Power Limited
Shell Pakistan Ltd
Pakistan Oilfields Ltd
Pakistan Petroleum Ltd
Pakistan State Oil Company Ltd
Oil & Gas Development Co Ltd
Risk Disclaimer: “This publication is for informational purposes only and nothing herein should be construed as a solicitation, recommendation or an offer to buy or sell any fund. All investments in mutual funds are subject to market risks. Past performance is not necessarily indicative of future results. Please read the Offering Document to understand the investment policies and risks involved.
(% of Total Assets)
*20.83% of net assets
Suleman Chhagla, Chief Executive Officer
Adeel Abdul Wahab, Fund Manager
Syed Ali Zafar Mehdi, Chief Investment Officer
July 2015
FUND MANAGER COMMENTS
Mutual Fund Association of Pakistan (MUFAP) Recommended Format
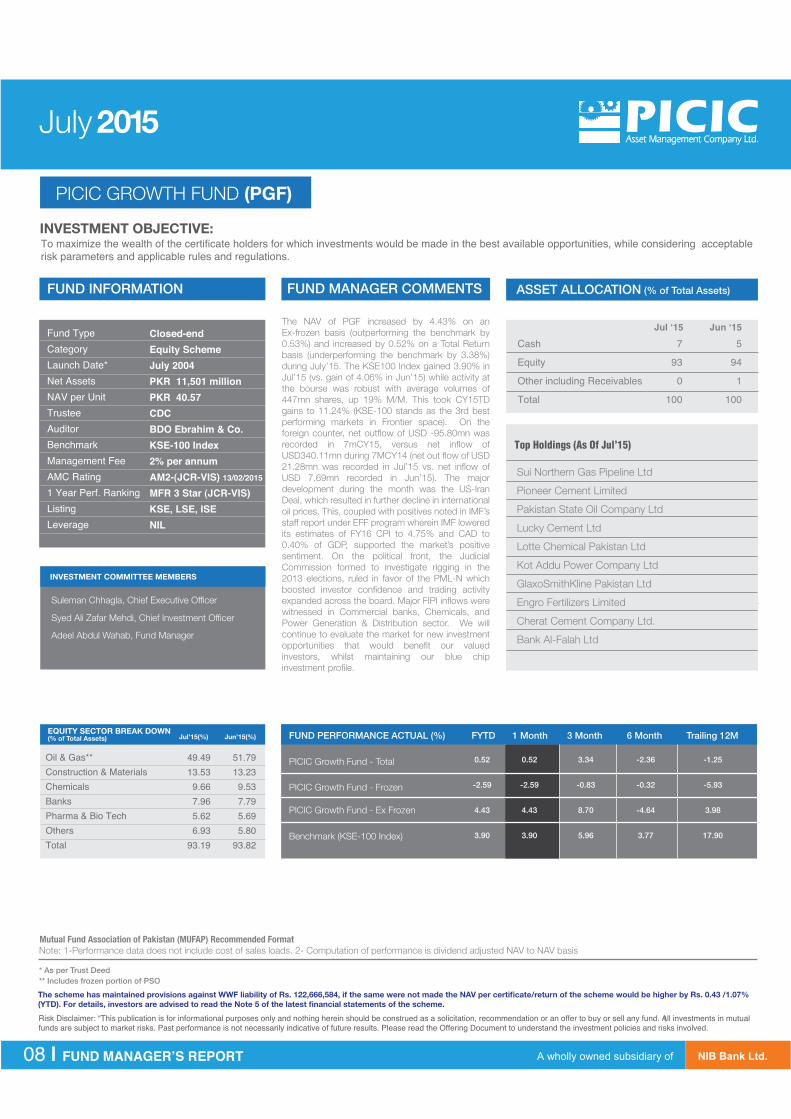
PICIC GROWTH FUND (PGF)
INVESTMENT OBJECTIVE:
FUND INFORMATION
NIB Bank Ltd. A wholly owned subsidiary of 08 | FUND MANAGER’S REPORT
The NAV of PGF increased by 4.43% on an Ex-frozen basis (outperforming the benchmark by 0.53%) and increased by 0.52% on a Total Return basis (underperforming the benchmark by 3.38%) during July’15. The KSE100 Index gained 3.90% in Jul’15 (vs. gain of 4.06% in Jun’15) while activity at the bourse was robust with average volumes of 447mn shares, up 19% M/M. This took CY15TD gains to 11.24% (KSE-100 stands as the 3rd best performing markets in Frontier space). On the foreign counter, net outflow of USD -95.80mn was recorded in 7mCY15, versus net inflow of USD340.11mn during 7MCY14 (net out flow of USD 21.28mn was recorded in Jul’15 vs. net inflow of USD 7.69mn recorded in Jun’15). The major development during the month was the US-Iran Deal, which resulted in further decline in international oil prices. This, coupled with positives noted in IMF’s staff report under EFF program wherein IMF lowered its estimates of FY16 CPI to 4.75% and CAD to 0.40% of GDP, supported the market’s positive sentiment. On the political front, the Judicial Commission formed to investigate rigging in the 2013 elections, ruled in favor of the PML-N which boosted investor confidence and trading activity expanded across the board. Major FIPI inflows were witnessed in Commercial banks, Chemicals, and Power Generation & Distribution sector. We will continue to evaluate the market for new investment opportunities that would benefit our valued investors, whilst maintaining our blue chip investment profile.
INVESTMENT COMMITTEE MEMBERS
EQUITY SECTOR BREAK DOWN(% of Total Assets) FUND PERFORMANCE ACTUAL (%) FYTD 1 Month 3 Month 6 Month Trailing 12M
PICIC Growth Fund - Total
PICIC Growth Fund - Frozen
PICIC Growth Fund - Ex Frozen
Benchmark (KSE-100 Index)
Note: 1-Performance data does not include cost of sales loads. 2- Computation of performance is dividend adjusted NAV to NAV basis
* As per Trust Deed** Includes frozen portion of PSO
The scheme has maintained provisions against WWF liability of Rs. 122,666,584, if the same were not made the NAV per certificate/return of the scheme would be higher by Rs. 0.43 /1.07% (YTD). For details, investors are advised to read the Note 5 of the latest financial statements of the scheme.
t
Fund TypeCategoryLaunch Date*Net AssetsNAV per Unit TrusteeAuditorBenchmarkManagement FeeAMC Rating1 Year Perf. RankingListingLeverage
ASSET ALLOCATION (% of Total Assets)
Cash
Equity
Other including Receivables
Total
Jul ‘157
93
0
100
Jun ‘155
94
1
100
Closed-endEquity Scheme July 2004PKR 11,501 millionPKR 40.57CDCBDO Ebrahim & Co.KSE-100 Index2% per annumAM2-(JCR-VIS) 13/02/2015
MFR 3 Star (JCR-VIS)KSE, LSE, ISENIL
Top Holdings (As Of Jul’15)
To maximize the wealth of the certificate holders for which investments would be made in the best available opportunities, while considering acceptable risk parameters and applicable rules and regulations.
Oil & Gas**Construction & MaterialsChemicalsBanksPharma & Bio TechOthersTotal
Jul’15(%)
49.49 13.53 9.66 7.96 5.62 6.9393.19
Jun’15(%)
51.79 13.23 9.53 7.79 5.695.80
93.82
Sui Northern Gas Pipeline Ltd
Pioneer Cement Limited
Pakistan State Oil Company Ltd
Lucky Cement Ltd
Lotte Chemical Pakistan Ltd
Kot Addu Power Company Ltd
GlaxoSmithKline Pakistan Ltd
Engro Fertilizers Limited
Cherat Cement Company Ltd.
Bank Al-Falah Ltd
0.52
-2.59
4.43
3.90
3.34
-0.83
8.70
5.96
-2.36
-0.32
-4.64
3.77
-1.25
-5.93
3.98
17.90
Risk Disclaimer: “This publication is for informational purposes only and nothing herein should be construed as a solicitation, recommendation or an offer to buy or sell any fund. All investments in mutual funds are subject to market risks. Past performance is not necessarily indicative of future results. Please read the Offering Document to understand the investment policies and risks involved.
0.52
-2.59
4.43
3.90
Suleman Chhagla, Chief Executive Officer
Syed Ali Zafar Mehdi, Chief Investment Officer
Adeel Abdul Wahab, Fund Manager
July 2015
FUND MANAGER COMMENTS
Mutual Fund Association of Pakistan (MUFAP) Recommended Format

* As per Trust Deed** Includes frozen portion of PSO
PICIC INVESTMENT FUND (PIF)
INVESTMENT OBJECTIVE:
FUND INFORMATION
NIB Bank Ltd. A wholly owned subsidiary of 09 | FUND MANAGER’S REPORT
The NAV of PIF increased by 4.20% on an Ex-frozen basis (outperforming the benchmark by 0.30%) and increased by 0.85% on a Total Return basis (underper-forming the benchmark by 3.05%) during July’15. The KSE100 Index gained 3.90% in Jul’15 (vs. gain of 4.06% in Jun’15) while activity at the bourse was robust with average volumes of 447mn shares, up 19% M/M. This took CY15TD gains to 11.24% (KSE-100 stands as the 3rd best performing markets in Frontier space). On the foreign counter, net outflow of USD -95.80mn was recorded in 7mCY15, versus net inflow of USD340.11mn during 7MCY14 (net out flow of USD 21.28mn was recorded in Jul’15 vs. net inflow of USD 7.69mn recorded in Jun’15). The major development during the month was the US-Iran Deal, which resulted in further decline in international oil prices. This, coupled with positives noted in IMF’s staff report under EFF program wherein IMF lowered its estimates of FY16 CPI to 4.75% and CAD to 0.40% of GDP, supported the market’s positive sentiment. On the political front, the Judicial Commission formed to investigate rigging in the 2013 elections, ruled in favor of the PML-N which boosted investor confidence and trading activity expanded across the board. Major FIPI inflows were witnessed in Commercial banks, Chemicals, and Power Generation & Distribution sector. We will continue to evaluate the market for new investment opportunities that would benefit our valued investors, whilst maintaining our blue chip investment profile. We will continue to evaluate the market for new investment opportunities that would benefit our valued investors, whilst maintaining our blue chip investment profile.
INVESTMENT COMMITTEE MEMBERS
EQUITY SECTOR BREAK DOWN FUND PERFORMANCE ACTUAL (%)
PICIC Investment Fund - Total
PICIC Investment Fund - Frozen
PICIC Investment Fund - Ex-Frozen
Benchmark (KSE-100 Index)
Note: 1-Performance data does not include cost of sales loads. 2- Computation of performance is dividend adjusted NAV to NAV basis
The scheme has maintained provisions against WWF liability of Rs. 62,680,766, if the same were not made the NAV per certificate/return of the scheme would be higher by Rs. 0.22 /1.24% (YTD). For details, investors are advised to read the Note 6 of the latest financial statements of the scheme.
Fund TypeCategoryLaunch Date*Net Assets NAV per Unit TrusteeAuditorBenchmarkManagement FeeAMC Rating1 Year Perf. RankingListingLeverage
ASSET ALLOCATION (% of Total Assets)
Cash
Equity
Other including Receivables
Total
Jul ‘159
91
0
100
Jun ‘157
92
1
100
Closed-endEquity SchemeApril 2004PKR 5,086 millionPKR 17.90 CDCBDO Ebrahim & Co.KSE-100 Index2% per annumAM2-(JCR-VIS) 13/02/2015
MFR 3 Star (JCR-VIS)KSE, LSE, ISENIL
Top Holdings (As Of Jul’15)
Jul’15(%)
To maximize the wealth of the certificate holders for which investments would be made in the best available opportunities, while considering acceptable risk parameters and applicable rules and regulations.
41.55 16.09 11.72 8.09 7.05 6.8291.32
Jun’15(%)
43.61 15.79 11.58 8.04 7.315.91
92.25
Wyeth Pakistan Ltd
Pioneer Cement Limited
Pakistan State Oil Company Ltd
Lucky Cement Ltd
Kot Addu Power Company Ltd
GlaxoSmithKline Pakistan Ltd
Engro Fertilizers Limited
Cherat Cement Company Ltd.
Bank Al-Falah Ltd
Abbott Laboratories (Pak) Ltd
Oil & gas**Construction & materialsChemicalsBanksPharma & bio techOthersTotal
Risk Disclaimer: “This publication is for informational purposes only and nothing herein should be construed as a solicitation, recommendation or an offer to buy or sell any fund. All investments in mutual funds are subject to market risks. Past performance is not necessarily indicative of future results. Please read the Offering Document to understand the investment policies and risks involved.
0.85
-3.00
4.20
3.90
0.85
-3.00
4.20
3.90
3.83
-1.41
8.51
5.96
-3.03
-0.62
-4.91
3.77
-0.83
-6.57
3.70
17.90
FYTD 1 Month 3 Month 6 Month Trailing 12M
Suleman Chhagla, Chief Executive Officer
Adeel Abdul Wahab, Fund Manager
Syed Ali Zafar Mehdi, Chief Investment Officer
July 2015
FUND MANAGER COMMENTS
Mutual Fund Association of Pakistan (MUFAP) Recommended Format

SINCE INCEPTION RETURNS
NIB Bank Ltd. A wholly owned subsidiary of 10 | FUND MANAGER’S REPORT
Note: 1-Performance data does not include cost of sales loads. 2- Computation of performance is dividend adjusted NAV to NAV basis
PICIC Stock Fund
Benchmark (KSE-100 Index)
PICIC Energy Fund
Benchmark (KSE-100) Index
PICIC Islamic Stock Fund
Benchmark (KMI-30 Index)
137.44
157.15
24.60
40.46
0.84
2.06
11.15
16.01
8.18
16.01
24.49
20.10
67.29
82.16
0.55
-0.50
12.90
19.69
PICIC Cash Fund
Ave. of 3M Bank Deposit (AA Rated)
PICIC Income Fund
Ave. 6M KIBOR
PICIC Islamic Income Fund
Benchmark
11.31
8.34
12.14
11.14
8.95
6.49
10.51
6.83
11.75
8.74
9.07
6.58
5.41
3.90
0.91
3.90
6.16
2.24
6.39
5.03
8.17
6.79
5.79
5.37
11.50
8.80
12.21
11.67
12.00
9.57
12.41
12.66
FUND PERFORMANCE ACTUAL%
FUND PERFORMANCE ANNUALIZED%
30 Jun ‘ 14 30 Jun ‘ 13 30 Jun ‘ 12
HISTORICAL RETURNS
30 Jun ‘1530 Jul ‘15

NIB Bank Ltd. A wholly owned subsidiary of
Sr # Designated Branch City Address Phone Contact Person
1
2
3
4
5
6
7
8
9
10
11
12
13
14
15
16
17
18
19
20
21
22
23
24
25
26
27
28
29
30
31
32
33
34
35
36
37
38
39
40
41
42
43
44
45
46
47
48
49
50
51
52
53
NIB -DHA Phase IV
NIB -DHA Phase II
NIB -Kulsoom Court
NIB -Zamzama
NIB -North Nazimabad
NIB -Khyaban e Shahbaz
NIB -University Road
NIB -Gulshan-e-Iqbal
NIB -DHA 26th Street
NIB -Saba Avenue
NIB -Business Arcade, Shahra-e-Faisal
NIB -Defence Phase I
NIB -Gul Tower
NIB -Hyderi Karachi
NIB -Zaibunnisa Street Saddar
NIB -Malir Colony, Liaquat Market
NIB -Stadium Road
NIB -DHA Phase II
NIB -Jouhar Town E Block
NIB -Bharia Town
NIB -Gulberg Main Boulevard
NIB -Z Block DHA Phase III
NIB -Model Town
NIB -Davis Road
NIB -Model Town Link Rd
NIB -6-Bank Square
NIB -Gulberg III
NIB -Gulberg III A�uent
NIB -House
NIB -New Garden Town
NIB -F-8 Markaz
NIB - Post Mall
NIB -I -8
NIB -PWD Employee C.H.S
NIB -F-10
NIB -F-11 Markaz
NIB -I -10 Markaz
NIB -Razia Sharif
NIB -Murree Road Saddar
NIB -Mall Road Branch, Rawalpindi
NIB -Adyala Road
NIB -Regency Arcade
NIB - Karkhana Bazar Branch
NIB -Liaquat Road
NIB -Millat Road
NIB -Hayatabad
NIB -Abdali Road
NIB -Main
NIB -Okara Branch
NIB -Mandi Bahauddin Branch
NIB -Habib Center
NIB -Jhelum City Branch
NIB -Shahabpura Sialkot
Karachi
Karachi
Karachi
Karachi
Karachi
Karachi
Karachi
Karachi
Karachi
Karachi
Karachi
Karachi
Karachi
Karachi
Karachi
Karachi
Karachi
Lahore
Lahore
Lahore
Lahore
Lahore
Lahore
Lahore
Lahore
Lahore
Lahore
Lahore
Lahore
Lahore
Islamabad
Islamabad
Islamabad
Islamabad
Islamabad
Islamabad
Islamabad
Islamabad
Rawalpindi
Rawalpindi
Rawalpindi
Faisalabad
Faisalabad
Faisalabad
Faisalabad
Peshawar
Multan
Hyderabad
Okara
Mandi Bahauddin
Gujranwala
Jhelum
Sialkot
99E, 9th Commercial Street Phase IV, DHA Karachi.
Plot No 106-C DHA Phase II, National Highway Near Tooba Apartments, Karachi
NIB Bank, Kulsoom Court, Near Della Wala, Building, Clifton, Karachi
Zamzama Branch, 18-C, 5th Zamzama Lane, Phase 5, DHA Karachi
SD -12, Bl - 'A'- North Nazimabad, Karachi
Shop No.2,3,4 C -23, Kh e Saher, Phase-VII, DHA, Karachi
Plot No. SB -4 Block 13 -B University Road, Gulshan -e-Iqbal, Karachi
Plot # FL -2/3 block 6, Improvement scheme No. 24, Gulshan-e-Iqbal, Karachi
NIB Bank, 42 C, Sun Centre,26th Street, Tuheed Commercial Area, DHA Phase V, Karachi
Saba Avenue Branch, 8-C Badar Commercial Street # 06, Phase-V Ext DHA, Karachi
Business Arcade, Block 6, PECHS, Shahra -e-Faisal, Karachi
19-C & 21 -C, East Street, Main korangi Road, DHA Phase - I, Karachi
Gul Tower, I.I Chundrigar Road, Karachi
D-14, Block -H, North Nazimabad, Karachi.
State Life Building # 5, Zaibunnisa Street, Saddar, Karachi
Plot No. G -107/10, Liaquat Market, Malir Colony,Karachi
Shop # 2 & 3, G.F, Plot # SC -45, Chandni Chowk, KDA Sch # 7, Stadium Road, Karachi
2/1 Block B Guldasht Town Zarar Shaheed Road, Lahore Cantt
Plot # 1, Block E 1, Johar Town, Lahore
Bharia Town Branch, Commercial Area, Alfalah Plaza, Sector B, Bahria Town Lahore
Old Sanda Road, Sardar Chapal Chock, Bilal Gunj, Lahore
NIB Bank, 38 Z, Commercial Area, Phase III, DHA Lahore
Shop No. 10-11 Model Town C Block Commercial Market, Lahore
Aftab Centre, 30 Davis Road, Lahore
Plot # 34-B, phase IIII Govt Employees C.H.S, Model Town Link Road, Lahore
6-Bank Square, Shahrah Quaid Azam, Lahore.
83-E -I, Main Boulovard, Gulberg III, Lahore
NIB Bank, 70 E 1, Hali Road, Gulberg III, Lahore
NIB House, Old Race Course branch, Aiwan E Tijarat Raod, China Chowk, Lahore
10-A Block, New Garden Town, Lahore
12 & 13, Al -Babar Center, F-8 Markaz, Islamabad
NIB Bank, Post Mall Branch, F 7, Markaz Islamabad
I -8 Markaz MB City Mall Palaza, Islamabad
40B PWD Housing Society, Islamabad highway, Islamabad
NIB Bank Ltd, Unit # 1 -R, Block 3,4&5, Main Double Road, F-10 Markaz Islamabad
18-Trade Center Main Double Road, F-11 Markaz Islamabad
Plot # 3-A, I -10 Markaz, Islamabad
NIB Bank, Razia Sharif Branch, Blue Area Islamabad
Building No.111/10 Muree Road, Saddar Rawalpindi
31/3-31/A, The Mall Rawalpindi.
Khasra# 1365/572, Skindar Plaza, Munawar Colony Main Adyala Road, Rawalpindi
The Mall, Regency Shopping Arcade, Faisalabad
Property #122, Khatooni # 1650, Khewat # 1647, Faisalabad
Plot No. 3, Liaquat Road, Faisalabad
Commercial Center # 02 Gulistan Colony Millat Road, Faislabad
B -1 Phase 5, Hayatabad, Peshawar.
Plot # 66/9, Abdali Road, Multan
Plot # 53 & 54, Cantt Saddar, Hyderabad
Khewat # 50-18, Chak # 1 -A/4-C, M.A. Jinnah Road
Plot # 7/211, Ward # 7, Mandi Bahauddin
Al Hameed Center Branch, Opposite Iqbal High School, G.T. Road, Gujranwala
B -V -112, Resham Plaza, Civil Lines, Jhelum
Plot # B -III -8-S-206, Shahabpura, Sialkot
0213-5885718
0213-5314083
0213-5837011
0213-5295210
0213-6673597
0213-5348772
0213-4980430
0213-4986186
0213-5304163
0213-5341672
0213-4524667
0213-5386881
0213-5277220
021-36643411
0213-5212102
0213-4117601
0213-4932266
0423-6639771
0423-5220637
0423-5341656
0423-7220005
0423-5748865
0423-5915406
0423-6286965
0423-5888303
0423-7246257
0423-5756850
0423-5756993
042-99203194
0423-5843886
051-2852653
051-2653581
051-4862271
051-5957660
051-2215856
051-2107862
051-2852653
051-2826553
051-5562944
051-5701200
051-5948126
041-2604875
041-2601808
041-2604931
041-8849935
091-5825278
061-4517126
022-2787462
0442-550902
0546-509551
055-9200236
0544-627286
052-3559682
Farrukh Ghani Soomro
Gazanfar Ali
Jalal Jamil
Faiz Ijaz
Junaid Mitha
Moazzam
Muhammad Umair Khan
Salman Aslam
Omar Abdullah
Yousuf Muhammad Farooqi
Mudassir Ahmed
Ahmed Alvi
Fasih Uddin
Moamer Habib
Mansoor
Majid Warsi
Syed Iqbal Rasheed
Ali Agha
Asad Sheikh
Asjad Mir
Babar Ali Peerzada
Fahad Kardar
Majid Bashir
Mirza Ali Yar Baig
Noroz Nabi
Saleem Mukhtar
Raiz Azhar Sheikh
Muhammad Ameen
Muhammad Waqas Ijaz
Mansoor Akram
Aamir Rashid Chaudhry
Asim Ikram
Muhammad Ebraheem
M.Nauman-Ul-Haq Khawaja
Shiraz Khan Afridi
Syed Usman Ali Shah
Afzaal Mehmood
Shaheed Ahmed
Faqir Sheryar
Junaid Waheed
Syed Dabeer Ali Hamdani
Aqeel Ahmed
Muddassar Sohail
Syed Mazfoor Mohsin Gillani
Dilbar Hassan Ch
Muhammad Ali Khan
Basharat Ali Siddiqui
Taneer Hussain kazi
Ch M Aslam
Khawar Nazir
Muhammad Kashif Ahmed
Awais Khurram
Rajesh Kumar
Head Office: 3rd Floor, PNSC Building, M.T. Khan Road, Karachi UAN: +92 21 1111 PICIC (74242) | Fax: +92 21 35642770 - 71 | Toll Free: 0800-PICIC(74242)Email: [email protected] | Web: www.picicamc.com