nirvana’s advanced cycletrader 2
TRANSCRIPT

ADVANCED
CYCLETrader 2.0CYCLETrader2.0Nirvana’s
Detect the Personality of the Market Visualize the Market Waves Profit with Cycle Signals
FIND THE PROFIT CYCLES IN ANY MARKET!

For decades traders have looked to identify cycles in the !nancial markets. "ey believe that if they can identify a market cycle and know when we are near a cycle low, they can pro!t from buying at lows and selling at highs. "is has always been di#cult to achieve—until now. Welcome to our latest advancement in market analysis, Advanced CycleTrader 2.0.Nirvana’s Advanced CycleTrader (ACT) is based on a technology called Digital Signal Processing, or DSP. Pioneers such as John Ehlers have applied this technology to the !nancial markets for a number of years. And while DSP has been around for some time, scientists and engineers continue to make signi!cant advances in the technology. With Advanced CycleTrader, Nirvana Labs set out to develop new cutting edge software that uses DSP to process market data and !nd new trading opportunities. "e resulting technology, has exceeded even our most ambitious goals. In the !rst version of ACT, we created new DSPPowered indicators that are used to analyze and trade the markets. We started with the Market Mode Indicator (MMI), which identi!es the personality, or mode, of the market. "is indicator determines when the market is in a cyclical or trending mode, so we can make the most of our cycle analysis.Once we know the mode of the market, we can begin to look for good cycle trades. "e original version of ACT provided several indicators that show you the short and long term cycles. "e Spectrum Indicator shows you the strength and stability of the strongest market cycle, and ACT’s Heatmaps give you a comprehensive view of the market cycles that are currently in play. We took this technology to the next level by creating adaptive Indicators and Systems that adjust to market conditions in order to synch up with the strongest market cycles.
For Advanced CycleTrader 2.0, we expanded our cycle analysis to include powerful new cycle trading tools. "e new “Focused” Indicators and Systems are designed to ignore cycles that are too long or too short to trade, focusing only on the ones that provide the biggest pro!ts. We’ve also included the new OptiSmooth Filter which reduces the lag that is inherent in most other smoothing indicators. All of these oustanding cycle trading tools have been used to develop three powerful Cycle Trading Strategies. "is includes our new ACT 2.0 Focused Opportunities Strategy. You’ll be amazed at how well this strategy predicts buying opportunities, allowing you to capture big pro!ts, trade after trade."e chief Nirvana architect behind ACT was Jeremy Williams, and he created the Pro!t with Cycle Trading seminar in 2012. Jeremy has updated this presentation to include all of the new and exciting tools in ACT 2.0, allowing you to pro!t as quickly as possible trading with ACT.We are always striving to take technical analysis to the next level. With Advanced CycleTrader 2.0, we have created a tool that provides you with a completely new trading method, or it can also be used to enhance your current trading. Of course, ACT comes with our unconditional money back guarantee. Try it today and see why we are convinced that buying low and selling high just got a lot easier!
Sincerely,
Ed DownsCEO and Founder,Nirvana Systems, Inc.
Buying Low and Selling High Just Got a Lot Easier!
Ed DownsCEO and Founder,Nirvana Systems, Inc.

From Dow Theory to Elliot Wave analysis, traders have spent years building trading methods in order to predict the cyclical behavior of markets.
In theory, the approach is simple. When you identify a consistent cycle in the market, you buy at the trough and sell at the peak. "e problem though, is that many times it is di#cult to identify a consistent cycle because it is buried in noise or swamped by a trend.
Introducing Advanced CycleTrader 2.0Advanced CycleTrader’s revolutionary approach to cycle analysis uses the power of modern Digital Signal Processing (DSP) techniques to accurately identify these elusive cycles, and know when to trade them.
"e power of DSP allows CycleTrader to pinpoint cycle highs and lows with amazing precision. You get more responsive indicators and systems that are more accurate and less prone to whipsaws. ACT includes tools that identify the best cycles to trade, and even tells you the strength and stability of these cycles."is technology has been harnessed to create ACT’s Cycle Trading Strategies. Simply switch them on, and turbocharge your trading with the amazing power of DSP. Read more to see how Advanced CycleTrader can help you pro!t from market swings—with ease!
3
Find the Profit Cycles in Any Market!
Advanced CycleTrader (ACT) uses Digital Signal Processing to find and adapt to the strongest market cycles. In this illustration, the RSI Heatmap shows a short term market swing. The red area indicates cycle lows and the green area indicates cycle highs. Our ACT Strategies utilize the same technology to provide excellent reversal trade opportunities.
With ADVANCED CYCLETrader, you will be able to: Detect the Personality of the MarketThe Market Mode Indicator lets you know whether the market is in a bullish trend, a bearish trend, or cyclical trading range, increasing your chances of success regardless of trading style or timeframe.
Visualize the Market Waves Our Heatmaps bring the cycles to life with a revolutionary display that takes the guesswork out of cycle analysis.
Profit with Cycle SignalsCycleTrader Strategies allow you to pinpoint entries and exits with amazing precision.

Digital Signal Processing Breakthrough Reveals Profitable Trading OpportunitiesFor years engineers across hundreds of disciplines have been solving complicated problems in their !elds using the power of Digital Signal Processing (DSP). With modern DSP algorithms, you can easily resolve a valuable signal buried in a sea of noise. And it turns out the same techniques used for signals in other !elds, work for identifying cycles in the market too.
Although you may not realize it, you are probably already using basic DSP in your trading. A moving average is a simple example of a Digital Low Pass Filter. Additionally, most of your standard oscillators are derived from basic high pass or band pass !lters.
"e technology of DSP has advanced leaps and bounds beyond these basic digital !lters. "ese advanced DSP methods form the cornerstone of our Advanced CycleTrader Plug-in, allowing us to apply this technology to the markets—with excellent results!
"e illustration below shows a typical price chart with a cycle overlay. Advanced CycleTrader uses DSP to extract meaningful cycles (signals) from the noise in the price data. "is allows us to determine the market’s current mode, see which timeframe shows the strongest cycle swings, and generate amazing buy and sell signals.
4
Technology Sidebar: How DSP Works
Noisy Data
DSP Extracts Signal from Noise
The prime function of DSP is to extract meaningful signals that are buried in noise. By applying various digital filters, the desired signal can be revealed.
ADVANCING the Science of Cycle Trading
Advanced CycleTrader utilizes Digital Signal Processing in order to extract meaningful cycles from basic price data.
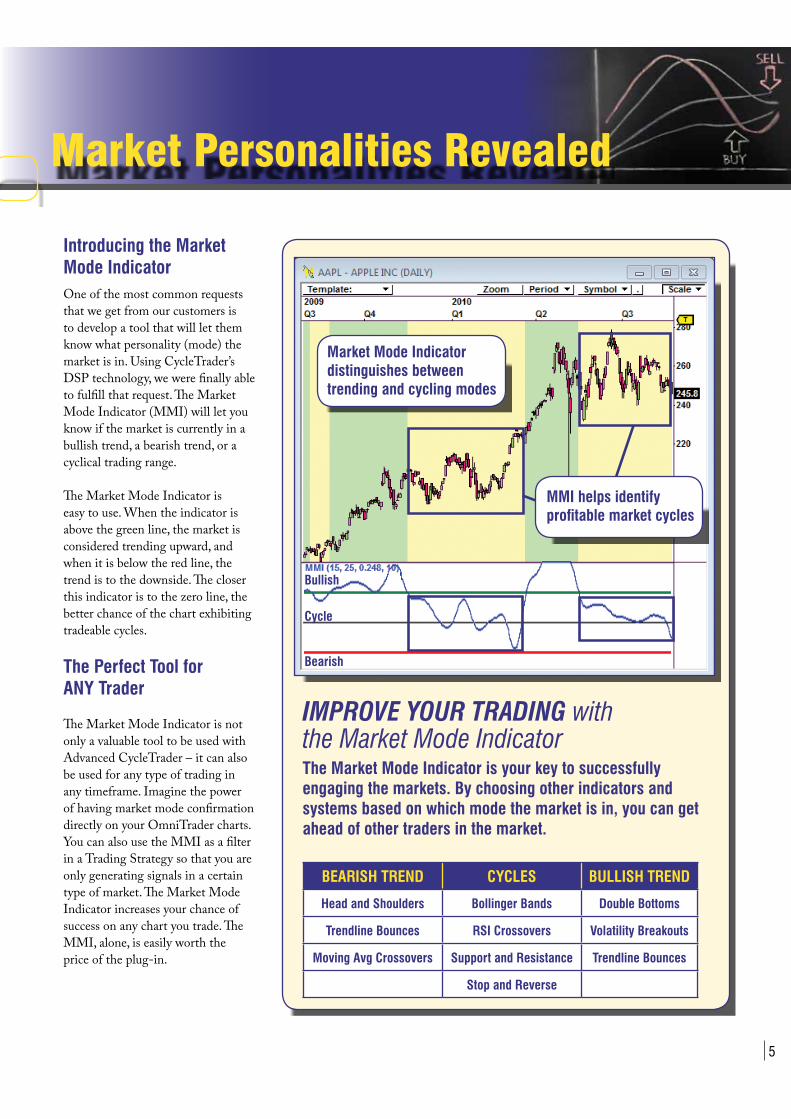
Introducing the Market Mode IndicatorOne of the most common requests that we get from our customers is to develop a tool that will let them know what personality (mode) the market is in. Using CycleTrader’s DSP technology, we were !nally able to ful!ll that request. "e Market Mode Indicator (MMI) will let you know if the market is currently in a bullish trend, a bearish trend, or a cyclical trading range.
"e Market Mode Indicator is easy to use. When the indicator is above the green line, the market is considered trending upward, and when it is below the red line, the trend is to the downside. "e closer this indicator is to the zero line, the better chance of the chart exhibiting tradeable cycles.
The Perfect Tool for ANY Trader
"e Market Mode Indicator is not only a valuable tool to be used with Advanced CycleTrader – it can also be used for any type of trading in any timeframe. Imagine the power of having market mode con!rmation directly on your OmniTrader charts. You can also use the MMI as a !lter in a Trading Strategy so that you are only generating signals in a certain type of market. "e Market Mode Indicator increases your chance of success on any chart you trade. "e MMI, alone, is easily worth the price of the plug-in.
5
The Market Mode Indicator is your key to successfully engaging the markets. By choosing other indicators and systems based on which mode the market is in, you can get ahead of other traders in the market.
BEARISH TREND CYCLES BULLISH TREND
Head and Shoulders Bollinger Bands Double Bottoms
Trendline Bounces RSI Crossovers Volatility Breakouts
Moving Avg Crossovers Support and Resistance Trendline Bounces
Stop and Reverse
Market Personalities Revealed
Market Mode Indicator distinguishes between trending and cycling modes
Bullish
Cycle
Bearish
MMI helps identify profitable market cycles
IMPROVE YOUR TRADING with the Market Mode Indicator

Hidden Profits RevealedFor decades savvy traders have been using technical indicators to improve their market timing. CycleTrader’s DSP technology takes technical trading to the next level, helping you trade pro!table market cycles in all timeframes. CycleTrader’s adaptive indicators lock on to the swings and cycles that standard indicators frequently miss.
Visualize Cycle StrengthCycleTrader’s Spectrum Indicator gives you an easy-to-read graphical representation of the strength and stability of market cycles."e Spectrum Indicator shows you the cycle strength across multiple timeframes to let you quickly identify the strongest cycle in the market, also known as the “dominant cycle”. "e Spectrum Indicator highlights when pro!table cycles are forming and dissipating. Even more, it alerts you to these situations earlier than previously possible using traditional technical indicators. If long-term waves are dictating market movement, the Spectrum Indicator will light up at the top of the display. "e bottom of the indicator display will light up if predictable short term swings are present in the current market.
Complimenting the Spectrum Indicator is ACT’s library of adaptive indicators and systems, that automatically tune themselves to the cycles in the data. "is DSP technology gives you more responsive indicators and systems— that are more accurate and less prone to whipsaws.
6
ACT Adaptive Indicators and SystemsUÊ�`>«Ì�ÛiÊ��8UÊ�`>«Ì�ÛiÊ�UÊ�`>«Ì�ÛiÊ��Û��}Ê�ÛiÀ>}iUÊ�`>«Ì�ÛiÊ,-�UÊ�`>«Ì�ÛiÊ/,�8
New Focused Indicators
/��ÃÊV�>ÀÌÊ�vÊ"89Ê�ÃÊ>Ê«iÀviVÌÊiÝ>�«�iÊ�vÊ��ÜÊÌ�iÊ�`>«Ì�ÛiÊ�Ê��`�V>Ì�ÀÊ��V�ÃÊ��Ì�ÊÌ�iÊ`����>�ÌÊVÞV�i]ÊÜ���iÊÌ�iÊ�`>«Ì�ÛiÊ�����}iÀÊ>�`ÊÀ�ÃÃ�ÛiÀÊSystem pinpoints the highs and lows with amazing precision.
The Adaptive Bollinger Band Crossover System pinpoints cycle highs and lows
The Adaptive CCI locks onto the dominant cycle

Focused™ Indicators
In the !rst version of ACT, we introduced adaptive indicators that are internally adjusted to be in tune with the market cycle… and now with ACT 2.0, we’re taking this technology to the next level with our new Focused ™ Indicators. "ese new indicators cut out the untradeable cyclic components, leaving you indicators that only react to the most predictive and pro!table cycles. We then used these new indicators to create two powerful new trading Systems; Focused RSI and Focused CCI. "ese systems are combined in our new ACT Focused Opportunities Strategy (see next page).
More Outstanding DSP In addition to ACT 2.0’s Focused Indicators, the latest version also o$ers you two new price based indicators that utilize the power of DSP to smooth price data with far less lag than traditional smoothing approaches.
"e OptiSmooth Filter cuts through noise while leaving price data intact, helping you see the moves that matter. Our new SmoothD indicator uses this smoothing technology to create a powerful MACD-like indicator that captures trends with less lag.
7
New ACT 2.0 Indicators and Systems
UÊ��VÕÃi`Ê,-�UÊ��VÕÃi`Ê�UÊ-���Ì��UÊ/�iÊ"«Ì�-���Ì�Ê���ÌiÀ
Detect the Most Predictive and Profitable Cycles
NEW!
/��ÃÊV�>ÀÌÊ�vÊ"89Ê�ÃÊ>Ê«iÀviVÌÊiÝ>�«�iÊ�vÊ��ÜÊÌ�iÊ�`>«Ì�ÛiÊ�Ê��`�V>Ì�ÀÊ��V�ÃÊ��Ì�ÊÌ�iÊ`����>�ÌÊVÞV�i]ÊÜ���iÊÌ�iÊ�`>«Ì�ÛiÊ�����}iÀÊ>�`ÊÀ�ÃÃ�ÛiÀÊ
The Spectrum Indicator alerts you to a stable cycle

8
Profit with Cycle SignalsPowerful ACT StrategiesAll of the components of Nirvana’s Advanced CycleTrader come together in the ACT Strategies. For the original plug-in, we developed two trading strategies, ACT EOD and ACT RT, that take advantage of CycleTrader’s Market Mode analysis and the Adaptive Cycle Systems.
"e original ACT Strategies use Nirvana’s proprietary voting process on the Adaptive Cycle Systems to generate trading signals when the Market Mode Indicator detects cyclical non-trending behavior. "ese systems excel at !ring reversal signals in a trading range.
ACT Focused Opportunities StrategyWith ACT 2.0, we utilized our new Focused Systems to create a new strategy called ACT Focused Opportunities. "is strategy compliments the original ACT Strategies by !nding the best cycle entries in markets that are trending to the upside. "e Focused Systems identify the opportunity points by targeting the tradable cycles in the market. "e new OptiSmooth Filter is then used to ensure the current market conditions are conducive to cycle trading. !is combination is the knockout one-two punch of cycle trading. With the Focused Opportunities Strategy, we are seeing phenomenal results as this strategy steadily extracts pro!ts from cycling and uptrending markets.
The ACT EOD Trading Strategy uses a voting process by analyzing multiple Adaptive Systems. If the MMI Filter detects a cyclical market, the strategy will generate signals at predicted cycle highs and lows.
The ACT 2.0 Focused Opportunities Strategy identifies two big winners as it locks on to the longer term cycles in the chart of CVS Caremark (CVS). The first trade nets 4% as the cycle swings back to the upside, before the second cycle trade leads to a sustained uptrend that is worth another 14%.
Included Strategies
UÊ�/Ê �`��v��>ÞÊ-ÌÀ>Ìi}Þ
UÊ�/Ê,i>�Ê/��iÊ-ÌÀ>Ìi}Þ
UÊ�/ÊÓ°äÊ��VÕÃi`ÊÊÊÊÊ Opportunities Strategy
NEW!

9
Visualize the Wave and Heat up your Profits!
Heatmaps serve as your dashboard to market behavior. "ey are one of the best tools to visualize market waves across all timeframes. "e concept is simple yet powerful. Rather than plotting a traditional indicator such as
a 14 period RSI, the heatmap is looking at the RSI in EVERY periodicity between 4 and 50. At the very bottom of the map, the four period RSI is displayed by coloring the horizontal region with red for low RSI and green for large RSI
values. "e heatmap lets you see exactly how the waves of buying and selling pressure play out in the market. Watch as short term reversals %ow out to longer term trends as the wave moves through the market. You see it ALL.
HOW A HEATMAP IS BUILT
Indicator
Indicator Values ���À��`i`
���À�V�`i`ÊÛ>�ÕiÃÊbecome single line
in the Heatmap
New OptiSmooth Filter
Another breakthrough in ACT 2.0 is our OptiSmooth Filter that cuts through the noise in your `>Ì>]Ê}�Û��}ÊÞ�ÕÊÕ�ÌÀ>Ê��Ü��>}Êsmoothing without overshoots. You can use this indicator anywhere you would normally use a moving average to smooth data.
Get The BIG Picture with Heatmaps

10
The POWER of Cycle Trading
A Comprehensive Seminar by Jeremy Williams
Market Cycles DemystifiedAdvanced technology deserves advanced education, and that is why we are including our seminar, !e Power of Cycle Trading, with your purchase of Advanced CycleTrader 2.0. In this seminar, Jeremy Williams, Nirvana Systems’ Strategy Research Specialist, helps you advance your trading by presenting a comprehensive view of cycle analysis. From the basics of the science to trading with ACT, he shows you everything you need to get started pro!ting from these market swings.
In The Power of Cycle Trading, Jeremy Williams will show you how to interpret the ACT indicators (such as the Heatmap shown above) and explain how to apply them to your trading.
In the Power of Cycle Trading, we start by discussing the Digital Signal Processing technology that lies at the heart of Advanced CycleTrader. Jeremy explains how this technology is used to derive cycles from di$erent timeframes, and how ACT is able to identify which cycles are currently the strongest.
Each of the powerful new indicators are given an in- depth examination so that you can apply them to your trading as quickly as possible. Jeremy also discusses the ACT Trading Strategies, and shows you how to use Heatmaps in order to con!rm the signals that have the highest likelihood for success.
!e Power of Cycle Trading seminar is included FREE with your purchase of the Advanced CycleTrader 2.0 (see opposite page for details).
The POWER of Cycle Trading SEMINAR
SEMINAR TOPICS· Introduction to DSP· Detecting Cycles· Using Heatmaps· Personalities of Markets· Detecting Market Mode· Cycle Adaptive Indicators· Focused Indicators· The CycleTrader Strategies

7000 N. MoPac, Suite 425Austin, Texas 78731 USAToll Free 1. 800. 880. 0338
PRESORTEDFIRST CLASS MAIL
U.S. POSTAGEPAID
AUSTIN, TXPERMIT #1546
Buying Low and Selling High Just Got a Lot Easier!
ADVANCED
CYCLETrader 2.0Nirvana’s