niskanen climate primer - 2017-03-13
TRANSCRIPT

BriefingPaper
ClimateScience:AGuidetothePublicDebate
JosephMajkutDirectorofClimateScienceTheNiskanenCenterMarch8,2017
2
IntroductionThefoundationsofclimatesciencedatebacktotheearly19thcentury,1whenscientists—usingtheirnewfoundsophisticationinchemistryandphysics—becameawarethatheattrappinggasesintheatmospheremaintainedglobaltemperaturesabovefreezing.Despitecontinuedscientificstudy,thefieldwasoflittlepublicinterestuntilthe1960s,whenscientistsbecameincreasinglyconcernedthatgreenhousegasemissionsmightdangerouslyinterferewiththeplanet’sclimate.2Suchconcernshaveinspiredgrowingvolumesofscientificresearchintothecausesandpotentialeffectsofclimatechangeeversince.ThecontemporarystateofknowledgeregardingclimatescienceiscompiledbytheInternationalPanelonClimateChange(IPCC)3andotherscientificsocieties.4Justasbasicchemistryandphysicswouldpredict,industrialactivityhasindeedincreasedtheamountofgreenhousegasesintheatmosphere(primarilyCO2),trappedheat,andwarmedtheclimate.Associatedchangeshavebeenmeasuredintemperatures,rainfall,sealevel,andotherbasicecologicalandphysicalconditionsaroundtheworld.AccordingtotheIPCCAR5,theseeffectsshouldbeexpectedtocontinuewithadditionalemissions,“increasingthelikelihoodofsevere,pervasiveandirreversibleimpactsforpeopleandecosystems.“Toreducethelikelyimpactsofclimatechange,governmentsacrosstheglobehaveforwardedpoliciestocutfuturegreenhousegas(GHG)emissions,reducethecostoflow-carbonenergy,andpreparesocietyforthenegativeimpactsofclimatechange.Somearenowintheearlystagesofimplementingthosepolicies.Theseactionsandplanscoalescedin2015undernegotiationsfortheParisClimateAgreement,whichsignaledtheglobalintenttorestrainclimatechangetolessthan2°Cofaverageglobaltemperatureincreaseoverpre-industrialtimes,5afeatthatwillrequireevenmoresignificantreductionsinexpectedGHGemissions.6AsaresultofboththecomplexityofprojectingintothefutureandthepoliticalandeconomicchallengesofreducingGHGemissions,politicaldebatesabouthowsocietyshouldrespondto 1Forabooklengthexplorationofthehistoryofmajorpapersinclimatescience,seeArcherandPierrehumbertinreferences;forawebpresentationvisithttp://history.aip.org/climate/index.htm.2President’sScienceAdvisoryCommitteeReport1965:AppendixY4:AtmosphericCarbonDioxide,pp.111-133inRestoringtheQualityofourEnvironment,ReportoftheEnvironmentalPollutionPanel.TheWhiteHouse,WashingtonDC,November1965.https://dge.carnegiescience.edu/labs/caldeiralab/Caldeira%20downloads/PSAC,%201965,%20Restoring%20the%20Quality%20of%20Our%20Environment.pdf.3InternationalPanelonClimateChange.FifthAssessmentReport(AR5)2015.https://www.ipcc.ch/report/ar5/.4TheRoyalSocietyandtheU.S.NationalAcademiesofSciences,EngineeringandMedicine,ClimateChange:EvidenceandCauses.2014http://nas-sites.org/americasclimatechoices/events/a-discussion-on-climate-change-evidence-and-causes/.5UnitedNationsFrameworkConventiononClimateChange.TheParisAgreement.2015.http://unfccc.int/paris_agreement/items/9485.php.6MassachusettsInstituteofTechnologyJointProgramontheScienceandPolicyofGlobalChange.2016Food,Water,Energy,andClimateOutlook.MassachusettsInstituteofTechnology.(2016)https://globalchange.mit.edu/publications/signature/2016-food-water-energy-climate-outlook.

3
therisksofclimatechangehavebroughtanintensepoliticalspotlightonthescienceofclimatechange.Statementsinthepublicdebateaboutclimatescience,however,rangefromlegitimatetodubious.Thelinesbetweenwhatweknowwithconfidenceandwhatisstillapuzzlearenotalwayscleartonon-specialists.Eventospecialists,localperspectivesonriskandtheburdenofproofnecessarytocompelapublicpolicyresponsevarybetweencountries,states,andindividuals.Thusthepublicdebatecanmakeitdifficultforclimatesciencetoappropriatelyinformjudgmentsaboutenergyandenvironmentalpolicy.ThisbriefdoesnottakeastandonparticularpolicyoptionsfortheUnitedStates.7Instead,itaimstoexplainwhatthescientificdebateaboutclimatechangeis(andisnot)about,examinesomeofthemorecommonobjectionstothenarrativesofferedbymainstreamscience(including5commonlyaskedquestions),andprovidecontextforwhatisknownaboutthecurrentstateoftheclimateandwhatremainstobediscovered.Thispaperdoesnotaimtoresolveeveryscientificdispute.Thescientificcommunitydoesthatthroughexperimentation,peerreview,andreplicationofresults.Rather,wewillexaminehowscientificconclusionsaboutclimatechangehaveformedandhowthoseconclusionsarereflectedinthepublicdebateabouttherealityandrisksofclimatechange.
7TheNiskanenCenter,however,supportsmarket-basedandefficientmeasurestoreducegreenhousegasemissionsintheUnitedStates.c.f.Taylor,Jerry.TheConservativeCaseforaCarbonTax.TheNiskanenCenter.2015.http://niskanencenter.org/wp-content/uploads/2015/03/The-Conservative-Case-for-a-Carbon-Tax1.pdf

4
Contents 5.Whatchangestheclimate?8.HumanInfluenceontheClimate15.UnderstandingRisks18.Questions26.ConclusionFigure1:Theco-evolutionofCO2andtemperatureoverthelast800,000yearsFigure2:Significantglobaltemperaturerecordsfromthe19thcenturyFigure3.EstimatedtemperaturechangeduetoNaturalandHumanFactorsFigure4:Globaltemperatureincreasevs.cumulativeglobalCO2emissions.Figure5:RisksofclimatechangebytemperatureQuestion1:Aretemperaturerecordsreliable?Question2:Hasglobalwarmingstopped,paused,orsloweddown?Question3:Canthesechangesbenatural?Question4:Aretheremeasurementsthatchallengethispicture?Question5:Areclimatemodelpredictionstoohot?

5
WhatChangestheClimate?TheconditionsthatkeeptheEarth’sclimatelivablearewellknown.TheEarthorbitstheSun.LightfromtheSunfallsontheEarth;somepassesthroughtheatmosphereandwarmsthesurfaceoftheEarth.8GravitykeepsEarth’satmospherefromdriftingoffintospace,andamixofGHGs(e.g.,watervapor,CO2,methane,ozoneandothers)trapheatclosetothesurfacebecauseofthegreenhouseeffect.9ItiswarmerinChicagothanontheMoonbecauseEarth’satmosphereblanketstheplanetandkeepsenergynearthesurfaceoftheplanet.Anythingthatcausestheamountofenergytrappedbytheatmospheretogoupordownoverlongperiodsoftimechangestheclimate.Someoftheseclimateagentsarewellknownandfamiliar.Forexample,moresunshinemeanswarmersurfacetemperaturesandmoreheatforgreenhousegasestokeepnearthesurface.ItfeelswarmerinMiamithaninChicago,inpart,becauseplacesneartheequatorgetmoresunlight.OveranyparticularepochinEarth’shistory,thecombinationoffactorsdeterminingtheclimateorcausingittochangehasvaried.Long-termchangesinthebrightnessoftheSun,theshapeoftheorbitoftheEartharoundtheSun,thedistributionofthecontinents,thereflectivityofthelandsurface,eruptionsoflargevolcanoes,andthechemicalcompositionoftheatmosphereareallknowntohaveaffectedtheclimate.OverEarth’shistory,changesintheseprimarydriversofclimatehaveledtoconditionsdrasticallydifferentfromtoday—bothcolderandhotter10.Muchofthechallengeofclimatesciencecomesindiscerninghowthesedifferenteffectshaveaccentuatedoroffseteachother.Forexample,whatistheultimateeffectofincreasingthesolaroutputoftheSun(warming),makingtheEarth’ssurfacebrighterbydeforestation(cooling),andintensifyingthegreenhouseeffect(warming)whenalloccurtogether?Inmostcases,theinteractionsbetweenthesefactorsmaketheirrelationshipswithglobalclimatetoodifficulttounderstandthroughsimplequalitativeanalysis.Thisiswhyscientificandquantitativeanalysisisimportant.Developingascientificunderstandingoftheclimateofthelast800,000yearsisanexampleofthatchallenge.Duringthatperiodtheclimatecyclednaturallybetweencoldiceagesandwarmperiodsatirregularintervalslastingthousandsofyears.Figure1showstemperaturesneartheSouthPolechangedbyasmuchas10°Cbetweencoldglacialperiodsandwarmerinterglacialperiods.Thecorrespondingglobaltemperaturechangeswereabouthalfthat,ontheorderof
8NotallofthelightinboundfromtheSunreachesthesurfaceoftheEarth.Someisreflectedorabsorbedbytheatmosphereitselfandsomereflectsoffreflectivesurfaceslikethetopsofcloudsorlargeexpansesoficeontheoceanorland.9Greenhousegasesintheatmosphereabsorbheat(infrared)radiationcomingfromthesurfaceandfromwithintheatmosphere.Theythenreradiateitbothupanddown.Thedownwardportionradiatesbacktowardthesurface,causingfurthertemperatureincreasesnearthesurface.10Globaltemperaturehasrangedbetweencoldiceages(4-6°Ccolderthantoday)andhotgreenhouses(upto6°CwarmerduringtheCretaceous).

6
4-6°C.11Astheclimatemovedbetweenhotandcoldperiods,theatmosphericCO2concentrationalsowentupanddown.ThisclearrelationshipinmeasurementspromptedscientiststoaskwhetherCO2wasdrivingtemperaturechanges,orwhethertemperaturechangesweredrivingCO2concentrations.
Figure1:Theco-evolutionoftemperatureandCO2concentrationfromthelast800,000years.ThetemperaturerecordinredcapturestheairtemperatureinAntarcticabymeasuringtheratiooxygenisotopestrappedinairbubblestakenfromiceformedinthedeeppast.CO2levelsaremeasuredfromthesameairbubblesandareshowninblue.TherapidincreaseofatmosphericCO2intherecentpastisshownasadottedblueline.Source:
UnitedStatesNationalAcademiesofSciences,ClimateChange:EvidenceandCausesResearchhasrevealedthatbotharetrue.ScientistsfoundthattheincreaseinCO2concentrationsfollowedtemperaturechanges,indicatingsomethingelsemustbecontributing.TheleadingexplanationnowholdsthattemperaturechangesfromwobblesintheEarth’sorbitcausedwarming12,whichincreasedCO2levelsandcausedadditionalwarming.Toexiteachiceage,changesinEarth’sorbittippedtheice-coveredNorthernHemispheretowardthesun,causingicetomeltatthepoles,thesurfacereflectivitytodecrease,andglobaltemperaturestoincrease.CO2wasthenreleasedintotheatmospherefromthewarmeroceans,whichholdalot
11AnnanandHargreaves2013.12ThesewobblesarereallychangesinthreedistinctorbitalparametersthattogetherdeterminehowsunlightfallsontheEarth:thecircularityoftheplanet’sorbit,thetiltofEarth’saxiswithrespecttotheSun,andthetimeofyearwhenEarthisclosesttotheSun.

7
ofdissolvedcarbon.13ThewarmingeffectofincreasedCO2helpedgivewarmperiodsanextratemperatureboost.Asgeologicaltimeworeon,changesintheorbitoftheplanetfavoredcoolingandthereleasedCO2waseventuallyrecapturedbytheoceans.CoolingathighNorthernlatitudesledtoiceformation,andagaintheworldfellintoaniceage.Rightnow,we’redeep(about10,000years14)intoanaturalwarmspell.Assumingourunderstandingiscorrect,theEarthwouldstillberelativelywarmtodayhadhumansneverevolvedorneverlearnedhowtoclearlandforagricultureorburncoal,oil,andgasforenergy.Withoutasubstantialhumanroleintheclimate,then,climatewouldprobablybeslowlycoolingoverthousandsofyears,continuingthecycleofwarmtocoldperiods.However,thecurrentamountofCO2intheatmosphereisfargreaterthanatanyotherperiodinthelast800,000years(seethestarredendpointinFigure1),asaresultofhumanactivity.Giventherolethatthegreenhouseeffectplaysinclimate,weshouldexpectthisincreaseinatmosphericgreenhousegasestoprofoundlyalterthepreviousrhythmofwarmingandcooling,andpushtemperaturesevenhigher.Whilethepreciseconditionsthatinstigatethefallintoaniceagearenotwellknown,somescientistsbelievethatthehumanclimatefootprintalreadydelayedthenexticeage15andconditionsforanothermaynotarrivefor100,000years.16
13ColdoceanwaterscanholdmoreCO2thanwarmerones,soaschangesintheEarth’sorbitinstigatedwarming,CO2bubbledoutoftheoceanandintotheatmosphere,causingtheglobalaveragetemperaturetogoupfurther.Thistypeofamplificationhascausedapositive(oramplifying)feedbackeffect,andappearstohaveplayedanimportantroleinthetransitionsbetweencoldandwarmclimates.14Marcottetal.2013.15Ruddimanetal.2014;forapopularaccountofthisideaseeRuddiman"Howdidhumansfirstalterglobalclimate?"ScientificAmericanhttps://www.scientificamerican.com/article/how-did-humans-first-alte/.16Ganopolskietal.2016.
8
HumanInfluenceontheClimate
CarbonDioxideIncreaseInthecenturiesbeforetheindustrialrevolution,CO2levelsintheatmospherewerearound280partspermillion(ppm),avalueneartheupperendoftherangeofvaluesfromthelastmillionyears.CurrentobservationsindicatethattheCO2concentrationhasrecentlyrisenpast400ppm—a43percentincreaseoverpreindustriallevels—andisgrowingatabout2ppmperyear.17ThereislittledoubtthattheincreaseinatmosphericCO2isduetohumanemissions,asfossilfuelburningandforestryandagriculturehavereleasedmoreCO2intotheatmospherethanhasaccumulatedsincethe19thcentury.18Since1870,humanactivitieshavereleasedabout2,000billionmetrictonsofCO2(GtCO2)intotheatmospherethroughtheburningoffossilfuelsandclearingofland.IfallofthatCO2hadaccumulatedintheatmosphere,thenconcentrationswouldalreadybeapproaching550ppm(i.e.,adoublingofthepreindustrialconcentration).Instead,theamountofCO2intheatmospherehasonlyincreasedbyabout110ppmorabout850GtCO2sincethelate19thcentury.Theresthasbeencapturedbyplants(viaphotosynthesis)andtheoceans(whichdissolvesCO2inseawater).Together,thesenaturalprocesseshaveremovedabout60percentofhumanCO2emissionsfromtheatmosphere.Wereemissionstosuddenlystop,thosesamenaturalprocesseswouldcaptureandremoveexcessCO2fromtheatmosphere.However,theseprocesseswilltakehundredsofyearstosignificantlyreduceatmosphericCO2,andthousandsofyearstocompletelycaptureCO2fromfossilfuelburningbackintothenaturalgeochemicalcyclebydepositingtheemittedcarbonintotheoceanandoceansediments.Accordingly,anyclimatechangeassociatedwithemissionsfromCO2shouldbeexpectedtolasttensofthousandsofyears,allelsebeingrelativelyequal.19
MeasurementsofRecentClimateChangeThemostcentralmeasureofclimatechangeistheincreaseintheglobalaveragesurfacetemperature.20Thermometernetworksregularlymeasuretemperaturearoundtheworldandthesemeasurementsarecombinedtomakeaglobalaverage.Whilethenumberandqualityof
17GlobalCarbonProject(2016)Carbonbudgetandtrends2016.[www.globalcarbonproject.org/carbonbudget]publishedon14November2016.18AsecondlineofevidenceprovesthattheCO2accumulatingintheatmospherecomesfromindustrialactivities.Thechemicalsignatureoffossilfuels,whicharelowintheunstableisotopeCarbon-14,isdetectableintheatmosphere.19Archeretal.2009.20Whetherornotglobalsurfacetemperatureoughttobethemostcentralmeasureofclimatechange,orhuman-causedclimatechange,isamatterofsomedebate—evenwithinthescientificcommunity.Itisconsideredcentralherebecausethelengthoftherecord,datingbacktothe19thcentury,andthepolicycontextimpliedbytheParisAgreement.

9
surfacethermometershasincreasedwithtime,preciseglobalrecordscanbeassembledstretchingbacktothe19thcentury.Whilethereissomedisagreementonthemargins,researchgroupsaroundtheworldhavefoundthattheglobalaveragesurfacetemperaturehasincreasedbyabout1°Csincethemiddleofthe19thcentury,asshownbyFigure2.21
Figure2:Annualaveragetemperaturerecordsfrom1880-2016,shownasadeparturefromthe1880-1920
average.Thecoloredlinesshowthetemperaturesasestimatedbyfourdifferentresearchgroups:NASAGISS(brown),NOAA(green),HadleyCentre(red),andBerkeleyEarth(blue).Seetextforreferences.
Theaverageincreaseinglobaltemperatureshasmanifesteditselfinahostoftemperaturerecords.Eachofthelastthreedecadeswashotterthanthepreviousdecade,withthehottestdecadeintheinstrumentalrecordsofarbeing2000to2010.Since2010,temperatureshavereachedevenhigherlevels,withtheyears2014,2015,and2016eachsuccessivelyregisteringasthehottestyearsincemonitoringglobaltemperatureswiththermometersbeganinthemid19thcentury(theso-called“instrumentalrecord”).22Duringthecourseofthiscentury-longwarming,therehavebeenperiodswheretheriseintemperaturesslowedorstoppedforupto10-to15-yearperiods,butrisenagainsuchthattheoverallwarminghascontinued.23Explanationsforthesedecadalvariationsintemperatureinvokeshort-termchangesinnaturalclimatedrivers(e.g.,volcaniceruptionsorsolaractivity),humanclimatedrivers(e.g.,changesinemissionsofsulfurdioxide,aparticulatepollutantthathasacoolingeffectonclimate)orrandomfluctuationsonthepartoftheclimatefromchangesinthelarge-scalecirculationoftheocean(e.g.,changesintheexchangeofheatbetweenthe
21IPCCAR5WGIChapter2.Observations:SurfaceandAtmosphere.22Seediscussion:Areglobaltemperaturerecordsreliable?23Seediscussion:Ahiatus,apause,aslowdown?

10
oceanandtheatmosphereresultingfromtheElNiño/LaNiñaoscillationsorlargescaleoceancirculationinthePacificOcean).Alongwithtemperature,sealevelriseisasensitiveindicatorofclimatechange.WarmperiodsinEarth’shistoryfeaturedmuchhighersealevels,aresultoficesheetsandglaciersmeltingandwarmingoceantemperatures.Overthe20thcentury,globalaveragesealevelincreasedbyabout8inchesafternothavingchangedverymuchoveratleastthelastseveralthousandyears.24Asfortemperature,thereisnotmuchtechnicaldisagreementabouttheextentorcausesoftotalsealevelriseoverthelastcentury,25whichistheresultofwarmingoftheglobalocean(whichcauseswatertoexpand)andmeltingicefromglaciersandpolarregions(addingwater).Alargerbodyofevidenceshowsothercomponentsoftheclimatesystemundergoingsignificantchanges,includingthewarmingofthelowerpartoftheatmosphere(knownasthetroposphere,whichhasbeenobservedsincethemid-20thcentury),coolingofthestratosphere26(observedsincethemid-20thcentury),thewarmingoftheoceans(observedgloballysincethe1970s),theretreatofglaciers(observedatmanyglacierssincethe19thcentury),theretreatofsnowcover(observedbysatellitessincethe1970s),andrecedingseaiceintheArctic(observedbysatellitesincethe1980s).27
DeterminingtheExtentofHumanInfluenceGlobalCO2andtemperaturerecordsshowthatCO2intheatmospherehasincreaseddramaticallywithcoincidingtemperatureincreases,sealevelrise,andotherwarmingsignals.Intuitively,itmakessensethatthesearerelated;asthegreenhousegasblanketgetsthicker,thesurfacewarmsup.However,aswiththecyclesbetweeniceagesandwarmperiods,toestimatetherelativeeffectsofhumansandotherfactorsonrecentclimatechangewehavetoconsiderthefullrangeofclimatedrivers.Themajorhumandriversofclimatechangeincludeemissionsofgreenhousegases,changesinlanduseaffectingthelocallandsurface(warmorcool),andtheeffectofsulfate-producingparticulatepollution(cooling)andsoot(warming)fromburningfossilfuels.28Overtimeperiodsofdecadestoafewcenturies,thenaturaldriversmeritingconsiderationincludechangesinthebrightnessoftheSun(e.g.,duetosunspots)andvolcaniceruptions,whichloftsmallparticlesintothesky.
24Koppetal.2016.25IPCCAR5WG1Chapter13.SeaLevelChange.26Inthestratosphere,CO2contributestocoolingasitemitsradiationtospaceathighaltitudes.StratosphericcoolingcoherentwithwarmingofthetroposphereisasignatureofanincreasedgreenhouseeffectfromincreasingCO2.27IPCCAR5WG1Chapter2.Observations:AtmosphereandSurface;IPCCAR5WG1Chapter3.Observations:Oceans,IPCCAR5WG1Chapter4.Observations:Cryosphere.28ThemostsignificantoftheseisSO2,fromburningoffossilfuels,whichformssulfateintheatmosphere.Thewhitehazeofsulfatemakestheatmospheremorereflectiveandexertsacoolingeffect.

11
Currentresearchshowsthatnaturaldriverscannotadequatelyexplainthetiming,amount,orpatternofwarmingthathasbeenobservedoverthesecondhalfofthe20thcentury.Figure3illustratestheexpectedeffectsofnaturaldrivers,andnaturalandhumandriverscombined,onglobaltemperatureinthe20thcentury.Notethatonlywhenhumaninfluencesareincludeddothetemperatureincreasescalculatedbyclimatemodelsreasonablyrepresenttheamountofwarmingintheobservedrecord,aswellasitstiming.Moresophisticatedstudiesoftherelativeweightingofhumanandnaturalclimatedriverstakeintoaccountregionalvariationsintemperatureaswellastheverticaldistributionoftemperaturechangetoseparatehumanandnaturalsignals.29
Figure3:Thecontributionto20thcenturyclimatechangefromnaturalandhumanfactors.Thegreenbandshowshowmodelsimulationsestimatetemperaturewhenonlynaturalfactorsworktoaltertheclimate.Thebluebandshowshowmodelsimulationsestimatetemperaturewhenbothnaturalandhumanfactorsareinplay.Thewidthofeachbandshowstherangeinclimateduetodifferentmodelcharacteristicsandinternalvariability.Theblack
lineshowsoneestimateofobservedsurfacetemperature.Individualstudiesthatcalculatehowmuchoftherecentchangeisduetohumanactivityfindthatnearlyallofthewarmingobservedoverthelate20thcenturywastheresultofhumaninfluence30.Takingacautiousestimateoferrorinsuchcalculations,scientistswritingthesummaryforthelastIPCCreportconcludedthatatleasthalfofthetemperatureincreasesincethemid-20thcentury(total0.6°C)wastheresultofhumaninfluence31.Theirbestestimatewasthatalloftherecenttemperatureincreasewashuman-caused.Withoutthecoolingeffectof
29HegerlandZwiers2011.30IPCCAR5WG1Chapter10.DetectionandAttributionofClimateChange:fromGlobaltoRegional.31Ibid.

12
particulateaerosolpollution,weprobablywouldhaveexperiencedgreaterwarmingfromincreasesinCO2andothergreenhousegasconcentrations.Disentanglingthecombinedeffectsofnaturalvariability,externalfactors,andhumaninfluenceonthetemperaturechangesbefore1950ismoredifficult,becausetheobservationsthemselvesaremoreuncertain,datacoverageislesscompleteandconclusionsarenecessarilylessconfident.32However,thereislittledoubtthat,thelargestchangestoagentsthatwarmandcooltheclimatesincethe18thcenturyhavecomefromhumaninfluences,andtheyfavorwarming.33Otherclimatechangesthatareconsistentwithgreenhousegaswarmingincludesealevelrise,warmingoceans,retreatingglaciersandseaice,andcoolingoftheupperatmosphere(stratosphere).Allofwhichhavebeenobservedtosomedegreealready.ThisconsilienceofevidenceiscitedbytheIPCCandotherstoconfidentlyassertnotjusttherealityofglobalwarming,butitshumancauses.34However,theconclusionabouthumaninfluenceforeachtypeofphenomenaweakensatregionalscalesandforspecificphenomena(suchasdroughtandextremeweathereventslikeHurricanes),asdataandphysicalunderstandinggetnoisier,subjecttomorevariability,andtheamountofdatacoveragedeclines.
FutureHumanInfluenceonClimateTheprimaryquestionforpolicymakers,ishowmuchwarmingweshouldexpectinthefutureandiffutureemissionswillplayamajorroleinthefutureclimate.ThesequestionsdefinehowmuchclimatechangetheirplanningshouldtakeintoaccountandhowmuchcanbeavoidedbyreducingGHGemissions.BasictheoryandclimatemodelspredictthattemperaturewillcontinuetoincreaseinresponsetoGHGemissions.Theamountofclimatechangeweshouldexpectdependsonhowtheclimatewillrespondtocontinuinghumanactivitiesandnaturalevents(ascientificmatter)andtheextentoffuturegreenhousegasemissions(amatteroftechnologicaldevelopment,economicgrowth,andpolicychoices).Forallbutthelowestemissionsscenarios,weshouldexpectquiteabitmoretemperaturechangethanhasalreadybeenexperienced.Buttheextentofthewarmingbytheendofthe21stcenturyappearstostronglydependonhowmuchgreenhousegasesweemitinthefuture.Recently,scientistshaveidentifiedaconvenientwaytothinkabouttheconnectionbetweenemissionsandwarmingwithoutrelyinguponcompetingassumptionsabouteconomicandtechnologicaltrends.ForaslongasCO2emissionscontinue,wecanexpecttheaverageincreaseintemperaturetobeproportionaltothetotalamountofCO2releasedintotheatmosphere.Sincelargescaleemissionsbeganinthe18thcentury,wecanalreadyseeindicationsofthisproportionalityinhistoricalclimatechange.35
32HuberandKnutti2012.33IPCCAR5WG1Chapter8.AnthropogenicandNaturalRadiativeForcing.34Oreskes2007.35IPCCAR5WG1Chapter12.Long-termClimateChange:Projections,Commitments,andIrreversibility.
13
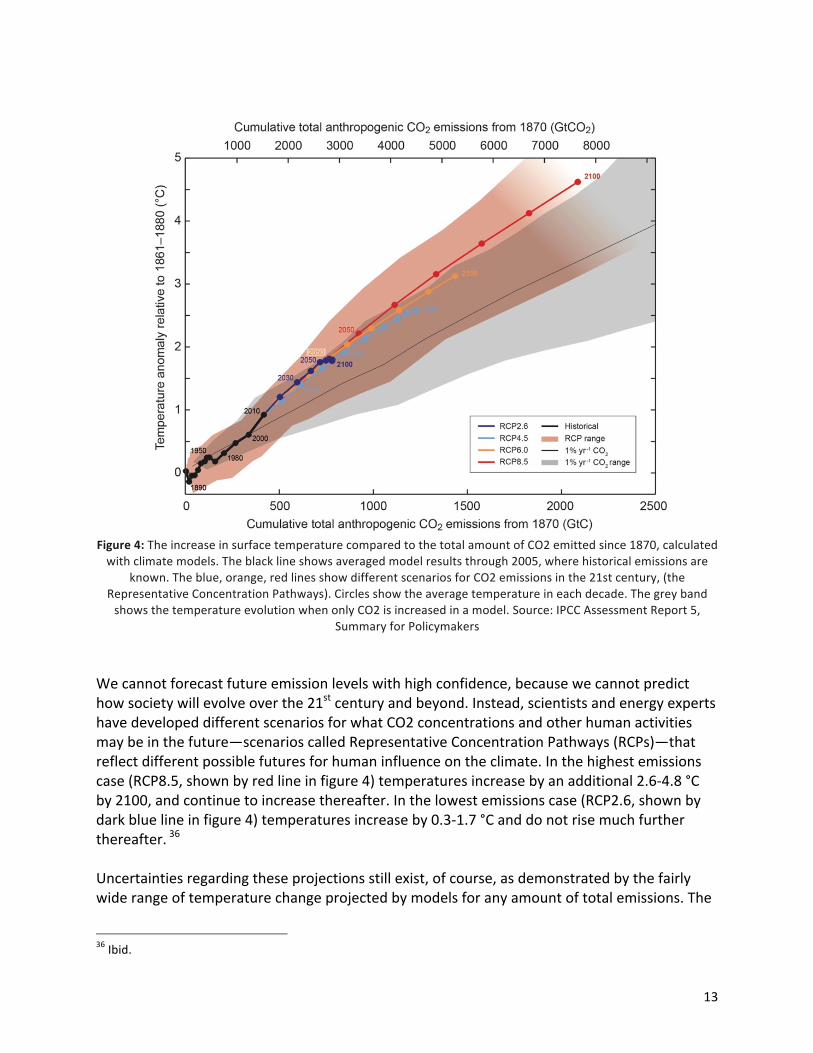
Figure4:TheincreaseinsurfacetemperaturecomparedtothetotalamountofCO2emittedsince1870,calculatedwithclimatemodels.Theblacklineshowsaveragedmodelresultsthrough2005,wherehistoricalemissionsare
known.Theblue,orange,redlinesshowdifferentscenariosforCO2emissionsinthe21stcentury,(theRepresentativeConcentrationPathways).Circlesshowtheaveragetemperatureineachdecade.ThegreybandshowsthetemperatureevolutionwhenonlyCO2isincreasedinamodel.Source:IPCCAssessmentReport5,
SummaryforPolicymakersWecannotforecastfutureemissionlevelswithhighconfidence,becausewecannotpredicthowsocietywillevolveoverthe21stcenturyandbeyond.Instead,scientistsandenergyexpertshavedevelopeddifferentscenariosforwhatCO2concentrationsandotherhumanactivitiesmaybeinthefuture—scenarioscalledRepresentativeConcentrationPathways(RCPs)—thatreflectdifferentpossiblefuturesforhumaninfluenceontheclimate.Inthehighestemissionscase(RCP8.5,shownbyredlineinfigure4)temperaturesincreasebyanadditional2.6-4.8°Cby2100,andcontinuetoincreasethereafter.Inthelowestemissionscase(RCP2.6,shownbydarkbluelineinfigure4)temperaturesincreaseby0.3-1.7°Canddonotrisemuchfurtherthereafter.36Uncertaintiesregardingtheseprojectionsstillexist,ofcourse,asdemonstratedbythefairlywiderangeoftemperaturechangeprojectedbymodelsforanyamountoftotalemissions.The
36Ibid.

14
mostimportantofwhichrelatetowhatfractionofCO2emissionsaccumulatesintheatmosphereratherthanbeingsequesteredinplants,trees,soils,ortheoceans(anissueknownasairbornefraction),andthetemperatureincreasethatfollowsfromincreasedCO2concentrationsintheatmosphere(anissueknownasclimatesensitivity).Boththeairbornefractionandtheclimatesensitivityareimportanttopicsofcontinuinginquiryinclimateresearch.37Thepublicdebateaboutclimateprojections,however,hasfocusedalmostentirelyonthecorrectvalueofclimatesensitivity.38ThetermclimatesensitivityisdefinedastheincreaseintheglobalaveragesurfacetemperatureasaresultofadoublingoftheatmosphericCO2concentration,consideredbothatthemomenttheCO2doubles(transientsensitivity)ortheclimateadjuststothepermanentlydoubledCO2concentration(equilibriumsensitivity).39TheIPCCreportsthatthemostlikelyrangefortransientsensitivityisbetween1-2.5°Candthemostlikelyrangefortheequilibriumsensitivityisbetween1.5-4.5°C.Theseestimatesareinformedbyinformationfromstudiesofpaleoclimaterecords(likethetransitionsbetweenwarmandcoolperiodsshowninFigure1),climatemodels,basicphysics,andtheobservedchangeinglobaltemperaturesincethe19thcentury.ThispresumedproportionalrelationshipbetweentemperatureandtotalCO2emissionsimpliesthat,topreventwarmingoverathreshold—forexamplethe2°CgoaladoptedintheParisClimateAccord—onlyafiniteamountofCO2canbeemitted.Thatnumberiscommonlyreferredtoastheremainingcarbonbudget.Giventhepresentrangeofestimatesinwarmingprojectedbymodels,theParisgoalwouldrequirelimitingtotalemissionstoabout3700GtCO2,morethanhalfofwhichhasalreadybeenemitted.Presently,globalemissionsfromfossilfuelsanddeforestationarejustabout40GtCO2peryear,allowingforabout4decadesattoday’semissionslevels.Thepresenceofotherhumanclimateinfluencesmeansthatbudgetisprobablymorelikethreedecades,ifthestandardestimatesofclimatesensitivityarecorrect.40Therangeoffuturewarmingexhibitedbyclimatemodelsapproaches2°CforalloftheemissionscenariosconsideredbytheIPCCandothergroups.Inlowemissionsscenarios,temperaturesapproachthatleveltowardtheendofthecentury.Inhighemissionsscenarios,temperaturespassthrough2°Csometimeinthemiddletolate21stcentury.Andinsofarastheglobalsurfacetemperatureisanindicatorofchangeinotherpartsoftheclimatesystem—e.g.changesintemperatureextremes,globalamountsofprecipitation,andsealevelrise—furtherchangesshouldbeexpectedinthemaswell.41
37Marotzkeetal.2017.38SeeQuestion:Areclimatemodelstoosensitive?39Technicaldefinitions:TransientClimateSensitivity-ThechangeinglobalaveragedsurfacetemperatureatthemomentthatatmosphericCO2doubles,afterincreasingat1percentperyearfrompre-industrialvalues.EquilibriumClimateSensitivityisthesurfacetemperatureincreaseaftertheclimatesystemhasfullyadjustedtoadoublingofatmosphericCO2overpreindustriallevels.40https://www.carbonbrief.org/analysis-only-five-years-left-before-one-point-five-c-budget-is-blown.41NASBoardonAtmosphericSciencesandClimate."WarmingWorld:ImpactsbyDegree"TheNationalAcademyofSciences.2011.http://dels.nas.edu/materials/booklets/warming-world.

15
UnderstandingRisksBasicphysicaltheoryandclimatemodelsindicateweshouldexpectasuiteofphysicaleffectswilladvancewithcontinuedglobalwarming.Temperatureincreaseswilllikelybelargeroverlandandinpolarregionsandsmallerovertheoceans.Weatherandnaturalvariabilitywillcontinuetomodulatelocalandglobaltemperatures,butasaveragetemperaturesincrease,extremesandrecordswillfavorhotspellsovercoldsnaps.Warmingwillbeaccompaniedbyincreasingamountsoftotalglobalprecipitationandtheamountofprecipitationthatfallsinindividualevents,becausewarmerairholdsmorewatervapor.Despiteprojectionsofgloballyincreasingrainfall,someareasmostlikelyfaceahighertendencytowarddryandhotconditions,ordrought,astheatmosphericcirculationchanges.Continuedheatingoftheoceansandmeltingicefromglacierswillcontributetosealevelrisethatwilllikelygoonforcenturies.Coincidentwiththephysicaleffectsofclimatechange,thegeochemicalimpactsofhigherCO2levelswillotherwiseaffectenvironmentalconditionsintheoceansandland.AstheoceansabsorbexcessCO2fromtheatmosphere,oceanpHwilldecrease,leadingtooceanacidification.HigherCO2concentrationsintheatmospherewillmakemoreavailableforphotosynthesisandcouldactasafertilizer,aidingplantgrowthandagricultureinsomeregions.Therisksofclimatechangecomefromtheeffectsofclimatechangeclashingwiththenaturalworldorhumaninfrastructureandlifestyles.Sinceclimatechangeimplieschangestothebackgroundconditionsagainstwhichsocietyandecosystemsdotheirwork,understandingthepotentialforpositiveandnegativeimpactsthroughouttheplanetischallenging.Formaleffortstounderstandlocalimpactsofclimatechangehavebeenperformedfortheworldatdifferentlevelsofglobalwarming,theUnitedStates42,andvulnerablepartsoftheworldfor4°Cofglobalwarming.43Riskassessmentsofclimatechangearecomplicatedandrelativelyuncertain.Aswehaveseen,projectionsofthefuturearenotcertainevenforglobaltemperatures.Wedon’tknowwithmuchconfidencehowregionalconditionsorextremeweathereventswillchangeandlikewisehowhumanandnaturalsystemswillrespondoradapt.Theexpectedpaceof21stcenturyclimatechangehasalmostnogeologicalanalog.Thecapacityofsocietyandecosystemstoadaptoradjusttoclimatechangeattherateandsizehumanactivitiesareincitingisuntested.
42UnitedStatesGlobalChangeResearchProgram.ThirdNationalClimateAssessment2014.http://nca2014.globalchange.gov/.43Schellnhuber,HansJoachim,etal."Turndowntheheat:climateextremes,regionalimpacts,andthecaseforresilience."Turndowntheheat:climateextremes,regionalimpacts,andthecaseforresilience2013.http://documents.worldbank.org/curated/en/975911468163736818/pdf/784240WP0Full00D0CONF0to0June19090L.pdf.

16
Initsfifthassessmentreport,theIPCCcompiledasummaryofdifferentstudiesintothelocal,regional,andglobaleffectsofclimatechange,thevulnerabilityofdifferentregionsandsectorstochange,andthecapacityfordifferentsystemstoadapttochange.Combiningthosedifferentconcepts,theIPCCratedhowclimatechangecreatedadditionalrisksacrossfivedifferentareas.44
• Uniqueandthreatenedsystemsaresystemsthathavelittlecapacitytoadapttorapidclimatechanges,suchaslow-lyingcoastalareasorisolatedecosystems.
• Extremeweathereventsincluderecordheat,moreintenseprecipitation,droughts,andtropicalstorms.
• Thedistributionofimpactsreferstothegeographicaldistributionoftheeffectsofclimate.
• Globalaggregateimpactsarethecombinedeffectsofclimatechangeonbiologicaldiversityandeconomicgrowth.
• Large-scalesingulareventsarequalitativechangestotheclimatesystemsuchasthepossibleshutdownofoceancirculation,changesinmonsoonbehavior,meltingArcticpermafrost,orthecollapseofmajoricesheetsleadingtoameterormoreofsealevelriseinthenextcentury.
TheIPCC’sratingsaresubjective,buttheydescribethecharacterofadditionalriskassociatedwitheachlevelofwarming.Atamediumlevelofadditionalrisk,theclimatechangesignaturewillbegintobedetectableinspecificeventsorregionsorsporadicallyharmful.Asrisksmovefromhightoveryhigh,theeffectsofclimatechangebecomemorepervasive,harmful,orpermanent.Thetemperatureincreaseatwhicheachareaofconcerntransitionstohigherlevelsofadditionalriskvaries,butthereisgeneralagreementthatrisksincreasewithtemperature.Atthistime,weareonlyedgingintomoderatelevelsofadditionalrisktouniqueandthreatenedsystemsandextremeweather.However,oncewesurpass2°Cofwarming,theadditionalriskineachcategorywillrangefrommediumtohigh.At4°Cofwarmingoverpreindustriallevels,theadditionalriskishightoveryhighacrossallsectors.
44IPCCAR5WG2SummaryforPolicymakers.

17
Figure5:Risksofglobaltemperatureincreasestodifferentareasofconcern.Temperatureincreaseoverpreindustrial(right)andnearpresent(left)areshownbythethermometergraphics.Eachbarrepresentsadifferentareaofconcern.Thedifferentlevelsofadditionalriskareshownastransitioningcolors,goingfromundetectable(white)toveryhigh(purple).Source:IPCCAR5WorkingGroup2.Impacts,Adaptation,and
Vulnerability:SummaryforPolicymakers

18
Question1:Aretemperaturerecordsreliable?Unfortunately,wedonothaveaglobalthermometertomeasuretheplanet-widesurfacetemperature.Andwecertaintydidnothaveonelooking100yearsintothepast.Instead,surfacetemperaturehasbeenrecordedatindividualweatherstationsandbyshipsatsea.Thosemeasurementsarecombinedandaveragedtomakeglobalrecords.Becausethenumberofstations,localconditions,andmeasurementequipmenthavechangedovertime,combiningindividualtemperaturemeasurementsintoaglobaltemperaturerecordrequiresdataprocessingandsomescientificjudgment.Asofnow,fourresearchgroupscreatemajorglobaltemperaturerecordsbycombininglocalthermometerreadings.ThreeofthoserecordsareproducedbygovernmentlabsintheUnitedStates(NASA45andNOAA46)andtheUnitedKingdom(HadleyCentre47).Thefourthwasproducedasanindependentgroup,(BerkeleyEarth48)whichoriginallysetouttocriticallyexaminetheworkoftheothers.Eachusesdifferentdataprocessingtechniquestocombinethemeasurementsfromdifferentinstruments,timeperiods,andlocations.Thesegroups,workingindependently,findsimilarglobaltemperatureincreasesovertheinstrumentalperiod,asillustratedinFigure2,whichisanimportantcheckoftheirreliability.Globaltemperaturerecordsareafrequentsubjectofcritiqueandcontroversy.Criticsclaimthatthesetemperaturerecordsareunreliablebecausetheunderlyingmeasurementsarepotentiallybiased,orhumanbiasesinanalysisskewtheresults.However,scientistsareconstantlyonthelookoutforpotentialsecondaryeffectsintroducingerrorinthedata.Towit,thedataprocessingsupportingthecurrentdatasetshavebeensubjecttosignificantscientificscrutinyandhavebeenrefinedwithsubsequentrevisionsofthesedataproducts.Theglobaltemperaturerecordsarerevisedasscientistsaccumulatenewobservations,newtypesoftemperaturedata,andimproveanalyticaltechniques.Theserevisionstypicallyinvolvesmallalterationstothedataprocessingtoolsthatcorrectbiasesintherawmeasurements.FigureQ1showsarecentexamplewiththeNOAAdataset,wheretheabsolutechangebetweensubsequentversionsofthetemperaturerecordaresmall.Italsoshows,however,thattheabsoluteeffectoftheprocessingoftherawmeasurementsisnoticeablebeforeabout1940,whendatawassparser.Aftercorrection,theglobaltemperaturerecordshowslesswarmingthannaivetreatmentofthemeasurementswouldindicate.
45NASAGoddardInstituteforSpaceStudies,https://data.giss.nasa.gov/gistemp/.46NOAANationalClimaticDataCenter,https://www.ncdc.noaa.gov/data-access/marineocean-data/noaa-global-surface-temperature-noaaglobaltemp.47HadleyCenterandUniversityofEastAnglia,https://crudata.uea.ac.uk/cru/data/temperature/.48BerkeleyEarth,http://berkeleyearth.org/land-and-ocean-data/.

19
FigureQ1:ComparisonsoftemperaturerecordsproducedbyNOAAshowtheeffectofdatarevisions.Panel(a)
comparestwosubsequentiterationsoftheNOAArecord,withthenewcorrectionstoitsdataprocessing.Panel(b)showsthedifferencebetweentheglobaltemperaturerecordwithnocorrectionsandtheNOAAcorrections.Source:Karletal.2015,Possibleartifactsofdatabiasesintherecentglobalsurfacewarminghiatus.Science.
Question2:Hasglobalwarmingstopped,paused,orsloweddown?Intheearlypartofthe21stcentury,globalaveragesurfacetemperatureincreasedmoreslowlythanithadoverthepreviousseveraldecades.Thiseventisreferredtoalternativelyastheglobalwarminghiatus,pause,orslowdown.SinceitoccurredatatimewhenatmosphericCO2wasgrowinginconcentration,andsotooitswarmingeffect,thewarmingslowdownhasledsometoquestionpredictionsofongoingandacceleratingwarming.Itisimportanttonotethatovertheearly21stcentury,globalwarming—energyaccumulationintheatmosphereandoceans—continued.Measurementsofoceantemperaturesandsatellitemeasurementsatthetopoftheatmosphereshowthatwarmingoftheclimatesystem,asawhole,hascontinued.49However,thesemeasurementscannotresolveconfidentlyifheataccumulationhasincreasedasaresultofhigherlevelsofCO2.Itisalsohardtoarguethatsurfacetemperaturedidnotincreaseintheearly21stcentury.However,therateofincreasewasslowerthanithadbeenoverthepastfewdecadesandwasalsoslowerthanhadbeenpredictedbyclimatemodels(byabouthalf,0.1°Cinsteadof0.2°C).50Understoodasadeparturefromexpectedwarming,theslowdownexistsdespitesome
49Johnsonetal.2016.50Fyfeetal.2016.

20
recentrevisionstosurfacetemperaturedatasetsthatshowmorewarmingoverthisperiodthanwehadpreviouslythought.51Overthelastfewyears,asubstantialbodyofresearchhashelpedscientistsunderstandwhyrealworldtemperaturedepartedfromwhatthemodelssuggestshouldhavebeenthecase.AcoolingphaseinthePacificOcean,drivenbystrongtradewindsbringingcoldwatertotheoceansurface,appearstobebehindmuchoftheslowdown.52Aseriesofsmallvolcaniceruptions,thatwerenotincludedinclimatemodels,alsoplayedaroleinreducingtheglobaltemperatureincreasesthatwemightotherwisehaveseen.53Atthispoint,thereislittleevidencethatthewarmingslowdownshouldlessenprojectionsoffuturewarming.Modelingstudiesshowthatwhensuchslowdownsareassociatedwithrandomvariationsonthepartoftheclimate,theydonotindicatelesswarmingthanmightbeexpectedoverthe21stcentury.54Itispossiblethatrevisionstofuturepredictionsmightbeappropriateinthefuture,butthatwouldrequirenotjustobservationsofawarmingslowdown,butatheoreticalunderstandingofwhysuchrevisionswouldbenecessary.Question3:Couldthesechangesbenatural?ThelargechangesinglobaltemperatureandatmosphericCO2fromdeepEarthhistoryprovethatnaturalchangesintheclimateshouldbeexpectedoverlongtimeperiods.Climatechangeonhumantimescales,season-to-seasonandyear-to-year,alsooccursforreasonsthathavenothingtodowithhumaninfluence.Ingaugingthehumaninfluenceonclimate,thestrongestconclusionsfromclimatescientistshavebeenforthelasthalf-centuryorso.Multiplestudiesfindthatmostofthewarmingoverthatperiodcanbechalkeduptohumaninfluence,becausesolarandvolcaniceffects,andthebiggestclimateoscillationsweremostlyneutraloverthatperiod.Additionally,thepatternoftemperatureincrease(globalchanges,largernearoverlandthanocean,concurrentwithoceanwarming)isinconsistentwiththetemperaturepatternsthataccompanytheknownsourcesofvariabilityonthescaleofhalfcenturies(highlatitudeoceans).Someexpertsarecriticaloftheconclusionthathumanactivitiesaretheprimarycauseofthemostrecentwarmingandarguethatitdiscountsplausiblealternativeexplanations.Thereareminorityconcernsthatnaturalvariabilitycouldaccountforasignificantfractionoftheobservedtemperatureincreaseandmainstreamclimatescienceisoverstatingtheroleofhumanactivitiesinrecentclimatechange.
51Karletal.2015;Hausfatheretal.2017.52KosakaandXie2014.;Englandetal.2014.53Schmidtetal.2014.54Englandetal.2015.

21
Onesetofconcernsholdsthatsomeunknownexternalfactor—excludedfromcomputerexperimentslikethoseshowninFigure4,andunaccountedforinstudiesofmodernclimatechange—hascontributedtotherecenttemperatureincrease.However,themajorexternalfactorsthatscientiststhinkhaveaffectedclimateoverthelate21stcenturyarealreadyincludedinsuchsimulations.Otherpotentialinfluenceshavebeenproposed,butnotproventobeimportanttoclimateoverthelate20thcentury.55Anothersetofconcernsholdsthatrandomoscillationsinclimatesystemcouldhavecausedasignificantamountofthemeasuredglobaltemperatureincrease.Suchlargeinternalvariability,moreover,isinconsistentwithobservationsandscientificunderstandingtodate.Internalvariabilityinclimatemodelsandstatisticalanalysesofhistoricalglobaltemperatureissmallerthanthewarmingobservedinthelate20thcenturyoverthesametimeperiods.Thechangeintemperatureoverthatperiodwasabout0.6°C.Whilethereisnotmuchconfidencethatclimatemodelshavetherightamountofinternalvariability,becauseoflimitedobservationalevidence,internalvariabilitywouldhavetobethreetimeslargerthaninthemodelstodisturbtheconclusionthathumaninfluencewastheleadingclimatedriveroverthelasthalf-century.56Nomechanismthatcouldprovidesuchlargevariability,butwouldhaveescapeddetectionoverthelastcentury,hasbeenarticulated.Question4:Aretheremeasurementsthatchallengethispicture?Despitetheapparentconsilienceofphysicalevidencesurroundingclimatechange,itisanaturalimpulse,andscientificobligation,toaskiftherearemeasurementsthatshowdifferentchangesthanexpectedormightrefutemodelpredictionsofclimatechange.Ifso,thenitisimportanttounderstandhowsuchmeasurementsmightcallustorevisefutureprojectionsorreexaminetheconsensusofscientificviewofclimatechange.Todate,theretrievaloftemperaturesbysatellitesarethemostsignificantdatasetsthatchallengemainstreaminterpretationofclimatewarming.Someexpertshavearguedthatsatellitedataofferafundamentalcritiqueofourpresentunderstandingofclimatechange,becausetheyshowmuchlesswarmingthanclimatemodelpredictions,andmayindicatetheneedtolowertemperatureprojectionsofclimatechange.57Thereisnotaagreement,however,overwhethersatellitetemperaturesactuallydorefutethepredictionsofclimatemodels;asalternativeexplanationsfortheapparentdisagreementhavebeencloselyexamined,otherpossibleexplanationshaveemerged.Sincethelate1970s,satelliteshavemeasuredradiationemittedbytheatmosphere.Inthe1990s,scientistsdevelopedmethodsforusingthesemeasurementstoestimatethe 55Solomon,NRC2007.56IPCCAR5Chapter10.57Christy,J.R.,2015:Testimony.Dataordogma?PromotingopeninquiryinthedebateoverthemagnitudeofhumanimpactonEarth’sclimate.HearinginfrontoftheU.S.SenateCommitteeonCommerce,Science,andTransportation,SubcommitteeonSpace,Science,andCompetitiveness(2015),http://docs.house.gov/meetings/SY/SY00/20160202/104399/HHRG-114-SY00-Wstate-ChristyJ-20160202.pdf.

22
temperatures.Theresultingdatasetsrepresentthetemperatureovertallbandsoftheatmosphere,severalmilesinheight,withlotsofuniformhorizontaldetail,butwitherrorsfromdriftsinsatelliteorbitandthecalibrationbetweensubsequentsatellitesmakingmeasurements.Thatisdistinctfromsurfacemeasurements,whichofferahighlevelofverticaldetail(temperatureat2metersabovethegroundoratthesurfaceoftheocean)butwithlimitedspatialcoverage,quality,andmeasurementtype.Bothkindsofdatarequiredataprocessingandscientificscrutinybeforeaddingtoourinformationaboutclimatechange.Earlier,flawed,versionsofsatellitetemperaturerecordsshowedslightcoolingoftheatmosphere,58aresultwildlyagainstmodelexpectationandsurfacemeasurementsofwarming.Subsequentrevisionshavemadethesemeasurementslessdiscordantwithotherevidenceofclimatechange,butthereisstillafairlygoodbodyofevidenceclimatemodelsshowlargertemperatureincreasesthanthesatellites.Whetherthatdifferenceisagainstexpectationorindicatesaproblemwithclimatemodelsortheorydependsonstatisticaltestsandphysicalinterpretation.FigureQ2showsdifferentvisualcomparisonsofatmospherictemperaturesfromsatellitesandcomputermodels.Thecasualreadercouldjustifiablyseeamodelingfailureorrelativecoherencebetweenmodelsandsatellitedatafrominterpretingthesegraphicsinisolation.Thewaythedifferentlinesareplottedagainsteachotheryieldsverydifferentqualitativeinterpretations.Iftheintentistounderstandifthesatellitemeasurementsarevastlydifferentfromclimatemodels,thenquantitativeanalysisisnecessary.
FigureQ2:Twocomparisonsofatmospherictemperaturesmeasuredfromsatelliteswithcomputermodelsimulations.Thechartontheleftshowstheaveragepredictionof102computermodelsimulationsagainst
averagesofsatelliteandweatherballoondatasets.Thechartontherightshowstheaveragecomputermodelinblackwithagreyconfidenceintervalagainsttheaverageofsatellitedatainpurple.Datasetversionsanddetailsvarybetweenthetwocharts,butthedifferencebetweenthetwoshowshowgraphicaldesigncaninfluence
perception.ThechartontheleftcomesfromCongressionaltestimonyandwasnotformallypeerreviewed,whilethechartontherightisexcerptedfromapeer-reviewedjournalarticle.
58SpencerandChristy1990

23
Therearethreeresearchgroupsthatproducesatellitetemperaturerecordsforthewholeglobe.Onaverage,theyshowthatclimatemodelshavewarmedfasterthanobservationsintheloweratmosphere.59However,theydonotagreeifthatdifferenceisstatisticallysignificant,giventherangeinwarmingsprojectedbyclimatemodels.60Withoutstrongagreementonstatisticalsignificancebetweendifferentscientificinterpretationsofsatellitedata,itishardtodrawastrongconclusionthatthesemeasurementsareanindictmentofourunderstandingofclimatechange.Evenwithoutstatisticalsignificance,differentinterpretationsmightexplainfasterwarminginclimatemodelprojections.Thelistissimilartothesetoffactorsthatcouldinfluencetheglobalwarmingslowdownincluding,modelsbeing,onaverage,toosensitivetoenhancedCO2warmingisonepossibility.Othercandidatesincludetheclimatemodelsmisrepresenting,byaccidentofexperimentaldesign,thetruesolarintensityandvolcanicactivityoftheearly21stcenturyornaturalvariability(theslowdownintheearly21stcentury)thatreducedwarmingintherealworld,commonerrorsinthesatellitedataproducts,orsomecombinationofthesethings.Thesearchformeasurementsthatruncontrarytothestandingviewonclimatechangeisongoing,asamatterofscientificdisciplineandasweenteratimewhentheexpectedsignalsofclimatechangeshouldbedetectableabovenaturalvariabilityinmanypartsoftheclimate.Satellitedata,inparticular,havehistoricallyconfrontedclimatesciencewithquestionsaboutthetruetemperaturetrendsintheatmosphereandthebasicphysicalunderstandingpredictingthatincrease.However,recentdevelopmentsinthescientificliteratureandrepeatedstudieshaveleadustoabetterunderstandingoftheflawsinearlyprocessingofsatellitedataandanincreasingreconciliationwithclimatemodelsandtheory.Detailsandrefinementswillcontinuetobeworkedout,butdonotappeartofundamentallychallengethepictureofdevelopedbyclimatechangescience.
59Christytestimonyfrom2015.60Santeretal.2016.

24
Question5:Areclimatemodelprojectionstoohot?Basictheoryandfundamentalunderstandinghelpusunderstandthatglobalwarmingwillcontinueinthe21stcentury.Butclimatemodelsimulationshelpusidentifyhowmuchwarmingwemightexpectinthefutureandhowmuchotherclimatevariableslikesealevelwillchange.Thedegreeofclimatesensitivityiscentraltothepredictionsofclimatechange.Whiletherangeofsensitivityfoundinclimatemodelsissimilartothevaluesthatcomefromotherlinesofevidence,1.5-4.5°CforadoublingofatmosphericCO2,somearguethattheseestimatesaretoohigh.Inrecentyears,aseriesofstudiesthatcomparedthemeasuredchangeinglobalaveragetemperaturewiththeincreaseinCO2foundlowervaluesofclimatesensitivitythantheaverageclimatemodelsimulates;forequilibriumclimatesensitivitythesestudiestypicallysuggestvaluesthatarelessthan2°C.61Thishasledsometoarguethatprojectionsoffutureclimatechangeshouldbereviseddownward.62TheconclusionthattherealworldismuchlesssensitivetoCO2emissionsthanclimatemodelshasbeendirectlychallengedbyrecentstudiesshowingthatcomparingthedata-basedmethodswithclimatemodelswasfraughtwithinadequatetreatmentofstatisticsandexaminationofthesensitivityoftheirassumptions.Thedata-basedmethodsinquestionusehistoricaltemperaturerecordsasaninput,calculatingthesensitivityofclimatebycomparingthedifferencebetweenCO2warmingeffectsearlyandlateintherecordsandthechangeinglobaltemperature.Thatcomparisonmaybebiasedtowardtoolowvalues,becauseglobaltemperaturerecordspoorlyrepresentchangesintheArcticandrecordchangesinseasurfacetemperatureinsteadofthefasterwarmingairabovethesealevel.Whenthoseerrorsarecompensatedfor,byappropriatelysamplingclimatemodelstoreflecttheactualtemperaturerecord,thereisnostatisticallysignificantdifferenceintheestimatesofclimatesensitivitythatcomefromdataandmodels.63Additionally,thereissomeevidencethatthemethodsusedtoestimateclimatesensitivityfromdatadonotproperlyaccountforotherexternalfactorsthatinfluenceclimatechange.ThecoolingeffectfrompollutionintheNorthernHemispheremighthavethesamecoolingeffect,globallyaveraged,asadeclineinsolarintensity,butdifferentoutcomesintermsofglobaltemperature.Studiesthatareabletodistinguishthesefactorsarerare,butwhenthosefactorsarebroughtintoaccount,theaverageclimatesensitivityfromdata-basedmethodsiswellinsidetheIPCCrange.64 Ithasprovendifficultforscientiststonarrowthewiderangeofvaluesforclimatesensitivitybecauseoflimitsintherecordsofpastchangesandtherelativeinfluenceofdifferentclimate 61Fortwoexamples,seeOttoetal.2013;LewisandCurry2015.62Lewis,NicholasandCrok,Marcel.“ASensitiveMatter:HowtheIPCCburiedevidenceshowinggoodnewsaboutglobalwarming,”TheGlobalWarmingPolicyFoundationReport13(2014),http://www.thegwpf.org/content/uploads/2014/03/A-Sensitive-Matter-download.pdf.63Richardsonetal.2016.64Marveletal.2015.
25
agents.Differentlinesofevidence(e.g.,basicphysics,comparisonstopasticeages,andthetemperatureresponsetohumaninfluence)stronglyrefutesensitivitiesmuchhigherorlowerthantheIPCC.However,viewingonlyonetypeofevidenceinisolationcanleadtologicalerrorswhendifferentlinesofevidencerefuteveryhighandverylowvalues,forinstance.65Toconvincinglyrefineourestimatesofclimatesensitivitywilllikelyrequirebothbreakthroughsinclimatephysics(particularly,abetterunderstandingofhowcloudcoverwillacttoaccentuateorreducetemperaturetrends66)andenoughtimetopassthatwecanaccumulatemorehigh-qualitymeasurementsofthereal-worldresponsetotoday’sclimatedrivers.Bothoutcomeslikelylieacoupledecadeshence;67untilthendecisionswillhavetobemadewithsomeambiguityinthepotentialclimateresponse.
65Stevensetal.2016.66Sherwoodetal.2014.67Urbanetal.2014.

26
ConclusionClimatesciencebeganwiththediscoveryofbasicphysicalandchemicalprinciplesoftheEarthsystemandthedesiretounderstandthelargechangesinthepastevidencedinthegeologicalrecord.Theclimatechangesofthepastprovideafoundationforunderstandingwhatmightbeinstoreinourfuture.Indeed,iftheclimatehadbeenrelativelystableinthepast,despitesimilarchangesinatmosphericCO2concentrationsorotherclimateagents,therewouldbelesscallforconsideringthepotentialrisksofhumanactivities.However,theresponsetohumanactivitiesthatisalreadyapparentreinforcestheideathathumanactivitieshavehadasignificantclimateeffect.ThereislittledoubtthathumanactivitieshaveincreasedtheamountofCO2andothergreenhousegasesintheatmosphere.Likewise,thereislittledoubtthatthishashadanoticeableeffectontheclimate—andthereforetheweather,sealevel,andotherphysicalandchemicalconditions.Measurementsofthesechangespaintamostlyconsistentpictureandstronglyimplicatehumanactivitiesasthelargestsingledriverofchangeoverthelastcentury.Lookingforward,thepotentialforhumanemissionstoadd1-3°Ctoglobaltemperaturesinthenextcenturyisconsistentwithwhatweknowfrombasicphysics,pastclimatechange,andclimatemodels.Thefindingsthatlargechangestotheclimatewillcreaterisksforhumansandnaturearealsonotparticularlyunderdebate.Evaluationsoftherisksassociatedwithclimatechangesuggestthattheywillincreasedramaticallyastheglobalaveragetemperatureapproachesandthenexceeds2°Cofwarmingoverthepreindustrialaverage.Whileitisnotexactlyclearhowsocietyorecologicalsystemswouldrespondtothoseeffects,standingwisdomsaysitwillbenearthatpointthattheywillprobablybecomewidespread,easilydistinguishablefromhistoricalvariability,andlargelyirreversible.Withinpublicpolicydebates,theactivequestionsareoverwhetherornotwehavesufficientskilltomeasureandinterpretchangesnowandprojectchangesinthefuture.Thesearerelatedtohowlargetherisksofclimatechangereallymightbelaterinthiscentury.Inparticular,therearefairquestionsaboutthevalueofclimatesensitivityandhowmuchwarmingweshouldexpectoverthecomingcenturygivenanyemissionspathway.Butevenatthelowestreasonablevaluesforclimatesensitivity,therelationshipbetweentotalCO2emissionsandtemperatureexplainswhythescopeoffutureclimatechange,andtheassociatedrisks,arepotentiallysolargeandthesenseofurgencyfromclimateadvocatessostrong.Centralvaluesofclimateresponsesaythatwewillachieve“dangerous”warmingwithinafewdecades.Butevenifthesensitivitytoemissionsisonthelowerend,totaltemperatureincreaseswillbesufficienttointroducesignificantrisksbythesecondhalfofthecenturyunderalmostanyemissionsscenario.

27
ScientificReferencesArcher,David,etal."Atmosphericlifetimeoffossilfuelcarbondioxide."AnnualReviewofEarthandPlanetarySciences37(2009):117-134.Annan,J.D.,andJ.C.Hargreaves."AnewglobalreconstructionoftemperaturechangesattheLastGlacialMaximum."ClimateofthePast9.1(2013):367-376.ArcherandPierrehumbert(eds).TheWarmingPapers:TheScientificFoundationfortheClimateChangeForecast,Wiley-Blackwell(2011).England,MatthewH.,etal."Recentintensificationofwind-drivencirculationinthePacificandtheongoingwarminghiatus."NatureClimateChange4.3(2014):222-227.England,MatthewH.,JulesB.Kajtar,andNicolaMaher."Robustwarmingprojectionsdespitetherecenthiatus."NatureClimateChange5.5(2015):394.Fyfe,JohnC.,etal."Makingsenseoftheearly-2000swarmingslowdown."NatureClimateChange6.3(2016):224-228.Ganopolski,Andrey,RicardaWinkelmann,andHansJoachimSchellnhuber."Criticalinsolation-CO2relationfordiagnosingpastandfutureglacialinceptionThepastrapidgrowthofNorthernHemisphere."(2016).Hausfather,Zeke,etal."Assessingrecentwarmingusinginstrumentallyhomogeneousseasurfacetemperaturerecords."ScienceAdvances3.1(2017):e1601207.Hegerl,Gabriele,andFrancisZwiers."Useofmodelsindetectionandattributionofclimatechange."Wileyinterdisciplinaryreviews:climatechange2.4(2011):570-591.Huber,Markus,andRetoKnutti."AnthropogenicandnaturalwarminginferredfromchangesinEarth/'senergybalance."NatureGeoscience5.1(2012):31-36.Johnson,GregoryC.,JohnM.Lyman,andNormanG.Loeb."ImprovingestimatesofEarth'senergyimbalance."NatureClimateChange6.7(2016):639-640.Karl,ThomasR.,etal."Possibleartifactsofdatabiasesintherecentglobalsurfacewarminghiatus."Science348.6242(2015):1469-1472.Kopp,RobertE.,etal."Temperature-drivenglobalsea-levelvariabilityintheCommonEra."ProceedingsoftheNationalAcademyofSciences(2016):201517056.

28
Kosaka,Yu,andShang-PingXie."ThetropicalPacificasakeypacemakerofthevariableratesofglobalwarming."NatureGeoscience9.9(2016):669-673.Lewis,Nicholas,andJudithA.Curry."TheimplicationsforclimatesensitivityofAR5forcingandheatuptakeestimates."Climatedynamics45.3-4(2015):1009-1023.Marcott,ShaunA.,etal."Areconstructionofregionalandglobaltemperatureforthepast11,300years."Science(2013):1198-1201.Marotzke,Jochem,etal."Climateresearchmustsharpenitsview."NatureClimateChange(2017).Marvel,Kate,etal."Implicationsforclimatesensitivityfromtheresponsetoindividualforcings."NatureClimateChange6.4(2016):386-389.Oreskes,Naomi."Thescientificconsensusonclimatechange:howdoweknowwe’renotwrong?"Climatechange:Whatitmeansforus,ourchildren,andourgrandchildren(2007):65-99.Otto,Alexander,etal."Energybudgetconstraintsonclimateresponse."NatureGeoscience6.6(2013):415-416.Richardson,Mark,etal."ReconciledclimateresponseestimatesfromclimatemodelsandtheenergybudgetofEarth."NatureClimateChange(2016).Ruddiman,William,etal."Doespre-industrialwarmingdoubletheanthropogenictotal?."TheAnthropoceneReview1.2(2014):147-153.Santer,BenjaminD.,etal."ComparingTroposphericWarminginClimateModelsandSatelliteData."JournalofClimate30.1(2017):373-392.Schmidt,GavinA.,DrewT.Shindell,andKostasTsigaridis."Reconcilingwarmingtrends."NatureGeoscience7.3(2014):158-160.Sherwood,StevenC.,SandrineBony,andJean-LouisDufresne."Spreadinmodelclimatesensitivitytracedtoatmosphericconvectivemixing."Nature505.7481(2014):37-42.Spencer,R.W.andJ.R.Christy.1990.Precisionmonitoringofglobaltemperaturetrendsfromsatellites.Science,247,1558-1562.Stevens,Bjorn,etal."ProspectsforNarrowingBoundsonEarth'sEquilibriumClimateSensitivity."Earth'sFuture(2016).

29
Urban,NathanM.,etal."Historicalandfuturelearningaboutclimatesensitivity."GeophysicalResearchLetters41.7(2014):2543-2552.

30
AbouttheAuthor
JosephMajkutisthedirectorofclimatescienceattheNiskanenCenter.Hisscientificresearchbackgroundisinclimatechange,theglobalcarboncycle,andclimatepolicyanalysis.BeforejoiningtheNiskanenCenter,heworkedonCapitolHillasaCongressionalScienceFellowinaprogramadministeredbytheAmericanAssociationfortheAdvancementofScience.
Acknowledgements
Kindregardsandthankstoseveralwhoreadearlydraftsofthisworkandprovidedhelpfulfeedback,includingKerryEmmanuel,MikeMcCracken,andJerryTaylor.Allremainingerrorsaremine.