nisource statistical summary book 2005
TRANSCRIPT


page 1
Gas Distribution
• Approximately 450,000 customers in Northern Indiana• Sales = Approximately 18,000 GWh annually
Gas
Transmission & Storage
• 3.3 million customers in 9 states• Approximately 57,000 miles of distribution pipeline• Customer choice in all states• Vertical integration with transmission/ storage in major gas markets
• Approximately 16,000 miles of pipeline in 19 jurisdictions• One of the largest natural gas storage networks (Approx. 646 Bcf)• Prime footprint to East Coast markets• Current pipeline and storage projects include Millennium Pipeline, Hardy Storage, Eastern Market Expansion, Appalachian Basin Expansion and East Lateral Expansion.
• NiSource Energy Technologies (Distributed Generation)• Whiting Clean Energy (525 MW combined-cycle cogeneration facility capable of producing 2.2M lbs./hr. of process steam)
Electric Other
Electric Distribution
Generation
Other Operations
• Owns and has the ability to operate 3,392 MW of generation capacity -3,059 MW coal-fired -323 MW gas-fired -10 MW hydroelectric • Wholesale Power Sales• SO2 and NOx Compliant
The NiSource Portfolio
3rd LargestGas Distribution
Company in the U.S.
4th LargestGas Pipeline
Company in the U.S.
One of the LargestGas Storage Networks
in the U.S.
Mid Size RegionalElectric Business
Phase IMillennium Pipeline

NiSource Inc.
NiSource is an energy holding company whose subsidiaries provide natural gas, electricity and other productsand services to approximately 3.8 million customers located within a corridor that runs from the Gulf Coastthrough the Midwest to New England.
NiSource’s business segments are: Gas Distribution Operations; Gas Transmission and Storage Operations;Electric Operations; and Other Operations.
Business SegmentsGas Distribution OperationsNiSource’s natural gas distribution operations serve more than 3.3 million customers in 9 states and operate over 57thousand miles of pipeline. Through its wholly owned subsidiary, Columbia, NiSource owns five distributionsubsidiaries that provide natural gas to approximately 2.2 million residential, commercial and industrial customers inOhio, Pennsylvania, Virginia, Kentucky and Maryland. NiSource also distributes natural gas to approximately 789thousand customers in northern Indiana through three subsidiaries: Northern Indiana, Kokomo Gas and NorthernIndiana Fuel and Light. Additionally, NiSource’s subsidiaries Bay State and Northern Utilities distribute natural gas tomore than 338 thousand customers in Massachusetts, Maine and New Hampshire.
Gas Distribution Operations subsidiaries own and operate a total of 56,642 miles of pipelines and certain relatedfacilites. This includes: (i) for the five distribution subsidiaries of its Columbia Energy Group system, 34,444 miles ofpipelines, 1,350 reservoir acres of underground storage, eight storage wells and one compressor station with 800horsepower (hp) of installed capacity, (ii) for its Northern Indiana system, 14,690 miles of pipelines, 27,129 reservoiracres of underground storage, 82 storage wells and two compressor stations with a total of 6,000 hp of installedcapacity, (iii) for its Bay State Gas Company system, 5,774 miles of pipelines, (iv) for its Northern Indiana Fuel and Lightsystem, 935 miles of pipelines, and (v) for its Kokomo Gas system 799 miles of pipelines. The physical properties of theNiSource gas utilities are located throughout Ohio, Indiana, Pennsylvania, Virginia, Kentucky, Maryland, Massachusetts,Maine and New Hampshire.
Gas Transmission and Storage OperationsNiSource’s Gas Transmission and Storage Operations subsidiaries own and operate approximately 16 thousand milesof interstate pipelines and operate one of the nation’s largest underground natural gas storage systems capable ofstoring approximately 646 Bcf of natural gas. Through its subsidiaries, Columbia Transmission, Columbia Gulf,Crossroads Pipeline and Granite State Gas, NiSource owns and operates an interstate pipeline network extending fromoffshore in the Gulf of Mexico to Lake Erie, New York and the eastern seaboard. Together, these companies servecustomers in 19 northeastern, mid-Atlantic, midwestern and southern states and the District of Columbia.
Columbia Gas Transmission Corporation has 870,058 reservoir acres of underground storage, 3,549 storage wells,11,480 miles of interstate pipelines and 87 compressor stations with 592,904 hp of installed capacity. These operationsare located in Delaware, Kentucky, Maryland, New Jersey, New York, North Carolina, Ohio, Pennsylvania, Virginia andWest Virginia. Columbia Gulf has 4,130 miles of transmission pipelines and 13 compressor stations with 465,884 hp ofinstalled capacity. Columbia Gulf’s operations are located in Kentucky, Louisiana, Mississippi, Tennessee, Texas,Wyoming, and the offshore Gulf of Mexico. Granite State Gas has 82 miles of transmission pipeline with operationslocated in Maine, Massachusetts and New Hampshire. Crossroads Pipeline has 202 miles of transmission pipeline andone compressor station with 3,000 hp of installed capacity. Crossroads Pipeline’s operations are located in Indiana andOhio.
The Gas Transmission and Storage Operations subsidiaries are engaged in several projects that will expand theirfacilities and throughput. The largest such project is the proposed Millennium Pipeline. The Millennium Pipeline is aproject proposed by a partnership of energy companies including Columbia Transmission, which would replace partsof an existing Columbia Transmission pipeline. Another project is Hardy Storage, a Columbia Transmission partnershipto develop a storage field in West Virginia to provide additional natural gas storage for the eastern United States.Columbia Transmission recently held open seasons for two additional projects, the central and southern Virginiaexpansion and the Eastern Market expansion. Market interest for both projects was encouraging and ColumbiaTransmission has signed precedent agreements with four East Coast customers for the Eastern Market expansion.Customer negotiations are ongoing for the central and southern Virginia expansion. Columbia Transmission currentlyanticipates filing appropriate regulatory applications during 2006.
Electric OperationsNiSource generates and distributes electricity through its subsidiary Northern Indiana to approximately 450 thousandcustomers in 21 counties in the northern part of Indiana and engages in wholesale and wheeling transactions. Northern
page 2

page 3
Indiana owns and has the ability to operate four coal-fired electric generating stations with a net capability of 3,059 mw, sixgas-fired generating units with a net capability of 323 mw and two hydroelectric generating plants with a net capability of10 mw. These facilities provide for a total system net capability of 3,392 mw.
In January 2002, Northern Indiana indefinitely shut down its Mitchell Station. Northern Indiana now operates three coal-fired generation stations with a net capacity of 2,574 mw, six gas-fired generating units with a net capacity of 323 mw andtwo hydroelectric plants with a net capability of 10 mw. During the year ended December 31, 2005, Northern Indianagenerated 87.1% and purchased 12.9% of its electric requirements. Northern Indiana periodically reviews options to meetthe electric needs of its customers.
Northern Indiana has 291 substations with an aggregate transformer capacity of 23,182,800 kilovolt-amps. Its transmissionsystem, with voltages from 34,500 to 345,000 volts, consists of 3,184 circuit miles of line. Northern Indiana isinterconnected with five neighboring electric utilities. The electric distribution system extends into 21 counties and consistsof 7,739 circuit miles of overhead and 1,940 cable miles of underground primary distribution lines operating at variousvoltages from 2,400 to 12,500 volts. Northern Indiana has distribution transformers having an aggregate capacity of12,426,163 kilovolt-amps and 471,936 electric watt-hour meters.
Other OperationsThe Other Operations segment participates in energy-related services including gas marketing, power trading andventures focused on distributed power generation technologies, including a cogeneration facility, fuel cells and storagesystems. PEI operates the Whiting Clean Energy project at BP’s Whiting, Indiana refinery, which is a 525 mwcogeneration facility that uses natural gas to produce electricity for sale in the wholesale markets and also providessteam for industrial use. Additionally, the Other Operations segment is involved in real estate and other businesses.
Business StrategyNiSource focuses its business strategy on its core, rate-regulated asset-based businesses with virtually 100% of itsoperating income generated from the rate-regulated businesses. With the nation’s fourth largest natural gas pipeline,the largest natural gas distribution network east of the Rocky Mountains and one of the nation’s largest natural gasstorage networks, NiSource operates throughout the energy-intensive corridor that extends from the supply areas inthe Gulf Coast through the consumption centers in the Midwest, Mid-Atlantic, New England and Northeast. Thiscorridor includes 30% of the nation’s population and 40% of its energy consumption. NiSource continues to position itsassets to meet the corridor’s growing energy needs.
Regulated Gas
Distribution37%
Regulated Electric
Operations29%
RegulatedGas Transmission
& Storage34%
Business SegmentsOperating Income
• Bay State Gas Co.• Columbia Gas of Kentucky• Columbia Gas of Maryland• Columbia Gas of Ohio• Columbia Gas of Pennsylvania• Columbia Gas of Virginia• Columbia Gas Transmission• Columbia Gulf Transmission• Crossroads Pipeline• Granite State Gas Transmission• Kokomo Gas and Fuel Co.• Northern Indiana Fuel & Light Co.• Northern Indiana Public Service Co.• Northern Utilities• Whiting Clean Energy
Primary Subsidiaries

page 4
Contents
FINANCIAL
Consolidated Financial Data and Ratios.......................................................................................................5Statements of Consolidated Income .............................................................................................................6Consolidated Balance Sheets ........................................................................................................................7Statements of Consolidated Cash Flows ......................................................................................................9Statements of Consolidated Capitalization ................................................................................................10Statements of Consolidated Long-Term Debt ............................................................................................11Income Taxes ..................................................................................................................................................12Statements of Consolidated Common Stockholders’ Equity and Comprehensive Income................13Current Security and Bond Ratings.............................................................................................................15
STOCKHOLDERS
Common Stockholders — State...................................................................................................................16Common Stockholders...................................................................................................................................16
BUSINESS SEGMENTS
Gas Distribution Statistics.............................................................................................................................17Gas Distribution Customers and Throughput Statistics by State .......................................................18
Gas Transmission and Storage Operations................................................................................................19Electric Operations.........................................................................................................................................20
Electric Generation and Production Statistics ......................................................................................21Fuel for Electric Generation......................................................................................................................22Capacity and Operating Margins.............................................................................................................23
Glossary of Selected Energy Terms.............................................................................................................24Board of Directors and NiSource Executive Team .......................................................inside back coverShareholder Information/Contacts..............................................................................................back cover

FINA
NC
IAL
page 5
FIN
AN
CIA
L
Consolidated Financial Data and RatiosYear Ended December 31, (in millions, except per share amounts) 2005 2004 2003 2002 2001
Return on average common equity 6.3% 9.5% 2.0% 9.7% 6.3%Times interest earned (pre-tax) 2.16 2.51 2.31 2.04 1.47Dividends paid per share 0.92 0.92 1.10 1.16 1.16Dividend payout ratio 81.4% 55.8% 333.3% 65.5% 110.5%Market values during the year:
High 25.50 22.82 21.97 24.99 32.55Low 20.44 19.65 16.39 14.51 18.25Close 20.86 22.78 21.94 20.00 23.06
Book value of common stock 18.09 17.69 16.81 16.78 16.72Market-to-book ratio at year end 115.3% 128.8% 130.5% 119.2% 137.9%Total Assets 17,958.5 16,987.8 16,623.5 17,941.8 17,893.7Capital Expenditures 590.4 517.0 574.2 531.9 525.3Capitalization
Common stockholders’ equity 4,933.0 4,787.1 4,415.9 4,174.2 3,469.4Preferred and preference stock 81.1 81.1 81.1 84.9 88.6Company-obligated mandatorily redeemable preferred
securities of subsidiary trust holding solely Company debentures — — — 345.0 345.0Long-term debt 5,271.2 4,835.9 5,993.4 4,849.5 6,065.1
Total Capitalization 10,285.3 9,704.1 10,490.4 9,453.6 9,968.1Number of employees 7,822 8,628 8,614 9,307 12,501Operating Income (Loss)
Gas Distribution Operations $ 368.2 $ 441.2 $ 506.4 $ 459.1 $ 380.8Gas Transmission and Storage Operations 344.4 363.1 398.8 398.3 349.3Electric Operations 293.3 309.5 267.5 322.3 340.7Other Operations (12.2) (30.9) (41.9) (41.3) (39.9)Corporate (40.9) (5.4) (8.5) 15.6 (61.1)Consolidated $ 952.8 $ 1,077.5 $ 1,122.3 $ 1,154.0 $ 969.8
Depreciation and AmortizationGas Distribution Operations $ 224.6 $ 194.6 $ 190.2 $ 189.2 $ 228.8Gas Transmission and Storage Operations 114.1 114.2 111.4 109.4 161.4Electric Operations 185.9 178.1 175.1 172.2 166.8Other Operations 11.6 12.1 9.9 8.9 7.3Corporate 9.0 9.6 9.1 10.1 11.0Consolidated $ 545.2 $ 508.6 $ 495.7 $ 489.8 $ 575.3
AssetsGas Distribution Operations $ 6,917.5 $ 6,332.2 $ 6,096.4 $ 5,895.9 $ 5,329.6Gas Transmission and Storage Operations 3,082.3 3,053.3 2,920.4 2,940.1 2,911.8Electric Operations 3,189.0 3,114.2 3,079.7 3,041.9 2,816.4Other Operations 1,683.5 1,467.7 1,411.8 1,724.2 1,579.4Corporate 3,086.2 3,020.4 3,115.2 4,339.7 5,256.5Consolidated $17,958.5 $16,987.8 $16,623.5 $17,941.8 $17,893.7
Capital ExpendituresGas Distribution Operations $ 283.5 $ 226.7 $ 193.5 $ 196.4 $ 209.9Gas Transmission and Storage Operations 153.7 130.4 126.7 128.0 136.0Electric Operations 132.8 159.5 224.1 197.8 133.3Other Operations 6.2 (8.2) 18.9 5.3 46.1Corporate 14.2 8.6 11.0 4.4 —Consolidated $ 590.4 $ 517.0 $ 574.2 $ 531.9 $ 525.3
In 2002, NiSource discontinued the amortization of goodwill consistent with SFAS No. 142.

FIN
AN
CIA
L
page 6
FINA
NC
IAL
page 6
Statements of Consolidated IncomeYear Ended December 31, (in millions, except per share amounts) 2005 2004 2003 2002 2001
Net RevenuesGas Distribution $4,600.4 $3,801.8 $3,554.5 $2,890.4 $3,849.9Gas Transmission and Storage 1,000.0 1,013.4 1,033.5 1,014.1 997.1Electric 1,248.6 1,121.0 1,115.9 1,103.6 1,060.2Other products and services 1,050.1 725.3 538.1 307.1 358.7Gross Revenues 7,899.1 6,661.5 6,242.0 5,315.2 6,265.9Cost of Sales 4,749.3 3,609.7 3,185.6 2,248.8 3,143.8
Total Net Revenues 3,149.8 3,051.8 3,056.4 3,066.4 3,122.1Operating Expenses
Operation and maintenance 1,328.3 1,203.6 1,177.5 1,180.3 1,303.0Depreciation and depletion 545.2 508.6 495.7 489.8 575.3Loss (gain) on sale or impairment of assets 22.2 (3.1) (24.9) (27.5) (0.1)Other taxes 301.3 265.2 285.8 269.8 274.1
Total Operating Expenses 2,197.0 1,974.3 1,934.1 1,912.4 2,152.3Operating Income 952.8 1,077.5 1,122.3 1,154.0 969.8Other Income (Deductions)
Interest expense, net (421.0) (403.9) (464.7) (516.4) (592.0)Minority interests — — (2.5) (20.4) (20.4)Preferred stock dividends of subsidiaries (4.2) (4.4) (4.5) (6.7) (7.5)Other, net 14.0 7.3 15.3 8.3 9.6Loss on early extinguishment of long-term debt (108.6) (4.1) (4.1) — —
Total Other Income (Deductions) (519.8) (405.1) (460.5) (535.2) (610.3)Income From Continuing Operations Before Income Taxes
and Cumulative Effect of Change in Accounting 433.0 672.4 661.8 618.8 359.5Income Taxes 149.4 241.4 234.9 219.6 167.4Income From Continuing Operations Before Cumulative Effect of
Change in Accounting 283.6 431.0 426.9 399.2 192.1Income (Loss) from Discontinued Operations — net of taxes (20.3) 5.3 (1.7) 17.1 20.1Gain (Loss) on Disposition of Discontinued Operations —
net of taxes 43.5 — (331.2) (43.8) —Income Before Change in Accounting Principle 306.8 436.3 94.0 372.5 212.2Cumulative Effect of Change in Accounting — net of taxes (0.3) — (8.8) — 4.0Net Income $ 306.5 $ 436.3 $ 85.2 $ 372.5 $ 216.2Basic Earnings (Loss) Per Share ($)
Continuing operations $ 1.05 $ 1.63 $ 1.64 $ 1.89 0.93Discontinued operations 0.08 0.02 (1.28) (0.12) 0.10Change in accounting principles — — (0.03) — 0.02
Basic Earnings Per Share $ 1.13 $ 1.65 $ 0.33 $ 1.77 $ 1.05Diluted Earnings (Loss) Per Share ($)
Continuing operations $ 1.04 $ 1.62 $ 1.63 $ 1.88 $ 0.91Discontinued operations 0.08 0.02 (1.27) (0.13) 0.10Change in accounting — — (0.03) — 0.02
Diluted Earnings Per Share $ 1.12 $ 1.64 $ 0.33 $ 1.75 $ 1.03
Dividends Declared Per Common Share $ 0.92 $ 0.92 $ 1.10 $ 1.16 $ 1.16Basic Average Common Shares Outstanding (millions) 271.3 263.7 259.6 211.0 205.3Diluted Average Common Shares (millions) 273.0 265.5 261.6 212.8 209.8
FINA
NC
IAL
page 7
FIN
AN
CIA
L
page 7
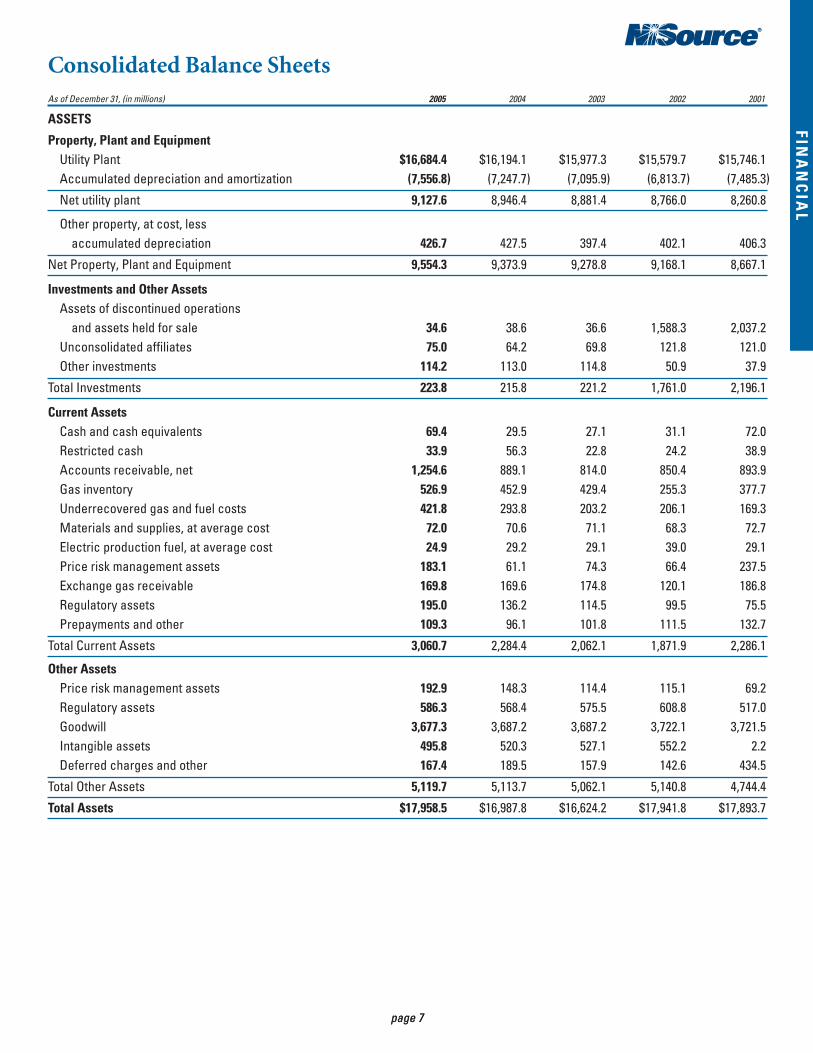
Consolidated Balance SheetsAs of December 31, (in millions) 2005 2004 2003 2002 2001
ASSETS
Property, Plant and EquipmentUtility Plant $16,684.4 $16,194.1 $15,977.3 $15,579.7 $15,746.1Accumulated depreciation and amortization (7,556.8) (7,247.7) (7,095.9) (6,813.7) (7,485.3)
Net utility plant 9,127.6 8,946.4 8,881.4 8,766.0 8,260.8
Other property, at cost, less accumulated depreciation 426.7 427.5 397.4 402.1 406.3
Net Property, Plant and Equipment 9,554.3 9,373.9 9,278.8 9,168.1 8,667.1
Investments and Other AssetsAssets of discontinued operations
and assets held for sale 34.6 38.6 36.6 1,588.3 2,037.2Unconsolidated affiliates 75.0 64.2 69.8 121.8 121.0Other investments 114.2 113.0 114.8 50.9 37.9
Total Investments 223.8 215.8 221.2 1,761.0 2,196.1
Current AssetsCash and cash equivalents 69.4 29.5 27.1 31.1 72.0Restricted cash 33.9 56.3 22.8 24.2 38.9Accounts receivable, net 1,254.6 889.1 814.0 850.4 893.9Gas inventory 526.9 452.9 429.4 255.3 377.7Underrecovered gas and fuel costs 421.8 293.8 203.2 206.1 169.3Materials and supplies, at average cost 72.0 70.6 71.1 68.3 72.7Electric production fuel, at average cost 24.9 29.2 29.1 39.0 29.1Price risk management assets 183.1 61.1 74.3 66.4 237.5Exchange gas receivable 169.8 169.6 174.8 120.1 186.8Regulatory assets 195.0 136.2 114.5 99.5 75.5Prepayments and other 109.3 96.1 101.8 111.5 132.7
Total Current Assets 3,060.7 2,284.4 2,062.1 1,871.9 2,286.1
Other AssetsPrice risk management assets 192.9 148.3 114.4 115.1 69.2Regulatory assets 586.3 568.4 575.5 608.8 517.0Goodwill 3,677.3 3,687.2 3,687.2 3,722.1 3,721.5Intangible assets 495.8 520.3 527.1 552.2 2.2Deferred charges and other 167.4 189.5 157.9 142.6 434.5
Total Other Assets 5,119.7 5,113.7 5,062.1 5,140.8 4,744.4
Total Assets $17,958.5 $16,987.8 $16,624.2 $17,941.8 $17,893.7

FIN
AN
CIA
L
page 8
FINA
NC
IAL
page 8
Consolidated Balance SheetsAs of December 31, (in millions) 2005 2004 2003 2002 2001
CAPITALIZATION AND LIABILITIESCapitalization
Common stock equityCommon stock — $0.01 par value, 400,000,000
shares authorized; 272,622,905; 270,625,370; 262,630,409; 248,860,178; and 207,492,260 shares issued and outstanding, respectively $ 2.7 $ 2.7 $ 2.6 $ 2.5 $ 2.1
Additional paid-in-capital, net of deferred stock compensation 3,969.4 3,924.0 3,752.2 3,388.9 2,077.1
Retained earnings 981.6 925.4 731.3 930.8 1,339.0Accumulated other comprehensive loss and other
common stock equity (20.7) (65.0) (70.2) (148.0) 51.2
Total Common Stock Equity 4,933.0 4,787.1 4,415.9 4,174.2 3,469.4Preferred Stocks —
Series without mandatory redemption provisions 81.1 81.1 81.1 81.1 83.6Series with mandatory redemption provisions — — — 3.8 5.0
Company-obligated mandatorily redeemable preferred securities of subsidiary trust holding solely Company debentures — — — 345.0 345.0
Long-term debt, excluding amounts due within one year 5,271.2 4,835.9 5,993.4 4,849.5 6,065.1
Total Capitalization 10,285.3 9,704.1 10,490.4 9,453.6 9,968.1Current Liabilities
Current portion of long-term debt 440.7 1,299.9 118.3 1,224.9 454.3Short-term borrowings 898.0 307.6 685.5 913.1 1,854.3Accounts payable 866.7 648.4 496.6 536.7 587.0Dividends declared on common and preferred stocks 1.1 1.1 1.8 1.1 1.7Customer deposits 101.9 92.2 80.4 65.2 10.0Taxes accrued 217.5 160.9 210.8 222.8 227.3Interest accrued 86.2 84.1 82.4 76.5 68.0Overrecovered gas and fuel costs 25.8 15.5 29.2 13.1 49.3Price risk management liabilities 72.3 46.9 36.5 39.7 243.1Exchange gas payable 425.2 325.1 290.8 411.9 287.2Current deferred revenue 51.3 31.5 28.2 17.5 15.3Regulatory liabilities 46.3 30.2 73.7 13.5 21.1Accrued liability for postretirement and postemployment
benefits 61.1 57.7 64.3 48.9 —Other accruals 549.1 478.3 418.0 391.7 620.4
Total Current Liabilities 3,843.2 3,579.4 2,616.5 3,976.6 4,439.0
Other Liabilities and Deferred CreditsPrice risk management liabilities 22.2 5.5 0.2 3.2 10.8Deferred income taxes 1,591.9 1,665.9 1,589.2 1,517.8 1,390.5Deferred investment tax credits 69.9 78.4 87.3 96.3 105.2Deferred credits 81.1 74.0 72.7 100.9 129.4Noncurrent deferred revenue 60.4 86.9 113.0 130.1 147.5Accrued liability for postretirement and postemployment
benefits 511.0 440.7 406.9 419.2 283.5Preferred stock liabilities with mandatory redemption
provisions — 0.6 2.4 959.9 1,124.8Regulatory liabilities 1,196.2 1,168.6 1,061.6 1,073.2 37.7Asset retirement obligations 119.8 9.3 11.4 — —Other noncurrent liabilities 177.5 174.4 172.6 210.9 257.2
Total Other Liabilities and Deferred Credits 3,830.0 3,704.3 3,517.3 4,511.6 3,486.6
Commitments and Contingencies — — — — —
Total Capitalization and Liabilities $17,958.5 $16,987.8 $16,624.2 $17,941.8 $17,893.7
FINA
NC
IAL
page 9
FIN
AN
CIA
L
page 9
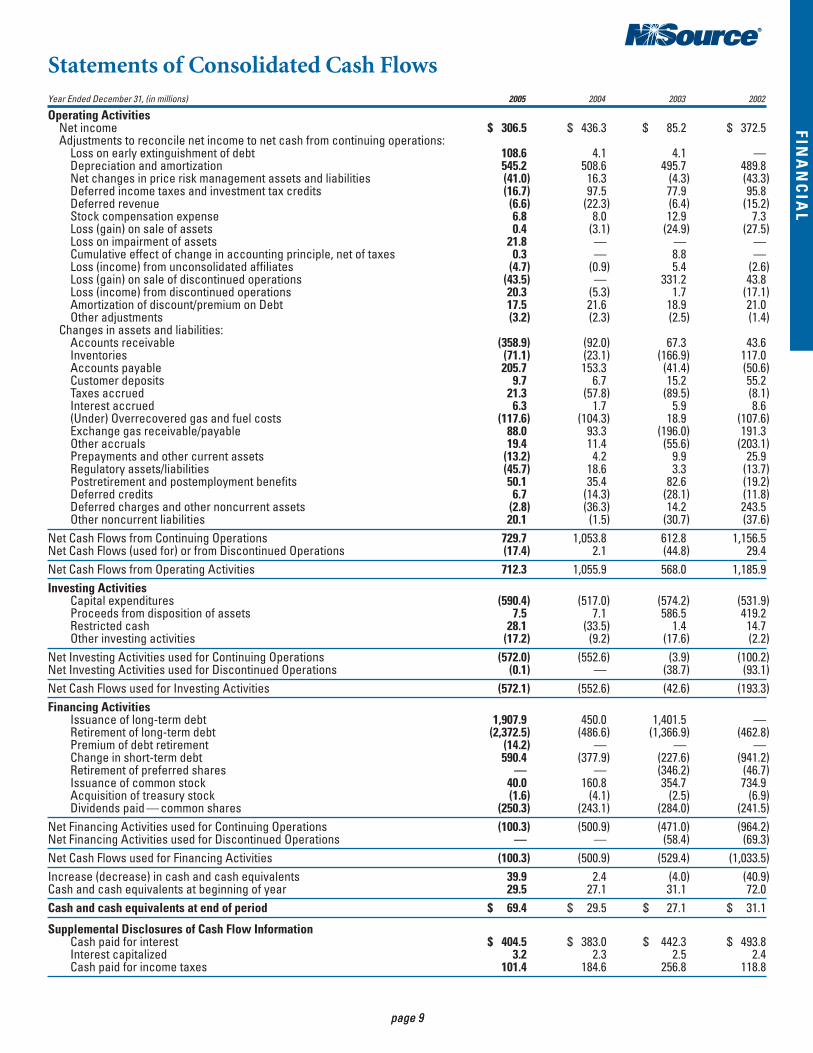
Statements of Consolidated Cash FlowsYear Ended December 31, (in millions) 2005 2004 2003 2002
Operating ActivitiesNet income $ 306.5 $ 436.3 $ 85.2 $ 372.5Adjustments to reconcile net income to net cash from continuing operations:
Loss on early extinguishment of debt 108.6 4.1 4.1 —Depreciation and amortization 545.2 508.6 495.7 489.8Net changes in price risk management assets and liabilities (41.0) 16.3 (4.3) (43.3)Deferred income taxes and investment tax credits (16.7) 97.5 77.9 95.8Deferred revenue (6.6) (22.3) (6.4) (15.2)Stock compensation expense 6.8 8.0 12.9 7.3Loss (gain) on sale of assets 0.4 (3.1) (24.9) (27.5)Loss on impairment of assets 21.8 — — —Cumulative effect of change in accounting principle, net of taxes 0.3 — 8.8 —Loss (income) from unconsolidated affiliates (4.7) (0.9) 5.4 (2.6)Loss (gain) on sale of discontinued operations (43.5) — 331.2 43.8Loss (income) from discontinued operations 20.3 (5.3) 1.7 (17.1)Amortization of discount/premium on Debt 17.5 21.6 18.9 21.0Other adjustments (3.2) (2.3) (2.5) (1.4)
Changes in assets and liabilities:Accounts receivable (358.9) (92.0) 67.3 43.6Inventories (71.1) (23.1) (166.9) 117.0Accounts payable 205.7 153.3 (41.4) (50.6)Customer deposits 9.7 6.7 15.2 55.2Taxes accrued 21.3 (57.8) (89.5) (8.1)Interest accrued 6.3 1.7 5.9 8.6(Under) Overrecovered gas and fuel costs (117.6) (104.3) 18.9 (107.6)Exchange gas receivable/payable 88.0 93.3 (196.0) 191.3Other accruals 19.4 11.4 (55.6) (203.1)Prepayments and other current assets (13.2) 4.2 9.9 25.9Regulatory assets/liabilities (45.7) 18.6 3.3 (13.7)Postretirement and postemployment benefits 50.1 35.4 82.6 (19.2)Deferred credits 6.7 (14.3) (28.1) (11.8)Deferred charges and other noncurrent assets (2.8) (36.3) 14.2 243.5Other noncurrent liabilities 20.1 (1.5) (30.7) (37.6)
Net Cash Flows from Continuing Operations 729.7 1,053.8 612.8 1,156.5Net Cash Flows (used for) or from Discontinued Operations (17.4) 2.1 (44.8) 29.4Net Cash Flows from Operating Activities 712.3 1,055.9 568.0 1,185.9Investing Activities
Capital expenditures (590.4) (517.0) (574.2) (531.9)Proceeds from disposition of assets 7.5 7.1 586.5 419.2Restricted cash 28.1 (33.5) 1.4 14.7Other investing activities (17.2) (9.2) (17.6) (2.2)
Net Investing Activities used for Continuing Operations (572.0) (552.6) (3.9) (100.2)Net Investing Activities used for Discontinued Operations (0.1) — (38.7) (93.1)Net Cash Flows used for Investing Activities (572.1) (552.6) (42.6) (193.3)Financing Activities
Issuance of long-term debt 1,907.9 450.0 1,401.5 —Retirement of long-term debt (2,372.5) (486.6) (1,366.9) (462.8)Premium of debt retirement (14.2) — — —Change in short-term debt 590.4 (377.9) (227.6) (941.2)Retirement of preferred shares — — (346.2) (46.7)Issuance of common stock 40.0 160.8 354.7 734.9Acquisition of treasury stock (1.6) (4.1) (2.5) (6.9)Dividends paid — common shares (250.3) (243.1) (284.0) (241.5)
Net Financing Activities used for Continuing Operations (100.3) (500.9) (471.0) (964.2)Net Financing Activities used for Discontinued Operations — — (58.4) (69.3)Net Cash Flows used for Financing Activities (100.3) (500.9) (529.4) (1,033.5)Increase (decrease) in cash and cash equivalents 39.9 2.4 (4.0) (40.9)Cash and cash equivalents at beginning of year 29.5 27.1 31.1 72.0Cash and cash equivalents at end of period $ 69.4 $ 29.5 $ 27.1 $ 31.1
Supplemental Disclosures of Cash Flow InformationCash paid for interest $ 404.5 $ 383.0 $ 442.3 $ 493.8Interest capitalized 3.2 2.3 2.5 2.4Cash paid for income taxes 101.4 184.6 256.8 118.8

FIN
AN
CIA
L
page 10
FINA
NC
IAL
page 10
Statements of Consolidated CapitalizationAs of December 31, (in millions, except shares outstanding and par value) 2005 2004 2003 2002
Common shareholders’ equity $ 4,933.0 $4,787.1 $ 4,415.9 $4,174.2
Preferred Stocks, which are redeemable solely at option of issuer:
Northern Indiana Public Service Company—
Cumulative preferred stock — $100 par value —
41⁄4% series — 209,035 shares outstanding 20.9 20.9 20.9 20.9
41⁄2% series — 79,996 shares outstanding 8.0 8.0 8.0 8.0
4.22% series — 106,198 shares outstanding 10.6 10.6 10.6 10.6
4.88% series — 100,000 shares outstanding 10.0 10.0 10.0 10.0
7.44% series — 41,890 shares outstanding 4.2 4.2 4.2 4.2
7.50% series — 34,842 shares outstanding 3.5 3.5 3.5 3.5
Premium on preferred stock and other 0.3 0.3 0.3 0.3
Cumulative preferred stock — no par value —
Adjustable rate series A (stated value —
$50 per share), 473,285 shares outstanding 23.6 23.6 23.6 23.6
Series without mandatory redemption provisions 81.1 81.1 81.1 81.1
Redeemable Preferred Stock, subject to mandatory
redemption requirements or whose redemption is
outside the control of issuer:
Northern Indiana Public Service Company—
Cumulative preferred stock — $100 par value —
73⁄4% series — 0, 0, 0; 11,136 shares
outstanding, respectively — — — 1.1
83⁄4% series — 0, 0, 0; 27,000 shares
outstanding, respectively — — — 2.7
Series with mandatory redemption provisions — — — 3.8
Company-obligated mandatorily redeemable
preferred securities of subsidiary trust
holding solely Company debentures — — — 345.0
Long-term debt 5,271.2 4,835.9 5,993.4 4,849.5
Total Capitalization $10,285.3 $9,704.1 $10,490.4 $9,453.6

FINA
NC
IAL
page 11
FIN
AN
CIA
L
page 11
Statements of Consolidated Long-Term DebtAs of December 31, (in millions) 2005 2004 2003 2002NiSource Inc.:
Senior Debentures — 3.628%, due November 1, 2006 $ — $ 144.4 $ — $ —Debentures due November 1, 2006, with interest imputed at 7.77% (SAILSSM) — — 135.8 126.0Unamortized premium on long-term debt — 0.4 — —
Total long-term debt of NiSource, Inc. $ — $ 144.8 $ 135.8 $ 126.0
Bay State Gas Company: Medium-Term Notes —
Interest rates between 6.26% and 9.20% with a weighted average interest rate of 6.81% and maturities between June 6, 2011 and February 15, 2028 48.5 48.5 68.5 80.5
Northern Utilities: Medium-Term Note — Interest rate of 6.93% and maturity of
September 1, 2010 3.3 4.2 5.0 5.8Total long-term debt of Bay State Gas Company 51.8 52.7 73.5 86.3
Columbia Energy Group:Debentures —
6.80% Series C — due November 28, 2005 — — 281.5 281.57.05% Series D — due November 28, 2007 — 281.5 281.5 281.57.32% Series E — due November 28, 2010 — 281.5 281.5 281.57.42% Series F — due November 28, 2015 — 281.5 281.5 281.57.62% Series G — due November 28, 2025 — 229.2 229.2 229.2
Fair value adjustment of debentures for interest rate swap agreements — — 11.2 30.6Unamortized discount on long-term debt — (96.0) (98.2) (108.0)Subsidiary debt — Capital lease obligations 1.8 2.2 1.7 2.0
Total long-term debt of Columbia Energy Group 1.8 979.9 1,269.9 1,279.8PEI Holdings, Inc.:
Long-Term Notes —Whiting Clean Energy, Inc.— Interest rates between 6.73% and 8.58% with a
weighted average interest rate of 8.30% and maturity of June 20, 2011 295.5 298.6 301.5 302.5Total long-term debt of PEI Holdings, Inc. 295.5 298.6 301.5 302.5
NiSource Capital Markets, Inc.:Senior Unsecured Notes — 4.25%, due February 19, 2005 — — 0.3 —Subordinated Debentures — Series A, 73⁄4%, due March 31, 2026 — — — 75.0Senior Notes — 6.78%, due December 1, 2027 75.0 75.0 75.0 75.0Medium-term notes —
Issued at interest rates between 7.38% and 7.99%, with a weighted average interest rate of 7.82% and various maturities between March 27, 2007 and
May 5, 2027 150.0 190.0 220.0 300.0Total long-term debt of NiSource Capital Markets, Inc. 225.0 265.0 295.3 450.0
NiSource Corporate Services Inc.Capital lease obligations — 5.586%, due December 31, 2009 6.4 — — —
Total long-term debt of NiSource Corporate Services, Inc. 6.4 — — —NiSource Development Company, Inc.:
NDC Douglas Properties, Inc. — Notes Payable —Interest rate between 3.8% and 12.6% with a weighted average
interest rate of 7.4% 35.8 36.7 2.6 5.1Total long-term debt of NiSource Development Company, Inc. 35.8 36.7 2.6 5.1
NiSource Finance Corp.:Long-Term Notes —
Floating Rate Notes — 1.93% at December 31, 2003 due May 4, 2005 — — 250.0 —75⁄8% — due November 15, 2005 — — 900.0 900.03.20% — due November 1, 2006 — 250.0 250.0 —77⁄8% — due November 15, 2010 1,000.0 1,000.0 1,000.0 1,000.0Senior Unsecured Notes — 6.15%, due March 1, 2013 345.0 345.0 345.0 —Floating Rate Notes — 4.95% at December 31, 2005, due November 23, 2009 450.0 450.0 — —5.21% — due November 28, 2012 315.0 — — —5.40% — due July 15, 2014 500.0 500.0 500.0 —5.36% — due November 28, 2015 230.0 — — —5.41% — due November 28, 2016 90.0 — — —5.25% — due September 15, 2017 450.0 — — —5.45% — due September 15, 2020 550.0 — — —5.89% — due November 28, 2025 265.0 — — —
Fair value adjustment of notes for interest rate swap agreements (12.2) 29.9 3.3 —Unamortized premium and discount on long-term debt (25.9) (14.6) (15.5) (13.6)
Total long-term debt of NiSource Finance Corp., Inc. 4,156.9 2,560.3 3,232.8 1,886.4Northern Indiana Public Service Company:
First mortgage bonds —Series NN, 7.10% — due July 1, 2017 — — — 55.0
Pollution control bonds —Issued at interest rates between 1.65% and 1.85%, with a weighted average
interest rate of 1.75% and various maturities between November 1, 2007 and April 1, 2019 278.0 278.0 278.0 223.0
Medium-term notes—Issued at interest rates between 6.69% and 7.69%, with a weighted average
interest rate of 7.30% and various maturities between June 6, 2007 and August 4, 2027 221.2 221.2 405.5 437.5
Unamortized discount on long-term debt, net (1.2) (1.3) (1.5) (2.1)Total long-term debt of Northern Indiana Public Service Company 498.0 497.9 682.0 713.4
Total long-term debt, excluding amount due within one year $5,271.2 $4,835.9 $5,993.4 $4,849.5

FIN
AN
CIA
L
page 12
FINA
NC
IAL
page 12
Income TaxesYear Ended December 31, (in millions) 2005 2004 2003 2002
Income TaxesCurrent
Federal $136.1 $117.4 $132.6 $127.0State 30.0 26.5 24.4 (3.2)
Total Current 166.1 143.9 157.0 123.8Deferred
Federal 4.7 102.4 82.4 74.8State (13.0) 4.0 4.4 29.9
Total Deferred (8.3) 106.4 86.8 104.7Deferred Investment Credits (8.4) (8.9) (8.9) (8.9)Income Taxes Included in Continuing Operations $149.4 $241.4 $234.9 $219.6
Total income taxes from continuing operations were different from the amount that would be computed byapplying the statutory Federal income tax rate to book income before income tax. The major reasons for thisdifference were as follows:Year Ended December 31, (in millions) 2005 2004 2003
Book income from Continuing Operations before income taxes $433.0 $672.4 $661.8
Tax expense at statutory Federal income tax rate 151.6 35.0% 235.3 35.0% 231.6 35.0%Increases (reductions) in taxes resulting from:
State income taxes, net of federal income tax benefit 11.0 2.5 19.8 2.9 18.7 2.8
Regulatory treatment of depreciation differences 5.2 1.2 4.5 0.7 1.2 0.2Amortization of deferred investment tax credits (8.4) (1.9) (8.9) (1.3) (8.9) (1.3)Low-income housing (3.2) (0.7) (3.9) (0.6) (5.1) (0.8)Section 199 Electric Production Deduction (1.9) (0.4) — — — —Other, net (4.9) (1.2) (5.4) (0.8) (2.6) (0.4)
Income Taxes from Continuing Operations $149.4 34.5% $241.4 35.9% $234.9 35.5%
Deferred income taxes resulted from temporary differences between the financial statement carrying amountsand the tax basis of existing assets and liabilities. The principal components of NiSource’s net deferred tax liabilitywere as follows:At December 31, (in millions) 2005 2004 2003 2002
Deferred tax liabilitiesAccelerated depreciation and other property differences $1,640.0 $1,680.3 $1,596.5 $1,482.0Unrecovered gas and fuel costs 152.6 112.6 68.0 46.7Other regulatory assets 293.6 303.9 279.0 238.4SFAS No. 133 and price risk adjustments 82.4 40.9 49.0 42.7Premiums and discounts associated with long-term debt 16.8 54.1 56.6 60.7
Total Deferred Tax Liabilities 2,185.4 2,191.8 2,049.1 1,870.5Deferred tax assets
Deferred investment tax credits and other regulatory liabilities (169.8) (177.9) (156.5) (62.4)Pension and other postretirement/postemployment benefits (228.7) (192.4) (190.9) (163.4)Environmental liabilities (15.3) (21.4) (20.1) (41.2)Other accrued liabilities (65.2) (43.9) (30.0) (52.3)Other, net (17.4) (19.2) (5.4) (38.2)
Total Deferred Tax Assets (496.4) (454.8) (402.9) (357.5)Less: Deferred income taxes related to current assets
and liabilities 97.1 71.1 57.0 (4.8)Non-Current Deferred Tax Liability $1,591.9 $1,665.9 $1,589.2 $1,517.8

FINA
NC
IAL
page 13
FIN
AN
CIA
L
page 13
Statements of Consolidated Common Stockholders’ Equity and Comprehensive Income
AccumulatedAdditional Deferred Other
Common Treasury Paid-In Retained Stock Comprehensive Comprehensive(in millions) Stock Stock Capital Earnings Compensation Income/(Loss) Total IncomeBalance January 1, 2003 $2.5 $ (6.9) $3,389.5 $ 930.9 $(0.6) $(140.5) $4,174.9Comprehensive Income:
Net Income 85.2 85.2 $ 85.2Other comprehensive income, net of tax:
Gain/loss on available for sale securities:Unrealized 1.4 1.4 1.4
Gain/loss on foreign currency translation:Unrealized 0.7 0.7 0.7
Net unrealized gains on derivatives qualifying as cash flow hedges 23.9 23.9 23.9
Minimum pension liability adjustment 53.5 53.5 53.5Total comprehensive income $164.7Dividends:
Common stock (284.8) (284.8)Treasury stock acquired (2.5) (2.5)Issued:
Common stock issuance 0.1 344.9 345.0Employee stock purchase plan 0.6 0.6Long-term incentive plan 21.6 (4.5) 17.1
Amortization of unearned compensation 0.9 0.9Balance December 31, 2003 $2.6 $ (9.4) $3,756.6 $ 731.3 $(4.2) $ (61.0) $4,415.9Comprehensive Income:
Net Income 436.3 436.3 $436.3Other comprehensive income, net of tax:
Gain/loss on available for sale securities:Unrealized 1.5 1.5 1.5
Gain/loss on foreign currency translation:Unrealized 0.7 0.7 0.7
Net unrealized gains on derivatives qualifying as cash flow hedges 2.2 2.2 2.2
Minimum pension liability adjustment 5.2 5.2 5.2Total comprehensive income $445.9Dividends:
Common stock (242.3) (242.3)Treasury stock acquired (4.1) (4.1)Issued:
Common stock issuance 0.1 144.3 144.4Employee stock purchase plan 0.7 0.7Long-term incentive plan 23.0 (3.0) 20.0
Tax benefits of options, PIES and other 5.2 0.1 5.3Amortization of unearned compensation 1.3 1.3Balance December 31, 2004 $2.7 $(13.5) $3,929.8 $ 925.4 $(5.9) $ (51.4) $4,787.1Comprehensive Income:
Net Income 306.5 306.5 $306.5Other comprehensive income, net of tax:
Gain/loss on available for sale securities:Unrealized 0.1 0.1 0.1
Net unrealized gains on derivatives qualifying as cash flow hedges 57.0 57.0 57.0
Minimum pension liability adjustment (11.3) (11.3) (11.3)Total comprehensive income $352.3Dividends:
Common stock (250.3) (250.3)Treasury stock acquired (1.6) (1.6)Issued:
Common stock issuance 0.3 0.3Employee stock purchase plan 0.9 0.9Long-term incentive plan 42.3 (0.5) 41.8
Tax benefits of options, PIES and other (0.3) (0.3)Amortization of unearned compensation 2.8 2.8Balance December 31, 2005 $2.7 $(15.1) $3,973.0 $ 981.6 $(3.6) $ (5.6) $4,933.0

FIN
AN
CIA
L
page 14
FINA
NC
IAL
page 14
Statements of Consolidated Common Stockholders’ Equity and Comprehensive Income
Common TreasuryShares (in thousands) Shares SharesBalance January 1, 2003 249,210 (350)Treasury stock acquired (128)Issued:
Stock issuance 13,111 —Employee stock purchase plan 33 —Long-term incentive plan 754 —
Balance December 31, 2003 263,108 (478)Treasury stock acquired (190)Issued:
Stock issuance 6,814 —Employee stock purchase plan 35 —Long-term incentive plan 1,337 —
Balance December 31, 2004 271,294 (668)Treasury stock acquired (73)Issued:
Employee stock purchase plan 38 —Long-term incentive plan 2,032 —
Balance December 31, 2005 273,364 (741)
FINA
NC
IAL
page 15
FIN
AN
CIA
L
page 15
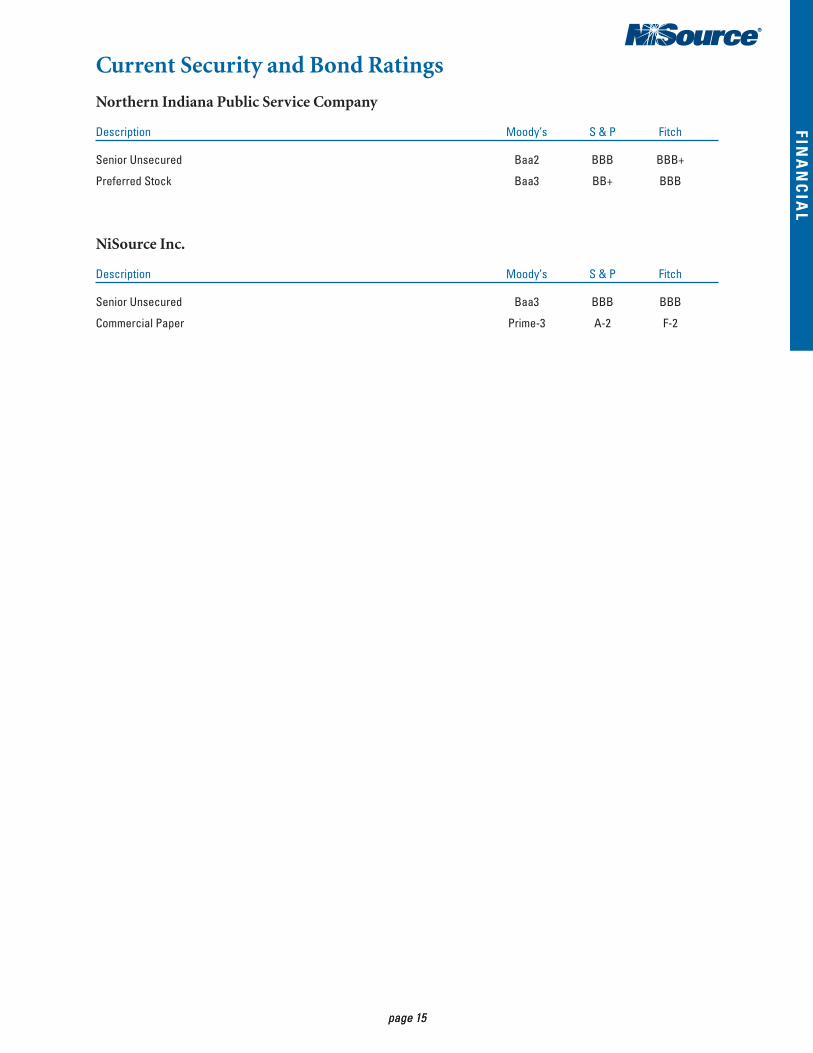
Current Security and Bond Ratings
Northern Indiana Public Service Company
Description Moody’s S & P Fitch
Senior Unsecured Baa2 BBB BBB+
Preferred Stock Baa3 BB+ BBB
NiSource Inc.
Description Moody’s S & P Fitch
Senior Unsecured Baa3 BBB BBB
Commercial Paper Prime-3 A-2 F-2
ST
OC
KH
OLD
ER
S
page 16page 16
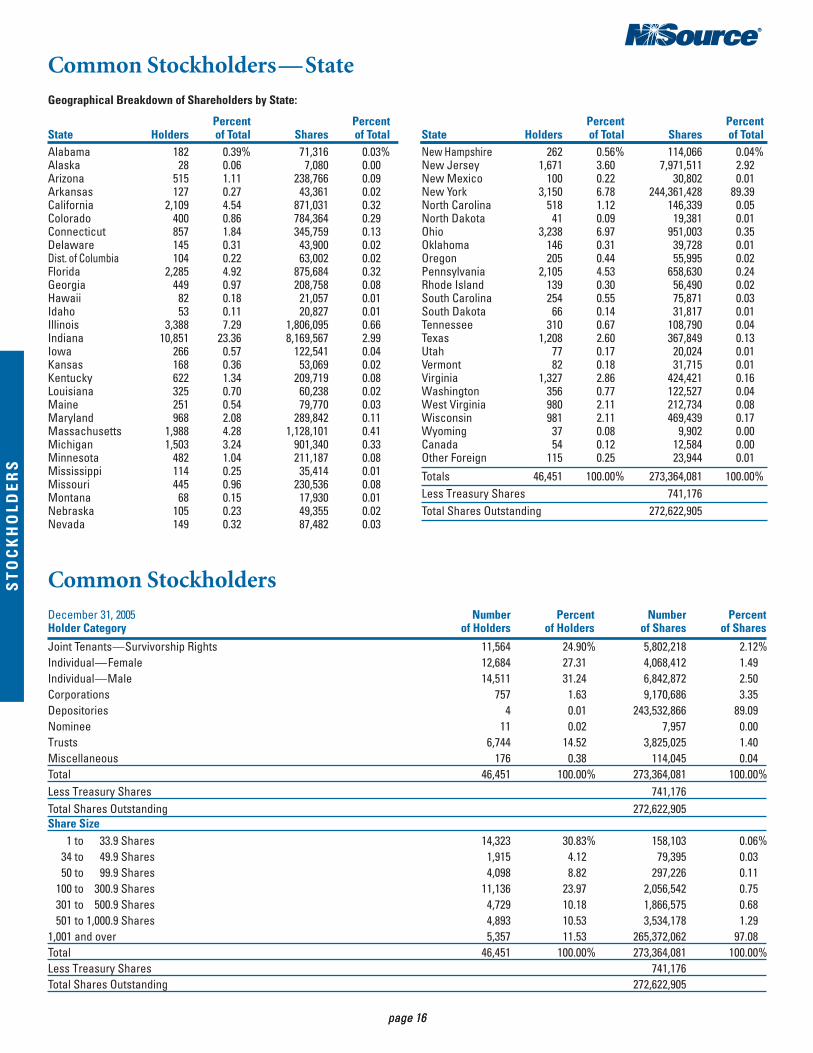
Common Stockholders—State
Common Stockholders
Geographical Breakdown of Shareholders by State:
Percent PercentState Holders of Total *Shares of TotalAlabama 182 0.39% 71,316 0.03% Alaska 28 0.06% 7,080 0.00%Arizona 515 1.11% 238,766 0.09%Arkansas 127 0.27% 43,361 0.02%California 2,109 4.54% 871,031 0.32%Colorado 400 0.86% 784,364 0.29%Connecticut 857 1.84% 345,759 0.13%Delaware 145 0.31% 43,900 0.02%Dist. of Columbia 104 0.22% 63,002 0.02%Florida 2,285 4.92% 875,684 0.32%Georgia 449 0.97% 208,758 0.08%Hawaii 82 0.18% 21,057 0.01%Idaho 53 0.11% 20,827 0.01%Illinois 3,388 7.29% 1,806,095 0.66%Indiana 10,851 23.36% 8,169,567 2.99%Iowa 266 0.57% 122,541 0.04%Kansas 168 0.36% 53,069 0.02%Kentucky 622 1.34% 209,719 0.08%Louisiana 325 0.70% 60,238 0.02%Maine 251 0.54% 79,770 0.03%Maryland 968 2.08% 289,842 0.11%Massachusetts 1,988 4.28% 1,128,101 0.41%Michigan 1,503 3.24% 901,340 0.33%Minnesota 482 1.04% 211,187 0.08%Mississippi 114 0.25% 35,414 0.01%Missouri 445 0.96% 230,536 0.08%Montana 68 0.15% 17,930 0.01%Nebraska 105 0.23% 49,355 0.02%Nevada 149 0.32% 87,482 0.03%
Percent PercentState Holders of Total Shares of TotalNew Hampshire 262 0.56% 114,066 0.04%New Jersey 1,671 3.60% 7,971,511 2.92%New Mexico 100 0.22% 30,802 0.01%New York 3,150 6.78% 244,361,428 89.39%North Carolina 518 1.12% 146,339 0.05%North Dakota 41 0.09% 19,381 0.01%Ohio 3,238 6.97% 951,003 0.35%Oklahoma 146 0.31% 39,728 0.01%Oregon 205 0.44% 55,995 0.02%Pennsylvania 2,105 4.53% 658,630 0.24%Rhode Island 139 0.30% 56,490 0.02%South Carolina 254 0.55% 75,871 0.03%South Dakota 66 0.14% 31,817 0.01%Tennessee 310 0.67% 108,790 0.04%Texas 1,208 2.60% 367,849 0.13%Utah 77 0.17% 20,024 0.01%Vermont 82 0.18% 31,715 0.01%Virginia 1,327 2.86% 424,421 0.16%Washington 356 0.77% 122,527 0.04%West Virginia 980 2.11% 212,734 0.08%Wisconsin 981 2.11% 469,439 0.17%Wyoming 37 0.08% 9,902 0.00%Canada 54 0.12% 12,584 0.00%Other Foreign 115 0.25% 23,944 0.01%
Totals 46,451 100.00% 273,364,081 100.00%Less Treasury Shares 741,176Total Shares Outstanding 272,622,905
December 31, 2005 Number Percent Number PercentHolder Category of Holders of Holders of Shares of Shares
Joint Tenants—Survivorship Rights 11,564 24.90% 5,802,218 2.12%Individual—Female 12,684 27.31% 4,068,412 1.49%Individual—Male 14,511 31.24% 6,842,872 2.50%Corporations 757 1.63% 9,170,686 3.35%Depositories 4 0.01% 243,532,866 89.09%Nominee 11 0.02% 7,957 0.00%Trusts 6,744 14.52% 3,825,025 1.40%Miscellaneous 176 0.38% 114,045 0.04%Total 46,451 100.00% 273,364,081 100.00%Less Treasury Shares 741,176Total Shares Outstanding 272,622,905Share Size %3,331 to 33.9 Shares 14,323 30.83% 158,103 0.06%3, 34 to 49.9 Shares 1,915 4.12% 79,395 0.03%3, 50 to 99.9 Shares 4,098 8.82% 297,226 0.11%3,100 to 300.9 Shares 11,136 23.97% 2,056,542 0.75%3,301 to 500.9 Shares 4,729 10.18% 1,866,575 0.68%3,501 to 1,000.9 Shares 4,893 10.53% 3,534,178 1.29%1,001 and over 5,357 11.53% 265,372,062 97.08Total 46,451 100.00% 273,364,081 100.00%Less Treasury Shares 741,176Total Shares Outstanding 272,622,905
BU
SIN
ES
S S
EG
ME
NT
S
page 17
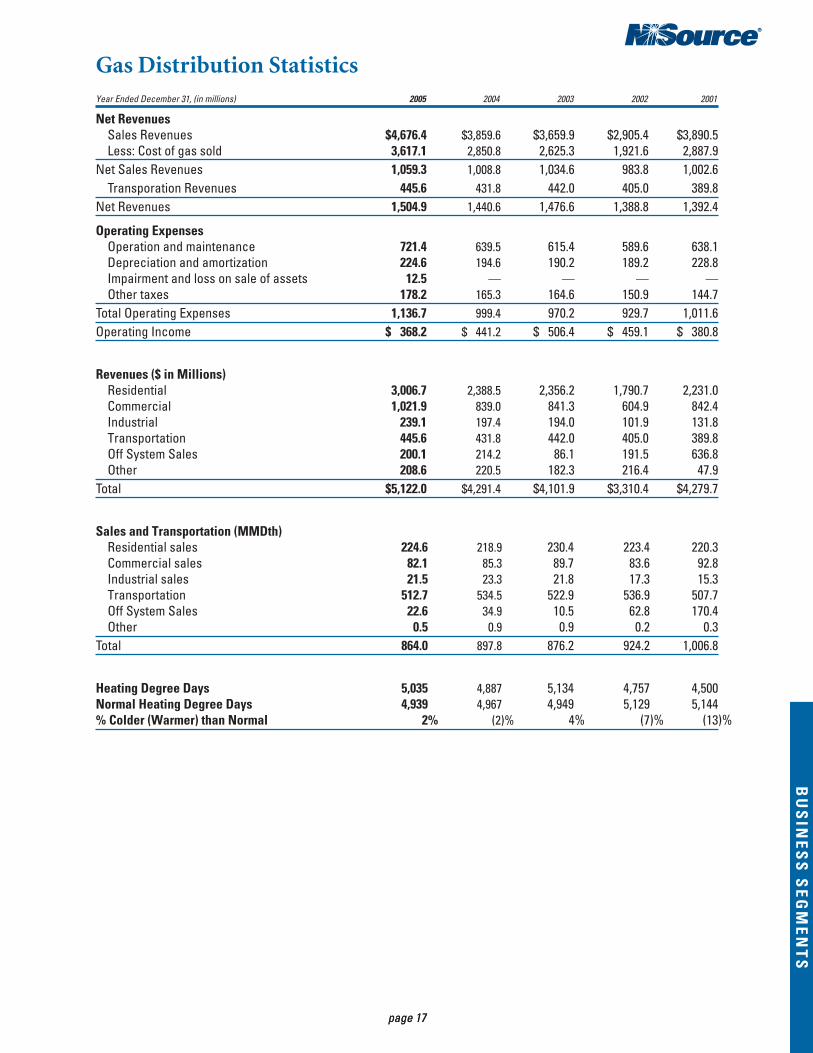
Gas Distribution Statistics
page 17
Year Ended December 31, (in millions) 2005 2004 2003 2002 2001
Net RevenuesSales Revenues $4,676.4 $3,859.6 $3,659.9 $2,905.4 $3,890.5Less: Cost of gas sold 3,617.1 2,850.8 2,625.3 1,921.6 2,887.9
Net Sales Revenues 1,059.3 1,008.8 1,034.6 983.8 1,002.6Transporation Revenues 445.6 431.8 442.0 405.0 389.8
Net Revenues 1,504.9 1,440.6 1,476.6 1,388.8 1,392.4
Operating ExpensesOperation and maintenance 721.4 639.5 615.4 589.6 638.1Depreciation and amortization 224.6 194.6 190.2 189.2 228.8Impairment and loss on sale of assets 12.5 — — — —Other taxes 178.2 165.3 164.6 150.9 144.7
Total Operating Expenses 1,136.7 999.4 970.2 929.7 1,011.6Operating Income $ 368.2 $ 441.2 $ 506.4 $ 459.1 $ 380.8
Revenues ($ in Millions)Residential 3,006.7 2,388.5 2,356.2 1,790.7 2,231.0Commercial 1,021.9 839.0 841.3 604.9 842.4Industrial 239.1 197.4 194.0 101.9 131.8Transportation 445.6 431.8 442.0 405.0 389.8Off System Sales 200.1 214.2 86.1 191.5 636.8Other 208.6 220.5 182.3 216.4 47.9
Total $5,122.0 $4,291.4 $4,101.9 $3,310.4 $4,279.7
Sales and Transportation (MMDth)Residential sales 224.6 218.9 230.4 223.4 220.3Commercial sales 82.1 85.3 89.7 83.6 92.8Industrial sales 21.5 23.3 21.8 17.3 15.3Transportation 512.7 534.5 522.9 536.9 507.7Off System Sales 22.6 34.9 10.5 62.8 170.4Other 0.5 0.9 0.9 0.2 0.3
Total 864.0 897.8 876.2 924.2 1,006.8
Heating Degree Days 5,035 4,887 5,134 4,757 4,500Normal Heating Degree Days 4,939 4,967 4,949 5,129 5,144% Colder (Warmer) than Normal 2% (2)% 4% (7)% (13)%
BU
SIN
ES
S S
EG
ME
NT
S
page 18
BU
SIN
ES
S S
EG
ME
NT
S
page 18
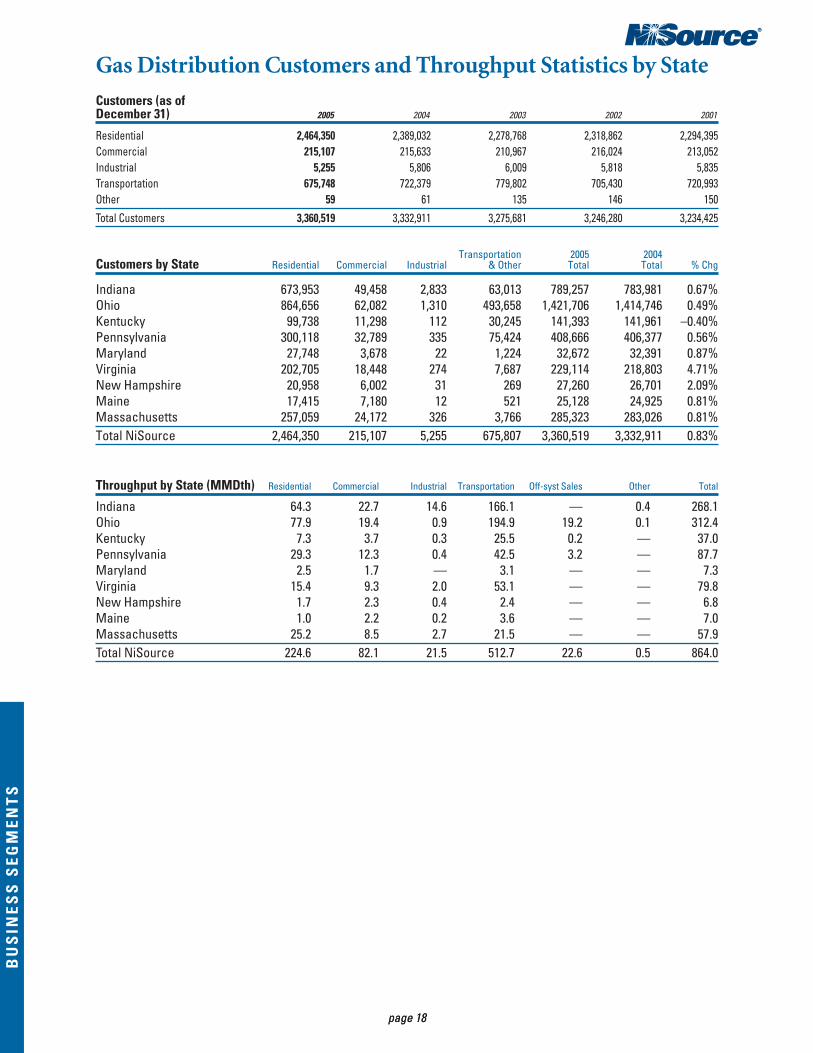
Gas Distribution Customers and Throughput Statistics by State
Customers (as of December 31) 2005 2004 2003 2002 2001
Residential 2,464,350 2,389,032 2,278,768 2,318,862 2,294,395Commercial 215,107 215,633 210,967 216,024 213,052Industrial 5,255 5,806 6,009 5,818 5,835Transportation 675,748 722,379 779,802 705,430 720,993Other 59 61 135 146 150
Total Customers 3,360,519 3,332,911 3,275,681 3,246,280 3,234,425
Transportation 2005 2004Customers by State RResidential Commercial Industrial & Other Total Total % Chg
Indiana 673,953 49,458 2,833 63,013 789,257 783,981 0.67%Ohio 864,656 62,082 1,310 493,658 1,421,706 1,414,746 0.49%Kentucky 99,738 11,298 112 30,245 141,393 141,961 –0.40%Pennsylvania 300,118 32,789 335 75,424 408,666 406,377 0.56%Maryland 27,748 3,678 22 1,224 32,672 32,391 0.87%Virginia 202,705 18,448 274 7,687 229,114 218,803 4.71%New Hampshire 20,958 6,002 31 269 27,260 26,701 2.09%Maine 17,415 7,180 12 521 25,128 24,925 0.81%Massachusetts 257,059 24,172 326 3,766 285,323 283,026 0.81%Total NiSource 2,464,350 215,107 5,255 675,807 3,360,519 3,332,911 0.83%
Throughput by State (MMDth) Residential Commercial Industrial Transportation Off-syst Sales Other Total
Indiana 64.3 22.7 14.6 166.1 — 0.4 268.1Ohio 77.9 19.4 0.9 194.9 19.2 0.1 312.4Kentucky 7.3 3.7 0.3 25.5 0.2 — 37.0Pennsylvania 29.3 12.3 0.4 42.5 3.2 — 87.7Maryland 2.5 1.7 — 3.1 — — 7.3Virginia 15.4 9.3 2.0 53.1 — — 79.8New Hampshire 1.7 2.3 0.4 2.4 — — 6.8Maine 1.0 2.2 0.2 3.6 — — 7.0Massachusetts 25.2 8.5 2.7 21.5 — — 57.9Total NiSource 224.6 82.1 21.5 512.7 22.6 0.5 864.0
BU
SIN
ES
S S
EG
ME
NT
S
page 19
BU
SIN
ES
S S
EG
ME
NT
SB
US
INE
SS
SE
GM
EN
TS
page 19
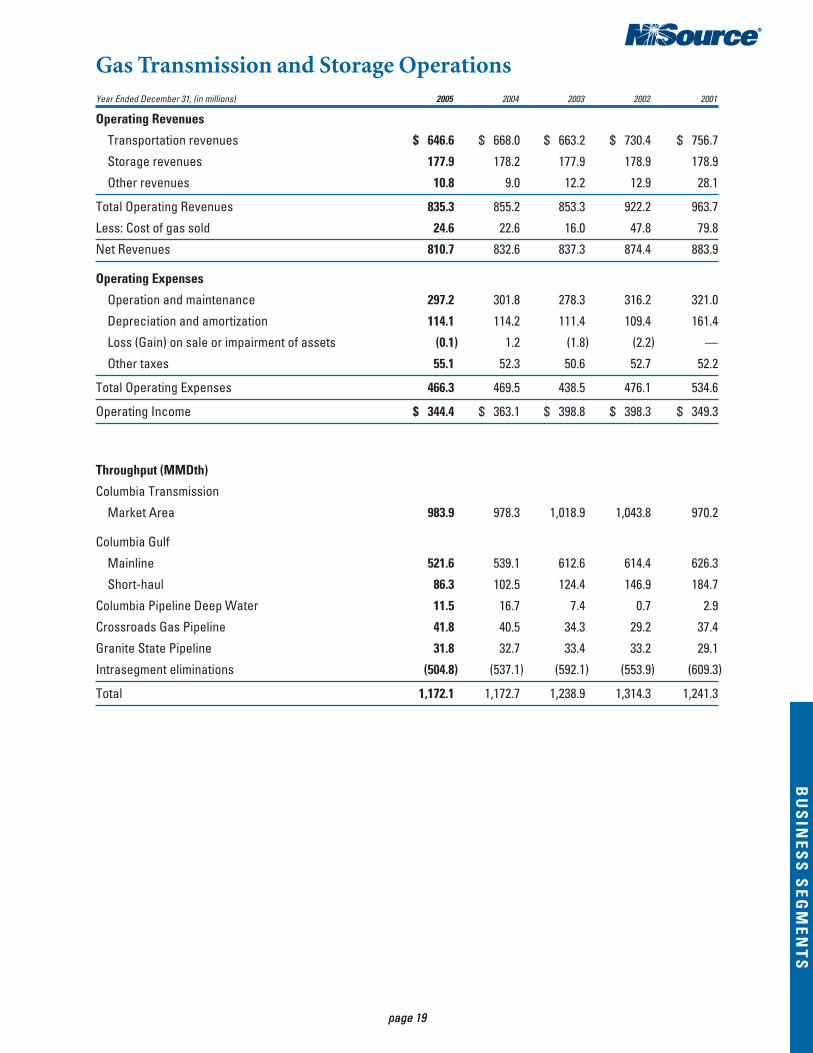
Gas Transmission and Storage OperationsYear Ended December 31, (in millions) 2005 2004 2003 2002 2001
Operating Revenues
Transportation revenues $ 646.6 $ 668.0 $ 663.2 $ 730.4 $ 756.7
Storage revenues 177.9 178.2 177.9 178.9 178.9
Other revenues 10.8 9.0 12.2 12.9 28.1
Total Operating Revenues 835.3 855.2 853.3 922.2 963.7
Less: Cost of gas sold 24.6 22.6 16.0 47.8 79.8
Net Revenues 810.7 832.6 837.3 874.4 883.9
Operating Expenses
Operation and maintenance 297.2 301.8 278.3 316.2 321.0
Depreciation and amortization 114.1 114.2 111.4 109.4 161.4
Loss (Gain) on sale or impairment of assets (0.1) 1.2 (1.8) (2.2) —
Other taxes 55.1 52.3 50.6 52.7 52.2
Total Operating Expenses 466.3 469.5 438.5 476.1 534.6
Operating Income $ 344.4 $ 363.1 $ 398.8 $ 398.3 $ 349.3
Throughput (MMDth)
Columbia Transmission
Market Area 983.9 978.3 1,018.9 1,043.8 970.2
Columbia Gulf
Mainline 521.6 539.1 612.6 614.4 626.3
Short-haul 86.3 102.5 124.4 146.9 184.7
Columbia Pipeline Deep Water 11.5 16.7 7.4 0.7 2.9
Crossroads Gas Pipeline 41.8 40.5 34.3 29.2 37.4
Granite State Pipeline 31.8 32.7 33.4 33.2 29.1
Intrasegment eliminations (504.8) (537.1) (592.1) (553.9) (609.3)
Total 1,172.1 1,172.7 1,238.9 1,314.3 1,241.3

BU
SIN
ES
S S
EG
ME
NT
S
page 20page 20
Electric OperationsYear Ended December 31, (in millions) 2005 2004 2003 2002 2001
Net RevenuesSales revenues $1,247.6 $1,111.2 $1,092.8 $1,137.4 $1,064.5Less: Cost of sales 452.5 351.0 364.2 369.0 277.6
Net Revenues 795.1 760.2 728.6 768.4 786.9
Operating ExpensesOperation and maintenance 263.1 240.0 224.7 222.8 223.3Depreciation and amortization 185.9 178.1 175.1 172.2 166.8
Gain on sale of assets (0.4) (1.6) — — —Other taxes 53.2 34.2 61.3 51.1 56.1Total Operating Expenses 501.8 450.7 461.1 446.1 446.2Operating Income $ 293.3 $ 309.5 $ 267.5 $ 322.3 $ 340.7
Revenues ($ in millions)Residential $ 349.9 $ 295.1 $ 294.9 $ 309.5 $ 295.7Commercial 335.0 294.1 289.8 297.2 292.9Industrial 445.1 414.1 380.2 393.6 404.0Wholesale 35.1 47.0 92.8 92.9 29.6Other 82.5 60.9 35.1 44.2 42.3
Total $1,247.6 $1,111.2 $1,092.8 $1,137.4 $1,064.5
Sales (Gigawatt Hours)Residential 3,516.1 3,104.3 3,122.5 3,228.4 2,956.9Commercial 3,893.0 3,635.0 3,579.7 3,618.3 3,446.3Industrial 9,131.6 9,309.4 8,972.2 8,822.4 8,935.5Wholesale 831.3 1,176.2 2,623.2 2,983.5 845.0Other 115.0 142.6 141.6 123.3 127.6
Total 17,487.0 17,367.5 18,439.2 18,775.9 16,311.3
Cooling Degree Days 935 582 572 1,015 801Normal Cooling Degree Days 803 803 808 792 792% Warmer (Colder) than Normal 16% (28)% (29)% 28% 1%
Revenue per KWH (cents):Residential 9.95 9.51 9.44 9.59 10.00Commercial 8.61 8.09 8.10 8.21 8.50Industrial 4.87 4.45 4.24 4.46 4.52
Residential CustomersAverage annual KWH use per customer 8,882 7,912 8,045 8,388 7,752Average annual electric bill $ 883.92 $ 752.15 $ 759.81 $ 804.12 $ 775.22
Electric CustomersResidential 395,849 392,342 388,123 384,891 381,440Commercial 51,261 50,332 49,252 48,286 47,286Industrial 2,515 2,528 2,543 2,577 2,643Wholesale 7 22 21 22 23Other 765 770 794 799 801
Total 450,397 445,994 440,733 436,575 432,193
On June 20, 2002 a settlement agreement was filed with IURC regarding the electric rate review. The settlement agreement provides electric customers will receive a credit of $55Meach year for 49 months, beginning July 1, 2002.
BU
SIN
ES
S S
EG
ME
NT
S

BU
SIN
ES
S S
EG
ME
NT
S
page 21
BU
SIN
ES
S S
EG
ME
NT
S
page 21
Electric Generation and Production StatisticsYear in Net KW
Unit Service Capability 2005 2004 2003 2002 2001
(Kilowatt-hours in Thousands)
Megawatt-hours Generated by Conventional Coal Fired Steam Turbine—Michigan City Generating Station:Units 2 and 3(a) 1951 120,000 (1,380) (1,674) (1,725) (2,002) (1,210)Unit 12 1974 469,000 2,547,056 2,705,973 2,405,676 2,486,543 2,413,036
Station total 589,000 2,545,676 2,704,299 2,403,951 2,484,541 2,411,826
Dean H. Mitchell Generating Station:(b)
Unit 4 1956 125,000 0 0 0 (674) 374,324Unit 5 1959 125,000 0 0 0 (388) 321,140Unit 6 1959 125,000 0 0 0 (735) 555,396Unit 11 1970 110,000 0 0 0 32,114 520,028
Station total 485,000 0 0 0 30,317 1,770,888
Bailly Generating Station:Unit 7 1962 160,000 894,955 992,795 1,013,047 911,943 950,482Unit 8 1968 320,000 1,804,954 2,105,916 1,289,827 1,918,972 1,706,284
Station total 480,000 2,699,909 3,098,711 2,302,874 2,830,915 2,656,766
R. M. Schahfer Generating Station:Unit 14 1976 431,000 2,630,229 2,216,069 2,657,685 1,619,597 2,049,614Unit 15 1979 472,000 2,620,270 2,942,038 3,001,038 2,602,456 3,017,124Unit 17 1983 361,000 2,705,954 2,196,962 2,107,624 2,138,528 1,671,071Unit 18 1986 361,000 2,601,942 1,990,524 2,238,720 2,388,925 2,171,866
Station total 1,625,000 10,558,395 9,345,593 10,005,067 8,749,506 8,909,675
Total conventional steam generating stations 3,179,000 15,803,980 15,148,603 14,711,892 14,095,279 15,749,155
Megawatt-hours Generated by Gas Turbine—Dean H. Mitchell Generating Station:
Unit 9A 1966 17,400 45 0 0 0 969
Bailly Generating Station:Unit 10 1968 30,900 1,528 314 806 336 1,071
R. M. Schahfer Generating Station:Units 16A and 16B 1979 155,000 28,339 5,323 5,064 6,924 12,339
Total gas turbine generating stations 203,300 29,912 5,637 5,870 7,260 14,379
Megawatt-hours Generated by Hydroelectric—Oakdale 1925 6,000 20,290 33,242 32,253 22,827 40,280Norway 1923 4,000 19,735 28,629 22,355 24,855 30,196
Total hydroelectric 10,000 40,025 61,871 54,608 47,682 70,476
Total all generating stations 3,392,300 15,873,916 15,216,111 14,772,370 14,150,221 15,834,010
(a)Units 2 and 3 are fired on gas only.
(b)D. H. Mitchell Generating Station taken out of service January 2002.

BU
SIN
ES
S S
EG
ME
NT
S
page 22
BU
SIN
ES
S S
EG
ME
NT
S
page 22
Fuel for Electric Generation
Coal Consumed by Generating Station for Electric Production (tons)2005 2004 2003 2002 2001
Michigan City 1,417,320 1,538,985 1,351,752 1,389,568 1,331,813Dean H. Mitchell(1) 0 0 0 22,560 1,094,636Bailly 1,219,724 1,424,345 1,084,259 1,358,927 1,290,955R. M. Schahfer 5,655,760 5,126,539 5,465,003 4,703,826 5,037,711
Total 8,292,804 8,089,869 7,901,014 7,474,881 8,755,115
Average Cost Per Ton of Coal Consumed(2) by Generating Station 2005 2004 2003 2002 2001
Michigan City $27.60 $23.60 $26.71 $26.97 $24.23Dean H. Mitchell(1) N/A.0 N/A.0 N/A.0 N/A0 $23.92Bailly $36.60 $32.86 $30.38 $30.00 $32.74R. M. Schahfer $32.37 $27.21 $27.13 $27.79 $25.49Average of all stations $32.17 $27.52 $27.50 $27.93 $26.17
Mills Per Net KWH Generated for all Fuels, Total M Therms Burned all Fuels, and Btu Per Net KWHGenerated
2005 2004 2003 2002 2001
Mills/net KWH generated(2) 17.44 14.83 15.25 14.96 15.01Total M therms 1,755,754 1,673,421 1,630,234 1,567,534 1,770,762Btu/net KWH generated 11,036 11,084 11,091 11,039 11,440
Fuel Mix for Electric Generation Including Purchased Power2005 2004 2003 2002 2001
Coal 86.7 83.9 76.9 72.4% 92.5%Oil 0.0 0.0 0.0 0.0 0.0Gas 0.2 0.0(3) 0.0(3) 0.0 0.3Hydro 0.2 0.3 0.3 0.2 0.4Purchased Power 12.9 15.8 22.8 27.4 6.8
100.0% 100.0% 100.0% 100.0% 100.0%
(1)D. H. Mitchell Generating Station taken out of service January 2002.
(2)Includes the delivered cost of coal, fuel stock expense, ash handling and sale of slag.
(3)Gas usage was only .02% of total and rounded to 0.0%.

BU
SIN
ES
S S
EG
ME
NT
S
page 23
BU
SIN
ES
S S
EG
ME
NT
S
page 23
Capacity and Operating Margins
Capacity and Operating Margins provide a method by which electrical resources are displayed to show thefuture electrical demands and energy requirements of the Northern Indiana Public Service Company’scustomers. Analyses are conducted in order to determine the optimum outcome of various electric resourceplans, which are necessary for customer demand and electric system reliability.
2005 2004 2003 2002 2001
Resources Available (at time of peak)
Net demonstrated capacity of units (MW) 3,392 3,392 3,392 3,392 3,392
Purchased power (MW) 1,086 628 827 774 9
Total resources of system (MW) 4,478 4,020 4,219 4,166 3,490
Scheduled outage (MW)* (502) (502) (502) (502) 0
Random unavailability (MW) (473) (221) (207) (245) (258)
Resources available to meet peak load (MW) 3,503 3,297 3,510 3,419 3,232
Total internal system peak demand (MW) 3,166 2,922 3,054 2,978 2,998
Capacity MarginsCapacity margin expresses the difference between total demonstrated resources and the internal system peakdemand, as a fraction of the total demonstrated resources. Capacity margin permits examination andcalculation of operating needs.
2005 2004 2003 2002 2001
Total resources of system (MW) 4,478 4,020 4,219 4,166 3,490
Total internal system peak demand (MW) 3,166 2,922 3,054 2,978 2,998
Capacity margin (MW) 1,312 1,098 1,165 1,188 492
Capacity margin (percent) 29.3% 27.3% 27.6% 28.5% 14.1%
Operating MarginsOperating margin is capacity margin less the demonstrated resources unavailable because of predictableevents such as scheduled outages and variable events such as random unavailability. Consideration of thesevariables explicitly incorporates the dimension of generation reliability into both utility operational and capacityplanning needs. The total internal system peak demand is subtracted from the resources available to meet peakdemand. This difference, divided by the total demonstrated resources and expressed as a percentage, is theoperating margin.
2005 2004 2003 2002 2001
Resources available to meet peakload (MW) 3,503 3,297 3,510 3,419 3,232
Total internal system peak demand (MW) 3,166 2,922 3,054 2,978 2,998
Operating margin (MW) 337 375 456 441 234
Operating margin (percent) 7.5% 9.3% 10.8% 10.6% 6.7%
Annual Load Factor 62.8% 66.0% 61.8% 66.3% 61.6%
*D. H. Mitchell Generating Station taken out of service January 2002 and is on indefinite shutdown.

page 24page 24
Glossary of Selected Energy TermsBcf: (billions of cubic feet) A common measurement of a large
volume of natural gas. Gas volume is denominated in cubic feetby the thousands (Mcf), millions (MMcf), billions (Bcf) andtrillions (Tcf).
Block: Offshore area identified numerically.
Btu: Abbreviation for British thermal unit, a measure of heatingvalue — the quantity of heat required to raise the temperature ofone pound of water one degree Fahrenheit at sea level.
Cogeneration: A process that produces electrical and thermalenergy simultaneously from a single source, often natural gas.
Cost Tracker Revenue: A special revenue provision approved bystate regulatory commissions to recover operating and capitalexpenses not contained in rate base.
Deferred Taxes: Income taxes resulting from the use of income taxlaw provisions which allow recognition of certain items ofrevenue and expense in the tax return prior to their beingrecorded on the books of the company. Deferred taxes do notconstitute earnings available to pay dividends to investors.
Degree-Day, Cooling: A measure of the need for air conditioning(cooling) based on temperature. A cooling degree-day measuresthe variations to the daily mean temperature above a referencetemperature. NiSource measures cooling degree-days relativeto a reference temperature of 65 degrees.
Degree-Day, Heating: A measure of the coldness of the weatherbased on temperature. A heating degree-day measures thevariations to the daily mean temperature below a referencetemperature (estimated temperature at which heating loadbegins). NiSource uses a reference temperature that variesslightly across the region, resulting in a compositemeasurement based on 62 degrees.
Dekatherm: (Dt or Dth) A measure of heating value equal to onemillion Btus (MMBtu). One dekatherm is roughly equivalent toone thousand cubic feet (1 Mcf) of natural gas; specifically, for1998, the conversion factor for the production of dry natural gasis 1 Mcf equals 1.026 MMBtu (or, 1.026 dekatherm).
Derivatives: A financial instrument whose value is based on acommodity or other security, e.g., futures, options, swaps, andforwards. A derivative’s value changes with changes in one ormore underlying market variables, such as commodity prices,interest rates or foreign exchange rates.
Distributed Generation: A system of energy production that islocated at the point of use. It typically involves less than 500kilowatts of capacity and often includes provision for thermalenergy recovery and electric production.
Exchange Gas: Gas that is received from (or delivered to) anotherparty in exchange for gas delivered to (or received from) thatparty.
Exposure: A firm’s vulnerability to loss from unanticipated events.These events might include movement in financial marketvariables, such as foreign exchange rates, interest rates orcommodity prices.
Federal Energy Regulatory Commission (FERC): An independentfive-member commission within the Department of Energyresponsible for setting rates and charges for the wholesaletransportation and sale of natural gas and electricity; thelicensing of hydroelectric power projects; and for establishingrates or charges for the transportation of oil by pipeline, as wellas the valuation of such pipelines.
Firm Power, Electric: Power or power-producing capacity intendedto be available at all times during the period covered by acommitment, even under adverse conditions.
Firm Service: Service offered to customers under tariff authorityand associated contracts. It anticipates no interruptions otherthan unexpected and uncontrollable events.
Gigawatt: One billion watts.
Gigawatt Hour: (Gwh) the energy of one gigawatt supplied for onehour.
Interruptible Service: A reduced-cost gas transportation serviceoffered to customers that anticipates and permits interruptionson short notice.
Kilowatt (kw): 1,000 watts. A watt is a measure of the rate at whichelectricity is generated or consumed.
Liquefied Natural Gas (LNG): Natural gas that is converted to aliquid state by reducing its temperature to minus 260°F atatmospheric pressure. As a liquid, LNG takes up one six-hundredth of the space that the comparable gas vapor wouldrequire, allowing it to be stored economically in cryogenictanks, or transported in cryogenic ships.
MMBtu: One million Btu.
Market Center or Market Hub: An interchange where a shippercan gain access to multiple transportation paths, flexiblesupply/delivery points and, as a general rule, other servicessuch as imbalance protection, short-term storage (“parkingservice”) and gas lending or borrowing services.
Mark to Market: The daily adjustment of the value of derivativepositions to reflect profits and losses resulting from pricemovements occurring during the last trading session.
Megawatt (mw): The generating capacity of utility plants isexpressed in megawatts; a megawatt is 1,000 kilowatts or 1million watts.
Operating Margin: The difference between operating revenuesand the cost of sales. It is the contribution made to cover allother operating costs, fixed costs and profit margin.
Peak Day: The day of greatest total gas sendout.
Peak Load Demand: Electricity or gas supplied during a period ofthe greatest demand.
Rate Base: The amounts invested on which a regulatory agencyallows utilities to earn a return.
Risk Management: The process of identifying the risk-returntradeoffs available to a company in the course of its businessactivities and the process of developing and implementingplans which limit or reduce risks while simultaneouslyproviding an acceptable return.
Sales for Resale: Sales made to a local distribution company,pipeline, or municipality where the gas will be resold by the purchaser.
Shipper: Owner of the transportation contract, for whom gas is transported.
Short-haul Transportation: A gas transportation service providedby a transmission company over short distances along itspipeline system.
Spot Market: A market characterized by short-term, interruptible(or best efforts) contracts for specified volumes of gas.Participants may be any of the elements of the gas industry—producer, transporter, distributor, or end user. Brokers mayalso be utilized.
Therm: A quantity of heat equivalent to 100,000 British thermal units (Btus).
Throughput: Total volume of gas delivered.
Transportation: The act of moving gas from a designated receiptpoint to a designated delivery point pursuant to the terms ofa contract between the transporter and the shipper. Generallyit is the shipper’s own gas which is being moved.
Transporter: A legal entity which has the capability of providingthe service of transporting gas. Transporter includes gather-ing companies, pipeline companies and local distributioncompanies.
Underground Storage: A service that permits the injection oflarge quantities of natural gas into underground rockformations during periods of low market demand andwithdrawn during periods of peak market demand.
Utility Plant: All property and equipment used for the generation,transmission, and distribution of electricity and storage,transmission and distribution of gas.
Value at Risk (VaR): The potential loss or gain for an instrumentor portfolio from changes in market factors, for a specifiedtime period and at a specified confidence level.
Volatility: The degree to which the price of a commodity orsecurity fluctuates around some mean value. It is usuallymeasured as the variance or standard deviation of the price.
Wheeling: Electric utility operation wherein transmissionfacilities of one system are used to transmit power producedby another system.

Board of Directors
Gary L. NealeChairman NiSource Inc.Merrillville, Indiana
Dr. Steven C. BeeringPresident EmeritusPurdue UniversityWest Lafayette, Indiana
Dennis E. FosterRetired Vice ChairmanALLTEL CorporationLittle Rock, Arkansas
Peter McCauslandChairman and Chief Executive OfficerAirgas, Inc.
Steven R. McCrackenChairman, President and Chief Executive OfficerOwens-Illinois, Inc.Toledo, Ohio
Ian M. RollandLead DirectorRetired Chairman andChief Executive OfficerLincoln NationalCorporationFort Wayne, Indiana
Robert C. Skaggs, Jr.President and Chief Executive OfficerNiSource Inc.Merrillville, Indiana
Richard L. ThompsonRetired Group PresidentCaterpillar Inc.Peoria, Illinois
Robert J. WelshChairman and Chief Executive OfficerWelsh Holdings, LLCMerrillville, Indiana
Dr. Carolyn Y. WooMartin J. Gillen Deanand Ray and Milann SiegfriedProfessor of ManagementUniversity of Notre DameMendoza College of BusinessNotre Dame, Indiana
Roger A. YoungRetired ChairmanBay State Gas CompanyWestborough, Massachusetts
NiSource Executive Team
Robert C. Skaggs, Jr.President and Chief Executive Officer
Robert D. CampbellSenior Vice President, Human Resources
Peter V. Fazio, Jr.Executive Vice President and General Counsel
Larry J. FranciscoVice President, Audit
Jerry L. GodwinSenior Vice President, ElectricGeneration and Transmission
Christopher A. HelmsPipeline Group President
Glen L. KetteringSenior Vice President, Corporate Affairs
Harris H. MarpleSenior Vice President, Distribution Operations
Michael W. O’DonnellExecutive Vice President andChief Financial Officer
Kathleen O’LearySenior Vice President, EnergyDistribution Regulated Revenue
Violet G. SistovarisSenior Vice President, Administrative Services
801 E. 86th AvenueMerrillville, Indiana 46410-6272
Security Contacts:Transfer Agent, Registrar, Shareholder Records and Dividend Disbursing Agent
Account Maintenance:Mellon Investor ServicesPO Box 3315South Hackensack, NJ 07606-1916
Registered/Overnight Delivery:Mellon Investor Services Stock Transfer Department New Port Office Center VII480 Washington Blvd.Jersey City, NJ 07310
Phone Contact:(888) 884-7790
Web Site:www.melloninvestor.com
Investor Relations Contacts:Investor RelationsNiSource Inc.801 E. 86th Ave.Merrillville, IN 46410
Glen L. KetteringSenior Vice President, Corporate Affairs
[email protected](219) 647-5765
Randy G. HulenDirector, Investor Relations
[email protected](219) 647-5688
Rae KozlowskiManager, Investor Relations
[email protected](219) 647-6083
Internet: http://www.nisource.com
Shareholder Information:Shareholder ServicesNiSource Inc.801 E. 86th Ave.Merrillville, IN 46410
www.nisource.com