njdep - njgs - tm 88-2, hydrogeologic study of water well failures
TRANSCRIPT


STATE OF NEW JERSEY
Thomas H. Kean, Governor
Department of Environmental ProtectionRichard T. Dewling, Commissioner
T
Environmental Management and ControlDonald T. Deieso, Assistant Commissioner
Division of Water Resources
George McCann, Director
Geological Survey; Hai8 F. Kasabaeh, State Geologist
t_
g ..... _ - __:_ -_ 2: - . - ;2--
_8 "
F_=--; ....... =.... ; -.7 .... =..... _-"--" --'=-- : .... - =- .... --':-_-'='-: :

New Jersey Geological SurveyTechnical Memorandum 88-2 ..
HYDROGEOLOGIC STUDY OF WATER-WELLFAILURES INARGI1J JTE BEDROCK OF SOURLAND MOUNTAIN,
SOMERSET COUNTY, NEW JERSEY, IN 1982
by
Hugh F. Houghton
New Jersey Department of Environmental ProtectionDivision of Water Resources
Geological Survey .CN-029
Trenton, New Jersey 08625
1988
Reprinted 1989

CONVERSION FACTORSme
Area
Iacre= 43,._50s_juarefeet(_)I square mile (mi') = 640 acre_
Volume
i cubicfoot(f_ =7.4SIs_llcm
Flow (p_pim_oa, _,,_ discharge, or r_.harp)I inch/year= 47,580gallons/day/squaremile(glxi/mi2)
New Jersey Geological Survey Technical Memorandums are briefreports prepared for timely response to issues of concern. Thismemorandum may be quoted prodded th_t the following format isused:
• Quoted excerpt (in quotation marks), New JerseyGeological Survey Teehn;cal Memorandum 88-2,Houghton, 1988.
Use of brand, commercial, or trade names is for identification pur-poses only and does not constitute endorsement by the New JerseyGeological Survey.
ii
CONTENTS
pageAbslraa ...... -- ......... 1Imxoduaio. ............... __ 1
Purpose _ study ........... 1Methodsofinv_tloe 1Act,,uw,.k._o,w_t_ .... - ,,, 3
Regional geologyand topography ................. 3Jointsand faults _ -- 5Soils .......... 6
Groundwat_ _ ---- 8Storagc and moveme_ ......................... 8Waterwells._ J ............. 9Thehydr_o__ _ ................. to
,, Hydrologic data ................................. 11r,_ nRunoff , ___ 12ii _ _ : : _ ,,, ,,,,,,,:===::_
Evaporation ................. 12Well andaquifercharaacrLsd_..... 12
Wellyieldsandspec_tc c,ap_tle__............ 12Wal_ levels ............. , .... . 14
: Co_.uousw_cr-lcw.lmeasurement............. -- 14Hydrogeologic inte, _'etadom ................. 18
'_ E_m._tes ot're,'h_,_ and m._st_l_ yield .................... 18Water l_dgct fortheSo_rlandMouvtal- area .......... -- H, , 18Rate of ground-waicr wi[hdrawaJ............... 23
Domesticwatersystems................... 24Condusi_ .......... 24Dis_ss_ and reco_,_.datiom ......... 25
Sp._o d_Is a_ 1o¢dze _ • ,_ , 25Depthdyes ................................................Roadwaydr,,b_ .....................___ _ _, ,Poss_I¢ r_ forwell failuresin_'udyarea __ 26
Referencescited.........., ..... 26
m

FIGURES
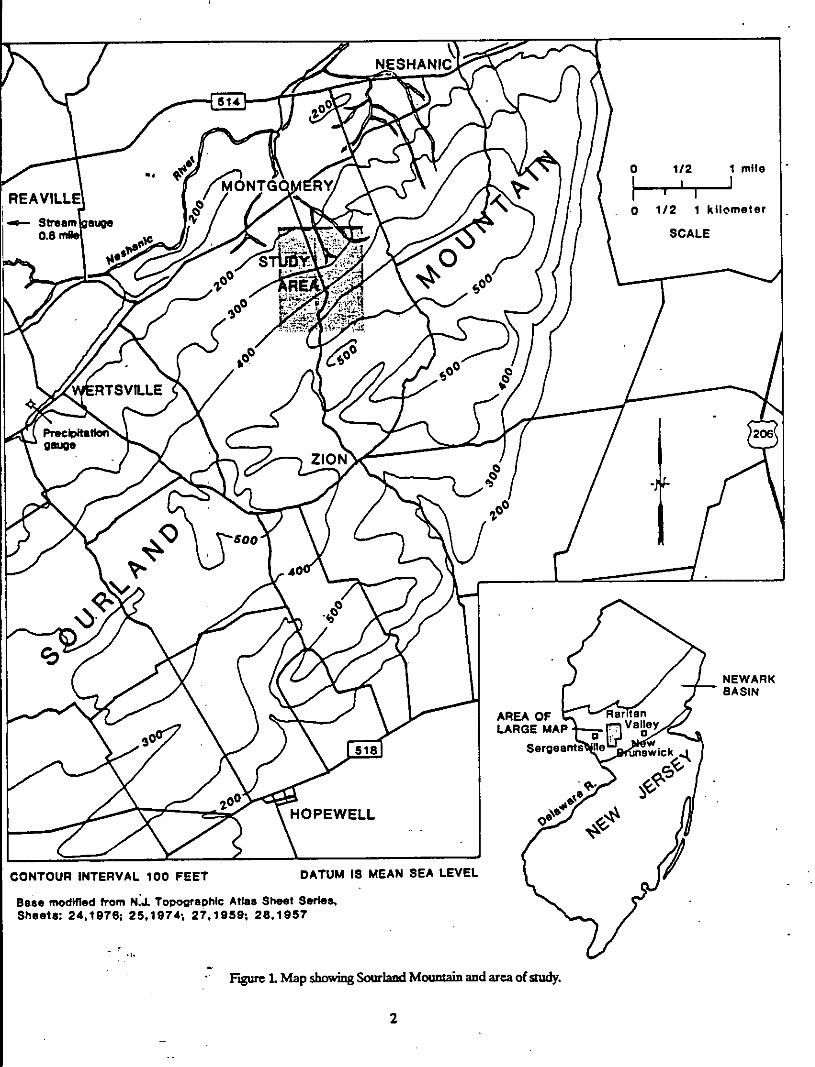
pageF_JreL Map showing'Sourlr._dMonnt:dnandareaof_'_y ....... 2
ZGene_vb,_igeologicscaiomshowingeveluticed geologyandtopographyc£SourlandMolmt*Mreglon......... 4
3.Typicalsot'lprofileon_ong Fommtion,SourS-,4Mo_mtM- _..... 74. Sollmapofstudyarea............................ 75. Diagr_mm_c c3r(r_sc_ctlonof awe_ _ a ffacfufed bedrock aqu_er ............. 96.System_h_,_ofthehydrologiccycle ............... 107. Annual precipitationand streamcIL_, ,ge near SourlandMoant_i, ..... 11& We.Jl-locad_m_-_p ..................... 149.Hydrcgcologksectlc_ofstudyaP_ ..... 1510.Flu_,_tino.s of waterlevels in se_enwellso_ Deceml-cr 16 - 17,1982 ......... 1711.Me.a. aa.-ual ground-water lcveJ.s;- Scr_. ts'.,iI_.._oragc...'_. e_.
andprecipitatioaat Wertsvme............................................ 21
TABV.v__
Ta cca ofbcdrock walls ............... 13
3.Publishedestimatesofre,'h,,,vj:or,,,,,_,,;_Mc_ld ....... 194.Annual wa_ budg_ for the study axca,1.969-1986, __ 225.l=_;,_ted _otmd,watcr withdrawalrates in 1982 ......... 23
iv

HYDROGEOLOGIC STUDY OF WATER-WELL FAILURES INARGII.HTE BEDROCK OF SOURLAND MOUNTAIN,
SOMERSET COUNTY, NEW JERSEY, IN 1982
by
Hugh F. Houghtoa
AI_-rv, ACT
The Sourland Mountain area is underlain by hard, relatively impermeable sedimentary rock (argil-rite) of the Lo,t_tong i%rmatioa of late Triadic age, and hard iatrasive igneous rock (diabase) of earlyJurassic age. Average well yield from the diahase is among the lowe..qof any bedrock type in New Jer-sey. The median yield from wells tapping argillite in the study area is between 2 and 3 gallons perm;n,ae,. Some of the lowest reported yields fromwells tapping arTlllte occur where the ar_lllt¢ hasbeea baked by adjacent ___:
Severe water-level de_']_ne_swere reported in several wells near the lop of Sourland Mountain inFHILtboro-_hTow_hip, Somerset County, New Jersey, late in 1982. This study was initiated to deter-mln¢ the catl._ of the well failures.
The principal cause of ground-w'ater-level decline was overpumping in an area of closely spacedwells. A three-year period of below-normal predpitatioa (1980-1982) coatn'buted to the problem, butwas probablynot the ,,,a;n cause of well failures in the study area.
Water budget calo,htlons for the years 1969though 1986 suggest that a _um deficit of ground-water and soil-moisture storage occurred in 1980, during the firstyear of a three-year period of lowprecipitation. Water levels in wells were probablyrecovering to nearly normal levels during 1982.
The rate of gronnd-water pumping on a particular 1.0-acre lot in the study areawas estim_ted to ex-ceed 500 gallons per day. This withdrawal rate was probablythe main cause of depression of waterlevels centered on two wells on this lot. Observed water levels in these wells and two adjacent wellswere more than 100 feet below regional ground-water levels in December, 1982.The areal ca:eat ofwater-level depression was _mall_ indiot/n_ an aquifer with low permeability.
INTRODUCTION
Purpose ot Smdy
In the winterof 1982-83 the New Jersey Geological Survey inve,q,lgated the geology and hydrology ofthe northeast part of Sourland Mo-ntain in Somerset County. The study area is delineated in figure LThe purpose of the study was to determ;ne the causes of ¢a'iticallylow ground-water levels and to im-prove understand;-_ of the ground-water sy_em in this area.
Methods o/"Investigation
The plan of investigation included the following tasks:
1. Compile records of wells in the area affected by lowered ground-water levels.2. Measure ground-water levels and compare them with older levels, to determine whether long-term
rh_n_es had occurred.
1
0 1/2 1 milem4
MONTGC [ , I I I0 112 1 kilometer
StreamSCALE
,_00
9euge
NEWARK
AREA OF
CONTOUR INTERVAL 100 FEET DATUM IS MEAN SEA LEVEL
Base modified from N_J.Topographic Atlas Sheet Series,Sheets: 24,1976; 25,1974; 27,1959; 28,1957
" F'_r= 1.Map showingSourt=,,,tM(_,-t=;- andareaof sl_cly.
2

3. Perform pumping tests and observe drawdowa and recovery rates in order to determine aquifereharaclerisfiot
,: 4. Obtaincontinuous water-level d_t_from an observationwell in the studyarea, to determine the ,,a_.nitode of short-term water-level fincn,ati,ms.
5. Inspect domestic water-supply systems to determine pumping capacity and other relevant data.; 6. Provide d_¢_and interpretations to aid in plannln_ groulld- water use and delineate pos_le preven-
tive or remedial measures.
Data pertaining to ground-wuter _,_n'ence, inducli.z weRrecords, soil logs, soil maps, andgeologic maps and reports were compiled for the study area. Precipit_tion records for Wertsville,re'cam dL_harge records for the Ne_ha-;c River at Reaville, and pan-evaporation records for NewBnmswick were compiled for the period 1969-1.985.A hydrologic budget for the Sourland area wasprepared from the above data.
report covtaln-, more background information Ih_,nusual for a tcrhnicafly-orientcd readership.It is hoped that this additional material will make the results of the study access'hie to awideraudience, particularly among resideut.s and of_dak of the Sourland Mountain region of New Jersey.
This study was initiated in 1982under the sol_rvision of Frank MarkewicT.,then An;-g State•Geologist of New Jer_y. I th_,-k several of my colleagues at thc New Jersey Geological Survey (NJGS),inclurl;-Z Daniel Dombroski who assisted with water-level measurements under adverse conditions, I.G. Gro¢_m_nwho suggested ,¢.;ng a water budget and made ma,y helpful editorla] commel_q, andJames Boyle who helped develop water-budget methods presented in the report. Richard Walker ofthe U. S. Geological Survey (USGS) provided water-level recordinE in.qtn/mentat;qn.The manBS_pt
benefited from ou_de reviewsby Otto Zapecza and Charles Wood of the USGS. The methodologyused and condusioes made in this report do not necessarily coucur with the views expressed by thercvinwers.
GEOLOGY
Regiomd Geology and Topography
Sourland Mountain is formed by the leading edge of a tilted slab of bedrock, or fault block, whichextends in New Jersey from the Delaware River northeastward into the Raritan Va/ley. The fault blockis tilted northwestward,ea,,¢;,_ the rock layers to dip down toward the northwest (fig. 2). Slopes f_"Snorthwest are moderate, ro-zhly paralleling the layering of the rocks.The erode.d surface of the faultuplift faces to the southeast, where slopesare irregularand generally steeper than northwe_- f_,"]n_dope& The snmmit of Sourland Mountain is elongated in a northeast-southwest direction and rises to amaximum elevation of about560 feel The highest ridges of the plateau-like snmmit are underlain bydiabas_ while secondary s_,mmlt.qon the north flank of the mount ain are underlain by argillite.
The Sourland fault block con.sLqsof a thick section of sedimentary rocks intruded by a sheet-like sinof dlahasc, an in_ igneous rock commonly ca]led "traprock'. Tbe seA;meutary rocks are late Trias-sic in age (21.5to 200 million yearsold), while the diabase is somewhat younger, datins from earliestJura._c time (about 195 _illion years ago) (Cornet, 1977;Dallmeycr, 1975). The seA;mentaryrocks atthe base of the fault block are tan and red sandstone of the Stockton Formation. This sandstone is over-lain by the Lockat0ngFormation, composed mostlyof ar_llite, agray, hard siltstone with abundantfine- grained cementing m;.era/s. Recent geologic mapping by the NJGS indicates !hat the ar_/f'llitese-quence is about 2200 feet thick and the diabasc is about 1400 feet thick. The uppermost beds of theSousland fault block are part of the Brunswick Group, consisting mostly 0f reddish-brown silt.stoneand
3

Before Faulting
NW $E/and =urfa¢o
• _ ',.:; :.. ,t'".'.." : ".'" :-.;" ".'." ":' -'"-" .... :
SE
After Faulting
NW
So.flaredMountain Rocky Hill
%_, After Erosion Studyarea_ I Hopewell I
NW . I ": _"" ".?.'" ._:2.::: _.:; SE•:'',.. . ..'_"
w_* • , -
r'--I an_wick Gro,m
l.ockatonOFormation
Stockt_t F_rnstJon
FigureZ Gener_l;Tpdge_ogk:sectionsshowingevolutionofgeologyandtopogra_yofSou_-RMotwt_;- regioa.
4

mudstone without hard cement. The direction of maz_um dip of the _Ai"nt_'T rocks is about 35
degree_ west of north (N35W); the dip _-_e averages about 18degrees near the study area.• The ar_'lllte below and above th_ _ _ has be_n ba.kedand harde.ned.The baked or thermal-
ly met__amorphosedzone c_ends more than one hundred feet into the underlying rock, and severalhundred feet into the overlyingse_4;m,ntaryrock.At the land surface, the lower and upper baked
,i zones have an outcrop width of about 500 and 1400feet respectively (H.B. K,Immel, written com-muulcntloa, 1896).
Physical properties of the ,-l;_haseare fairlyuniform from the bottom to the top of the sill except forminor ,-h_-_es in crystal_i,_ or mineral composition. The-cosubtle rh_n_ in the ,4;_hasedo not great-ly affect its hydrologic rh_ractes. However, vertical variations in sedimentaryrocks _n ,tlo, if;,.._,tlyaf-fect their hydrologic prope_ox
The sedimentary rocks cons_ctof both thick beds (about 6 feet to more the, 30 feet thick) of hard,sparely fractllred _iltstone or argil_e, and thlnncr-be.dded interlayers (commonly tt_lino I tO1.5feetin thickness) of soft, highly frac_red mud.stone.Mudstone beds are not abundantor thick in the upperLockatong Formation. Ill the lower Bruns_ck Group mudstone beds increase upwards in number andthick_ex_ Mudstoue beds store more water per unitvolume the, the hard sandstone and ar_'llite, dueto their greater po_. The scarcity of mudstone beds in the upper Lockatong Formation diminiehesthe av-_ilahleground-water storage capacity of the bedrock aquifer. This is a factor in low yields andlow spec/fic capacities ofwe_ in the study area.
Most of the study area is underlain by arg_te of the Lockatong Formation. All domestic wells with•h_p water-level declines reported in 1982 tap this formation. Thre_ deep wells also penetrate the ua-derlying di_huse. The argillite is thickest in the north, at its contact with the overlyingsiltstone of theBrunswick Group. There, the ar_lllte extends to a depth of about 800 feet (see fig. 9). The argilliteOVerliesthe diaha.se_ which intersoc_ the ground surface a few hundred feet so.thez.st of the studyarea.
Joints and Fault3
In the rocks of the Sourlund region, most of the ground water is stored in and moves through frac-tore_ These fracturesare of two types: (I) hi_h-ansle joints and faults, and (2) becl,_i._- plane joints.
I41_h-,,_le joints are fracture planes which developed nearlyperpendicular to the becl,t_,_ of therocks while they were still neatly horizontal These joints are nearlyperpendicular to berlHi-Zeverywhere in the Newarkba_in_even where the bedrl_nodips steeply. These joints occur in regularsets, mostly trunH;n_1.5to 50 degrees east of north(N15E to N50E). Sl_"_n_ betweeo hi_h-='noJ"jointsranges from less than 6 inches in typicalsiltstone beds to more than 36 inches in rn_t_iveargilllte anddiab_. Joints arc alwaysmore closely spaced in fault zones than they are in the _rne rocks elsewhere.
The low fracture permeabLUtyof some of the argiUlt¢beds of Sourland Mountain may have been fur-ther reduced by thermal alteration by the intrwli-_ diabase. The di_ha._ was probablyemplaeed •before the formation of the prevalent hi_h-anole joinL_ Therm=l hafdenino by recry_alliTation of argO-rite beds adjacent to the igneous intntsion may have incr_ the re__i_anceof these beds to fractur-ing. Arg_te in the "baked"zone.sabove and below the diabase sill may have fewerjoints per ,nitvolume of rock and therefore, lower fracture por,y.hy.
Faults are hactures along which differential movement has occurred. Most faults in the Newarkb_,_inoccurinsubparanel groups referred to as fault zones. Ma_orfault zones, such as the Hopewullfault located southeast of the study area, can consist of hundreds of individual fault planes in a zonethousands of feet wide. Many faults in the Newarkbagln are oriented in a NE- SW direction, roughlyparallel to the most common dire,t_OUof strikeof be.0d|n_ and the strike of principaljointg
Individualfaults commonly have azone of broken rock ran_no in width from less than one inch tomore th=n 36 inche..._Some faults, espe_nlly those in the major fault zone&,are continuous over long
5

et
distances. Such halts may connect water-bearing joints and beds and cause adjacent wells to interactstrongly.
Faults may be discernible during the dr,ll;n_of a well and may be reported by the driller as soft"seams' (a driller'sseam can also be a soft or highly fractured be.d).Faults often covta;n m;nerals suchas calcite.,epidnte, or pyrite, which maybe reported by the driller. Large p_ie_s of rock may appear inwell cntt/n_ from a fault zone since the already broken rock can be flushed out of the hole before it ispulverizedbytherotarydt;m._bit.
•Porosity and permeability can be either greater or less than usual in fault planes. Many faultsproduce ample supplies of water, especially from hard rocks such as .sandstone,ar_.'ll;te,and dlabaso.In other iustan_, _d particularly in soft rocks such as mudstone or shale, fault planes may containlarge amount_ of clay and puh,eKze.drock.This pulverizedrock, known as "faultgouge" can be quite im-permeable, c_-,in_ the fault plane to act as a flow boundary to ground water.
Joints are usually closely spaced in fault zones. As a result, fracture porosity of the bedrock may beenhanced w_thlna wide zone (thousands of feet or more) on either side of a major fault.With the ex-ception of the extreme northeastern end, the north flankof Soarfand Mountain is distant from majorfault zones. _ fac_brmay contr_ute to the low yields of wells in the study area, compared to areasalong the southern _d eastern flnnktOfSoarland Mountain near the Hopewell fault zone.
The second general .h_, of fractures is b,'_4_;n_plane joints. The spa";n_ of these joints is depend-eat upon rock type. Diabase is not bedded and therefore does no( have bedclin_ plane joints. SomejOints in the dlaba._ are subparallel to the bfddin_ of the enclosin_ sedimentary rocks; the.s4: are typical-lywidely spaced (scgeral feet to tens of feet). In sedimentary rocks bedd;n_-plane spacing can rangefrom tens of feet in n_n,,-,_ivaargillite, to tenth_ of an inch in fi_le siltstone and _hnle.Be0d;n_-planefracture porosity can thus range overseveral ordersof ma_itude in different rock types.
SOUs
£,o1"1logs based on percolation test pits in soil overlying the ar_'tlltebedrock of Sourland Mo untaintypical_ show a th;. (6 to 10 inches) o_rs_ni¢-richlayer, and a much thicker (48 to 72 inches) inor_n;esubsoil made up mostly of dense clay with a putty-like corLsL-.tencywhen wet (fig. 3). Soil logs with per-colafion test results are prepared by en_neering firms and filed with other site permits for each lot atthe local govexnment o_e_-_ The Soil Conservation Service (SCS) soil report for Somerset Countydescn'bes the subsoil of the Leh;Eh series, which underlies much of the study area, as a silty clay loam(Kirkham L976). I_ clay content may be as much as 40 percent (Foth, 1983, p.26). The subsoil contaln_progressivelymore broken rock withdepth. Fractured ar_lllte with some clay is usually encountered at5-6feetbelowthesurface(fig.3).
Solk of the study area are shown in figure4. Most Ofthe soils are mapped as Lehigh sir loam (LhBand LhC), and Penn thaly silt loam (PnC) (Kirkham_1976).The "]3"indicates slopes of 2-6 percent; the"C"means 6.-12percent slopes. Some soil unit boundaries have been modified for this study to reflecttrends of the bedl'ockform_tloM
The areawhe_ well problems occurred in 1982 is covered by Lehioh series soils. The water-bearingeharacleristies of _ series have been described by Kirkham (1.976, p.29)as follows:
: "Permeability is slow in the subsoil, and the available water capadty is moderate. These soils haveawater table perched at a depth of 1/2 foot to 4 feet during winter and early in spring."Thick, clay-rich subsoil which develops on the argillite hinders infiltration of water into the bedrock
aquifer. As a result, perched water tables develop within the subsoil zone during periods of highpredpitation. This perched water slowly percolates into the underlying bedrock, or returns to the at-mosphere by transpiration and evaporation during drier partsof the year.
6

--_ } e-lo in. orQanic_lchtopso,
• • _ . " °'° l_ o . , . ° . _
• . _ . _ ". .._ (> 48-72 in. inorganic clay subsoil
"c::_ ..':_..;.-<_._':;-... /
: broksorockpodc,.,"""-'--'_"T',_---_.- • "
\ fractured bedrock
b
Figure 3. Typical soil profile on Lockaton8 argillit¢, Sourland Mountain.
KICLeC
Explanation
ADA - Abbotlstown silt Joam. • .0-2 percent slopes
CrA - Croton slit loam.0-2 percent slopes
KIC - Kllnesville shaly loam,4-12 percent slopes
LeC - Lawrenceville silt loam,6-12 percent slopes
Lha - Lehigh silt loam,2-6 percent slopes
LhC - Lehigh silt loam.6-12 percent liooes
PnC - Penn shaly loam.6-12 percent slopes
Ro - Rowland silt loam
Note: CrA-U_ and LhC--PnCcoff,acm coetciDeal3_oxim&tlly with ¢Ont&¢tl ol I_iablle--Lotkl_and Lockltor,_l-Brunlwk:k. rtlDec_,e_.
CrA
F'q_r¢4,Sollmap of st_J area,,,_.GRed fromIGrkham(1976).
7

GROUND WKrER
Storage and Movement
Ground water is stored either in pores between gr_;n_or in fractures in bedrock. Moderately ce-mented se_-l;meutaryrocks havepores between their gr_;-_. "r'_atly_mented sedimentary rocks suchas ar_llltc, and most igneous rocks such as diaba_,-_generally lack pores between graln_or mlneral._ Inthese rocks, ground water occurs ahnost entirely in fractures. Storage aad flow of ground water w;th;.fractured bedrock is largely controlled by the orie-t_t;oo and density of fractures. Ground water flowin systematically fractured bedrock is generally nnl,-'_tropic,t_t is, it flows more readily in some diree-tlons than others. Ground water flows more easily parallel to continuous fractures such as prindpal
hie'h.an_l¢ joint_ and bc_clin_ plato" jo_nt_ It also flows more easily along beds with hizher fract3/rc per-mcabi/ity, such as t_e ,-iltuone bed_
Anisotropic ground-water movement causes wells which are closely spaced along a preferred flowdirection to interact more stiongly than wells oriented in other directions. Anisotropic flow parallel tothe strike of bcd,4;n_!hasbeen reported in the Newark badn and the adjo;-;n_ Gettysburg badn in Pea-nsytv_nh by Herpars and Barksdale (1951), Longwill and Wood (1965), Veechioli (1967), Veechiolland others (1969), Wood (1980), and Spayd (1985). Strike-parallel preferred flow under pumping con-ditious may result from any of several factors, incl-d;-_
L Some beds are more permeable than others. Wells drilled along strike of these beds are likely to tapthe _,_e parmcable horizons.
2. Principal hi_h-an_le joint strike is cl .osc to str_e of bcdcl;n_ throughout much of the Newark bagln.
3. Beclcl;n_-plane]oints have the came strike as bedcl;n_
4. J-l;_h-an_le fraotm'es commonly ter-,;-ate along bedd;,_ surfe_,_s=As a result, the large-scalegeometry of fracture systemscanbe thatof tabnhr zones oriented nearlyparallel to be4:ldln_ planes.
In the study areawells are more likely to interfere with each other if they:.
- are _l;_,nedparallel to the strike of ma_orhi_h-an_le jo intg. aver'a_n_ about _ or- tap the came beddi,_-pt_-e joiuts or permeable beds, which depends on both depth and direction
between welis.Wager oc,c't_ in two zones in the substtrface.: the shallow tm.qatl/rated ZO_ and the underlying
saturated zone. The interface between these two zones is called the water table. All free water whichoccurs in the saturated zone is considered ground water. In the satm'atedzone., all pores in the subsur-face material are h'11edwith water. Ground water below the water table moves in response to differen-ces in head from re_.h_rgeto disr.hargeareas. Re_harge areas arc mostlyuplundg where elevations andpoteutiometric levels are hi_her than elscwhere. DL_'hargeareas are found at low clcvafions, at_ater_tabPrlno'tswamps, ponds, and str,_m_ Groundwater also flows toward ,,anmade depressions in the
In,such as the cone of depression around a pumped well
A scmiconEned aquifer is a stratumor bed withrelatively h;oh pe_illty, boanded above andbelow by less permeable strat_ of which one or both are leaky. Semico- f;ned conditions cau occurwhere intercounccted fractures form discrete networks bounded vertically by less fractured rock. Thcpressure surface for such an aquifer connects points at the hi_h_ saturated elevation in the aquifer.Ground water at any point w/thin a f_mlconfincd bed or fraotllre system will rise in H_htly-Gtscd weltg
to the same height as the top of the pressure surface, Thus, water in a well will rise to a beight which is
called the potantl0matrlc surface or head. The static, head is the head or potentiometrie surface in a.well which is not being pumped. The pumping level_ the level to which the head drops under pumpingconditions.

Water Wd/s
Wells drilled into fraclured rock first penetrate an upper water- saturated zone, which is commonlya _h_/lq_vwater-table aquifer. Shallq_vground water may be subject to col_tamlnatlon from on-site sep-tic disposal aad other sour_ee_so a steel casing long enough to reach below the _hallow water table iscemented into the wellbore. This _d,_ ;,h_its water firomflowing directly to the well from this zone.The well is then dcepene._ usually .nt;I one or more semico-_-ed aquifers are penetrated.
Most moder_ wells are equipped with a submersible pump which is lowered into the wellbore at theend of a steel or plastic pipe. The pipe serves as a conduit for the well water. The pump is set farenough above the bottom of the well so that it does not stir up sed;m-_t and draw it into the pump andpip_gsysu=_
When the pump is OpClvt;no Wutf.r is withdrawil from th¢ wem)ore_ which lowers the water lfvcl in
the well Lo_ of head by pumping is called drawdoma.Drawdowa hathe well depresses the watertable oi the potenfiometric surface surrotmcli-g the well, form;ng a coae of depression. As drawdownincreases, th_ area of the water-table depre-,_ionexpands. If drawdown is sufficiently deep and thecone of depression expands out to nearbywells, their water levels will drop. This effect is well later-fereace. Figure 5 illustrates drawdowa in a well drilled in fraclured bedrock.
At the time of completion of a well, the driller is required to perform a pumping test to determ;nethe yield of the well and observe the drawdown after a period of time, generally at least one hour. Ideal-ly, the test should be rua for a period long enough for the water level to stabilize. For low yield frac-tured- rock wells, however, the pumping test usually ends when the water level drops below the pump;nt_k_
The yield of a well is determined either by blowing air into it or pumping it and measuring the dis-charge rate. The sI_J_¢ capacity of a well is the number of gallons pumped per minute divided by then,mher of feet of drawdowe. Specific capacity is expressed in gallons per minute per foot. Wells withhL,2hspecific capadt 3,produce more water and recharge more quickly than thO6¢with low specificcapa_,y.
.LANO SURFACE__II[_ - " - ' 'c_-'_. "- a'_-e;_-[[[,_.._¢_ ;-- PIPE TO HOUSE ----_'_. ,'_'g_--_=_-II....
11111 \-\_ _" "_ \ IIII U,eATUaAT_ZO.E
CA_ING _""
o. = RA O/ \ -----_II- \\ :/'_- ' , _o_NEAR-VERT_CAL<.__.\.-- \ \ ]_[I \\/- ', k"_ '\ ". 'Htl_._AWOOW.-\I ",, ,,,, ",----'PU.P,N_ _L \\ ,_ / FRaCtURES
\ IET_"SUBMERSIBLE
F'_ur_5.Diag_mm_dc _ sectionof a wellina E'a_ be.4rodl:aquifer,showingnonIx_[.,=,g(sl.adc)

T_ XydroJoO:Cycle
Thehydrologiccycleisthedosedsystemthroughwhichwatermovesfromthe_tmospheretotheearth _ predp;t_t;on, enters surface water aad _'otmd water bodies, flows toward oo-_,,_, and returnsto the atmosphere by evaporation and transpiration. The source of all fresh ground water is predpita-fion. The amount of water which drculates through the earth-atm_phere system varies from place toplace, depend;-.., on the el;re:Ire._ total amount of ground water available in any particular areadepcnrle ma;nly Oa tWO faC_OI'_ 1) nnnua] ¢y_'_+_s Of prrA_pit_t;on over eyalx:tratioll arid, 2) yoltlm_ of
ground-water storage and permeability of the local aqulfer(s).The hydrologic cycle caa be expr_ by the following equation:
PRECIPITATION = RUNOFF + EVAPOTRANSPIRATION + CHANGES IN STORAGE
Predpitation is moisture in any formwhich fails f_om the atmosphere. Runoff includes all forms ofsurface-water flow and some shallowsubsurface flOW, as eoq3lainr_ below. Evapotra_p/ratJon incl-desmoisture which c._porate.5 d_rec0yfrom the land surface or from &ee*watersurfaces to the atmos-phere, andwater lost to the airfrom planL5(transpiration).Storage "hA-T'.S;"dude changes in surface-water volume, so_ moisture content, and ground-watervol-,,,e.
One of the m(_,teasily understood deplctions of the hycLrologlccycle k the system ,-h_rtof Freezeand Cherry (I979, p.4). The rh_rt is reproduced here as _,ure 6. The three main components of thecyr..le(precipitation, runoff, and evapotranspiratlon) are in tablet-shaped boxes. Terms involvingstorage are in ree_,o_las boxes, and those involving rates of movement are in hexagonal bo_.5. Thepart of the cycle involvingground water is at the bottom of the chart. In this chart thron_hfan iSthecomponent of precipitation which fa.Rsdirectly on land or water surfaces, while interception ;-dudesany predpitation which is intercepted by foliage. The system chartassumes no underflow of groundwater into or out Of drainage b:atin,
(
Saturated
_-oundw at or8torsge
F'_Ire 6. Systemchart of the hydrologicc?cle.Modified fromFreeze and Cherry(1979). Reproduced by
10
From the relatio,_..h;Izshown in figure 6, an equation can be written for ground-water reJ-h_,.ge:GROUND-WATER RECHARGE .. GROUND-WATER DISCHARGE +EVAPOTRANSPIRATION (from ground water) + STORAGE CHANGE (in ground-waterstora_) -The equation above shows that ground-water re_h_,'_ isgreaterth_n ground-water discharge, ex-
cept when ground-water storage .h_._ is both aegative and greater in absolute value the.cvapotrunsplrafiun from ground water.
HYDROLOGIC DATA
Precipitation
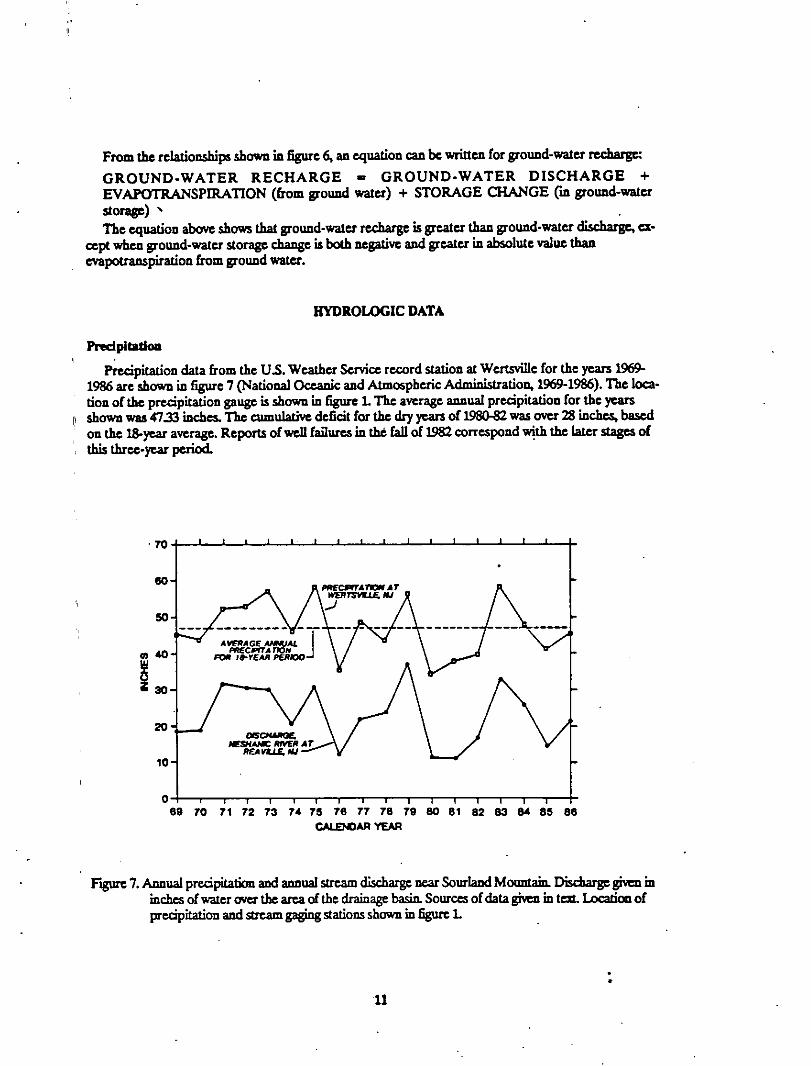
P_clpitation data from the U.S. Weather Service record station at Wertsville for the years 1969-1986 are shown in figure 7 (Nationai Oceanic and Atmospheric Aclmini_tration,1969-1986). The loca-tion of the precipitation gauge is shown in figure L The average _--_al precipitation for the yearsshown was 47.33 inches. The C_LW,,I_ deficit for thc dryyearsof 1980-82was over 28 ;nchc,%baseAon the 18-yearaverage. Reports of well failures in the fall of 1982correspond _ the later stages oftl,;_ three-year period.
,_ IIIIIIIIIIIIIIII
_40. __
FOR JO-I'I_AR PF.R+IOO
20'_
10-
0, ,;,, ,5, ,;,,, ,,,, ,, ,,569 70 71 2 73 74 7 76 T7 79 80 1 82 83 84 86
GALE]_AR YEAR
F_,ure 7. Annual preclp;t_tl,mand annualstreamdischargenear SourlandMo--t_ Dischargegiven ininehexof wster overthe areaof the drainageba_- Sourcezof datagivenin test. Locafica2ofprecipitationand s_,e.am_"5 stations shown in figureL
11

Pamo_r
DL_,-hnr_,tnrnarea._;lnhlefor twoslrr_m_dr_,;n;n__enh_.s partly;- theSom'l_ndMo_tn;nareafor theperiod1%9-1_5. The recordsare for theNeshnn;¢RiverntRea_n_e,nndStonyBrookatPrinceton. Back Brook tr_-t=,'y near ]_;nEocs,which dr=;n_a _m_ITwatershe_on the north slope OfSourland, has records from IFT'/.The qualityof records from Back Brook tn'butaryis fair to poor(UL.G.S, 1982, for '--'-,-pie). Stream flow ,_t= are published an_,,="y by the U.S. Geological Survey
The patterns of dLc-h_Tgeof the Ne_h_n;c River and Stony Brook are ,:;m,_ar,therefore onlyNe_h_-;c River data are shown in figure 7. The location of the stream gauge is indicated in figure LS_reamd;_-h,,ge is given in inches of water (over the area of the ctr_;-_ basin) so it may be com-pared directlywith precipitation atWertsville. Precipitation and stream-d_h_,ge data are also listedin table 4.
Evaporation
Evaporation me_'urements in central New J_ are made by the meteorology department at CookCollege in New B_ck (Kcith Arnesen" written communic,_ion, 1987). Mee.surements are of panevaporation, that is the amount of water in inches that evaporates daily from an open passof water. Thedata reflect daily eh*n_,esin relative humidityand air temperature; they do not, however, accuratelyreflect"trunspiration or evaporation from foliage. Pan evaporation data are listed and discussed in alater section, as part of a water-budget cakqll_ttioL
W_TX.AND AQU_-_R C_-I_R_"HCS
WL Y_ds --d S_ CapadtL_
Water-well statistics for the bedrock of the Sourland Mountain ar_:aare given in table L Meel;*nvalues rather than mca_ of yield and specific capacity were reported by Hordon (1984), because theme,rli_n iS le.._qaffee_ed by cxtrel_e vaine_ This is e.qpec_ally important for _m_ll d_t:t S_L_ such as thOS _"
in this report. The med;_- is the middle value in a set, that _ 50 percent ofth_ vulUC,qare larger and 50percent are _m_ll_r th_n the _f_l;_n
Table 1 _llmrrt:_r_-c_ water-well data for Brunswickand Lockatong Formations and diah_e in threereporting areas: Hunterdon County (Kasabach, 1966), the Sourlund Monvtain region (Hordon, 1984),and the Newark b_in in New Jersey (Canwell, 1976; Carswell and Rooney, 1976; ICx_bach, 1966;Miller, 1974;NichOls,1968; Vecchioli and Miller, 1973; Widmer, 1965). Median yields could not becomputed from statewide data.
Records are av_.hle for 24 wells in the studyarea; 18 include drawdown and specific capacity data(table 2). Well locations are shown in figure &
Merli_nyield of 24 wells in the study area, as reported by well driIler_ is between 2 and 3 gpm (gal-h3nsper minute), compared to 7 gpm for the Locl_tong argllfite in the entire Sourlund Mo.nt_;nregion (Hordon" 1984). Me_;_- specie capacity for 18wefts in the study area is 0.02gpm/ft,less th_nhalf of the 0.06 gpm/ft for ar_fllite in the entire Soorland region (Hordon" 1984). Reported yield dataare based on pumi3ingte,_ that are u_ttallyof short duration and generally do not reflect pumpingrates at which water level stabiliz_ in the welLTherefore, aaual long-term yields are probably lower,
cspe_'_lly where the record indicates that pumping level was near the bottom of the weft at the end ofthe test.
12

TABLE 1. Yield and specificcapacity of bedrock wells.Yield given in gallons per minute (gpm). Specific capacityunits are gpm per foot of drawdown (gpm/ft). Number of wellsincluded in computation denoted by letter n. Sources of datagiven in text.
Median Mean Median specificyield yield capacity
Formation (gpm) (gpm) (Spin/f t)
Brunswick
Hunterdon County 15 19 1.41(n=528) (n=528) (n,,272)
Sourland Mountain 12 - 0.24
(n-323) (n-! 12)I
Statewide 16.3(n-! 196)
Lockatong
': Hunterdon County . 6 12 0.37;_ (n=186) (n-186) (n,,63)
Sourland Mountain 7 - 0.06
(n=949) (n.,426)
Statcwide 9.5(n-393)
°.
Diabase
Hunterdon County 5 8 0.35(n=65) (n=65) (n=21)
Sourland Mountain $ - 0.07(n=213) (n=91)
Statewide 7.4(n=141)
13

Water Levelg
Statlc-water levels of wells in the study area following completion of dr,lt;-_ are listed in table 2.Some are shown along with historic water-level data in figure 9. These ,-l_r=show an area of ded'];n_inwater level in several wells located downslope from David's Lane. The ,-_rimum decline in nonpump-ing level was more th=n 120 feet, in weJ167.
In December1._ waterlevelsweremeasurediasevexalwellsduringa two-dayperiodtoobscr_typical ranges in drawdownand recovery. The results are shown graphically in figure 10. Wells 65 and67 were not operated on the mor-;-_ of December 16.The de_!;-_ of more th_, 90 feet measured inwell 66F at 1L'O0am on December 16 followed the use of a w=_h;,_ me_h;,_ in the residence. Declinesof water level in wells 65 and 67 correspond with the time of greatest drawdown in weU661=,sug_-_thatsomeinterferencewasocctmlng.
Continuous Water-Leve/Mea._u_ment
A clock-drlve- water-level recorder was instaUedon well 117R and records were kept for a 3-month
period in 1982-83.Water level, rose graduallyfrom 25.6 feet to 23.5 feet below top of "_;"Z duringDecember. Between early Januaryand told-Februarythe water level rose from 23.5 feet to 16.7 feetbelow top of casing..Rhythm;¢daily fluctuation*of water level averagedabout 0.1 foot, with a maJd-mum of about 0.2 fool Daily declin_ occurred u._,_llybetween 8 PM and 2 AM, pr_,mahly cor-respovcl;n_ to the hours of _um water use in the bent well (117F), located appro_-;m_tely250 feetfrom the recorder well
EXPLANATION
Oee Well W|ler--levelx measured for this study (t|ble 2).
Fe from well, Re few well
I 1o Well Locstion mpDroximslel ¢_m _ #roll wd
,. Enock_ -- bat_unmry
..... ¢_m_ _ _n_t_ rqum g
0 2$0 8 0 T50 feet
Scale
F'tgure8. Well-kx:afionmap.Mod;fi,-d from_rough Towr_ip taxm_n 1959,Acre ServiceCorp.
14

Northwest _)uthesst
'" A Atposition of water-- 600- "600
• table before 1965 Lockotong Formation (8rgllllte)• tts / . ._: 500- 67 II7F ___ . _-"_ ,..._.-- _ -500 m
• " \ \II_ "_,. ,_ .._ I_-,. o_
E ___ __-_ _" _ 4 I" E. _oo _,, _._ _ _oo.
" o200 7 .,_ - 200
2 'IO0 L r- i " J •
.s /t1"-'_-" zoo ' " i - loo .;o 0 -0 e:m• e• 8cole: !" ,, 300 ft. tum "submersible pump No vertical exaggeration
Figure9. Hydrogeologicsectionof studyar_. WaterlevelsbasedondataintableZ/h_c. of sectionshowni_6g_rc8.

TABLE 2. • Records of yeLLs in stray area.
Oegths are in fett belay tercel surface. ALL _LLS are 6-4rch _|not d|ameter. G_m, gaLlons per minute.
A|t wl[s top the Lockatong Formot4on. k_tts 70 end 63¢ also _trate the 6rur_wick Format|on; veLts
6_, 115, and 117R also penetrate d|adDeae.
C4mlrq Stetic v4cm" Stifle trot YieLd 4t Pure Pure Duration rater tewt, Or_a. Specific sWaxfmte
Vet| 0ate vett lenllth |Mr ot m 1_./1_6Z ¢mp(etlm CRgtJI cao_ity of pdmplr,e _ of _ _ cweclty etevetion ot
mad:er era{arid de_th(ft) (f1) ©_(et4on(ft) (fNt) (p) (teet) (p) tnt(hre! tnt (ft) (fett) (9;J/tt) v_tt head(f t)
6 11/62 300 32 10 ** 2 1_ 4 1 290 280 0.01 ""
YA 12J65 265 60 3O "-- & _5 | | 265 235 0.O2 385
/1 135 &l 10 -- 12 .. 80 70 -- 3&o
/1 6/65 3G5 60 Z0 *. 12 ZS0 .... ;50 230 0.05 355
/1 3//1 &40 60 fto_ -- 2 to 3 300 -. S _ 300 0.01 3&$
6 51/1 250 40 _*_ *- &.5 220 5 8 _0 1M 0.02 _00
I1 8/73 t/1 67 &S -- Z.S e, &CO 305 0.01 uS
12 19et _ .... 22 2 to 3 Z04(?) ...... k65
43A 10/7"5 _ 6_ Z0 ** | -* $ 376 358 0.01 U.0
638 9166 _O 4_ 10 ** 10 *- gO 80 0.13 355
• 63C IZ/75 500 SO -- 3 to O )80
i3D lZ/7/a 500 so 50 3 _0(?) 112 _0 ZS0 0.01 &10
65 • taGS(T) t&O *- 30170 129 2 to 3 135(?) ...... 430
6_ 197"4(10 729 60 -- 11_ I1| 5&6(?) -- $&6 1&6 0.90 &_O
IM 11182 30O so 100 1_ In ZgQ & t 2'gO 1gO 0.00 _5
67 1970(10 260 (_ 80 _ & 2&0 .... 2_0 140 0,03 _65
M _82 285 ]2 15 -- 0 279 S 1 270 255 O.Ot _.90
I_ &/_J kC_ 65 so "" 2 ]SO -- 4 350 3|0 0.Ol i4O
110 *- 330 63 5 -- ,1, 2)O .... 250 2_5 0.02 475
111 -* 2_0 33 10 .* A.5 100 .... 19Q 180 0.03 &95
113 a/T8 &O0 54 50 *- 1 3_ 1 3 380 330 0.C_ 510
115 19GI 640 .... 27 112 nnne *- 510
11_'1t S178 _65 &2o 35 25 I1_ none -- 500
117F $/;P8 _OS &O 50 (,3 3 2)2 8 252 Z02 0.CQ &80
16

WELL 65 WELL 66R WELL 68F WELL OT I WELL II1 F WELL 12 WELL 116500 I 500
_ _racewlev. oS IO"
I460 : 450
• -- -" r I (Dsurfrice : : >
400 ; 400 o(/)
® : ;> o
• 0 : JD
3so : 350 "_
:.E•_ , b, : G
_ 300 _ r _" : 300
: :
A"'" ) : :
"_ 2so i -"_"i _ r" " "" ; ; 2so'3
C : t : _ I:
.9o : : _ .o
aO0 : _ ; ; 200 uJLU: [ I, !
i
'150 _ . ,.' I ] 150I
iiiii° i iii°iii ii:i iiil.. . _g_ ...... _.._,.._.._ ...._.._..:_:
_! Time of day
Fi_LrC 10. _u_/u_l_ons o(waicr IC_ in SCVCnwc ll_OnDcccmlx_r 16-17, 1_2.

llYDROGEOI.£_iC INTERPRETATIONS
Estimates of Recharge and Sustainuble Yield
Ground-water studies usually ;-dude an _t;mnte of recharge to the aquifer.The average annualre,-h_rge may be referred to as perennial or sustained yield, based on the idea that long-termwithdrawal of ground water at a rate _e_in_ natural re_'h_-gewill reduce storage. The actualrelation_;p between ground- water pumping aad aquifer storage eha._ is complex and depends onporosity and permeability of the aquifer, topography, d;,._a..,, vegetation, impervious cove, sewer;-_and other variables.
Recharge and sustained ground-water yield have been ocdqmatPdby several different methods, in-clvcl;n_ hydrographseparation, flow- duration _nalysis, and water-budg_ nnMyAs.Buller and Sweigard(1978) used water-budget anMysh in a study in Hopawdl Tow_ship Pcr_cn(1982) use.dhydrograph separation method on several fractured-rock drMna_eba._rL¢in New Jersey, inclucl;n_onebasin underlain by Lockatong argillite near Flemln_on. Hordon (1984) conducted hydrograph separa-tion and stream-flow- duration analyses on data fromseveral watersheds in the vicinity of SourlandMountain. Wright (1982) used the hydrograph separation method in other areas of the centralDelaware valley. Th t_rf.sulL_ Of the, so anal_ and some other published t_d'imatas of re_-hargeor Sus-tainahlc y;"lds arc _vea in tabll_ 3.
Water-budget a._bysis has been used to _;mate recharge (W;tlh,,,_ 1981, for e.mmple), althoughsome components of re-h_,'ge ,-_..ot be directly assessed fro-, hydrologic and meteorological data.Ground-water diseharg¢ iSapproximately equivalent to base flow of str,'_m_and has been used directlyas an indicator of'safe' yield (Hordon, 1984).A valid _;mat;on of re.chargemust include _imates ofground-water clL_-ha_geor base flow, direct evapotranspiratioa from ground water, and eha%_minground-water storage.
Water Budget [o¢ the Sdurlund Mountain Area
In order to deter-,;ne whether long-term meteorologic conditions could have had an effect onground-water levels, a yearlywater- budget annlysiswas conducted. No water-budget method wasfound in the literat_e which was suitable for yearly hydrologic data. Most published water-budgetmethods arc dexi_ed to trackand predict monthlyevaporation for use in irrigation planning, The mostaccurate methods use an energy-b_h-ce approach (pe,,,,nn_ 19_; Tanner and Pehon, 1960;,VauBavel, 1966;among others). The data requirements of these methods are beyond the scope Ofthisstudy.
A water-budget method was developed for this study which is based on a simple water-b_hnceequation and uses _nntxalhydrologic data. Hydrologic data include precipitation"stream di_hnrge(runoff), and pan evaporation. The equation used is the ,_implastexpression of the hydrologic cycle:
PRECIPITATION = RUNOFF + EVAPOTRANSPIRATION + CHANGES IN STORAGE
Subtra,'tin_runoff from predpitation yields a re,-_;,,der which is equal to evapotranspirafion (ET)plus ehanoeS in storage. When snmmed over a large number of years, storage _.h_,_ will approachzero (unlass the el;mate is ehan_n_ or the physical environment is altered _i_;ficantly). The long-termdifference between predpitation and runoff, therefore, is equal to average ET. Annual estimntes OfETcan be nor_l;:,_'d to match the calculated average value.
Yearly ET was ,.-¢t;mnted by ,s;n_ the ratio of pan evaporation to precipitation. Annual ET plusstorage eha,£e was multipfied by this ratio, to yield a prel;m;naryor unadjusted estimate of ET. Thisstep is equivalent to ass_,,=in_that the water which does not leave the watershed as stream runoff isevaporated at the same ratio as that between measured ralnfa_ and evaporation from a wnter-fdledpalkThe final e_t;mate of ET is made by multiplying the first_;mate by a factor which make&the
18

TABLE3, I_Lished eel|metes of recharge or sustained yield. ResuLl:s given tn gallons per day
per e_:_Jaremile (gpd/mt2). It_-Jrrence Inter_eL iS the averege time interval within which thepredicted volume wflL be e_JaLed or exceeded once.
$_toined
Aquifer & Oratnoge ¥1rlebLe Yield Recurrence
rook type basin estimated Aneiyt|cal method (g_mi2_ Inter_ai Iteference
Brunswick
$hlie & Iqtddie DeIMre Saseflow I1ydrogr#q_ 53,000 I yr. in I0 Wright(1982)
sl Ltstone Itlver Basin separation
stttstone S_lrlend region Safe yield Flow duretlon 110o000 1 yr. in (5 IIordon(19_.)
& shJie
shale $oyce Brook trib., Sasefiow Mydrogrmah 1;5,000 1 yr° in 10 Nordon(198_)near Belle Pleed sspermtion
shmie & Niddie DeLmvare 8esefiow liydrogreah 220,000 1 Yr. _ in 2 Wright(1982)sl Itsto_e River besin separation
slitstohe Flemington |tea. Sase_iow Mydrogreah separation Z31,OO0 Long-term #_._.-._1984)
& shale & specific yield retLo _v_atle
siLtstone W. tone.ego Creek, Recherpe Water budget 288,000 N.Ao Woed(1980_
& shale PA (Gettysl:_-O Fa°)
siitstone Sto_f Brook e_ Itecharpe Dtscherge frequency )00.000 long°term Germgh_y and& shale Princeton (=flow duretion) mverege Mt LLet( 19739
Locketong
ergiLilte Weinut 8rook. NJ Safe yield FLow duration 45,000 1 yr. in _$ N_----,_198 f.)
aixed,most|y Stony 6rook at $esefiow H_daog_aph 88,000 1 Yr. _n 10 N_._.,_198_)
Lockmtong GLe_x_oore, NJ s_peret ton
ergiiLIte Walnut Broo_, near Baseflo_ Nydrogre_ 92,000 99_ exceedence Posten(1982)
Fimtngton, $J separation
8rgtilite stony 8rook at Recharge FLow duration 100,000 gross Gereghty end
Princeton average IqtLler( 1973)
mixed Stony 8rook at 81sefLoo Nydrograp_ 119,000 1 Yr. in I0 N_,_.,;,1984)
L ithoiog_u Princeton separation
Otabeee
dlabese Nunte_on irea Safe yield FLow duration 40,000 1 yr. in <5 N_._,_198_)
dtepese Stony Brook at Se_h_rge *Flo_ d_n-etton 50,000 gross Geraghty and
Princeton M_ege NI i ler( 19T3_
dtepese WiLn_l_ Brook, $J $asefiow Hydrograph sepermtion 83,000 Long*term 1(_..-,_19_.)
& specific ,field r_tio everege
19

average El"equal to that computed from the hydrologic d_t_ Evaporation data were aw_ahl¢ for theyears 1969through 1986. Results of the water budget for those years are given in table 4. The source ofdata or method of calculation for each column is discussed in footnotes to the table.
The water-balance method presented here, and two variationsof the method, were checked for ;,,-ternul consistency by conduct;,_ linear regression *-*lysis on various pairs of values. This techniqueevaluates how well a stra;$htllne fits a Cast_.;nn (X,Y) plot of two variables.The wntcr-b_l=n,',-method shownyields h;_h pOCltive correlation values for _itica] _ of vuriubles, inclvd;n_ precipita-tioo v_ e_mnted storage eh_r_e and stream flow vs. e__mated storage: change, and h;_h ne_t_e cor-
relation between sU'eam flow and _,_ted evapotransplrafion.The h;oh correlations are molly theresult of factoringprecipitation into _..t;m_ted evapotranspirafion by the ratio method used. Two othermethods tested involved s_l;,_ of pan evaporation by (I) the difference between average pan evapora-tion and average ET plus storage chn,_ and (2) the ratio between those variables. These methods hadverylowcorrelationbetween¢:fificulvariables.Themethodshownintable4 wasjudgedmostap-propriateon the basis of these correlations.
Another way to check the validityof water-budget results is to compare e,Lt;m_tedvalues with ob-served water-level records from an observation well The U. S. Geological Surveyhas ,-_;-talned an ob-servation Well tapping the Stockton Formation at Sergeantsvll_ New Jersey since 1965 (well nnmhex19-0002). The well is located about 9 miles from the study area, at an elevation of 342 feet Topographyis gentler at Sergeautsville tt,_. in the study are.&Annual meaa water levels were computed frompublished and unpublished ,_t_ of the USGS (U. S. Geological Survey, 1978-1987;Frederick L.Schaefer, USGS, written communication, 1988).
Annual mean water levels at SergeanLsvl]lewere compared with annualvalues for several other vari-ables for the period 1969- 1986. Other variableswere:
1. cr.t/m_tedstorage change (riSe) fromwater budget,2. cumnlat/ve dSe from water budget,3. pre_pltntiOn, and
4. cumnlar/vedeparture from mean preclp;tntion.The last two variableswere checked to see if they were more closely correlated with water levels th_nvalues derived from the water budget.
The mean ground-water level record was c2oselymatched by both the storage change Cstirnatedbythe water budget (d3e) and by annual precipitation at Wertsvi/l¢.These variablesare plotted in F'_,ure1L Cum-l_tive storage eh_n_e, doe_ not predlct ground water le_ls as well as annual storage eh-,_e.The close =arch of curves indicates that the water budget worksat lea._ moderately well Estimated an-nual storage change can thus be used directly to e_tim_te groond-water level changes. Figure llb showsthat precipitation could alu3_be nsed to estimate water- level eh_ngea; this would require additional cul-odation to convert to ocJim:_ted storage t.h_me_,.
The ottimnted storage rh_n_ curve (fig. lla.) reaches a low point in 1.980and re.coven somewhatduring 1981-1982.The Sergeautsvi]le observation well follows a _|milar pattern.The observation-welllevel was only 0.4 foot below the long-term mean in 1982. The e_t;,_nted storage ehan[e for 1982 in the_'udyareawas-l.9iach_
F_;mnted storage ehan_e can be converted to an e_tlmnte of water-level decline if two otherparameters are knownor can be estimated: 1) specific yield of the aquifer, and 2) ratio of soil-moistureto aqul/er-storas¢ e]_anoe_.The st0rage-z'han..oe ratio w_ vary thr01tgh0ut the year, but can be aasi_ledaa appro_mnte average yearlyvalue. U_;-e L9 inches storage deficit and varyingthe ratio of soil-mois-ture to aquifer-storage change from 3:1 to 1:2, in an aquiferwith 3 percent specific yield, results inwater-level decline between 16 and 42 inches. This suggests that below-average pre_pitation could nothave produced the decline in water levek observed in the most severely impacted wefts in the studyarea ia 1982. This conclusionissupportedby the faczthat in twowellsinthe studyarea,waterlevelsmeasured in December,1982 were hi oher th_n thOS_ reported at the time of drillino A]thotlgh th_ two
2O

I I I I I I I I I I I I I I I I a.
u _w _
ill" #_ • 0 I..,
5.;
.... 1.-_-- 7 ---_-- _ - - ,-,,_.7/-_- - _\- - o
15. AT 3ERGEANTSVILLE, 1069-06 _01 _,,_ D) .-to(u
69 71 73 75 79 63 65
CALENOAR.YEAR
I I I I I I I I 1 I I I I t I I b,
GROUNO-WAT'ERLEVELATSERGF.ANTSWLLF.N_
0 • 11. PRECJ_TATIONAT
eo <O.
E: _a.,.TO: 60 wUill D *'
o:< 40iu ,,.i
< t5 • ME.M4VALUEFOR GROUND-WATERtl _ _ _CPfTAI'K)N, lill9-Ioee 30 oz
Z| 1 I I I I I I 1. ,; ,'3 ,'s )'7 ,'9 a, 8'3 ,,'.
CALENDAR YEAR
F_,urc 11.Mean _nmml ground-waicr ]cvcls Scatgcnts'v_) New ]crscy o_ _ p]o_ along wlth
a) _";,,_i_ amaual storag_ rh,-ys _rom walcr budg_ (tabk= 4), and b) annual Ixc_plta_on at
Wc_, Ncw.I_st_/.Grouad-watcrIcv_sbcfor:1977arcbas_o.periodicmaaual_ement_ levels_ 1.P7'7-1,_archa.sodonave_,e moc_'y v'aJues5-orereorder _tA0_. Geo_o0c_S_y _S-_'_.
21

TABLE 4. - Annual water budget for the study area, 1969-1986.
All data in inches of water except E ratio.
Calender Prec|p Stream Pen E ST*de E rat|o UnadJ ET EYe dee deeYear Flow (A-B) (C/A) ([xO) (0-G) ¢umJtat
(a) (0) (0) (0) ([) (F) (G) (H) (l)
1969 63.77 18.&1 42,3 27.36 0,92 25.3 32.0 -4.6 -A.619?0 &&.37 19.01 38.7 25.36 0.87 22.1 28.0 -2.6 -7.3
19?1 52.59 32.10 &0.1 20.&9 0.76 15.6 19.8 0.7 -6.5
1972 53.23 30.91 33.7 22.32 0.67 15.0 18.9 3.& -3.2
1973 57.60 30.&8 39.6 26.92 0.69 18.6 23.5 3.4 0.3
197& &6.36 20.33 3&.3 26.03 0.7& 19.3 2&.& 1.7 1.9
1975 59.20 31.28 33.& 27.92 0.56 15.8 19.9 8.0 9.9
1976 35.98 11.90 38.6 2&.08 1.07 25.8 32.7 -8.6 1.3
1977 49.32 22.33 37.0 26.99 0.75 20.2 25.6 1.4 2.7
19?8 44.00 23.90 33.? 20.10 0.77 15.& 19.5 0.6 3.3
1979 56.&8 3S.&O 31.5 18.08 0.56 10.1 12.8 5.3 8.6
1980 3&.39 11.59 37.& 22.80 1.09 24.8 31.& -8.6 0.0
1981 38.1& 11.2& 37.6 26.90 0.99 26.5 33.6 -6.7 -6.6
1982 &0.20 16.91 3&.6 23.29 0.86 19.9 25.2 -1.9 -8.5
1983 59.02 33.78 32.5 25.24 0.55 13.9 17.6 7.7 -0.01984 &S.A& 26.12 34.6 22.32 0.71 15.9 20.2 2.1 1.3
1985 &2.05 14.11 37.6 27.94 0.89 25_0 31.6 -3.7 -2.4
1986 45.00 22.86 31.7 22.14 0.70 15.6 19.7 2.4 0
avermge 47.33 23.09 36.2 24.24 19.2 24.2
(&) Precipitation - annual measured rainfall at Wertsville, NewJersey. Source: HOAA, National Weather SerVice, Summary of ClimaticData for New Jersey, 1969-1986.
(B] Sires .flow - calendar-year total discharge in inches for thewatershed of the Neshanic River above Reavllle, NJ. Source: USGS,Water Resources Data for New Jersey, 1969-1985:also Robert Schopp,U.S. Geological Sudsy (oral communication, 1987}.
(C) Pin evaporation - annual evaporation totaled from monthly datameasured at New Brunswick, NJ. Source: Department of Meteorology,
Cook College, Rutqers, the State University.
(D) Total evapotraneplrstioe plus storage chanqes - calculated bysubtracting stream discharge from precipitation. The overage ofthis column is e_ual to average evapotranspiration only, sinceaverage storage change (de} will be zero, unless the climate ischanging.
(El Evaporation retie - pan evaporation divided by precipitation.
(F) Unadjusted evapotraaepiratioo - evaporation ratio multiplied bytotal ST plus dS (column O).
(0) Setimeted evepotranepirntion - Values in column (F) are multipliedby a factor which makes the average of this column equal to theaverage of column (D). This causes estimated average storage
change to equal zero. The factor 18 24.2 divided by 19.2, or 1.27.
(H) Batimated storage ehaoge -- Evapotransplration plus storage change(column D) minus estimated evapotransplration (column G) equals netestimated storage change.
(Z) CUmulatlve storage change - Running total of annual storage changes
22

acts of measurcmcn_ wcrc not takea under the _me conditions, the data do suggest that watcr- leveldedinc outside thc scvercly hnpac_ed are_ was _;.;m_l Tbc conclusion is also supported by _aterlevels in the Scrgeantsville observationwell, which werc only di_hdy below average in 1982. Even if thespecific yield of the _tong is tea times lc._ the. the Stockton Form_tion, water levels would be ex-pected to be only 4 feet below norm:din the stody area in 1982, based on the observation wall record.
The water-budget calculations can be used in at least one other way- to c_timJtc part]fion;n_ofstorage ebonies between soil moisture and aquifer sturagc. If a reasonable value for spec_ yield ofthe Stockton Formation is nscc_ say 10 percent, the storage eh_n_ _J;m_ted from the water budgetfor the Ne_hnnic watershed wWproduce close correlations with water level ,-h_n.es in the Scr-gcuntsviI]e wall if a storage ,-h.._ ratio of 3:l is used (soil-moisture to aquifer storage). This e_imateis very ro-oh_ due to uncertainty in spec_c yield and because of d_ereacns in bedrock, topography,and soih between the Ne_shnnic watershed and the observation well.
Thc water budget approach was an extent method of _m=tin_ the mnmlimde of ground-waterfluctuations produced by near- dro.ght conditions of 1980-1982.The method is unproven, and was notverified experimeatally for this study.The water budget appears to work reasonably wcll for the area in-ve._i_ed. If the method can be validated by furtherstudy it may have wider applicability.
Rate el'Grmmd-Water Witbdrawai
Wtthdrawa/rate of groundwaterin the studyarea was e_t;m_tedby e.._',.'-;n_100gallonsper day: (gpd) nsc per person in each hou_chold, and dividing the total usage by the cumber of squnrc miles in,I the area of interest. The use c_tim_te is somewhat hi_h, but has _ used as a plnnnin_ Crite.j-ion in
New Jersey (Hoff-_- and Canace., 1986). W'.sth_awa]rates fur each of four lots are given in units of4rgpd/miz in table 5, to fa_l_tate direct compars.sonwith safc yield and recharge e_m_tcs in table 3.il High withdrawal rates occurred in an area much cmnllcr th_n one 5qua.re mile; the high rates should
not be interpreted _ largc pumping volumes.
TABLE 5. - Estimated ground-_arer-_lthdra_et rates in 1982 for pert of
study area _here _ater ravel dectfnes _ere measured.
Lot # Lot size Number of Estimated dairy glthdra_a[ rate
(Block 171) (acres) occupants rater usage(gpd) (gpd/mf 2)
65 2.30 _ 400 111,000
66 1.00 6 600 384,000
67 1.84 4 400 140,000
117 3.12 2 200 41,000
_-{ot tatar B.26 16 1600 124,000
*Census at tot 66 Indicated 9 occupants, therefore uater useestimate is conservative.
23
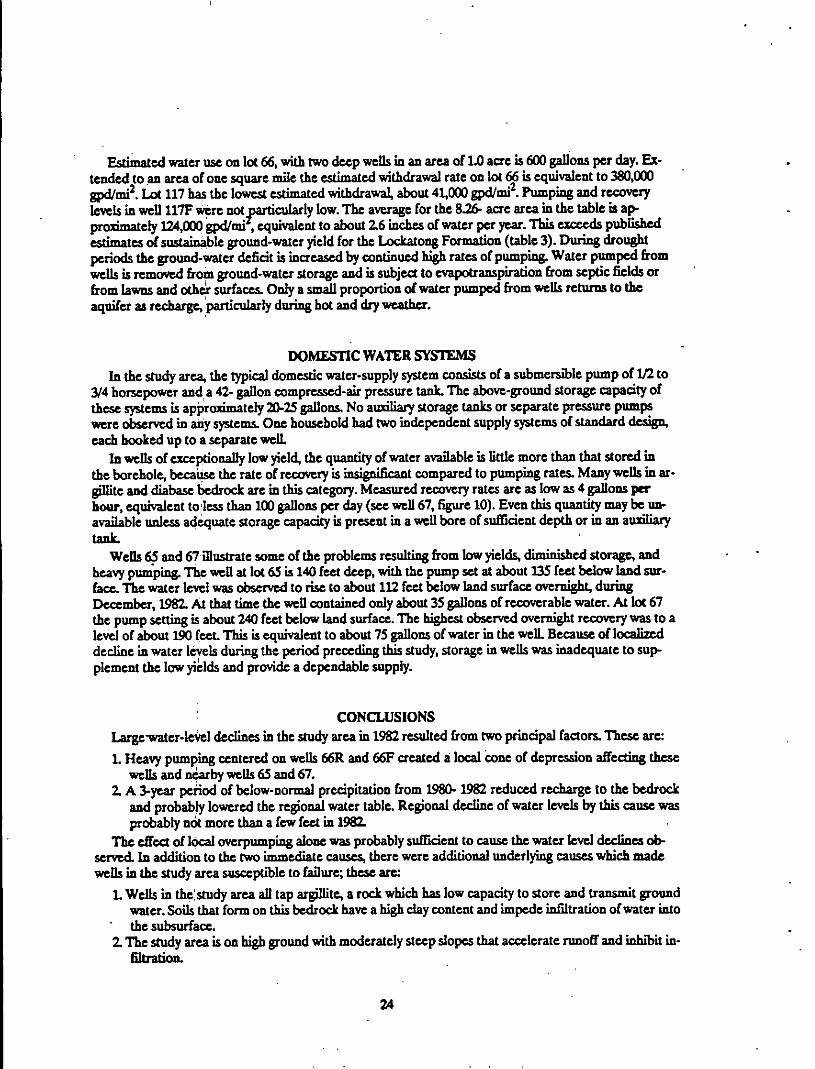
F._;m_ted water use on lot 66, with two deep wells in an area of 1.0 acre is 600 gallons per day. Ex-tended to an area of one square mile the estimated withdrawal rate on lot _ is equivalent to 380,000gpd/mi2. Lot 117 has the lowest ¢oimate.dwithdrawa_ about 41,000 gpd/mlz. Pumping and recoverylevels in well 117F w_rc not_'ticnlarly low. The average for the 826- acre area ".mthe table h a..p-pr_,_ately 124,000gpd/mi', equivalent to about 2.6 in_--_ of water per year.This exceeds pubh_hod,_rlmateSof S,_a;nnhle ground-wateryield for the Lo,-kntoag Forint;on (table 3). During droughtperiods the ground-water defidt is inc_casodby continued h;oh rates of pump;-_ Water pumped fzomwells is removed from ground-water storage and is subject to cvapotranspiration from septic fields orfrom lawns and othe_ surfaces. Only a _.,all proportion of water pumped from wells returns to the
aquifer as rerhargo,'.particularly duringhot and dryvo-_th_r.
DOMESTIC WATER bTt'b_EMS
In the study area, the typical domestic water-supply system consists of a submersible pump of 1/2to3/4 horsepower and a 42- gallon compressed-air pressure tank The above-ground storage capatqty ofthese systems is approximately 20-25gallons.No au_li_eystorage tankgor separate pre_ure pu_[_were observed in any systems. One household had two independent supply systems of standardeach hooked up to a separate welL
In wells of exceptionally low yield, the quantityof water a_able is little more than that stored inthe borehole, because the rate of recovery is ;.d_;_-_nt compared to pumping rates. Many wells in ar-glllite and diabase bedrock are hathlx category. Measured recovery rates are as low as 4 gallonshoar, equivalent to'less than 100gallo rt_ per day (see well 67, figure 10). Even this q.antlty may be un-available unless adequate storage ¢apadty is present in a well bore of sufficient depth or in an au'dlh,'ytank
Wens 65 and 67 illustrate some of the problems rC._.ltin_ from low yields, dim;nighedstorage,andheavy pumping. The well at lot 65 is 140 feet deep, with the pump set at about 135 feet below land sur-face. The water level was observed to rise to about 112 feet below land surface over-;oht duringDc._mb_, 1.982. A_ that tlme the well contained only about 35 _llons of recoverable water. At lot 67the pump setting is about 240 feet below land surface. The h;_hest observed overn;zht recovery was to alevel of about 190feet. This is equivalent to about 75 gallons of water in the well Because of localizeddecline in water levels duringthe period preeed;n_ this study, storage in wells was inadequate to sup-plement the low yields and provide a dependable supply.
! CONCLUSIONS
Large'water-level declines in the study area in 1982 resulted from two principal factors. These are:
L Heavy pumping centered on wells 66"Rand 66F created a local cone of depression affecting thesewebs and nearbywells 65 and 67.
2. A 3-year period of below-normal precipitation from 1980- 1982 reduced re,'ha_go to the bedrockand probably lowered the regional water table. Regional decline of water levels by this cause wasprobably not more the. a few feet in 1982.
The effect of local overpumpingalonewasprobably su_icient to cause the water level declines ob-served. In _clcl;t_on to the two ;mmf.dlate cat?.$c_, the.re were additional underlying causes which madewells in the study area susceptible to failure; these are:
L WelLs in the_rstUdy area all tap ar_]l|te, a rock which has low capacity to store and tran_mlt groundwater. Soils that form on this bedrock have a hizh claycontent and impede infiltration of water intothe subsurface.
2. The stlidy area is oll high ground with moderately steep slopes that acoelerate runoff and ;nh,'bit in-filtration.
24

d 3. The alleged area is distant from major fault zones. Bedrock hi the area is probably ao_ as highlyfractured as it would be if it were closer to major fe,lltt
:! 4. Much of the repharge area for the aquifer is forested. Evapotranspiration rates are higher hi areasof mature forest than hi areas with crol_ grassa_ or bare ground (Johne.to_,1970).
tl DISCUSSION AND RECOMMENDATIONS
!iSpacing otWells and Lot Siae
The cone of depression of the potentiometric surface around wells on lot 66 had a dhmp, er of atil least 360 feet, which is the distanee between wells 6.5and 67. The water-level decline hi these 2 wells
v_s at least 100 feet, hidieating the coner..x:tende.dbeyond _ _ The area in which ground-wateri!level declines were observed to be greater than 100 feet was about 3 acres. The total area of the first 3
lots hi table 5, with severe water- level declines hi 1.082is 5.14 acre&
FlHlrJ3oroughTownship had a mlnimqm lot _ re_llh'cmeJR of 5 acres for the Sourlund MotmtainI zone hi 1982. Evenly spaced _ hi square lots of 5 acres would be about 470 feet apart; spacing couldilbe less for re.ctangndarlots. This is more than double the spacing between wells with severe water leveli declines. Serious well interference is less likely to _ hi areas of _acre zo.;.o with slmilar geology,
even under extreme clrm,m,-_aneesas observed in the study are& Serious interference can still necor-hi;!areas of older development with more closely spaced wells.
Widely spaced wells are less likely tOfail th:_nclosely spaced OneS,other factors being equal, par-i, ticularly if they have a substantial depth of uacased hole and pump at low or moderate rates. Some
wells will continue to be subject to failure, espe.e/allyduringprotracted dro-ght_ if tbey are _h_llow,closely spaced, or arc heav_ pumped.
Depth e/Wdla
Well fal]ure on Io¢65 would have been less likely to ocear if the well had been at least 100 feeti,
deeper, or more than 235 feet deep, with a correspond;n_ increase in depth of pump setting De.epen-iting of well 67 by the same amount, to more !hart 340 feet, probablywould have enabled it to continueyielding some water, even if it were only from well storage.,under the prevailing conditions.
!, Re.cent drillin_ prance in theSourland Mou_taln area is to construc_wells about 300 feet deep, ori deeper where yields are verylow hi order to hicre.asestorage capac_y hi the welLShallower wellsgenerally date from the early 1960sor earlier;,thk trend is partly due a ehan_ hi drillln_ methods from
;!cable-tool to air-rotury.
RoadwayDrala_e
' Aa exteasive roadwaydralnage system was iastalled along the soath side of David's Lane hi 1975,uphill from the impacted wells. Open-joiut cement pipe drains were buried near the top of bedrock, hi
i the mostpermeablee,hallowsobsurfacezol_,.The systemdire,4_stormrunoff dow'aMontgomeryRead. The aUgmmentof David's !-_ne roughly perpendicular to the dope of the mou_tain may hicrease
ilthe tendency of the drainage system to coIlec_runoffwater and intercept water in the shallow zone_above unweathered bedrock which is periedlcully saturated. It is pos_a'blethat the drnln_could either_ireduce or hiereaso recharge under varyingflow conditions. Ava,'lable data are insufficient to assess therole of the dr_in_if any, hi well failures.
25

Because of the pos_ that storm drains could have an adverse impact on reJ-hnrg¢,it is sug-gested that roadway dr_;na_ cle_,_;c,nbe carefully assessed, ia areas of eatremely low-yield wells such asthe s.mm;t and steeply-sloped parts of Sourlund Mountain=
Possible Remedies forWell Failures In the Study Arm
Deepe-;-_ of WclhThe most expedient remedy for the situation in Hillsborongh Tow_,.h;pis to deepen the affected
wells. This solution does not address the question of Iong-tormpumping in excess of re_'hnrgr.,b.owcver.This study s_ that ground-wuter ptleapage maylocally e-',:e__e__ the average rate ofre,-h_,'gn.Unlem re,-h_,ge is increased or pumpage rate decreased, the ground water defi,-;tmay con-tin,,- to accumulate. Ia that case de.epf-;-_ of walh would only be a temporary remedy.
Re."harg¢Anm,nentnt;qn
Recharge badn_ have been used in some areas, particularly Long l,dand, New York, to dispose ofstorm runoff (Seaburn, L970).They._.ba-.in_are mostly located in areas underlain by h;_hly permeablesand and gravel deposits. R is ,ml;kelythatopen re_-ha,3ebadn, would be practical in the studybecause of low bedrock permeability, steep slopes, and thin sol Slow infiltration would require ex-tremely large bndn,;to handle peak flows. Under these conditions artificial reeh_,rgebn_n,t modeledafter ;nfiltrution beds for septic systemsm;oht be dexic,ned to accept part of storm runoff. More studywould be required to evaluate the feam'bilityof such a system.
Alter=atlve Water Supply
A public-watersupply for the Sourlund Mountain areawo,,Id be a relL".blebut expensive solution towell failures. A public- supplywell could be drilled in the Brunswicks;ltqone northof the study areaand water co-ld be pumped uphill to a standpipe on the hi_hest part of Sourland Mountain Such a sys-tem would also serve _-e.fi_htino_ purpo6ns. The high___O_'__of a commtlnJtysystem is the ma;, obstacleto its implementation. Public funrl;,_ sources would have to be sought, because ho-_;-_odensity in thearea is probablytoo low to attract a co-,-,,'rcial water purveyor.
REFERENCES Cried
Buffer,R.D., and Sweigurd, RJ., 1978, Impactof seweringand increased demand on groundwater resour-ces in HopewellTow_h;p, New Jersey (--pub. report forHopewell Twp.Munlc. Utilities Authority):Plymouth Mee±;-_ PA, Betz..Convers¢-Murdoch 37p., appendices.
Carswell,I.D., 1976,Appr=;_l of water resources ia the Hackensack Riverbasin, New Jersey:.U. S. GeoLSurveyWater Resouree_ Investig_'ons 76-74, 68p.
Carswell,L.D., andRooney, J.G_ 1976,S,,mr_nryof geology and ground water resources of P_,.aic Coun-ty, New Jersey:_U.S. GeoL SurveyWater Resources Investigations 76-75, 49p.
Cornet, B., 1977, The palyncstr_t;oTaphyand age of the Newark Supergroup (unpublished Ph.D. disser-tafioo): U_ r" Park, PA, penna State Univ., 506p.
Dnllmeyer, R.D., 1975, The pali_des _" A Jurassic intrusion? Evidence from 40Ar/39Ar incrementalrelease ages: C_.ology,v3, p.243-245,
Foth, H.D., 1983, Fuvdamentals of so,'lscience (7th edition): New York, John W'deyand Sons.Freeze,R.A.,and Cherry,J.A., 1979,Groundwater. l=-_lewood t"liff_ NJ., Prentice-Hall, 604 p.
Geraghty and Miller Company, 1973, Stony Brook regional sewerage projec_ environmental asse,_mentreport (unpub. consnltant's report): PortWn;h;nmon, N.Y., appendix E.
26
Herpers, H., and Barksdale, H.C., 1951, prO;m;-_ry report on tbe geology and ground water supply ofthe Newark,New Jersey area:New Jer_y Dept. Conservation and Econ. Development, Div. of WaterPolicy and Supply, Spec. Report 10, 52 p.
HoI_.=-_ JJ.., and Canace, R., 1986, Two-part pump test for evaluating the water supply capabilities ofdomestic wells: NJ. Geol. SurveyGround-Water Rept. Series 1, 12p.
Hurdon, R.M., 1984, Sourland Mountain ground water ,-_-_ment report: Princeton, Middlesex-Mer-cer-Somerset Regional study Council, Inc.
Johnston, R.S., 1970, Evapotranspiration from bare, herbaceous, and aspen plots: a check on a formerstudy:.Water Resources Research, v.6, p__.4-327.
Kasabach,H.F, 1966, Geology and ground water resources of Hunterdon County, New Jersey:.NJ. Dept.Cons. Econ. Dew Div. Water Supply, Special Rept. 24, 128p.
Kir_h_,-. W.C., 1976, Soll surveyof Somerset County(New Jersey: U.S. Dept. of Agriculture, Soil Con-serv. Service, Somerset, NJ., 114 p., 42 maps (scale 1;15,840).
K, mmel, H.B, 1896, Unpublished field maps of the Newark ba_i,_Trenton, NJ. Geol. Surveymap fdes;scale1:21,120.
Lungwill, S.M, and Wood, C.R., 1965, Groundwater resources of the Brunswick Formation inMontgomery and B-'t'_ Countie_ Peunsyiw-;=- Pe--_ GeoL Survey,4th Sea., Bulletin W-22, $9p.
Miller, J.W, 1974, Geology and ground water resources of Sussex County and the Warren County por-tion of the Tocks T_hndimpact area:NJ. Dept. of Envir.Protection, Bureau of Geology and Topog-raphy, Bulletin 73, 143p.
National Oceanic and Atmospheric Admini_ration, 1969-1986, _l;matological data: New Jersey:.Asheville, N.C., U.S. Dept. of C_mmerce.
Nichols, W.D., 1968, Ground-water resources of Essex County, New Jersey: NJ. Geol. Survey Spec.Report 28, 56p.
penma,_ H.I-, 1956, I=_;m_t|n_ Cvaporatio n" Tra_sactioes Amer. Geophys. Union, v.37, p.43-50.Pesten, S.E., 1982, l=_;m_tion of mean groundwater runoff and safe yield using hydrograph =-=lysis in
selected New Jersey hardrock aquifers(tmpub. Master'sthesis): New Brunswick,Ratgers Univ. 336p.Seaburn, G.E., 1970,prel;m;,:_ryresults of hydrologic studies at two recharge basins on Long Island,New
York: U.S. GeoLSurveyProf. Paper 627-C, p.C1-C17.
Spayd, S.E., 1985, Movement of volatile ur_nles thro-£h a fractured rock aquifer:.Ground Water, v.23,p. 496-502.
Tanner, C.B_ and Pelton, W.I., 1960, Potential evapotranspiration ,_tim_tes by the approximate energyb_l_-ce method of Pe-m_-" Jour. Geophys. Research, v._, p.3391-3413.
U.S. Geolo0cal Survey, 1970-87,Water resources data, New Jersey, water year 1969-86, volume 1. U.S.Ge.ol.SurveyWater- Data Reports NJ-69-1 to NJ-86-1 (published anvn_lly).
197887, Water resources data, New Jersey,water year1977-86,voL2:U.S. GeoLSurveyWater-DataRepom NJ-77-2 to NJ-86-2 (published anv-_"y).
Van Bavel, C.H.M., 1966, Potentlal evaporatio n. The combination concept and its experimemal verifica-tion. Water Resources Researc.h,v.2, p.4S5-467.
V_li, J., 1967,Diret_ional hydraulicbehaviorof a fractured shale aquifer in New Jersey;,in, Interna-tional symposium on hydrology of fractured rocks, Yugoslavia, 1965,proceed;no_, v.l: Internal Assoc.Sci. Hydrology, Pub. 73,p. 318-326.
Vecchioli, J., Carswen, L.D., and Ka.sabach,H.F., 1969, Occurrence and movement of ground water inthe Brunswick shale at asite near Trenton, New Jersey: U.S. GeoLSurveyProf. Paper 650-B, p. B 1.54-B157.
Vecchioli, J., and Miller, E.G., 1973,Water resources of the New Jersey part of thcRamapo River Bn,_in_; U.S. Geol. SurveyWater- SupplyPaper 1974, 77p.
27

Widme_, K_1965, _..ology of the groundwater reSOUrCeSof Mercer County,New $ersc_ NJ. Dept. Con-serv. Ecoa. DeV.,Geologic Rcpo_ Series 7, 115p.
W;,;=,,_ P.M., I._1, Ground-wat¢r availability,Hock,--==i,,_Delaware: Ground Water, v.19, p.58-66.
Wood, CAt., 1980, Groundwater.resources of the Gettysburg and H_mmcr Creek Formations,southeastern pt-nn_v:ni::_ p,-nmt Ge,oL Survey 4th Sea.,Water Resources Report 49, 87p.
iL . • . o •Wright, RE. Company, 1982, Special groundwater sludy of the middle Delaware River br,_m(tmpub.):
Trenton, Delaware River Basin CO,,,,,_;,L,-;C_.
28
