nmbaqc scheme psa for supporting biological analysis questionnaire results prue addison, environment...
TRANSCRIPT

NMBAQC SchemePSA for Supporting Biological
AnalysisQuestionnaire Results
Prue Addison, Environment Agency
Methodological Differences Highlighted in Questionnaire:
• Source of PSA sub-sample (biology, chemistry or separate grab)
• Method of sub-sample collection from grab (depth integrated core/mixed sample/surface sample)
• Sample volume
Sample Collection

Green Book states:Green Book Tables V12:
‘The PSA sample used to support benthic community analysis should be a representative collected from a separate grab.... A separate sample should be collected for particle size analysis to support the contaminants data. The fraction less than 63um should be determined on this sample.’
Appendix 3. Procedural Guidelines for subtidal sediment sampling:‘Take the sample from the surface to a minimum depth of 5 cm (a core previously used for redox analysis is acceptable). Transfer samples to containers that can withstand freezing, such as plastic bags or pots.’
Sample Collection

Questionnaire Results - Source of the PSA Sample
Sample Collection
AFBI CEFAS EA FRS NIEA SEPA
Separate sample Sub-sample from biology sample
Sub-sample from chemistry sample
*
*prior to 2008 – biology
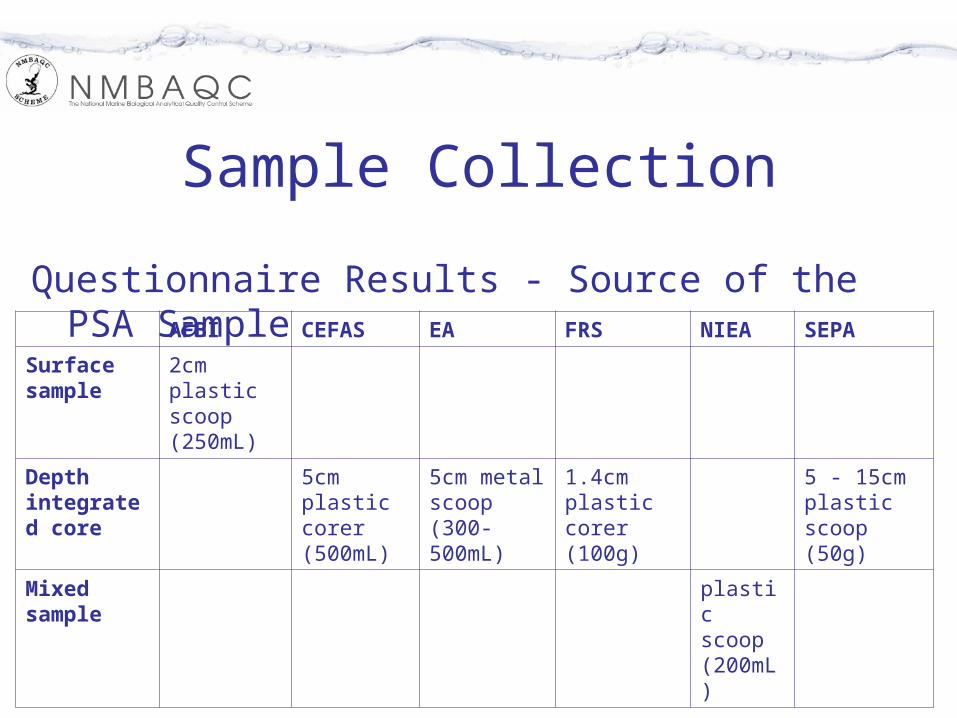
Questionnaire Results - Source of the PSA Sample
Sample Collection
AFBI CEFAS EA FRS NIEA SEPA
Surface sample
2cm plastic scoop (250mL)
Depth integrated core
5cm plastic corer (500mL)
5cm metal scoop (300-500mL)
1.4cm plastic corer (100g)
5 - 15cm plastic scoop (50g)
Mixed sample
plastic scoop (200mL)

Questionnaire Results - Minimum Size of PSA Sample Taken
Sample Collection
AFBI CEFAS EA FRS NIEA SEPA
Gravel
250g 500mL 300-500mL
100g 100g 50g
Sand 250g 500mL 300-500mL
100g 50g 50g
Mud 50g 500mL 300-500mL
100g 25g 50g

Workshop discussion needed on:• Source of PSA sub-sample
– Biology, chemistry or separate grab?
• Method of sub-sample collection from grab – Depth integrated core/mixed sample/surface sample?– Sample volume?
• Can biology PSA be used for supporting chemistry sediment samples (for CSEMP)?
Sample Collection

Methodological Differences Highlighted in Questionnaire:
• Sample preservation (Freezing/not freezing/oven drying)• Removal of organic material with hydrogen peroxide vs.
no removal of organic material• Removal of conspicuous fauna (i.e. snail shells, urchins,
etc.) vs. no removal of fauna• Volume of sub-sample used for laser and sieve analysis• Obscuration range of laser analysis• The use of a dispersant vs. no dispersant• Wet/Dry sieving (to what size) to separate laser and
sieve fraction
Sample Analysis

Green Book states:Appendix 3. Procedural Guidelines for subtidal
sediment sampling: ‘Keep samples cool and freeze them as soon
as possible. This prevents decomposition from affecting grain size. Record the method of preservation.’
Appendix 9. Procedural Guidelines for analysis of sediment supporting determinands:‘PSA for analysis of sediment supporting determinands to be added by NMBAQC group’!
Sample Analysis

Questionnaire Results: • Samples frozen by all, except EA• Hydrogen peroxide (to remove organic material)
used only by AFBI• Removal of conspicuous fauna by all
– only CEFAS record weight and fraction which fauna were present in and identification completed if possible
Sample Analysis

Questionnaire Results: • Volume of sub-sample used for laser and
sieve analysis
Sample Analysis
AFBI CEFAS EA FRS NIEA SEPA
Gravel All sample
All sample
<1g All sample
100g 100g -sieving; teaspoon full (~5mL) for laser
Sand 50 g All sample
<1g 0.1-0.5g 50g "
Mud 20 - 30 g All sample
<1g 0.1-0.5g 25g "

Questionnaire Results:• Obscuration range of laser analysis
• Dispersant used in laser analysis only by NIEA
AFBI CEFAS EA FRS NIEA SEPA
up to 25%*
5-15% (no greater than 20%)*
5-20%* 5-15% ± 2%*
15% 15-20%
* Outside of Malvern suggestion of 10 - 20 %
Sample Analysis

Questionnaire Results: • Separating sieve and laser fractions
Sample Analysis
AFBI CEFAS EA FRS NIEA SEPA
Wet/Dry sieve
Wet Wet Wet Dry Dry Dry
Mesh size
0phi (1000um)
4phi (63um)
-1phi (2000um)
-1phi (2000um)
0phi (1000um)
0phi (1000um)

Questionnaire Results: • Sieve analysis
Sample Analysis
AFBI CEFAS EA FRS NIEA SEPA
Wet/Dry sieve
Dry Dry Wet Dry Dry Dry
Min 0phi (1000um)
4phi (63um)
-1phi (2000um)
-0.49phi (1400um)
0phi (1000um)
0phi (1000um)
Max < -3phi (8000um)
-6phi (63000um)
-3phi (8000um)
-4phi (16000um)
-4phi (16000um)
-3Phi (8mm)
Interval
1/2phi 1/2phi 1phi 1phi 1phi 1phi

Questionnaire Results: • Laser analysis
Sample Analysis
AFBI CEFAS EA FRS NIEA SEPA
Min 16phi (0.01um)
>13phi (<0.1um)
16phi (0.01um)
15phi (0.03um)
15.5phi (<0.02um)
>8phi (<3.85um)
Max 0phi (1000um)
4phi (63um)
-1phi (2000um)
-1phi (2000 mm)
-0.5phi (1414um)
0phi (1000um)
Interval
1/2phi 1/2phi 1/2phi 1/2phi 1/2phi 1/2phi

Workshop discussion needed on:• Sample preservation (Freezing/not freezing/oven drying)?• Removal of organic material with hydrogen peroxide?• Removal of conspicuous fauna (i.e. snail shells, urchins,
etc.) - weigh and id?• Volume of sub-sample used for laser and sieve analysis?• Obscuration range of laser analysis?• The use of a dispersant?• Wet/Dry sieving (to what size) to separate laser and sieve
fraction?
Sample Analysis

Methodological Differences Highlighted in Questionnaire:
• Calculating derived statistics via Malvern Software vs. Own Spreadsheets.
• The derived stats reported (Inclusive vs Moments).
Data Interpretation and Reporting

Green Book states:Green Book Tables V12
‘The full range of parameters detailed in Table 1.1 should be determined on this sample.’
Statistics:
Data Interpretation and Reporting
Code Description Unit
GSKURT Grain size kurtosis Scale
GSMEA Grain size mean mm
GSSKEW
Grain size skewness
Scale
GSSORT Grain size sorting Scale
GSMED
Grain size median mm

Green Book states:Green Book Tables V12
Fractions (%):
Data Interpretation and Reporting
Code Description
GSMF>8000 Grain Size Mass Fraction >8000
GSMF>4000<8000
Grain Size Mass Fraction >4000<8000
GSMF>2000<4000
Grain Size Mass Fraction >2000<4000
GSMF>1000<2000
Grain Size Mass Fraction >1000<2000
GSMF>500<1000
Grain Size Mass Fraction >500<1000 µm
GSMF>250<500 Grain Size Mass Fraction >250<500 µm
GSMF>125<250 Grain Size Mass Fraction >125<250 µm
GSMF>63<125 Grain Size Mass Fraction >63<125 µm
GSMF63 Grain Size Mass Fraction <63 µm
GSMF20* Grain Size Mass Fraction <20 µm
* Used for chemistry interpretation

Questionnaire Results:• Sieve and Laser data merged and stats and
fractions calculated in:
Data Interpretation and Reporting
AFBI CEFAS EA FRS NIEA SEPA
Own spreadsheet and Gradistat
Own spreadsheet
Malvern Software
Malvern Software
Own spreadsheet
Own spreadsheet

Questionnaire Results:• Derived stats reported into MERMAN
Data Interpretation and Reporting
AFBI CEFAS EA FRS NIEA SEPA
Mean Inclusive Moments Inclusive Inclusive Inclusive M = (16 + 84)/2
Median 50 50 50 50 50 50
Sorting Inclusive Moments Inclusive Inclusive Inclusive Inclusive
Skewness
Inclusive - Inclusive Inclusive Inclusive Inclusive
Kurtosis Inclusive Moments Inclusive Inclusive Inclusive Inclusive

Workshop discussion needed on:• Calculating fractions and statistics via Malvern Software
vs. Own Spreadsheets?• Derived stats reported (Inclusive vs Moments)?
• Should statistics be reported at all into national databases?
Data Interpretation and Reporting
Methodological Differences Highlighted in Questionnaire:
• External QA - All CMA PSA labs signed up to NMBAQC PS component (plus 6 private labs)
• Internal QC - Varying levels of internal QA/QC done by laboratories.
QA/QC

Green Book States:
Nothing!
QA/QC

Questionnaire Results:• Internal QC
QA/QC
AFBI
CEFAS EA FRS NIEA SEPA
Equipment Checks:
Malvern Laser serviced/calibrated regularly
y y y y y
Malvern Laser check (with certified reference material)
y y y y y
Malvern Laser – repeating analysis of some samples to check variations
y y y
Balance checked daily n y
Balance checked (with calibrated weight) n y y
Re-analysis of a certain amount of samples (e.g. 1 in 10):
n n n n y y

Workshop discussion needed on:• Internal QC?
QA/QC