nmdws occupation projections and labor market … bber data users conference november 13th, 2014...
TRANSCRIPT

UNM BBER Data Users Conference
November 13th, 2014
NMDWS Occupation
Projections and Labor Market Information

Why Do We Make Projections?

‐High school and college students, their parents and teachers want to learn about the available jobs in their area,
‐Career changers, career development specialists and guidance counselors,
‐State workforce agencies to match employment with education and economic development efforts,
‐Policymakers to best invest tax dollars to training,
‐Education and training officials to make decisions about education and training policy, funding, and program offerings,
‐Other federal agencies, researchers, and academics use the projections to understand trends in the economy and labor market.
Who Uses Industry And Occupational Projections?

Inputs To The Models‐NM QCEW TIME SERIES

‐ NATIONAL QCEW TIME SERIES

‐ NATIONAL VARIABLES• Composite Index ‐ 10 Leading Indicators• Average Weekly Hours in Manufacturing• Average Weekly Initial UI Claims• Manufacturer's New orders ‐ Consumer Goods• Vendor Performance• Manufacturer's New Orders ‐ non‐Defense capital goods• Building Permits ‐ New Housing• S & P 500• Money Supply (M2)• Consumer Expectations• Light Vehicle Sales• Institute for Supply Management: US Manufacturing Composite• Total Business Inventories• CPI ‐ Urban: All items• Total Housing Starts ‐ Private• PPI ‐ Finished Goods ‐ Except Food• Total Non‐Farm Employment ‐ All Industry• Total Non‐Farm Employment ‐ Goods Producing• Interest Rate Spread• Plus 14 additional variables
National variable time series begins 1970

‐ NEW MEXICO VARIABLES
• New Mexico Population
• New Mexico Employment
• NM Median Household Income
• NM Per Capita Income
• New Mexico Unemployment Rate
• NM Building Permits
State variable time series begins in 1990

Add All The Inputs To Projections Models….
Inputs plus variables go in here...
Project‐O‐Matic 2000 with shift‐share; time‐series; and OLS regression models.
…Industry Projections come out here!
Start By Projecting Industry Growth

New Mexico Industry Projections, 2012 - 2022 Totals may not sum due to rounding
2012 2022 Number PercentIndustry Code Estimated Projected Change Change
Health Care & Social Assistance 62 120,000 149,490 29,490 24.6%Educational Services 61 77,560 95,990 18,430 23.8%Accommodation & Food Services 72 81,250 97,280 16,030 19.7%Retail Trade 44 90,980 101,920 10,930 12.0%Administrative & Support Services 56 40,490 48,290 7,800 19.3%Professional, Scientific, & Technical 54 52,420 57,040 4,620 8.8%Construction 23 41,100 44,850 3,750 9.1%Other Services 81 21,000 23,610 2,610 12.4%Mining 21 23,990 26,400 2,420 10.1%Arts, Entertainment, & Recreation 71 13,230 15,460 2,230 16.9%Wholesale Trade 42 21,420 23,290 1,870 8.7%Transportation & Warehousing 48 18,860 20,430 1,570 8.3%Real Estate & Rental 53 9,650 10,870 1,220 12.6%Finance & Insurance 52 20,890 21,890 1,000 4.8%NEC 99 58,260 58,520 260 0.4%Utilities 22 4,380 4,640 250 5.7%Management of Companies 55 4,980 5,120 130 2.6%Information 51 13,510 13,040 -470 -3.5%Agriculture 11 10,900 10,280 -620 -5.7%Government 90 90,850 90,120 -730 -0.8%Manufacturing 31 29,650 28,470 -1,180 -4.0%Total All Industries 00 845,380 946,990 101,610 12.0%

Employment Growth, 2012 ‐ 2022
0 5,000 10,000 15,000 20,000 25,000 30,000
Manufacturing
Government
Agriculture
Information
Management of Companies
Utilities
NEC
Finance & Insurance
Real Estate & Rental
Transportation & Warehousing
Wholesale Trade
Arts, Entertainment, & Recreation
Mining
Other Services
Construction
Professional, Scientific, & Technical
Administrative & Support Services
Retail Trade
Accommodation & Food Services
Educational Services
Health Care & Social Assistance
‐1,180
‐730
‐620
‐470
130
250
262
1,000
1,220
1,570
1,870
2,230
2,420
2,610
3,750
4,620
7,800
10,930
16,030
18,430
29,490

Percent Change, 2012 ‐ 2022
0.0% 5.0% 10.0% 15.0% 20.0% 25.0%
Agriculture
Manufacturing
Information
Government
NEC
Management of Companies
Finance & Insurance
Utilities
Transportation & Warehousing
Wholesale Trade
Professional, Scientific, & Technical
Construction
Mining
Retail Trade
Total All Industries
Other Services
Real Estate & Rental
Arts, Entertainment, & Recreation
Administrative & Support Services
Accommodation & Food Services
Educational Services
Health Care & Social Assistance
‐5.7%
‐4.0%
‐3.5%
‐0.8%
0.4%
2.6%
4.8%
5.7%
8.3%
8.7%
8.8%
9.1%
10.1%
12.0%
12.0%
12.4%
12.6%
16.9%
19.3%
19.7%
23.8%
24.6%

Occupational Projections!
Now That We Have Industry Projections, What’s Next?

‐ Occupational Staffing Pattern
• The occupational staffing pattern for industries comes from the Occupation Employment Statistics program
• Survey of about 3,500 employers per year• Collected over 3 years• Sample based on their industry code• Added bonus – wages by occupation

Industry projections and staffing pattern data go in here…
Project‐O‐Matic matches the industry control total with the staffing pattern according to the best available model.
…And occupational projections come out here!
Occupational Projections

New Mexico Occupational Projections 2012 - 2022 Totals may not sum due to rounding
2012 2022
Occupational Group Code Estimated ProjectedNumber Change
Percent Change
Food Prep & Service 35 75,960 90,990 15,030 19.8%Personal Care & Service 39 43,370 56,940 13,570 31.3%Education 25 49,420 60,850 11,430 23.1%Office Support 43 124,160 133,370 9,210 7.4%Sales 41 79,920 87,960 8,040 10.1%Healthcare Practitioners 29 48,740 55,700 6,960 14.3%Healthcare Support 31 24,710 30,190 5,480 22.2%Construction & Extraction 47 57,620 62,070 4,450 7.7%Building & Grounds Cleaning 37 32,190 36,510 4,320 13.4%Transportation & Material Moving 53 45,390 49,540 4,150 9.2%Maintenance & Repair 49 32,910 36,380 3,470 10.5%Management 11 56,030 59,140 3,100 5.5%Business & Financial 13 33,280 36,170 2,890 8.7%Protective Services 33 22,700 24,960 2,270 10.0%Community & Social Service 21 14,510 16,740 2,230 15.4%Computer & Mathematical 15 14,700 16,730 2,030 13.8%Production 51 30,720 31,830 1,110 3.6%Life, Physical & Social Science 19 13,650 14,430 780 5.7%Architecture & Engineering 17 21,150 21,810 670 3.1%Arts, Design & Entertainment 27 10,380 10,900 520 5.0%Legal 23 6,450 6,750 300 4.7%Farm, Fishing & Forestry 45 7,450 7,050 -400 -5.3%Total All Occs 00 845,380 946,990 101,610 12.0%

Top 20 occupations in New Mexico with the greatest projected numerical growth, 2012 - 20222012 2022 Number Percent
Occupational Title OccupationCode Estimated Projected Change Change
Personal Care Aides 399021 20,500 30,950 10,450 51.0%Combined Food Prep & Servers 353021 15,720 20,080 4,370 27.8%Retail Sales 412031 29,070 32,850 3,780 13.0%Waitstaff 353031 16,410 19,210 2,800 17.0%Secretaries 436014 20,750 23,380 2,630 12.7%Elementary School Teachers 252021 8,810 11,240 2,430 27.6%Home Health Aides 311011 5,330 7,740 2,420 45.4%Registered Nurses 291141 16,140 18,370 2,230 13.8%General Managers 111021 15,980 17,970 1,990 12.5%Customer Service Reps 434051 13,540 15,360 1,820 13.4%Restaurant Cooks 352014 6,660 8,440 1,790 26.8%Cashiers 412011 20,170 21,870 1,710 8.5%Janitors 372011 11,690 13,350 1,660 14.2%Teachers Assistants 259041 7,8340 9,410 1,580 20.2%Food Service Supervisors 351012 5,650 7,060 1,410 25.0%Bookkeepers 433031 12,910 14,290 1,380 10.7%Maids & Housekeepers 372012 10,150 11,470 1,320 13.0%Office Managers 431011 9,410 10,580 1,170 12.5%Secondary School Teachers 252031 5,650 6,770 1,120 19.8%Nursing Assistants 311014 6,520 7,540 1,010 15.5%

Top 20 occupations in New Mexico with the greatest number of annual openings, 2012 - 2022
Annual Annual Total
Occupational Title Code Growth Replacement AnnualRetail Sales 412031 380 990 1,370Personal Care Aides 399021 1,050 150 1,190Waitstaff 353031 280 790 1,070Cashiers 412011 170 870 1,040Combined Food Prep & Servers 353021 440 600 1,040Customer Service Representatives 434051 180 370 550Registered Nurses 291141 220 310 540Secretaries 436014 260 250 510General Managers 111021 200 300 500Elementary School Teachers 252021 240 190 440Janitors 372011 170 220 390Stockers & Material Handlers 537062 90 250 350Home Health Aides 311011 240 100 340Retail Sales Supervisors 411011 100 250 340Office Supervisors 431011 120 220 340Teacher Assistants 259041 160 180 340Maids & Housekeeping Cleaners 372012 130 200 330Construction Laborers 472061 80 240 330Restaurant Cooks 352014 180 130 310Food Prep & Servers Supervisors 351012 140 160 300

Share of Industry Total, 2012 to 2022
‐15.8%‐14.3% ‐13.8%
‐11.4% ‐8.2%
4.3%
6.5% 6.9%
10.5%11.2%
‐20.0%
‐15.0%
‐10.0%
‐5.0%
0.0%
5.0%
10.0%
15.0%Ag
riculture
Man
ufacturin
g
Inform
ation
Governm
ent
Man
agem
ent o
f Com
panies
Arts, Entertainmen
t, & Recreation
Administrative & Sup
port Services
Accommod
ation & Foo
d Services
Educationa
l Services
Health
Care & Social A
ssistance
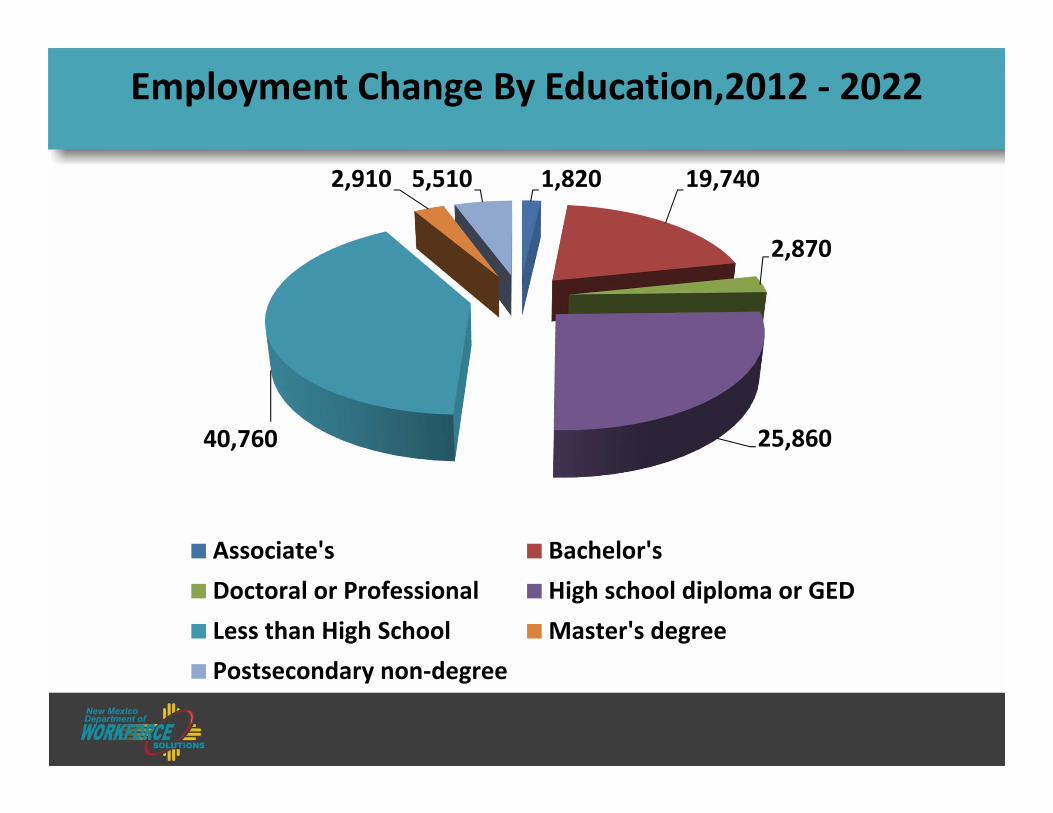
1,820 19,740
2,870
25,86040,760
2,910 5,510
Associate's Bachelor'sDoctoral or Professional High school diploma or GEDLess than High School Master's degreePostsecondary non‐degree
Employment Change By Education,2012 ‐ 2022

Job Recovery Based On 2012‐2022 Industry Projections
740,000
760,000
780,000
800,000
820,000
840,000
860,000
880,000Peak employmentin Dec 2007 at 855,300
Trendline according to 2012‐2022 Industry Projections.
Intersect in mid 2018.

Projections Are Based On All Things Being Equal And There Are No Shocks To The Economy…
Watch For Direction and Magnitude of Change…
Finally…

QUESTIONS?

Thank You!
CONTACT INFORMATION:Bob Richards
ECONOMIC RESEARCH & ANALYSIS BUREAUDEPARTMENT OF WORKFORCE SOLUTIONS
505‐383‐[email protected]

Labor Market Information (LMI)
• Projections– Occupation Projections– Industry Projections
• Wages– Occupation Wages– Industry Wages
• Employment– Quarterly Census of Employment and Wages– Current Employment Statistics– Local Area Unemployment Statistics
• Unemployment• Labor Force
LMI in LASER
• LASER is the system we use to deliver Labor Market Information to the public.– NM contracts with a national firm, Geographic Solutions, to provide this service on the Web.
– Approximately every 18 months the system is upgraded to make use of new data sources and new technology.
– The most recent upgrade was implemented at the end of July.

https://laser.state.nm.us


LASER Demonstration
• Registration• New main screen items• One‐Click to data• Data navigation changes
– Data by level– NO DATA!– Multi‐data searches
• New profile data– Economic development data
THANK YOU!
Michelle Doran [email protected] Richards [email protected]
NM Dept. of Workforce SolutionsEconomic Research & Analysis Bureau