no slide title€¦ · · 2017-04-25private-label mbs nyse ticker ai share price (4/24/17) $14.45...
TRANSCRIPT

Investor Presentation
First Quarter 2017

1
Information Related to Forward-Looking Statements
This presentation contains “forward-looking statements” made pursuant to the safe harbor provisions of the Private Securities Litigation Reform Act of
1995, including statements regarding future results or expectations about our investments, interest rates, portfolio allocation, dividends, financing
agreements, returns on invested capital, investment strategy, taxes, portfolio, earnings, book value, housing market, compensation, growth in capital,
agency MBS spreads, prepayments, hedging instruments, duration, credit performance of private-label MBS, cash flow and benefit of deferred tax asset
value. Forward-looking statements can be identified by forward-looking language, including words such as “believes,” “anticipates,” “views,” “expects,”
“estimates,” “intends,” “may,” “plans,” “projects,” “potential,” “prospective,” “will” and similar expressions, or the negative of these words. Such forward-
looking statements are based on facts and conditions as they exist at the time such statements are made. Forward-looking statements are also based
on predictions as to future facts and conditions, the accurate prediction of which may be difficult and involve the assessment of events beyond our
control. Forward-looking statements are further based on various operating and return assumptions. Caution must be exercised in relying on forward-
looking statements. Due to known and unknown risks, actual results may differ materially from expectations or projections.
You should carefully consider these risks when you make a decision concerning an investment in our common stock or senior notes, along with the
following factors, among others, that may cause our actual results to differ materially from those described in any forward-looking statements:
availability of, and our ability to deploy, capital; growing our business primarily through our current strategy of focusing on acquiring primarily agency
mortgage-backed securities (“MBS”); our ability to forecast our tax attributes, which are based upon various facts and assumptions, and our ability to
protect and use our net operating losses, and net capital losses to offset future taxable income, including whether our shareholder rights plan will be
effective in preventing an ownership change that would significantly limit our ability to utilize such losses; our business, acquisition, leverage, asset
allocation, operational, investment, hedging and financing strategies and the success of these strategies; the effect of changes in prepayment rates,
interest rates and default rates on our portfolio; the effect of governmental regulation and actions; our ability to roll our repurchase agreements on
favorable terms, if at all; our liquidity; our asset valuation policies; our decisions with respect to, and ability to make, future dividends; investing in assets
other than MBS or pursuing business activities other than investing in MBS; our ability to maintain our exclusion from the definition of “investment
company” under the Investment Company Act of 1940, as amended; our decision to not elect to be taxed as a real estate investment trust under the
Internal Revenue Code; competition for investment opportunities, including competition from the U.S. Department of Treasury and the U.S. Federal
Reserve, for investments in agency MBS, as well as the timing of the termination by the U.S. Federal Reserve of its purchases of agency MBS; the
federal conservatorship of the Federal National Mortgage Association (“Fannie Mae”) and the Federal Home Loan Mortgage Corporation (“Freddie
Mac”) and related efforts, along with any changes in laws and regulations affecting the relationship between Fannie Mae and Freddie Mac and the
federal government; mortgage loan prepayment activity, modification programs and future legislative action; changes in, and success of, our
acquisition, hedging and leverage strategies, changes in our asset allocation and changes in our operational policies, all of which may be changed by
us without shareholder approval; failure of sovereign or municipal entities to meet their debt obligations or a downgrade in the credit rating of such debt
obligations; fluctuations of the value of our hedge instruments; fluctuating quarterly operating results; changes in laws and regulations and industry
practices that may adversely affect our business; volatility of the securities markets and activity in the secondary securities markets in the United States
and elsewhere; our ability to successfully expand our business into areas other than investing in MBS; changes in, and our ability to remain in
compliance with, law, regulations or governmental policies affecting our business; and the factors described in the sections entitled “Risk Factors” in our
Annual Report on Form 10-K for the year ended December 31, 2016, subsequent Quarterly Reports on Form 10-Q and other documents filed by the
Company with the SEC from time to time. All forward-looking statements speak only as of the date on which they are made. New risks and
uncertainties arise over time, and it is not possible to predict those events or how they may affect us. Except as required by law, the Company is not
obligated to, and does not intend to, update or revise any forward-looking statements, whether as a result of new information, future events or
otherwise.

2
Company Overview
Arlington Asset Investment Corp. (“AI” or the
“Company”) is an investment firm focused on
securitized residential mortgage assets
- Invests in high quality liquid assets with
substantial interest rate hedges to
protect long-term capital and to produce
predictable cash flows to support
consistent dividends to shareholders
- Internally-managed
- Structured as a C-corp to enhance
shareholder returns and optimize
investment strategy
Flexible investment allocation approach to
achieve highest risk-adjusted returns
- Invest in interest rate sensitive agency
MBS issued by Fannie Mae and Freddie
Mac
- Invest opportunistically in credit sensitive
private-label MBS
NYSE Ticker AI
Share Price (4/24/17) $14.45
Dividend Yield (4/24/17) 17.3%
Market Cap (4/24/17) $341 million
Total Assets (3/31/17) $4.7 billion
Book Value Per Share (3/31/17) $15.83
Tangible Book Value Per Share (3/31/17) $13.08

3
As of December 31, 2016:
$4.63 Billion Fair Value
As of March 31, 2017:
$4.86 Billion Fair Value
Agency MBS Investment Portfolio Allocation
Specified Pool vs. TBA Allocation (1)
(1) Includes the fair value of the agency MBS underlying forward-settling “to-be-announced (“TBA”) purchase or sale commitments that are accounted for as derivative instruments in
accordance with GAAP. The difference between the contractual forward price of the Company’s TBA commitments and the fair value of the underlying MBS is reflected on the Company’s
consolidated balance sheets as a component of “derivative assets, at fair value” or “derivative liabilities, at fair value.”
By Fixed Coupon Rate (1)
As of March 31, 2017: As of December 31, 2016:

4
Specified Agency MBS Investment Portfolio
(1) Specified pools of loans with original balances of up to $150K.
(2) Specified pools of loans with original balances between $150K and $175K.
(3) Specified pools of loans with original balances between $175K and $200K.
(4) Other specified pools include pools of loans refinanced through the Home Affordable Refinance Program (“HARP”), low FICO loans, 100% investor occupancy status loans, high LTV loans, and seasoned loans.
(5) WAC represents the weighted average coupon of the underlying collateral.
(6) Loan age represents the weighted average age of the underlying collateral.
(7) Actual 3-month constant prepayment rate (“CPR”) represents annualized 3-month CPR published in April 2017 for securities held as of March 31, 2017.
(8) Remaining life represents the weighted average expected remaining life of the security based on expected future CPR as estimated by Citi’s “The Yield Book” model.
(9) Duration is derived from the Citi’s “The Yield Book” model. Duration is a measure of how much the price of an asset or liability is expected to change if interest rates move in a parallel manner and is dependent upon several
subjective inputs and assumptions. Actual results could differ materially from these estimates. In addition, different models could generate materially different estimates using similar inputs and assumptions.
30-Year Fixed-Rate Agency MBS Selected for Prepayment Characteristics
(Dollars in thousands)
MBS
Coupon
Face
Amount
Amortized
Cost Fair Value
Market
Price WAC (5)
Loan Age
(Months) (6)
Actual 3-
Month CPR (7)
Remaining
Life
(Years) (8)
Duration
(Years) (9)
Low Loan Balance <= $150K (1)
4.0% 395,119$ 105.06$ 418,023$ 105.80$ 4.62% 32 13.23% 6.9 4.7
Low Loan Balance <= $175K (2)
3.5% 702,798$ 105.08$ 721,872$ 102.71$ 4.11% 13 5.00% 8.2 5.8
4.0% 1,165,805 105.91 1,232,115 105.69 4.56% 19 9.04% 7.3 4.9
1,868,603$ 105.60$ 1,953,987$ 104.57$ 4.39% 17 7.52% 7.6 5.2
Low Loan Balance <= $200K (3)
3.5% 1,056,753$ 104.99$ 1,083,768$ 102.56$ 4.16% 11 6.39% 8.2 5.7
4.0% 683,988 106.22 721,177 105.44 4.58% 12 10.65% 7.2 4.9
1,740,741$ 105.48$ 1,804,945$ 103.69$ 4.33% 11 8.06% 7.8 5.4
Other Specified Pools (4)
3.5% 81,570$ 104.04$ 83,614$ 102.51$ 4.21% 20 8.99% 7.5 5.2
4.0% 124,111 105.92 130,682 105.29 4.52% 40 7.32% 6.8 5.0
5.5% 20$ 99.99 23$ 111.95$ 5.88% 109 6.08% 5.8 4.3
205,701$ 105.17$ 214,319$ 104.19$ 4.40% 32 7.98% 7.1 5.1
Total
3.5% 1,841,121$ 104.98$ 1,889,254$ 102.61$ 4.14% 12 5.97% 8.2 5.7
4.0% 2,369,023 105.86 2,501,997 105.61 4.57% 20 10.11% 7.3 4.9
5.5% 20$ 99.99 23$ 111.95$ 5.88% 109 6.08% 5.8 4.3
4,210,164$ 105.48$ 4,391,274$ 104.30$ 4.39% 17 8.30% 7.7 5.2
Weighted Average:

5
TBA Agency MBS Investment Portfolio
(1) Net long position in TBA securities represents forward-settling contracts to purchase or sell agency MBS on a generic pool basis. TBA commitments are accounted for
as derivative instruments in accordance with GAAP. The difference between the contractual forward price of the Company’s TBA commitments and the fair value of the
underlying MBS is reflected on the Company’s consolidated balance sheets as a component of “derivative assets, at fair value” or “derivative liabilities, at fair value.”
Excludes TBA securities entered into for economic hedging purposes.
(2) Duration is derived from the Citi’s “The Yield Book” model. Duration is a measure of how much the price of an asset or liability is expected to change if interest rates
move in a parallel manner and is dependent upon several subjective inputs and assumptions. Actual results could differ materially from these estimates. In addition,
different models could generate materially different estimates using similar inputs and assumptions.
(3) Dollar roll income represents the economic equivalent of net interest income (implied interest income net of financing costs) generated from the Company’s investments
in non-specified fixed-rate agency MBS, executed through sequential series of forward-settling purchase and sale transactions that are settled on a net basis (known as
“dollar roll” transactions). Excludes the net interest cost or benefit of any associated hedging instruments.
(4) Cost basis is based upon the contractual price of the initial TBA purchase trade of each individual series of dollar roll transactions.
Net Long TBA Position (1) as of March 31, 2017 (dollars in thousands):
TBA Gain (Loss) (3) (dollars in thousands):
First Quarter
2017
Fourth Quarter
2016
Third Quarter
2016
Second
Quarter 2016
Dollar roll income 3,398$ 6,426$ 5,321$ 3,719$
Change in fair value, net (200) (46,533) 1,506 8,698
Total TBA gain (loss), net 3,198$ (40,107)$ 6,827$ 12,417$
Quarterly weighted average:
Cost basis (4) 554,846$ 1,087,337$ 861,686$ 609,022$
Implied net interest spread 2.45% 2.36% 2.47% 2.44%
Notional
Amount
Implied Cost
Basis
Implied Fair
Value
Net Carrying
Amount
Duration
(Years) (2)
30-year 4.0% coupon purchase commitments 500,000$ 521,012$ 524,922$ 3,910$ 4.4
30-year 4.0% coupon sale commitments (50,000) (52,400) (52,492) (92) 4.4
Total/weighted average 450,000$ 468,612$ 472,430$ 3,818$ 4.4

6
TBA Dollar Roll Implied Spread Economics
Specifed
Agency MBS
Funded with
Repo
TBA Dollar
Roll (1)
Dollar Roll
Advantage
Specifed
Agency MBS
Funded with
Repo
TBA Dollar
Roll (1)
Dollar Roll
Advantage
Agency MBS yield / dollar roll net interest spread 2.85% 2.45% 2.55% 2.36%
Repurchase agreement cost (2) -0.90% - -0.80% -
Interest rate swap cost (3)-0.50% -0.50% -0.38% -0.38%
Economic net interest margin 1.45% 1.95% 0.50% 1.37% 1.98% 0.61%
Specified agency MBS weighted-average CPR 8.17% 12.90%
First Quarter 2017 Fourth Quarter 2016
Relative spread economics of our TBA dollar rolls vs. our specified agency MBS narrowed during the quarter:
(1) TBA dollar roll transactions involve delaying, or “rolling,” the settlement of a forward-settling purchase of a TBA agency MBS by entering into an offsetting
“spot” sale prior to the settlement date, net settling the “paired-off” positions in cash, and contemporaneously entering another forward-settling purchase of a
TBA agency MBS of the same essential characteristics for a later settlement date at a price discount relative to the “spot” sale.
(2) For comparative purposes, this illustration assumes that a specified agency MBS is 100% financed with a repurchase agreement.
(3) Represents the weighted average net pay rate on the Company’s interest rate swap agreements multiplied by the weighted average interest rate swap
notional to repurchase agreement and TBA financing ratio.

7
Financing Summary
16 counterparties with access to
19 total counterparties
Less than 10% of equity at risk
with any one counterparty
- 7.1% of equity at risk with largest
counterparty
- 31.2% of equity at risk with five
largest counterparties
Favorable repo financing costs
- Spread between average one-
month LIBOR and average repo
financing rate narrowed in Q1
2017
Diversified Funding Sources As of March 31, 2017 (dollars in thousands):
Outstanding
Borrowing
Collateral
Fair Value
Average
Interest
Rate
Average
Days to
Maturity
Agency MBS repo 4,241,855$ 4,497,184$ 1.03% 11.8
Counterparty Region
Number of
Counterparties
Outstanding
Borrowing
Percent
of Total
North America 12 3,164,948$ 74.6%
Europe 1 386,394 9.1%
Asia 3 690,513 16.3%
Total 16 4,241,855$ 100.0%

8
Hedging Summary
Hedge Position Helps Mitigate Impact of Rising Rates on Agency Portfolio
Interest Rate Swaps as of March 31, 2017 (dollars in thousands):
(1) Duration is calculated based upon each interest rate swap’s “DV01” (a valuation metric illustrating the dollar value of a one basis point increase in interest rates) as
reported by the Chicago Mercantile Exchange, the clearinghouse through which those instruments were centrally cleared. Duration is a measure of how much the
price of an asset or liability is expected to change if interest rates move in a parallel manner.
(2) The implied strike rate is estimated based upon the weighted average strike price per option contract and the price of an equivalent 10-year U.S. Treasury note futures
contract.
Options on 10-year U.S. Treasury Note Futures as of March 31, 2017 (dollars in thousands):
Notional
Amount
Long/(Short)
Weighted-
average
Strike Price
Implied
Strike Rate (2)
Net Fair
Value
Purchased put options:
May 2017 expiration 700,000$ 122.5 2.63% 1,531$
Sold call options:
April 2017 expiration (250,000)$ 124.5 2.40% (1,289)$
May 2017 expiration (100,000) 126.0 2.22% (390)
Total for sold call options (350,000)$ 124.9 2.35% (1,679)$
Purchased call options:
April 2017 expiration 350,000$ 127.1 2.10% 94$
(54)$
Notional
Amount
Fixed Pay
Rate
Variable
Receive Rate Net Pay Rate
Remaining
Life (Years) Duration (1)
Interest rate swaps currently effective:
Less than 3 years to maturity 1,100,000$ 1.24% 1.10% 0.14% 2.0 (1.8)
3 to less than 7 years to maturity 125,000 2.09% 1.15% 0.94% 4.8 (4.4)
7 to 10 years to maturity 2,000,000 2.01% 1.09% 0.92% 9.1 (8.1)
Total / weighted average 3,225,000$ 1.75% 1.10% 0.65% 6.6 (5.8)
Forward starting interest rate swaps:
Effective September/October 2017 375,000$ 1.13% — — 2.0 (2.0)
(5.4)
Weighted-average
9
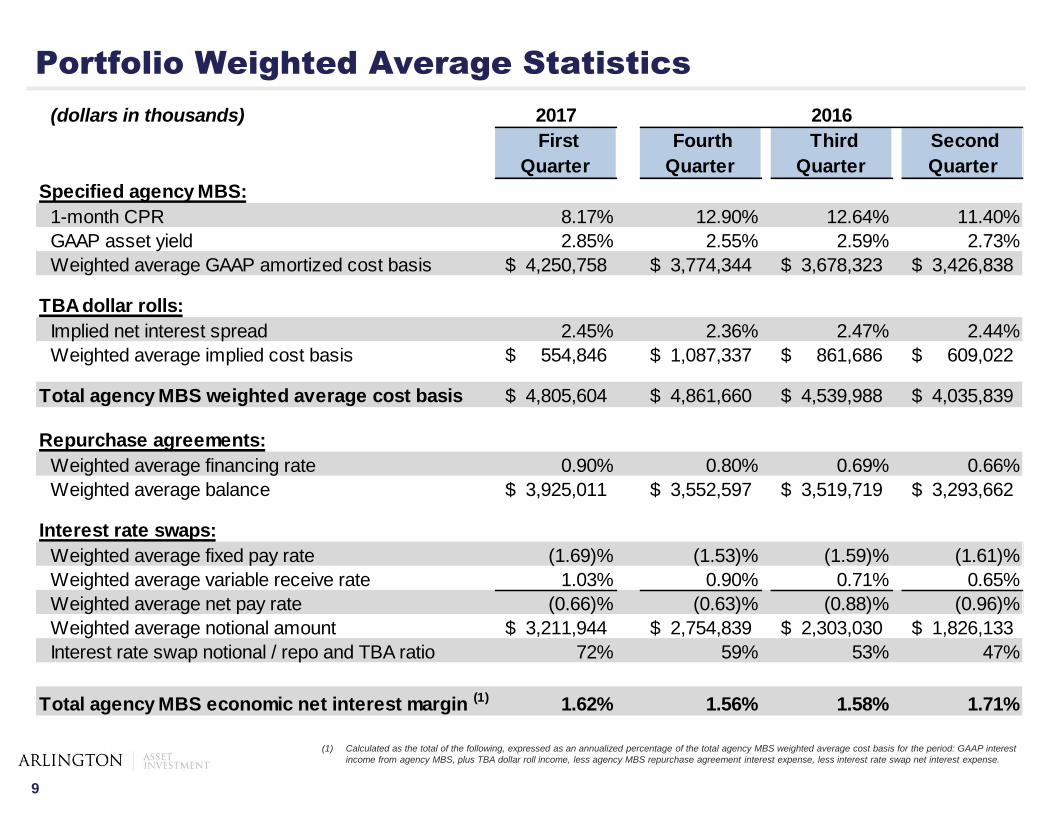
Portfolio Weighted Average Statistics
(1) Calculated as the total of the following, expressed as an annualized percentage of the total agency MBS weighted average cost basis for the period: GAAP interest
income from agency MBS, plus TBA dollar roll income, less agency MBS repurchase agreement interest expense, less interest rate swap net interest expense.
(dollars in thousands) 2017
First
Quarter
Fourth
Quarter
Third
Quarter
Second
Quarter
Specified agency MBS:
1-month CPR 8.17% 12.90% 12.64% 11.40%
GAAP asset yield 2.85% 2.55% 2.59% 2.73%
Weighted average GAAP amortized cost basis 4,250,758$ 3,774,344$ 3,678,323$ 3,426,838$
TBA dollar rolls:
Implied net interest spread 2.45% 2.36% 2.47% 2.44%
Weighted average implied cost basis 554,846$ 1,087,337$ 861,686$ 609,022$
Total agency MBS weighted average cost basis 4,805,604$ 4,861,660$ 4,539,988$ 4,035,839$
Repurchase agreements:
Weighted average financing rate 0.90% 0.80% 0.69% 0.66%
Weighted average balance 3,925,011$ 3,552,597$ 3,519,719$ 3,293,662$
Interest rate swaps:
Weighted average fixed pay rate (1.69)% (1.53)% (1.59)% (1.61)%
Weighted average variable receive rate 1.03% 0.90% 0.71% 0.65%
Weighted average net pay rate (0.66)% (0.63)% (0.88)% (0.96)%
Weighted average notional amount 3,211,944$ 2,754,839$ 2,303,030$ 1,826,133$
Interest rate swap notional / repo and TBA ratio 72% 59% 53% 47%
Total agency MBS economic net interest margin (1) 1.62% 1.56% 1.58% 1.71%
2016

10
MBS Portfolio Economics
MBS Portfolio Net Spread Income Return on Investable Capital (1):
(1) Total investable capital is calculated as stockholders’ equity determined in accordance with GAAP, less the net deferred tax asset, plus long-term unsecured debt.
(2) Includes interest expense incurred from repurchase agreement financing and net interest expense incurred from interest rate swap agreements that have been allocated to the
Company’s specified agency MBS portfolio based upon the relative average cost basis of agency MBS during the period. Excludes the economic cost or benefit of hedging
instruments other than interest rate swap agreements.
(3) Calculated based upon weighted average repurchase agreement and average investable capital balances for the period.
(4) Expressed as an annualized percentage of average investable capital for the period.
(5) Expressed as an annualized percentage of average investable capital for the period. For example, for the first quarter of 2017, calculated as $3.4 million in dollar roll income
(representing an implied net interest spread of 2.45% on a weighted average cost basis of $554.8 million) less the net interest expense incurred during the period from interest rate
swaps allocated to the Company’s TBA dollar roll portfolio (allocated based upon the relative average cost basis of TBAs during the period) divided by average investable capital for
the period (annualized). All else being equal, as the average balance of the Company’s TBA dollar roll portfolio increases, the calculated annualized return on average investable
capital will increase (and vice versa).
(6) Core general and administrative expenses represent non-interest expenses reported within the line item “total general and administrative expenses” of the consolidated statements
of comprehensive income less stock-based compensation expense and non-recurring expenses.
First Quarter
2017
Fourth Quarter
2016
Third Quarter
2016
Second
Quarter 2016
MBS asset yield 2.85% 2.59% 2.74% 2.96%
Economic cost of funds (2) (1.40)% (1.20)% (1.18)% (1.12)%
Economic net interest margin 1.45% 1.39% 1.56% 1.84%
Leverage ratio (3) 10.0 8.2 8.0 7.7
Leveraged economic net interest margin 14.45% 11.44% 12.40% 14.09%
Plus: Asset yield 2.85% 2.59% 2.74% 2.96%
Gross spread income return on average capital excluding TBAs 17.30% 14.03% 15.14% 17.05%
TBA dollar roll income, net of hedge financing costs (4)(5) 2.93% 5.47% 4.30% 3.05%
Gross spread income return on average capital including TBAs 20.23% 19.50% 19.44% 20.10%
Long-term unsecured debt interest cost (4) (1.25)% (1.21)% (1.18)% (1.19)%
Core general and administrative expenses (4)(6) (4.18)% (3.33)% (3.57)% (3.43)%
Net spread income return on average investable capital 14.80% 14.96% 14.69% 15.48%

11
Book Value Sensitivity to Rates and MBS Spreads
(1) Interest rate sensitivity of agency MBS and TBA commitments is derived from The Yield Book, a third-party model.
Actual results could differ significantly from these estimates. Interest rate sensitivity is based on assumptions resulting
in certain limitations, including (i) an instantaneous shift in rates with no changes to the slope of the yield curve, (ii) no
changes in agency MBS spreads, (iii) no changes to the investment or hedge portfolio, (iv), may reflect an interest rate
of less than 0% in certain portions of the curve, and (v) no changes to the deferred tax asset.
(2) Agency MBS spread sensitivity is derived from The Yield Book, a third-party model. Actual results could differ
significantly from these estimates. The estimated change in book value reflects an assumed spread weighted average
duration of 6.0 years, which is a model-based assumption that is dependent upon the size and composition of our
portfolio as well as economic conditions present as of March 31, 2017. The agency MBS spread sensitivity is based
on assumptions resulting in certain limitations, including (i) no changes in interest rates, (ii) no changes to the
investment or hedge portfolio, (iii) and no changes to the deferred tax asset.
Interest Rate Sensitivity• Interest rate sensitivity is the sensitivity of book
value to changes in interest rates
• Assumes an instantaneous parallel shock to the
forward yield curve
Agency MBS Spread Sensitivity• Agency MBS spread sensitivity is the sensitivity to
our book value to changes in agency MBS spreads
Interest Rate Sensitivity as of March 31, 2017 (1)
Interest Rate Sensitivity as of December 31, 2016 (1)
Interest Rate Change
(bps)
Estimated Change in Book
Value
-100 -3.0%
-50 2.1%
+50 -6.7%
+100 -14.6%
Agency MBS Spread Sensitivity as of March 31, 2017 (2)
Agency MBS Spread Sensitivity as of December 31, 2016 (2)
Agency MBS Spread Change
(bps)
Estimated Change in Book
Value
-25 19.5%
-10 7.8%
+10 -7.8%
+25 -19.5%
12
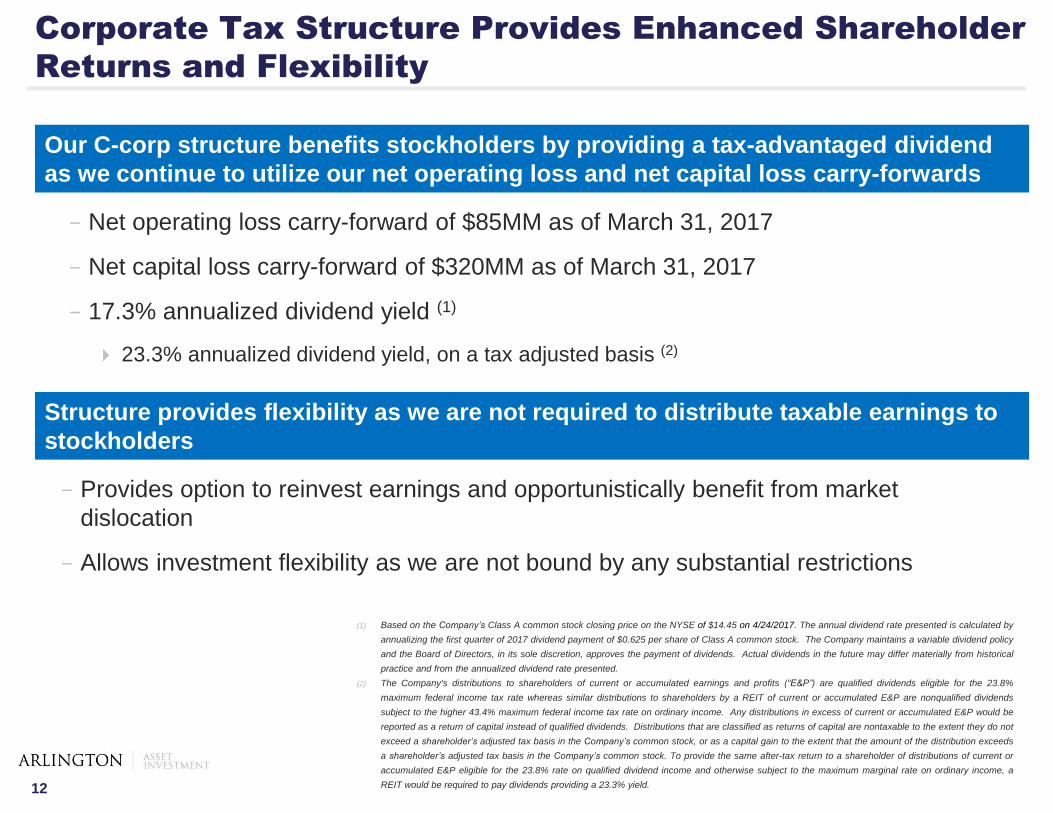
- Net operating loss carry-forward of $85MM as of March 31, 2017
- Net capital loss carry-forward of $320MM as of March 31, 2017
- 17.3% annualized dividend yield (1)
23.3% annualized dividend yield, on a tax adjusted basis (2)
(1) Based on the Company’s Class A common stock closing price on the NYSE of $14.45 on 4/24/2017. The annual dividend rate presented is calculated by
annualizing the first quarter of 2017 dividend payment of $0.625 per share of Class A common stock. The Company maintains a variable dividend policy
and the Board of Directors, in its sole discretion, approves the payment of dividends. Actual dividends in the future may differ materially from historical
practice and from the annualized dividend rate presented.
(2) The Company's distributions to shareholders of current or accumulated earnings and profits (“E&P”) are qualified dividends eligible for the 23.8%
maximum federal income tax rate whereas similar distributions to shareholders by a REIT of current or accumulated E&P are nonqualified dividends
subject to the higher 43.4% maximum federal income tax rate on ordinary income. Any distributions in excess of current or accumulated E&P would be
reported as a return of capital instead of qualified dividends. Distributions that are classified as returns of capital are nontaxable to the extent they do not
exceed a shareholder’s adjusted tax basis in the Company’s common stock, or as a capital gain to the extent that the amount of the distribution exceeds
a shareholder’s adjusted tax basis in the Company’s common stock. To provide the same after-tax return to a shareholder of distributions of current or
accumulated E&P eligible for the 23.8% rate on qualified dividend income and otherwise subject to the maximum marginal rate on ordinary income, a
REIT would be required to pay dividends providing a 23.3% yield.
Corporate Tax Structure Provides Enhanced Shareholder
Returns and Flexibility
Our C-corp structure benefits stockholders by providing a tax-advantaged dividend
as we continue to utilize our net operating loss and net capital loss carry-forwards
- Provides option to reinvest earnings and opportunistically benefit from market
dislocation
- Allows investment flexibility as we are not bound by any substantial restrictions
Structure provides flexibility as we are not required to distribute taxable earnings to
stockholders
13
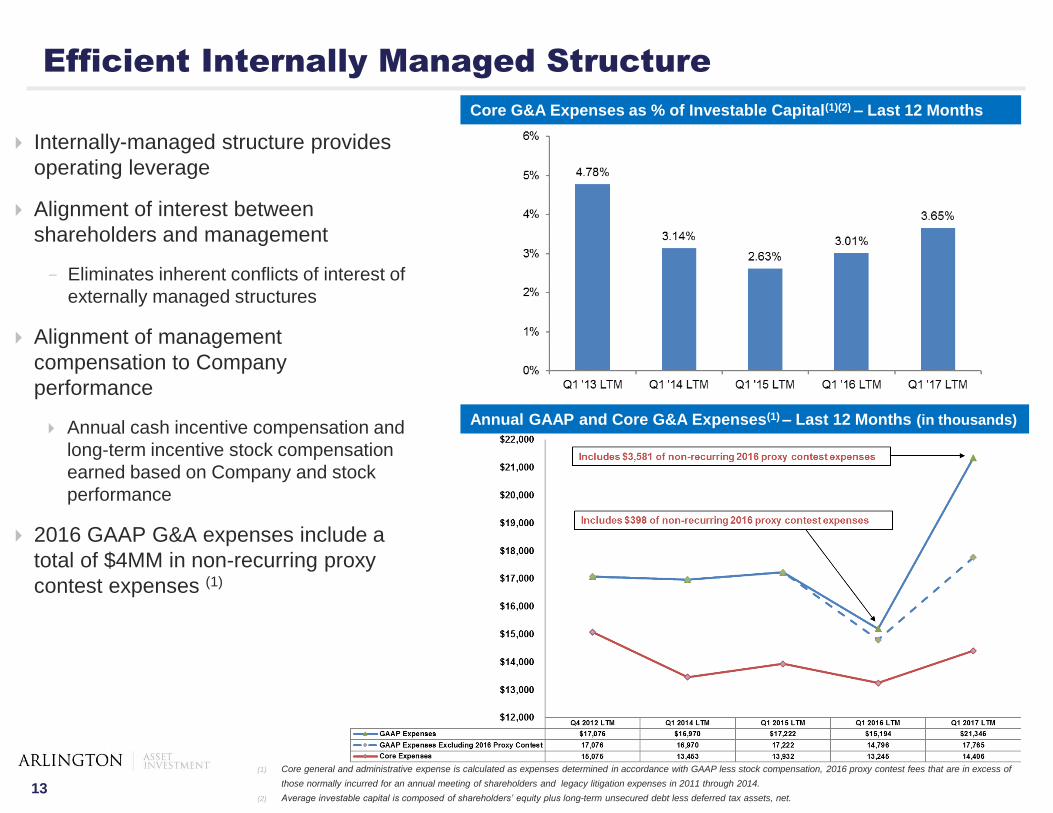
Internally-managed structure provides
operating leverage
Alignment of interest between
shareholders and management
- Eliminates inherent conflicts of interest of
externally managed structures
Alignment of management
compensation to Company
performance
Annual cash incentive compensation and
long-term incentive stock compensation
earned based on Company and stock
performance
2016 GAAP G&A expenses include a
total of $4MM in non-recurring proxy
contest expenses (1)
Core G&A Expenses as % of Investable Capital(1)(2) – Last 12 Months
Efficient Internally Managed Structure
(1) Core general and administrative expense is calculated as expenses determined in accordance with GAAP less stock compensation, 2016 proxy contest fees that are in excess of
those normally incurred for an annual meeting of shareholders and legacy litigation expenses in 2011 through 2014.
(2) Average investable capital is composed of shareholders’ equity plus long-term unsecured debt less deferred tax assets, net.
Annual GAAP and Core G&A Expenses(1) – Last 12 Months (in thousands)

14
Appendix

15
Balance Sheet
(1) Tangible book value represents total stockholders' equity less net deferred tax assets.
(2) Represents shares of Class A common stock and Class B common stock outstanding plus vested restricted stock units convertible into Class
A common stock less unvested restricted Class A common stock.
(In thousands, except per share amounts)March 31, 2017 December 31, 2016
ASSETS
Cash and cash equivalents $ 15,775 $ 54,794
Interest receivable 13,723 11,646
Sold securities receivable 160,431 —
Agency MBS 4,391,274 3,911,375
Private-label MBS 1,292 1,266
Derivative assets, at fair value 5,546 74,889
Deferred tax assets, net 65,149 73,432
Deposits 63,782 11,149
Other assets 3,520 3,003
Total assets $ 4,720,492 $ 4,141,554
LIABILITIES AND STOCKHOLDERS’ EQUITY
Liabilities:
Repurchase agreements $ 4,241,855 $ 3,649,102
Dividend payable 15,964 15,739
Derivative liabilities, at fair value 6,096 9,554
Other liabilities 8,384 10,087
Long-term unsecured debt 73,712 73,656
Total liabilities 4,346,011 3,758,138
Stockholders’ Equity 374,481 383,416
Total liabilities and stockholders’ equity $ 4,720,492 $ 4,141,554
Book value per share 15.83$ 16.21$
Tangible book value per share (1)
13.08$ 13.11$
Shares outstanding (in thousands) (2)
23,652 23,651

16
Statement of Comprehensive Income
(In thousands, except per share amounts)
First Quarter 2017 Fourth Quarter 2016 Third Quarter 2016 Second Quarter 2016
Interest income
Agency mortgage-backed securities $ 30,286 $ 24,073 $ 23,917 $ 23,408
Private-label mortgage-backed securities 37 473 1,655 2,808
Other 20 31 82 135
Total interest income 30,343 24,577 25,654 26,351
Interest expense
Short-term secured debt 8,859 7,231 6,193 5,509
Long-term unsecured debt 1,207 1,205 1,197 1,194
Total interest expense 10,066 8,436 7,390 6,703
Net interest income 20,277 16,141 18,264 19,648
Investment gain (loss), net (1,762) (31,203) 20,722 (8,947)
General and administrative expenses
Compensation and benefits 3,445 2,776 3,430 2,756
Other general and administrative expenses 1,480 1,343 1,200 4,916
Total general and administrative expenses 4,925 4,119 4,630 7,672
Income (loss) before income taxes 13,590 (19,181) 34,356 3,029
Income tax provision (benefit) 8,336 22,255 15,543 (9,865)
Net income (loss) $ 5,254 $ (41,436) $ 18,813 $ 12,894
Other comprehensive income (loss)
Unrealized losses on available-for-sale securities, net of tax $ — $ — $ (221) $ (1,006)
Reclassifications related to available-for-sale securities, net of tax — (4,685) (2,324) 775
Comprehensive income (loss) $ 5,254 $ (46,121) $ 16,268 $ 12,663
Basic earnings (loss) per share $ 0.22 $ (1.79) $ 0.82 $ 0.56
Diluted earnings (loss) per share $ 0.22 $ (1.79) $ 0.81 $ 0.56
Weighted-average shares outstanding (in thousands)
Basic 23,652 23,167 23,038 23,003
Diluted 23,897 23,167 23,349 23,070

17
(In thousands, except per share amounts)
First Quarter 2017 Fourth Quarter 2016 Third Quarter 2016 Second Quarter 2016
GAAP net interest income 20,277$ 16,141$ 18,264$ 19,648$
TBA dollar roll income 3,398 6,426 5,321 3,719
Interest rate swap net interest expense (5,409) (4,326) (5,126) (4,376)
Economic net interest income 18,266 18,241 18,459 18,991
Core general and administrative expenses (4,024) (3,326) (3,612) (3,444)
Non-GAAP core operating income 14,242$ 14,915$ 14,847$ 15,547$
Non-GAAP core operating income per diluted
share 0.60$ 0.64$ 0.64$ 0.67$
Weighted average diluted shares outstanding 23,897 23,343 23,349 23,070
Non-GAAP Core Operating Income (1)
(1) Core operating income and economic net interest income are non-GAAP financial measures. These non-GAAP measures are used by management to evaluate the financial performance of the
Company’s long-term investment strategy and core business activities over periods of time as well as assist with the determination of the appropriate level of periodic dividends to stockholders. The
Company believes that non-GAAP core operating income and economic net interest income assist investors in understanding and evaluating the financial performance of the Company’s long-term
investment strategy and core business activities over periods of time as well as its earnings capacity. A limitation of utilizing these non-GAAP financial measures is that the effect of accounting for
“non-core” events or transactions in accordance with GAAP does, in fact, reflect the financial results of our business and these effects should not be ignored when evaluating and analyzing our
financial results. The Company believes that net income and comprehensive income determined in accordance with GAAP should be considered in conjunction with non-GAAP core operating
income and economic net interest income.
Non-GAAP Core Operating Income Per Diluted Share Rollforward - Q1 2017 vs. Q4 2016

18
Non-GAAP Core Operating Income, Continued (1)
(1) Core operating income and economic net interest income are non-GAAP financial measures. These non-GAAP measures are used by management to evaluate the financial performance of
the Company’s long-term investment strategy and core business activities over periods of time as well as assist with the determination of the appropriate level of periodic dividends to
stockholders. The Company believes that non-GAAP core operating income and economic net interest income assist investors in understanding and evaluating the financial performance of
the Company’s long-term investment strategy and core business activities over periods of time as well as its earnings capacity. A limitation of utilizing these non-GAAP financial measures is
that the effect of accounting for “non-core” events or transactions in accordance with GAAP does, in fact, reflect the financial results of our business and these effects should not be ignored
when evaluating and analyzing our financial results. The Company believes that net income and comprehensive income determined in accordance with GAAP should be considered in
conjunction with non-GAAP core operating income and economic net interest income.
Reconciliation of GAAP pre-tax net income to non-GAAP core operating income:
(In thousands)
Fourth Quarter 2016 Fourth Quarter 2016 Third Quarter 2016 Second Quarter 2016
GAAP income (loss) before income taxes 13,590$ (19,181)$ 34,356$ 3,029$
Less:
Total investment (gain) loss, net 1,762 31,203 (20,722) 8,947
Stock-based compensation expense 901 793 1,018 647
Non-recurring proxy contest related expenses — — — 3,581
Add back:
TBA dollar roll income 3,398 6,426 5,321 3,719
Interest rate swap net interest expense (5,409) (4,326) (5,126) (4,376)
Non-GAAP core operating income 14,242$ 14,915$ 14,847$ 15,547$
19
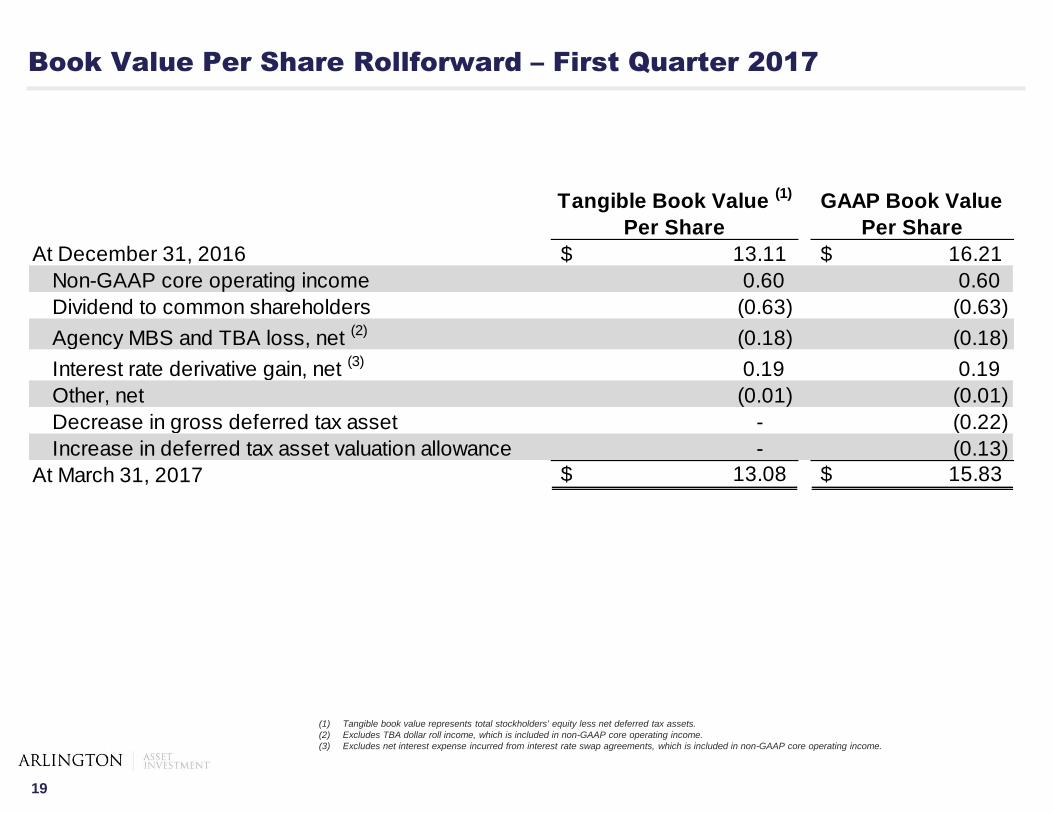
Book Value Per Share Rollforward – First Quarter 2017
(1) Tangible book value represents total stockholders' equity less net deferred tax assets.
(2) Excludes TBA dollar roll income, which is included in non-GAAP core operating income.
(3) Excludes net interest expense incurred from interest rate swap agreements, which is included in non-GAAP core operating income.
Tangible Book Value (1)
Per Share
GAAP Book Value
Per Share
At December 31, 2016 $ 13.11 $ 16.21
Non-GAAP core operating income 0.60 0.60
Dividend to common shareholders (0.63) (0.63)
Agency MBS and TBA loss, net (2)
(0.18) (0.18)
Interest rate derivative gain, net (3)
0.19 0.19
Other, net (0.01) (0.01)
Decrease in gross deferred tax asset - (0.22)
Increase in deferred tax asset valuation allowance - (0.13)
At March 31, 2017 $ 13.08 $ 15.83

20
Duration Gap
(1) Duration is derived from the Citi’s “The Yield Book” model. Duration is a measure of how much the price of an asset or liability is
expected to change if interest rates move in a parallel manner and is dependent upon several subjective inputs and assumptions. Actual
results could differ materially from these estimates. In addition, different models could generate materially different estimates using
similar inputs and assumptions.
(2) Total liability and hedge duration is expressed in asset units. Long-term debt is excluded.
(3) Weighted average duration for interest rate swap agreements includes the Company’s forward-starting interest rate swap agreements,
which have an aggregate notional amount of $375 million.
Net Duration Gap as of March 31, 2017 (dollars in thousands)
*Note: Hedged duration gap does not reflect the economic effects of options on U.S. Treasury note futures.*
Fair Value/
Notional Duration (1)
Agency MBS 4,391,274$ 5.2
Net long agency TBA position 472,430 4.4
Total agency MBS 4,863,704$ 5.1
Agency repo (2) (4,251,855)$ (0.1)
Interest rate swap agreements (2)(3) (3,225,000)$ (5.4)
Total (4.1)
Net Duration Gap 1.0

21
Arlington has transitioned its portfolio from private-label to
agency assets to achieve the highest risk adjusted returns
December 31, 2009 December 31, 2011 December 31, 2013
Agency MBS6%
Private-label MBS94%
Agency MBS36%
Private-label MBS
64%
Agency MBS capital allocation Private-label MBS capital allocation
Arlington constantly evaluates different investment opportunities to allocate capital in order to achieve
the highest risk adjusted returns
Arlington has actively transitioned the allocation of capital towards agency MBS as levered returns,
paired with Arlington’s hedging strategy, have become more attractive
As markets and housing have recovered, private-label MBS returns have fallen relative to agency MBS
Arlington's increased concentration of agency MBS has enhanced its ability to prudently leverage its
balance sheet
Agency MBS80%
Private-label MBS
20%
December 31, 2015
Agency MBS37%
Private-label MBS
63%
March 31, 2017
Agency MBS100%
Private-label MBS
0%
(1) Agency MBS allocated capital is composed of MBS and its related interest receivable, repo, derivative instruments, deposits, net receivable or payable
for unsettled securities and cash. Private-label MBS allocated capital is composed of MBS and its related repo.

22
Served as a Director of AI since co-founding the Company in 1989
Served as Vice Chairman and Chief Operating Officer from 1989 to 1999, Vice
Chairman and Co-Chief Executive Officer from 1999 to 2003, Co-Chairman and Co-
Chief Executive Officer from 2003 to 2005, Chairman and Chief Executive Officer from
2005 to 2014 and as Executive Chairman since 2014
Over 30 years of experience
Served as Chief Executive Officer since 2014, Chief Operating Officer since 2007, and a
Director of AI since March 2007
From 2004 to 2007, Mr. Tonkel served as President and Head of Investment Banking at
FBR & Co.
Over 30 years of experience
J. Rock Tonkel, Jr.
President and
Chief Executive Officer
Richard E. Konzmann
EVP and
Chief Financial Officer
Brian J. Bowers
Chief Investment Officer
and Portfolio Manager
Mr. Konzmann joined the Company in March 2015
Previously, he was with American Capital, Ltd., a publicly traded private equity firm and
global asset manager of alternative investment funds including residential mortgage
REITs, from 2002 until March 2015, most recently as Senior Vice President, Accounting
Over 25 years of experience
Mr. Bowers joined the Company in 2000
Previously, he was the Chief Portfolio Strategist for BB&T Capital Markets and the
Portfolio Manager/Plan Sponsor of CareFirst, Inc.
Over 30 years of experience
Experienced Management Team Through Numerous Cycles
Eric F. Billings
Executive Chairman