noah chaim freedman - d-scholarship.pitt.edud-scholarship.pitt.edu/36557/1/freedman_etd_2019.pdf ·...
TRANSCRIPT

Advancing Squarewave Voltammetry at PEDOT/fCNT
Carbon Fiber Microelectrodes for In Vivo Basal
Dopamine Detection
by
Noah Chaim Freedman
Bachelor of Science in Bioengineering, University of Pittsburgh,
2019
Submitted to the Graduate Faculty of
the University Honor’s College in partial fulfillment
of the requirements for the degree of
Bachelor of Philosophy
University of Pittsburgh
2019

UNIVERSITY OF PITTSBURGH
DEPARTMENT OF BIOENGINEERING
This thesis was presented
by
Noah Chaim Freedman
It was defended on
April 16, 2019
and approved by
Tracy Xinyan Cui, PhD, University of Pittsburgh Department of Bioengineering
Ian Mitch Taylor, PhD, Saint Vincent College Department of Chemistry
Elisa Castagnola, PhD, University of Pittsburgh Department of Bioengineering
Adrian Michael, PhD, University of Pittsburgh Department of Chemistry
Takashi Kozai, PhD, University of Pittsburgh Department of Bioengineering
Thesis Advisor: Tracy Xinyan Cui, PhD, University of Pittsburgh Department of
Bioengineering
ii

Copyright c© by Noah Chaim Freedman
2019
iii

Advancing Squarewave Voltammetry at PEDOT/fCNT Carbon Fiber
Microelectrodes for In Vivo Basal Dopamine Detection
Noah Chaim Freedman, B.Phil
University of Pittsburgh, 2019
Dopamine is a central nervous system neurotransmitter responsible for vital human func-
tions which operates via two signalling modes. Phasic signalling comprises subsecond fluc-
tuations in extracellular DA, whereas tonic signalling comprises minute to hour fluctuations.
Both signalling modes are critical to study for full characterization of a given in vivo DA
system, but currently available methods for sampling tonic signalling possess significant limi-
tations, including limited spatial resolution and extensive damage upon implantation among
others. In order to provide an alternative electrochemical detection technique for the quan-
tification of tonic in vivo DA signalling, squarewave voltammetry (SWV) has been developed
at carbon fiber electrodes (CFEs), but has suffered issues of low DA sensitivity and extensive
signal interferences from electrochemically active analytes such as ascorbic acid (AA). Thus,
a surface coating of poly(3,4-ethylenedioxythiophene) with carboxy-functionalized carbon
nanotubes (PEDOT/fCNT) has been developed for implementation on CFE substrates to
increase DA sensitivity. Persistent issues preventing reliable in vivo application of this tech-
nology include extensive AA interference and significant discrepancies between conditions of
the in vitro calibration environment and in vivo recording environment. The latter issue gen-
eralizes to all electrochemical sensing techniques. It was hypothesized that PEDOT/fCNT
coatings and the introduction of 0 V static potential periods prior to SWV application may be
implemented as strategies to mitigate AA interference. Furthermore, agarose gels and bovine
serum albumin surface adsorption were explored as potential mechanisms through which in
vitro conditions may more closely approximate the in vivo for more reliable calibrations and
data interpretation. PEDOT/fCNT was found to significantly increase AA sensitivity, de-
crease relative DA to AA peak amplitude, and increase the redox profile separation between
AA and DA in the SWV ∆I trace. 0 V static potential application demonstrated ability to
significantly reduce AA peak amplitude while simultaneously increasing DA peak amplitude
iv

without exhibiting significant effects on sensitivity. Finally, agarose gel and protein adsorp-
tion strategies were unsuccessful in replicating in vivo conditions in vitro, but point to future
methods by which this goal may be achieved. This work represents a major step forward in
realizing a powerful basal DA sensing tool for the neurosciences and bioengineering.
v

Table of Contents
1.0 Introduction . . . . . . . . . . . . . . . . . . . . . . . . . . . . . . . . . . . . 1
1.1 Current In Vivo Basal Dopamine Detection Methods . . . . . . . . . . . . 2
1.1.1 Microdialysis . . . . . . . . . . . . . . . . . . . . . . . . . . . . . . 2
1.1.2 Fast-Scan Controlled Adsorption Voltammetry . . . . . . . . . . . . 3
1.2 Foundations of a Novel DA Sensing Platform . . . . . . . . . . . . . . . . 5
1.2.1 Squarewave Voltammetry . . . . . . . . . . . . . . . . . . . . . . . 6
1.2.2 PEDOT/fCNT . . . . . . . . . . . . . . . . . . . . . . . . . . . . . 7
2.0 Objective . . . . . . . . . . . . . . . . . . . . . . . . . . . . . . . . . . . . . . 10
2.1 AA Signal Interference . . . . . . . . . . . . . . . . . . . . . . . . . . . . 10
2.2 Addressing In Vitro Calibrations . . . . . . . . . . . . . . . . . . . . . . . 11
3.0 PEDOT/fCNT for AA Signal Attenuation . . . . . . . . . . . . . . . . . 14
3.1 Results . . . . . . . . . . . . . . . . . . . . . . . . . . . . . . . . . . . . . 15
4.0 Waveform Modifications for AA Signal Attenuation . . . . . . . . . . . 17
4.1 Results . . . . . . . . . . . . . . . . . . . . . . . . . . . . . . . . . . . . . 18
5.0 Addressing In Vitro Calibrations . . . . . . . . . . . . . . . . . . . . . . . 20
5.1 Albumin Adsorption . . . . . . . . . . . . . . . . . . . . . . . . . . . . . . 21
5.2 Agarose Gels . . . . . . . . . . . . . . . . . . . . . . . . . . . . . . . . . . 21
6.0 Methods . . . . . . . . . . . . . . . . . . . . . . . . . . . . . . . . . . . . . . 27
6.1 Carbon Fiber Electrode Fabrication . . . . . . . . . . . . . . . . . . . . . 27
6.2 PEDOT/fCNT Preparation and Deposition . . . . . . . . . . . . . . . . . 27
6.3 Dopamine and Ascorbic Acid Calibrations . . . . . . . . . . . . . . . . . . 28
6.4 In Vivo Measurements . . . . . . . . . . . . . . . . . . . . . . . . . . . . . 29
6.5 Albumin Adsorption . . . . . . . . . . . . . . . . . . . . . . . . . . . . . . 29
6.6 Agarose Gel Experimentation . . . . . . . . . . . . . . . . . . . . . . . . . 30
7.0 Discussion . . . . . . . . . . . . . . . . . . . . . . . . . . . . . . . . . . . . . 31
8.0 Conclusion . . . . . . . . . . . . . . . . . . . . . . . . . . . . . . . . . . . . . 34
vi

9.0 Future Directions . . . . . . . . . . . . . . . . . . . . . . . . . . . . . . . . . 35
10.0 Appendix . . . . . . . . . . . . . . . . . . . . . . . . . . . . . . . . . . . . . . 36
10.1 Circuit Modelling for In Vitro Calibrations . . . . . . . . . . . . . . . . . 36
11.0 References . . . . . . . . . . . . . . . . . . . . . . . . . . . . . . . . . . . . . 39
vii

List of Figures
1 Dopamine oxidation to dopamine-o-quinone, and the reverse reduction reaction. 3
2 Bare CFE for in vivo FSCAV and FSCV DA measurement. Typical dimensions
of the exposed electrically active portion of the fiber are 7 µm by 400 µ . . . 4
3 A single scan of a generic SWV voltage waveform (a) and dimensionless current
traces from theoretical analysis of a particular waveform instatiation (b). . . . 6
4 (a) PEDOT polymer unit and (b) basic fCNT structure. fCNTs utilized in
this study are multiwalled and possess carboxylated surfaces. . . . . . . . . . 8
5 (a) Bare CFE surface and (b) 25 mC/cm2 PEDOT/fCNT coated CFE surface
as viewed under scanning electron microscope. (c) PEDOT/fCNT at various
charge densities significantly decreases in vitro electrode impedance magnitude.
∗ indicates p < 0.005. (d) Increased PEDOT/fCNT coating results in increased
in vitro DA sensitivity. ∗ indicates p < 0.05. . . . . . . . . . . . . . . . . . . 9
6 Representative ∆I traces from a CFE in artificial cerebrospinal fluid at sup-
raphysiological [DA] (1 µM, grey) and the same [DA] with physiological [AA]
(200µM). A small DA peak is observed at ∼0.15 V in the grey trace, which
is rendered undetectable in the black trace due to the presence of a large and
broad masking AA redox profile. . . . . . . . . . . . . . . . . . . . . . . . . . 12
7 (a) Representative DA calibration set performed in vitro. (b) Peak amplitudes
extracted via baseline substraction. Linear regression is performed on the peak
amplitude vs. concentration data. . . . . . . . . . . . . . . . . . . . . . . . . 13
8 Ascorbic acid assumes its ionic form, ascorbate, at physiological pH 7.4. . . . 15
viii

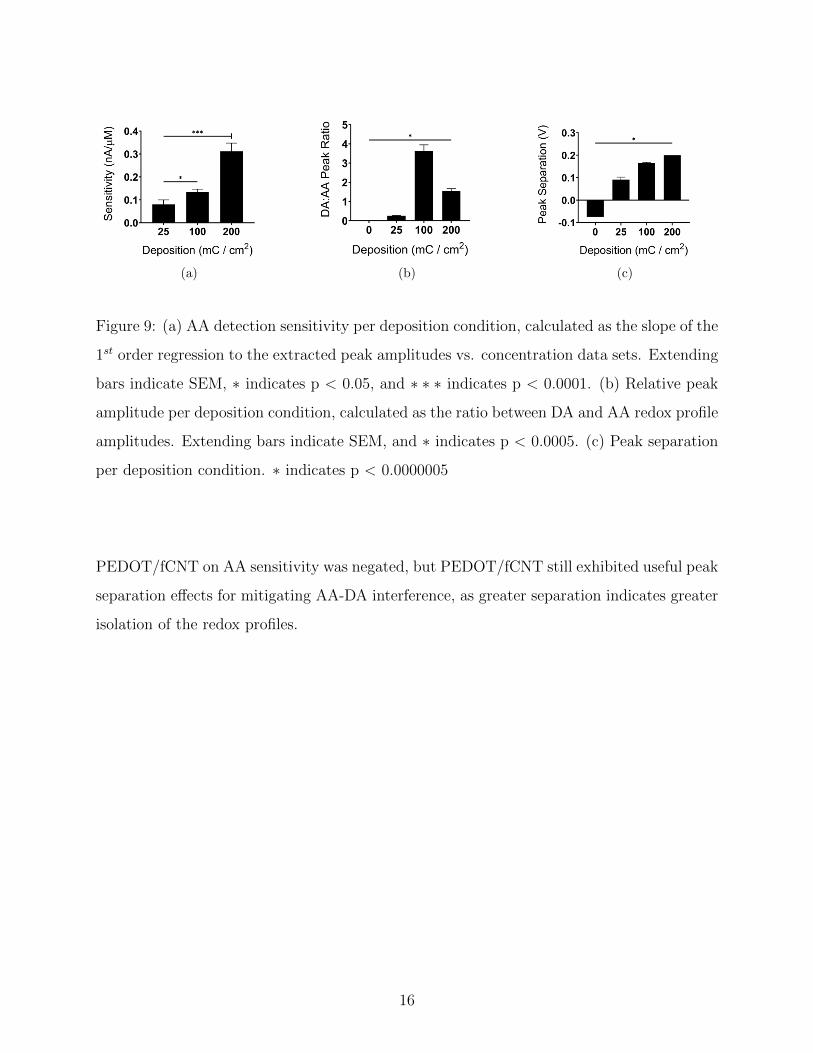
9 (a) AA detection sensitivity per deposition condition, calculated as the slope
of the 1st order regression to the extracted peak amplitudes vs. concentration
data sets. Extending bars indicate SEM, ∗ indicates p< 0.05, and ∗∗∗ indicates
p < 0.0001. (b) Relative peak amplitude per deposition condition, calculated
as the ratio between DA and AA redox profile amplitudes. Extending bars
indicate SEM, and ∗ indicates p < 0.0005. (c) Peak separation per deposition
condition. ∗ indicates p < 0.0000005 . . . . . . . . . . . . . . . . . . . . . . . 16
10 AA and DA sensitivity given particular duration of static 0 V potential appli-
cation prior to SWV. . . . . . . . . . . . . . . . . . . . . . . . . . . . . . . . 18
11 AA and DA signal amplitude for SWV following various durations of 0 V static
potential. Extending bars indicate SEM, ∗ indicates p < 0.05, and ∗∗ indicates
p < 0.01. All statistics were performed within the AA or DA group, not across. 19
12 In vivo and in vitro impedance magnitude (a) and phase (b). ∗ signifies p <
0.05, and ∗∗ signifies p < 0.01. (c) Average impedance difference between in
vivo and in vitro impedance. (d) SWV current difference (n = 5). . . . . . . 24
13 Impedance magnitude (a), phase (b) and baseline SWV signal (c) observed for
pre-adsorption and post-adsorption PEDOT/fCNT CFEs. No significance was
observed between groups for any of the three metrics. . . . . . . . . . . . . . 25
14 Impedance magnitude (a), phase (b) observed for various agarose gel con-
centrations. No significant difference was observed betwen groups despite an
apparent increase at high frequency phase. (c) Preliminary results for DA
sensitivity in various agarose gel concentrations. An apparent increase was
observed with increased concentration, and good fits were obtained for each
calibration curve (high R2). . . . . . . . . . . . . . . . . . . . . . . . . . . . . 26
ix

15 (a) Equivalent circuit model of an in vivo electrochemical detection platform
adapted from Meunier et al., depicting the working electrode and reference
electrodes as Randall’s circuits, and the tissue impedance as a generalized
impedance element Z. (b) Z is parsed into Z ′ and Rs, where Z ′+Rs = Z and Rs
represents the solution resistance of aCSF. (c) Impedance elements in series add
linearly, so moving Z ′ between the potentiostat and working electrode does not
alter the total circuit impedance. This allows the experimentalist to connect a
physical electrical circuit with impedance Z ′ to the in vitro calibration setup
in order to equate the total impedance with that of the in vivo environment. 37
16 (a) Randall’s circuit employed for in vitro correction (parameter values R1 =
122kΩ, R2 = 100kΩ, C = 300pF ). (b) In vivo, in vitro, and in vitro corrected
(with Randall’s circuit attached) voltage responses to the stimulation wave-
form. The corrected response corresponds closely with the response obtained
in vivo. . . . . . . . . . . . . . . . . . . . . . . . . . . . . . . . . . . . . . . . 38
x

1.0 Introduction
Dopamine (DA) is a monoamine neurotransmitter of the central nervous system (CNS)
which undergoes vesicular release and active transporter reuptake at the synaptic bouton [1].
The importance of DA neurotransmission in the CNS has been established for many vital
functions including pleasure and reward motivated behaviors, motor control, and hormonal
regulation among others [2, 3, 4]. In mediating these functions, DA signaling occurs through
two primary modes: phasic and tonic signalling. Phasic signaling comprises sub-second fluc-
tuations in extracellular (EC) DA arising out of singular neurotransmission events and rapid
changes in neural activity, and is implicated in learning, controlling conditioned stimuli,
drug abuse and appetitive behaviors [2, 5, 6]. In contrast, tonic signaling arises from slow
modulations in the basal dopaminergic neural firing rate which induce fluctuations in the
local EC DA concentration on minute to hour timescales. Tonic signaling mediates phasic
signaling, and is involved in motor control and higher order cognitive functions [7, 8]. Fur-
thermore, dysregulation of phasic and tonic DA signaling is implicated in major depressive
disorder, schizophrenia, substance abuse disorder, attention-deficit/hyperactivity disorder
and Parkinsons disease among others [9, 10, 11, 12]. Therefore, it is essential to consider
both phasic and tonic signaling in the neurochemical study of CNS DA sytems for uncovering
the neurochemical bases of natural human functions and disease pathologies.
A direct approach for quantifying phasic and tonic signals for DA system characterization
in vivo generally comprises measuring the EC concentration of DA in a local cerebral region
over time. Alhough various methods have been devised for direct measurement of both tonic
and phasic concentration profiles in the brain, there remains a strong need for an improved in
vivo tonic DA measurement technique due to the shortcomings of leading methodologies.
1

1.1 Current In Vivo Basal Dopamine Detection Methods
1.1.1 Microdialysis
Microdialysis was introduced in the 70s by Delgado, Ungerstedt and Pycock as a tool for
sampling extracellular analytes in the CNS and was the first method used to quantify tonic
DA signals in vivo [13, 14]. The essential system remains relatively unchanged and comprises
three components: the microdialysis probe, the perfusate, and the ex vivo analysis technique.
Microdialysis probes are typically 4 mm in length and 220 µM in outer diameter, possessing
an inlet channel through the center of the probe, a semipermeable membrane covering most
of the outer surface area, and an outlet channel which collects perfusate that has passed along
the inner wall of the membrane. Once implanted into the CNS, the probe is perfused with
artificial cerebrospinal fluid at a rate of 0.3-3 µL/min and the outlet perfusate is collected
every 1-20 min [15, 16]. During perfusion, analytes adjacent the dialysis membrane diffuse
into the perfusate driven by concentration gradient. Once the outlet perfusate is collected,
compositional analysis may be performed to determine analyte concentration by any one of
many established techniques including liquid chromatography, microchip electrophoresis, UV
analysis, fluorescence, electrochemical detection, mass spectroscopy, and nuclear magnetic
resonance [17, 18, 19, 20, 21].
At present, microdialysis sample quantifications may be performed with a maximum tem-
poral resolution of 1 min, preventing phasic DA monitoring but preserving the ability to
measure tonic signals. However, due to difficulties in accounting for diffusion differences at
the membrane interface between in vitro and in vivo environments, and the dependence on
in vitro calibrations for in vivo data interpretation, quantifications are typically reported in
the form of differentials from an initially measured baseline signal [22, 23]. This greatly lim-
its the power of this technique, as absolute basal [DA] is not easily accessible. Furthermore,
large probe dimensions prevent sampling at high spatial resolution and induce significant
tissue damage upon implantation, exacerbated by the relatively small CNS blood vessel
spacing of 60 µM [23, 24]. Substantial implantation injury confounds DA measurement by
perturbing the local neural tissue and it has been demonstrated that the implantation injury
2

of microdialysis is significantly larger than other techniques which utilize smaller probes [24].
Additionally, the tissue response to implantation injury typically limits chronic microdialy-
sis studies to within 10 days, rendering this technique unsuitable for monitoring long-term
neurochemical changes throughout disease progression [22, 25].
1.1.2 Fast-Scan Controlled Adsorption Voltammetry
Fast-scan controlled adsorption voltammetry (FSCAV) is a recently developed electro-
chemical technique for basal DA quantification [26]. If subjected to sufficiently high and low
voltage in rapid sequence, DA may undergo undergo reversible oxidization and reduction re-
actions, passing through the intermediate molecule dopamine-o-quinone (Fig. 1). Through
Figure 1: Dopamine oxidation to dopamine-o-quinone, and the reverse reduction reaction.
the reduction and oxidation (redox) reactions, DA exchanges a pair of electrons with the
oxidizing and reducing substrate. FSCAV exploits this phenomenon via implanting a con-
ducting carbon-fiber microelectrode (CFE, Fig. 2) into the brain and controlling the voltage
of the electrode while measuring the electrode current. Thus, the electrode serves as the re-
dox substrate and redox currents may be measured as electrons are exchanged. The working
principles of FSCAV may be best understood by first briefly touching upon fast-scan cyclic
voltammetry (FSCV), an electrochemical technique upon which it is based.
In a traditional method of phasic DA quantification known as fast-scan cyclic voltammetry
(FSCV), an increasing then decreasing triangle voltage waveform is applied at a CFE while
electrode current is measured [27]. CFEs possess high surface affinity for DA adsorption,
facilitating accumulation of ambient DA to the electrode surface such that measured redox
currents, also known as faradaic currents, may be enhanced. However, faradaic currents
are masked by simultaneously induced capacitive currents, or non-faradaic currents, as the
3

Figure 2: Bare CFE for in vivo FSCAV and FSCV DA measurement. Typical dimensions
of the exposed electrically active portion of the fiber are 7 µm by 400 µ
CFE repeatedly charges and discharges with electrochemically inactive ionic species. To iso-
late DA redox signals for quantification, a reference scan is subtracted possessing a similar
capacitive current profile, typically collected shortly before the scan of interest [28]. Due
to the unstable nature of background non-faradaic currents over time and the inability of
FSCV to measure [DA] in an isolated scan, this technique may not be applied for tonic DA
characterization and is limited to differential phasic DA detection [29]. However, FSCAV
overcomes this limitation by utilizing a modified voltage waveform sequence.
The FSCAV measurement begins with a brief period of 100 Hz FSCV application to minimize
DA adsorption to the CFE surface. This is followed by a prolonged period of -0.4 V static
application, inducing controlled DA-adsorption to the CFE surface such that adsorption
equilibrium is reached with a final surface content proportional to the bulk concentration.
Finally, a second round of 100 Hz FSCV is performed to monitor redox activity as DA dif-
fuses away from the surface until a new adsorption equilibrium is reached. To quantify the
local basal DA concentration, DA redox currents are isolated throughout the FSCV diffusion
period using reference scans from the initial FSCV DA minimization period. Redox signals
are then integrated across all scans to obtain a final charge metric which correlates linearly
with local DA concentration in vitro. This scanning procedure may be repeated every 20 s,
4

achieving final temporal and spatial resolutions for basal tonic DA signaling quantification
greater than those of microdialysis (CFE dimensions addressed in Fig. 2) [26]. Successful
in vivo FSCAV measurements have since been performed for basal DA quantification in the
mouse nucleus accumbens [30].
As FSCAV depends extensively on the DA adsorption properties of CFEs, it is unclear if this
method may be adapted for a non-carbon-based electrode platform, such as those typically
used for constructing metal-based multiple electrode arrays (MEAs). Although carbon fiber
shank arrays have been demonstrated, lithographically fabricated metallic site MEAs provide
a significant advantage with regards to fabrication ease and spatial resolution [31, 32]. Thus,
FSCAV is presently limited in its ability to resolve tonic signals with high spatial resolution.
Additionally, FSCAV is subject to electrochemical interference from the electrochemically
active molecules norepinephrine (NE) and dopac (DO) which exhibit redox profiles through-
out a scan which significantly overlapping with the characteristic DA signal [33]. Therefore,
DA measurement via FSCAV is further limited to applications in brain regions with low
concentrations of these molecules such as the dorsal striatum.
1.2 Foundations of a Novel DA Sensing Platform
Microdialysis and FSCAV presently comprise the most reliable methods of basal DA
quantification, yet each are subject to significant limitations as previously described. There
remains a need for a selective detection method capable of resolving in vivo basal DA sig-
nals with high temporal and spatial resolution, and which may be implemented on metal-
lic MEA substrates for enhanced spatial information. To address this persistent need, a
novel in vivo DA sensing platform has been developed, exhibiting high sensitivity for basal
DA, high DA selectivity over other physiologically present electrochemically active ana-
lytes, and which has demonstrated feasibility for use at lithographically fabricated MEAs
in prelimiary work. The detection method is based on the electrochemical technique of
squarewave voltammetry (SWV), developed by the Osteryoungs in 1985 [34], and a highly
conductive polymer nanocomposite electrode coating of poly(3,4-ethylenedioxythiophene)
5

(a) (b)
Figure 3: A single scan of a generic SWV voltage waveform (a) and dimensionless current
traces from theoretical analysis of a particular waveform instatiation (b).
with carboxyl-functionalized carbon nanotubes. The primary functions of each component
will be addressed in the following subsections.
1.2.1 Squarewave Voltammetry
SWV is a voltammetric technique designed to sample faradaic currents in relative iso-
lation from non-faradaic currents at a particular voltage. Measuring faradiac currents are
of primary concern given the desire to obtain information regarding the concentration of an
electrochemically active species. In a voltammetric scheme, information relevant to analyte
concentration is contained in the faradaic component of the sampled current, and quantifica-
tion techniques are typically designed to analyze this component separate from confounding
background non-faradaic currents. SWV is capable of resolving faradaic signals in near-
isolation from non-faradaic signals by applying a particular voltage waveform comprising
the summation of a stairstep and a squarewave (Fig. 3a), and a modified version of this
waveform termed multiple-cyclic SWV has been successfully used for tonic DA measurement
at PEDOT/nafion coated CFEs [35].
One may usefully conceptualize this waveform by considering a series of symmetric cathodic
6

and anodic square voltage pulses, in which a subsequent pair of pulses is centered at a slightly
higher voltage specified in the waveform design. During a single positive or negative pulse,
the non-faradaic electrode current decays exponentially while the faradiac current decays
according to an inverse polynomial [36]. SWV leverages this property by sampling the cur-
rent at the end of each pulse, such that the proportion of the non-faradaic current in the
measured signal is minimized (Fig. 3b). Furthermore, for each pair of pulses, the 2 sampled
currents are combined by subtracting the anodic pulse current from the cathodic pulse cur-
rent, resulting in a final signal with a single current value per centered voltage referred to as
∆I. Therefore, for a given pulse pair, all electrochemically active analytes possesing redox
currents lying between the cathodic and anodic potentials will be oxidized and then then
reduced. Subsequently, as the waveform passes the redox potential of a particular electro-
chemically active analyte, ∆I increases, reaches a maximum value, and then decays as the
oxidization equilibrium is reached [36]. In the presence of DA, this redox process manifests
as a peak in the ∆I trace at approximately 0.15 V which may be quantified and correlated
with a local concentration via calibration.
Due to the relatively high impedance of small electrode sites and intrinsically low currents
associated with this technique, typical in vivo electrochemical sensing electrodes, such as
CFEs, are not suitable for sensitive application of SWV. However, CFEs represent the most
suitable substrate for implementating SWV for DA detection, as these electrodes have been
well established for the detection of DA in the field of in vivo neurochemical sensing due
to their high affinity for DA adsorption and sensitivity to redox events compared to other
electrodes [26, 27, 28, 29, 30, 31, 32, 33, 36]. Thus, in order to successfully realize SWV at im-
plantable microelectrodes, it was necessary to investigate methods of electrode modification
to overcome issues of high impedance.
1.2.2 PEDOT/fCNT
It was hypothesized that the highly conductive nanocomposite poly(3,4-ethylenedioxy-
thiophene) with carboxy functionalized carbon nanotubes (PEDOT/fCNT) may be de-
posited onto the electrode surface to achieve decreased electrode impedance and in turn
7

increase DA sensitivity via SWV detection (Fig. 4). Previous work has shown that PE-
DOT/fCNT surface coatings significantly reduce 1 kHz impedance at PtIr electrophysiologi-
cal sensors, resulting in greater electrical sensitivity, and furthermore endow enhanced stabil-
ity and biocompatibility over the course of chronic in vivo electrophysiological recordings [37,
38]. Thus, PEDOT/fCNT was considered a suitable candidate for overcoming impedance
restrictions on SWV at CFEs and for eventual biocompatibility for future chronic in vivo ap-
plications. PEDOT/fCNT may be successfully and controllably deposited via chronocoulom-
(a) (b)
Figure 4: (a) PEDOT polymer unit and (b) basic fCNT structure. fCNTs utilized in this
study are multiwalled and possess carboxylated surfaces.
betric electropolymerization onto the surface of CFEs for significantly decreased electro-
chemical impedance (Fig. 5a-c, see methods for details). As predicted, decreased impedance
directly translated to enhanced DA detection sensitivity via SWV, assessed through per-
forming in vitro DA calibrations (Fig. 5d, see methods for details). Enhanced sensitivity
enabled successful in vivo basal DA detection in the rat dorsal striatum at PEDOT/fCNT
coated CFEs, and preliminary work has suggested that this platform may be implemented at
lithographically fabricated metal-site MEAs as well for multi-site in vivo recordings. Thus,
this technique holds promise for providing a powerful basal DA-sensing tool which may
circumvent the shortcomings of microdialysis and FSCAV.
8

(a) (b)
(c) (d)
Figure 5: (a) Bare CFE surface and (b) 25 mC/cm2 PEDOT/fCNT coated CFE surface as
viewed under scanning electron microscope. (c) PEDOT/fCNT at various charge densities
significantly decreases in vitro electrode impedance magnitude. ∗ indicates p < 0.005. (d)
Increased PEDOT/fCNT coating results in increased in vitro DA sensitivity. ∗ indicates p
< 0.05.
9

2.0 Objective
This thesis will address critical developments in mitigated two of the primary issues
confounding application of SWV at PEDOT/fCNT CFEs for in vivo basal DA measurement.
Methods for attenuating signal interference from the most prominent electrochemically active
molecule in the CNS will be addressed, followed by a review of progress in developing an
improved platform for in vitro calibrations to enable more reliable interpretation of in vivo
recordings.
2.1 AA Signal Interference
DA measurements via SWV are subject to electrochemical interference in cases where
other electrochemically active molecules are present. As SWV is not an inherently selective
technique, electrochemically active molecules possessing redox potentials within the bound-
aries of the scan will contribute to the measured signal according to their redox profile.
Redox profiles may overlap and in some cases result in a final ∆I trace in which the presence
of two distinct redox profiles is not apparent. Since the extent of signal quantification us-
ing SWV analysis comprises measuring the amplitude of the current peak produced by the
redox activity of a given analyte, significant overlap can completely confound quantification
of either analyte.
In the case of DA detection, the most prominent molecule which exhibits significant interfer-
ence is acsorbic acid (AA), an antioxidant present in vivo at concentrations approximately
three orders of magnitude greater than that of DA (∼O(100µM) AA vs. ∼O(100nM DA))
[39, 40]. Early in vitro investigations of potential interference effects from AA on the DA
redox signal during SWV at bare CFEs revealed masking of the DA signal sufficient to com-
pletely hinder reliable quantification (Fig. 6). Given comparable conditions in vivo, this
effect, combined with previously described low sensitivity issues, fully prevents application
of SWV at bare CFEs for basal DA measurement.
10

The first objective of this thesis is to provide a comprehensive analysis of two mutually com-
patible approaches which were investigated to address and mitigtate the AA interference
issue. First, effects of increased PEDOT/fCNT deposition will be explored as a mechanism
for achieving greater DA selectivity over AA. Second, modifications to the SWV waveform
designed to minimize AA detection will be investigated, comprising application of a 0 V
static potential prior to scanning.
2.2 Addressing In Vitro Calibrations
As is the case for all neurochemical sensing paradigms, proper interpretation of in vivo
SWV measurements critically depends on the quality of constructed calibrations. SWV
directly provides a measure of current, following extraction of the peak amplitude for the
redox profile of a particular analyte. However this measure does not intrinsically provide
useful information regarding the DA concentration at the local in vivo environment at the
scan time. In order to correlate this metric with a specific concentration, it is necessary to
construct a calibration curve, which represents the relationship exhibited by the particular
sensor between the DA concentration and peak amplitude observed. In traditional in vivo
SWV, these calibration curves are constructed following the recording by performing scans in
vitro in artifical cerebrospinal fluid (aCSF) at increasing DA concentrations which span the
concentration region of interest. Peak amplitudes may be extracted for each concentration
and a calibration curve may be constructed by fitting a 1st order regression to the peak vs.
concentration data (Fig. 7).
The reliability of this calibration method may be questioned once the differences betwen
aCSF and the in vivo recording environment are considered. aCSF poorly mimics numerous
properties of the CNS parenchymal tissue, including electrochemical impedance, detailed
chemical composition, poroelasticity, protein composition, presence of cellular elements and
others. These significant discrepancies naturally lead to skepticism regarding the applicabil-
ity of calibration curves constructed in aCSF to the interpretation of data recorded in vivo.
It is currently unclear how these various discrepancies may lead to differences in electrode
11

sensitivity between the in vivo and in vitro environment. Thus, in the second portion of this
work, these differences will be scrutinized and methods to construct a more representative
in vitro calibration environment will be explored, in hopes of obtaining calibration curves
which may be more confidently applied to in vivo recordings.
Figure 6: Representative ∆I traces from a CFE in artificial cerebrospinal fluid at supraphys-
iological [DA] (1 µM, grey) and the same [DA] with physiological [AA] (200µM). A small
DA peak is observed at ∼0.15 V in the grey trace, which is rendered undetectable in the
black trace due to the presence of a large and broad masking AA redox profile.
12

(a) (b)
Figure 7: (a) Representative DA calibration set performed in vitro. (b) Peak amplitudes
extracted via baseline substraction. Linear regression is performed on the peak amplitude
vs. concentration data.
13

3.0 PEDOT/fCNT for AA Signal Attenuation
The emergence of redox activity for a particular electrochemically active molecule during
a SWV scan depends critically on two criteria. First, the redox potential of the species must
exist within the boundaries of the scan, and second, the molecule must physically adsorb to
the surface of the electrode to facilitate direct electron transfer during the redox reactions.
Altering the boundaries of the SWV waveform may be considered in some regimes, but
must be ruled out in the case of DA signal interference by AA. At bare CFEs, it is not
possible to alter the boundaries due to the broad nature of the AA redox profile. At PE-
DOT/fCNT coated CFEs, it was found that the AA redox profile shifts negatively to be
centered approximately at 0 V, in keeping with the theoretical predictions and early experi-
mental investigation of AA oxidation [41]. Therefore at coated CFEs it is also not possible to
alter the waveform boundaries in hopes of inducind DA redox activity without AA redox ac-
tivity since the DA redox potential is greater than that of AA (in all cases AA redox activity
will be induced if DA detection is desired). Therefore, waveform boundary alterations were
not feasible and attention was drawn to methods by which AA adsorption may be reduced
in hopes of attenuating AA redox currents in the measured signal.
At physiological pH of 7.4, AA ionizes into ascorbate with high dissociation constant, result-
ing in a stable structure which possesses a negative charge (Fig. 8) [42]. Due to the presence
of negatively charged carboxylate groups in the PEDOT/fCNT coating, it was hypothesized
that increased surface deposition would decrease the relative bulk proportion of AA near
the surface of the electrode via electrostatic repulsion. In turn, this was predicted to de-
crease the amount of AA adsorbed to the surface of the electrode and ultimately reduce the
AA oxidation signal present in the SWV scan. Thus, an inverse relationship was predicted
between the extent of PEDOT/fCNT surface coating and the magnitude of the AA oxida-
tion signal. However, given previous results from DA sensitivity analysis on PEDOT/fCNT
coated CFEs, there remained uncertainty regarding the effects of a suspected increase in sen-
sitivity to AA faradiac currents, which may be sufficient to overcome the beneficial effects
of reduced surface adsorption. Ultimately the effects of reduced adsorption were predicted
14

to be greater.
Figure 8: Ascorbic acid assumes its ionic form, ascorbate, at physiological pH 7.4.
3.1 Results
CFEs were prepared with 25, 100, and 200 mC/cm2 PEDOT/fCNT deposition followed
by DA and AA calibrations performed in aCSF for sensitivity analysis. Additional DA
calibrations were performed in aCSF at 200µM AA to charaterize hypothesized mitigating
effects of PEDOT/fCNT on AA-DA interference. From these calibrations, the 500 nM DA +
200µM AA scan was used to determine the ratio of DA:AA peak amplitudes and the extent
of peak separation measured as the distance in volts within the scan between the peaks of
the AA and DA redox profiles (see methods for details).
Contrary to hypothesized effects, AA sensitivity was found to increase significantly with
increased PEDOT/fCNT deposition (Fig. 9a). Data sets obtained from the 25 mC/cm2
CFE group were excluded from relative amplitude and peak separation analysis, as the DA
and AA redox profile overlap was sufficient to prevent isolated quantification of the two
individual peaks. It may be assumed that the effective peak separation is 0 V for the 25
mC/cm2 CFE group, as this represents how the scans are treated in practice. Considering
only the 100 and 200 mC/cm2 groups, relative peak amplitude and peak separation was found
to increase significantly with increased deposition (Fig. 9b,c). The hypothesized impact of
15
(a) (b) (c)
Figure 9: (a) AA detection sensitivity per deposition condition, calculated as the slope of the
1st order regression to the extracted peak amplitudes vs. concentration data sets. Extending
bars indicate SEM, ∗ indicates p < 0.05, and ∗ ∗ ∗ indicates p < 0.0001. (b) Relative peak
amplitude per deposition condition, calculated as the ratio between DA and AA redox profile
amplitudes. Extending bars indicate SEM, and ∗ indicates p < 0.0005. (c) Peak separation
per deposition condition. ∗ indicates p < 0.0000005
PEDOT/fCNT on AA sensitivity was negated, but PEDOT/fCNT still exhibited useful peak
separation effects for mitigating AA-DA interference, as greater separation indicates greater
isolation of the redox profiles.
16

4.0 Waveform Modifications for AA Signal Attenuation
Although waveform truncation was ruled out as a possible strategy for addressing the
interference between DA and AA redox profiles, an alternative voltammetric approach was
devised in hopes of reducing presence of AA at the surface of the electrode during SWV
scans. As previously mentioned, 100 mC/cm2 PEDOT/fCNT coated CFEs exhibit AA ox-
idation profiles centered slightly below 0 V, in agreement with early theoretical predictions
and experimental results [41]. The DA redox potential exists well above 0 V at ∼0.15 V.
Thus, it is reasonably justified to assume that a 0 V static potential may be applied without
affecting the ratio of DA to dopamin-o-quinone, the oxidation product of DA, at the elec-
trode surface, which could have the adverse affect of reducing the DA signal. Therefore, it
follows that a static potential at 0 V may be utilized to pre-oxidize AA near the electrode
surface prior to SWV scanning.
Two effects were hypothesized to result from prolonged 0 V static potential application
before SWV. In aqueous solution and under oxidation conditions, AA is oxidized to dehy-
droascorbate which then rapidly undergoes irreversible hydrolysis to diketogulonate (DKG)
[41]. Therefore, applying 0 V at the electrode in the presence of AA was hypothesized to
decrease local [AA] while increasing [DKG]. Over time, this would have the effect of devel-
oping an [AA] gradient from the bulk solution to the electrode surface which increases in
length over time. As the duration 0 V application increases, the spatial [AA] distribution
may reach a state in which a long distance must be travelled from the electrode surface to
reach concentrations comparable to the bulk, with [AA] steadily increasing with distance.
This would ultimately result in less [AA] near the electrode surface and additionally less
locally available [AA] to replenish lost [AA] during a SWV scan.
Ultimately, it was hypothesized that 0 V static potential application prior to SWV would
exhibit an inverse relationship between duration and AA peak amplitude. Potential effects
on DA detection were unclear.
17

4.1 Results
CFEs were prepared with 100 mC/cm2 PEDOT/fCNT deposition and SWV was per-
formed in aCSF with 0 V static potential applied between scans for 1, 3, 5, 10, 20, 30, 60,
and 120 s in 200 µM AA and 500 nM DA solutions to assess the effect of static potential ap-
plication on redox profile amplitude. Additionally, AA and DA calibrations were performed
for 0, 15, and 60 s durations to assess impact on sensitivity for each analyte.
Increased static potential application of 0 V was found to significantly attenuate the AA
peak amplitude (Fig. 11). A minimum signal amplitude was reached at 60 s, after which no
significant changes in the peak size were observed. Unexpectedly, the DA peak signal was
found to increase significantly with increased static potential (Fig. 11). Durations past 120
s were not tested given design limitations on desired temporal resolution for this system.
Figure 10: AA and DA sensitivity given particular duration of static 0 V potential application
prior to SWV.
Sensitivity analysis was performed with three representative durations : 0, 15, and 60 s. 60
s was used as the maximum duration due to the absence of significant difference observed
for longer durations. Despite an apparent decrease and increase in sensitivity observed for
AA and DA respectively, static potential application was found to have no significant effect
on AA or DA sensitivity, tested via Welch’s T-Test (Fig. 10).
18

Figure 11: AA and DA signal amplitude for SWV following various durations of 0 V static
potential. Extending bars indicate SEM, ∗ indicates p < 0.05, and ∗∗ indicates p < 0.01.
All statistics were performed within the AA or DA group, not across.
19

5.0 Addressing In Vitro Calibrations
Traditional methods of obtaining calibration curves for electrochemical sensing tech-
niques utilize solution-based calibration environments such as aCSF or PBS. However, these
sustances poorly replicate important characteristics of the in vivo environment, such as
electrochemical impedance, poroelasticity, protein content and others which may impact
sensitivity and overall signal magnitude. Considering SWV application at PEDOT/fCNT
coated CFEs, the possibility that the traditional in vitro calibration technique may be con-
founding interpretations of in vivo recordings first became apparent as discrepancies were
observed in the overall magnitude of the SWV background current and in the magnitude of
electrochemical impedance (Fig. 12).
Significant differences were observed in electrochemical impedance magnitude profiles ob-
tained through electrochemical impedance spectroscopy for frequencies above 100 Hz, but
differences in phase across all frequencies were insignificant. Additionally, in vitro and in
vivo baseline SWV signals were found to exhibit a constant difference of approximately 1 µA
across all points in the waveform. Although significance was not observed between the in
vitro and in vivo CFE groups (Fig. 12d), this may be primarily attributed to high variability
in the baseline signal across electrodes. Within-electrode differences were preserved for all
electrodes studied, and large enough differences were exhibited to be considered a potential
source of calibration confound. It was hypothesized that the intrinsic impedance difference
between solution and neural tissue served as the source of SWV signal differences, and that
if the calibration environment may be constructed to possess similar impedance to the in
vivo situation, similar SWV scans would follow.
Two approaches were devised and tested for applicability in designing a novel in vitro cal-
ibration environment that sufficiently mimics in vivo impedance and SWV characteristics.
Primary in vivo characteristics investigated comprise protein content and the combined
poroelasticiy and bulk conductance properties.
20

5.1 Albumin Adsorption
Traditional calibration environments do not account for extensive in vivo extracellular
protein content. Following implantation, it has been demonstrated that extracellular proteins
coat the surface of implanted electrodes, in turn altering the electrochemical impedance
and electrode resistance to faradaic charge transfer [43, 44]. Both of these electrochemical
characteristics greatly influence SWV DA sensitivity, as the link between electrode impedance
via PEDOT/fCNT coating has previously demonstrated (Fig. 5d). However, the effects due
to protein adsorption have not been characterized for PEDOT/fCNT coated CFEs. Thus,
it was hypothesized that protein adsorption may comprise a component of the total effect
responsible for in vivo impedance and SWV signal differences.
To address this question, CFEs were prepared with 100 mC/cm2 PEDOT/fCNT deposition
and baseline impedance and SWV were collected in aCSF. Then, electrodes were exposed
to 50 mg/ml bovine serum albumin in aCSF for 1 hr, allowing adsorption equilibrium to be
reached. Albumin was utilized as a model adsorption protein due to its prevalence in the
blood stream, high likelihood of exposure to an implanted microelectrode via blood vessel
corruption, availability, and precedent in the literature [45, 46]. Subsequently, electrodes
were transferred to fresh aCSF solution, and electrochemical impedance spectroscopy (EIS)
and SWV were performed to assess protein adsorption impact on impedance and baseline
SWV signal. Protein coatings were assumed to be stable during the solution transition due
to extensive characterization of stability of these layers on various electrode substrates [47,
48, 49].
Contrary to expectation, no significant differences were observed in the impedance profiles
or in the SWV baseline between the pre-adsorption and post-adsorption groups (Fig. 13).
5.2 Agarose Gels
An alternative approach to account for altered impedance and SWV signal considers the
electrochemical properties of the bulk tissue rather than surface adsorption effects previously
21

covered. Specifically, neural tissue possesses poroelasticity, a characteristic which describes
interactions between fluid and a solid medium consisting of pores and convoluted paths.
However, solutions, such as aCSF, possess zero poroelasticity by definition. The relationship
between poroelasticity and electrical conductance of a material has been well characterized,
and thus connections between poroelastic properties of the recording medium, increased
impedance and elevated SWV signal were considered [50]. Although the average impedance
difference spectrum between in vivo and in vitro conditions posesses a imaginary components
(Fig. 12c), a significant component of the spectrum is primarily real, suggesting that a
simple bulk resistance achieved by altering poroelastic properties of the in vitro medium
may be sufficient to account for the aforementioned discrepancies. However, this suggestion
is contingent on the assumption that there is a direct link between impedance and SWV
signal.
Agarose gels have been previously utilized to model bulk diffusion and poroelastic properties
of neural tissue, and have successfully replicated CNS parenchymal tissue conductances at
0.6% concentration [51, 52]. Therefore, agarose gels were selected as a potential alternative
medium in which post-measurement calibrations may be performed. It was hypothesized
that in vivo conductance and poroelasticity characteristics may be replicated to achieve
similar impedance in vitro, from which similar SWV profiles would naturally follow.
To address this hypothesis, 100 mC/cm2 PEDOT/fCNT CFEs were prepared and baseline
SWV and EIS scans in aCSF solution were performed. Agarose gels were prepared spanning
the concentration range of 0.1% to 0.6%. Gels possessing concentrations above 0.6% were
too stiff to allow for CFE implantation. After gels were allowed to set following initial
fabrication, CFEs were implanted into the center of each gel concentration in turn, and EIS
and SWV scans were performed. Additionally, preliminary data were collected to assess the
effects of agarose concentration on DA sensitivity using a single 100 mC/cm2 PEDOT/fCNT
coated CFE. In this preliminary experiment, gels were prepared at 0.2%, 0.4%, and 0.6% at
various DA concentrations, after which SWV scans were performed in each gel followed by
sensitivity analysis (see methods for details).
Surprisingly, no significant differences in magnitude or phase were observed across agarose
gel concentrations (Fig. 14a,b). Furthermore, no significant difference was observed in the
22

baseline SWV signal amplitude (data not shown). As a result, further analysis of SWV
and agarose gel was not pursued, but preliminary data on DA sensitivity across agarose gel
concentrations hinted at an apparent direct relationship between the two variables, although
further testing is necessary for confirmation (Fig. 14a,b).
23

(a) (b)
(c) (d)
Figure 12: In vivo and in vitro impedance magnitude (a) and phase (b). ∗ signifies p < 0.05,
and ∗∗ signifies p < 0.01. (c) Average impedance difference between in vivo and in vitro
impedance. (d) SWV current difference (n = 5).
24

(a) (b) (c)
Figure 13: Impedance magnitude (a), phase (b) and baseline SWV signal (c) observed for
pre-adsorption and post-adsorption PEDOT/fCNT CFEs. No significance was observed
between groups for any of the three metrics.
25

(a) (b)
(c)
Figure 14: Impedance magnitude (a), phase (b) observed for various agarose gel concentra-
tions. No significant difference was observed betwen groups despite an apparent increase
at high frequency phase. (c) Preliminary results for DA sensitivity in various agarose gel
concentrations. An apparent increase was observed with increased concentration, and good
fits were obtained for each calibration curve (high R2).
26

6.0 Methods
6.1 Carbon Fiber Electrode Fabrication
Single carbon fibers (7 µm diameter, T650; Cytec Carbon Fibers LLC, Piedmont, SC,
USA) were placed in the center of borosilicate glass capillaries (0.4 mm ID, 0.6 mm OD;
A-M systems Inc., Sequim, WA, USA) and pulled to a fine tip (8 µm OD) using a vertical
electrode puller (Narishige puller, Los Angeles, CA, USA). Electrode tips were sealed using
low viscosity epoxy (Spurr Epoxy; Polysciences Inc., Warrington, PA, USA). The exposed
carbon fibers were cut to 400 µm length as measured from the end of the pulled glass tip.
Electrical connection to the carbon fiber was established by backfilling the capillary with
liquid mercury and placing a nichrome wire into the end of the capillary (annealed nichrome;
Goodfellow, Oakdale, PA, USA). Fully assembled electrodes were soaked in isopropanol for
10 minutes before proceeding [53].
6.2 PEDOT/fCNT Preparation and Deposition
Multi-walled carbon nanotubes (CNTs) were purchased (OD 2030 nm, ID 510 nm, length
1030 µm, purity > 95%, Cheap Tubes Inc., Brattleboro, VT, USA). 200 mg of CNTs were
bath sonicated for 2 hr at ambient temperature in a 100 ml solution of 25 ml HNO3 and 75
H2SO4 (Sigma-Aldrich Co., St. Louis, MO, USA) for surface carboxylation. The solution
was then stirred at 50 C for 12 h, then diluted to 1 L with DI water (Milli-Q, Millipore Co.,
Billerica, MA, USA). The mixture was left to settle for 2 hours, after which the supernatant
was discarded. Carboxy-functionalized carbon nanotubes (fCNTs) were then transfered to a
a SanakeSkin Dialysis Membrane (3.5k MWCO, 35mm diameter) and dialyzed for 48 hours
in DI water. Water was renewed every 6-12 hours until a neutral pH was reached after
the next 6-12 hour cycle. fCNTs were then transferred to a crystallization dish and bath
sonicated for 2 hrs, after which a final 6-12 hour period of dialysis was performed. fCNTs
27

were extracted via Rotovap [37].
EDOT/fCNT polymerization solution was prepared via mixing 1.5 mg fCNTs with 1.5 mL
DI water followed by bath sonication for 2 min. 1.5 µL 3,4-ethylenedioxythiophene (EDOT)
(Sigma-Aldrich, St. Louis, MO, USA) was added to the mixture, followed by 2 min vortex
mixing and 45 min probe sonication using a 2 s pulse 1 s rest function. Final solutions were
stored at 1.6 C for > 10 min prior to polymerization.
Polymerization was conducted using a 3 electrode setup with a Ag/AgCl reference electrode,
Pt counter electrode, and pre-fabricated bare CFE as the working electrode submerged in
EDOT/fCNT solution. Chronocoulombetric coating were performed under potentiostatic
control at 0.9 V (Metrohm Autolab, PGSTAT128N). Coating was terminated once a pre-
calculated charge cutoff was reached. Charge cutoffs were calculated via considering elec-
trode surface area and desired charge density (100 mC/cm2). Surface area was obtained by
measuring exposed carbon fiber length and applying a cylindrical approximation.
6.3 Dopamine and Ascorbic Acid Calibrations
All calibrations were performed under potentiostatic control using a SWV waveform at
25 HZ, 0.05 V modulation amplitude, and 0.005 V step size, from -0.2 V to 0.4 V (Metrohm
Autolab, PGSTAT128N). Potential was held at 0 V between scans for durations specified
by the type of calibration being performed. DA and AA calibrations were performed in
artificial cerebrospinal fluid (aCSF, 142 mM NaCl, 1.2 mM CaCl2, 2.7 mM KCl, 1.0 mM
MgCl2, 2.0 mM NaH2PO4, pH 7.4). Detection peaks for both analytes were extracted by
first estimating the peak boundaries via linear baseline approximation and then performing
a 2nd order regression using 20 data points (10 on either side of the estimated peak). Peak
values were taken as the maximum difference between the scan and regression fit within
the peak region. Electrode sensitivity was determined by computing the 1st order linear
regression to the peak vs concentration data and taking the slope, representing the estimated
proportionality constant between peak amplitude and [DA] or [AA]. DA calibrations (0 nM,
100 nM, 250 nM, 500 nM, 1 µM) and AA calibrations (0 nM, 100 µM, 200 µM, 300µM) were
28

performed by collecting scans in aCSF the specified analyte concentrations. DA calibrations
were also performed in the presence of 200 µM AA to further characterize selectivity. All data
were analyzed in MATLAB (Mathworks, MA). Statistical significance tests were performed
using Welch’s 2-sample T-Test.
6.4 In Vivo Measurements
For each in vivo recording, a male Sprague Dawley rat (350-450 g, Charles River, Wilm-
ington, MA, USA) was anesthetized with 2% isoflurane by volume (Henry Schein, Melville,
NY, USA) and positioned in a stereotaxic head restraint to flat skull orientation. The skull
and dura were removed to allow for the positioning of a single PEDOT/fCNT coated CFE
into the dorsal striatum (2.5 mm lateral to bregma, 0.42 mm anterior to bregma, 5 mm below
the cortical surface) and two additional holes were bored into the skull to accommodate the
positioning of a Ag/AgCl reference electrode contralaterally to the CFE and a bone screw
counter electrode caudally to the reference. Electrochemical impedance spectroscopy was
applied immediately following implantation, and SWV (waveform detailed above) was then
applied over a 75-minute period. Upon reaching the predetermined experimental endpoint,
the CFE was explanted for post-calibration (calibration detailed above) and the animal was
sacrificed. All data were analyzed in MATLAB (Mathworks, MA). Statistical significance
tests were performed using Welch’s 2-sample T-Test, and p-values greater than 0.05 were
considered insignificant.
6.5 Albumin Adsorption
Bovine serum albumin (BSA) (Sigma Aldrich, St. Louis, MO, USA) was dissolved in
20 ml aCSF (preparation described in calibration section) for a final concentration of 50
mg/ml. Electrochemical impedance spectroscopy (EIS) and SWV was collected in aCSF at
100 mC/cm2 PEDOT/fCNT coated CFEs, followed by 1 hr soaking in the prepared BSA
29

solution. Then, CFEs were moved to a fresh aCSF solution for a second collection of SWV
and EIS. All data were analyzed in MATLAB (Mathworks, MA). Statistical significance
tests were performed using Welch’s 2-sample T-Test, and p-values greater than 0.05 were
considered insignificant.
6.6 Agarose Gel Experimentation
0.1% to 0.6% agarose gels were prepared via mixing agarose (Sigma-Aldrich, St. Louis,
MO, USA) in 250 mL aCSF followed by 1000 W microwave on high power for 2 min. Heated
mixtures were then cast into 6-plate wells. aCSF/DA solutions were added immediately
following casting for gels to be prepared at specified [DA] for calibrations. All mixtures were
allowed to gel at room temperature. Once the gels settled, CFEs coated to 100 mC/cm2 were
inserted for EIS and SWV measurements. All data were analyzed in MATLAB (Mathworks,
MA). Statistical significance tests were performed using Welch’s 2-sample T-Test, and p-
values greater than 0.05 were considered insignificant.
30

7.0 Discussion
Increased AA sensitivity and relative AA signal to DA signal due to increased PE-
DOT/fCNT deposition indicates that PEDOT/fCNT sensitivity to charge transfer exhibited
stronger effects than the expected primary effect of electrostatic repulsion of AA from the
surface. It may be possible that electrostatic repulsion was not achieved due to ambient
cationic species accumulating on the surface to cancel the intrinsic fCNT negative charge,
although further and more precise work is required to determine the specific mechanism
responsible for this effect.
Although increased PEDOT/fCNT deposition resulted in increased AA sensitivity and de-
creased DA:AA peak ratio, this method may still be utilized to reduce AA interference.
This may be primarily inferred through the peak separation analysis. As long as sufficient
peak separation is maintained, relative sensitivities and peak amplitudes are irrelevant, as
sufficient separation enables independent quantification. In this sense, PEDOT/fCNT has
been greatly successful in converting electrodes previously incompatible with simultaneous
DA and AA quantification into electrodes capable of resolving both signals with reasonable
separation. However, through investigation into in vivo application, it has been discovered
that coating density must be limited to 100 mC/cm2 to avoid issues of extensive non-faradiac
signals. In the case of 150 and 200 mC/cm2 coatings, non-faradaic current decays possessed
time constants too large for faradaic currents to be effectively sampled using the devel-
oped SWV waveform. Therefore, at present in vivo application is limited to 100 mC/cm2
PEDOT/fCNT coated electrodes. Even so, significant peak separation is observed at that
coating condition, and applications in vivo in the dorsal striatum of anesthetized rats have
succesfully resolved basal DA signals, even without the necessary addition of waveform al-
terations.
Nonetheless, it is clear that 0 V static potential application provides multiple benefits for
in vitro SWV at PEDOT/fCNT coated CFEs. For further mitigated AA interference, 0 V
may be held for 15s between scans, maintaining a sampling resolution higher than that of
FSCAV. This also serves the additional benefit of significantly increasing DA signal ampli-
31

tude. Although this effect does not translate to enhanced sensitivity, greater amplitudes
provide easier and more reliable quantification via elevated signal-to-noise ratio. Increased
DA amplitude is thought to be the primary result of electrostatic interaction with carboxy-
late groups on the fCNTs. At physiological pH, DA possesses a positive charge. Therefore,
by holding at 0 V, all non-faradaic charging dynamics are removed from the system and
ambient DA is able to interact passively with the negatively charged fCNTs without an ex-
ternal voltage drive. This would have the effect of pre-adsorbing DA to the surface due to
electrostatic attraction, such that during the scan the local [DA] is elevated relative to the
bulk solution.
Regarding the inability of agarose gels to replicate in vivo conditions, it is hypothesized that
this result is primarily due to differences in scale between the porosity of the gel and the size
of the electrode. Although the gel may exhibit bulk poroelastic and conductive properties
similar to that of neural tissue, it may be possible that at the scale of the CFE surface, the
environment is indistinguishable from that of a simple aCSF solution due to relatively large
pore size. It may also be possible that the gels behave as aCSF solutions for currents below
a particular threshold, since the effects of conductance may only manifest in the case of bulk
currents traversing the entire medium. In the case of SWV, currents are largely confined to
the immediate region surrounding the electrode and thus the conductance effects of aCSF
reported previously may not be observed [51, 52].
The lack of protein adsorption effects on impedance or SWV were initially surprising but may
hint at a valuable protection mechanism exhibited by PEDOT/fCNT coatings. Specifically,
the PEDOT/fCNT coating exhibits a highly porous morphology (Fig. 5b). This morphol-
ogy may serve as a size exclusion layer for the electrode surface, allowing small molecules,
such as ions, to pass unperturbed to the surface while proteins remain aggregated at the
surface. This assumes that the BSA adsorption layer does not form tight connections be-
tween adjacent proteins. This suggestion is somewhat supported by the insignificant effects
on impedance and SWV magnitude. However, it is suspected that the accumulation of a
more complex biofilm in vivo over long-term in vivo recordings would eventually impact DA
sensitivity. One simple mechanism by which this may occur is that biofilm accumulation
could reduce the available PEDOT/fCNT surface for direct DA interaction, thus lowering
32

redox activity throughout a scan and in turn reducing sensitivity.
Preliminary data from the agarose gel DA sensitivity experiments indicate that the presup-
posed link between sensitivity and impedance may not be founded. There appears to be a
slight increase in sensitivity as agarose concentration is increased, but additional replicates
are necessary to confirm a relationship.
33

8.0 Conclusion
This work has demonstrated that PEDOT/fCNT may be used to facilitate DA selec-
tivity over AA, and that further selectivity and increases in DA detection amplitude may
be achieved through application of a 0 V static potential duration prior to SWV scans.
Through considering these two alterations to the originally conceived neurochemical sensing
system, in vivo application may be realized for successful resolution of basal DA signalling
at high temporal resolution. However, this technique still suffers, as do all electrochemical
sensing techniques, from discrepancies in in vitro calibration conditions and the in vivo en-
vironment. Initial experiments on the design of a suitable in vitro calibration platform have
ruled out two previously promising approaches and suggest possible robustness of SWV to
protein adsorption. Therefore, alternative methods must be explored to account for these
discrepancies. Nonetheless, this work represents a major step forward in realizing a powerful
basal DA sensing tool for the neurosciences and bioengineering.
34

9.0 Future Directions
In future work, it will be necessary to determine the generalizability of AA interference
mitigating techniques to metallic site MEAs. Additionally, chronic in vivo recordings may
be performed to assess long-term recording quality and interference characteristics over time.
In hopes of achieving a more reliable in vitro calibration environment, alternative aqueous
gels may be explored which possess smaller pore size compared to aCSF, and different pro-
teins may be tested for modelling in vivo protein adsorption. Additionally, electrical circuits
attached between the working electrode and potentiostat may be explored as a precise mech-
anism by which in vitro impedance may be controlled and manipulated [54]. In addition to
assessing impedance and baseline SWV magnitude, DA sensitivity may also be assessed for
each of the conditions tested to determine if the supposed links between impedance, SWV
signal amplitude, and sensitivity are justified.
35

10.0 Appendix
10.1 Circuit Modelling for In Vitro Calibrations
An alternative approach for simulating in vivo impedance during in vitro calibrations was
demonstrated by Meunier et al for fast-scan cyclic voltammetry at CFEs [54]. The method
they developed comprises connecting an electrical circuit in series between the potentiostat
and the working electrode in order to alter the total impedance of the in vitro calibration
setup (Fig. 16).
Preliminary experimentation demonstrated that connecting resistors to the working electrode
during SWV scans in aCSF resulted in increased baseline SWV signal, although adapting
this method for electrodes following in vivo recordings revealed that resistors were insufficient
to recapture the in vivo baseline.
Adaptation of this general method was employed for Ag electrode microelectrode sites used
for in vivo cortical current-controlled stimulation in Sprague Dawley rats. A Randall’s
circuit was constructed and attached in series between the potentiostat and electrode in
vitro in aCSF following in vivo stimulation to accurately replicate the in vivo stimulation
voltage waveform Preliminary success of this method for correcting the in vitro calibration
environment suggests that more complex circuit configurations than single resistors, such as
the Randall’s circuit employed here, could result in the replication of in vivo SWV baseline
profiles during in vitro calibrations.
36

(a) (b) (c)
Figure 15: (a) Equivalent circuit model of an in vivo electrochemical detection platform
adapted from Meunier et al., depicting the working electrode and reference electrodes as
Randall’s circuits, and the tissue impedance as a generalized impedance element Z. (b) Z is
parsed into Z ′ and Rs, where Z ′+Rs = Z and Rs represents the solution resistance of aCSF.
(c) Impedance elements in series add linearly, so moving Z ′ between the potentiostat and
working electrode does not alter the total circuit impedance. This allows the experimentalist
to connect a physical electrical circuit with impedance Z ′ to the in vitro calibration setup
in order to equate the total impedance with that of the in vivo environment.
37

(a) (b)
Figure 16: (a) Randall’s circuit employed for in vitro correction (parameter values R1 =
122kΩ, R2 = 100kΩ, C = 300pF ). (b) In vivo, in vitro, and in vitro corrected (with Randall’s
circuit attached) voltage responses to the stimulation waveform. The corrected response
corresponds closely with the response obtained in vivo.
38

11.0 References
[1] P. Greengard J.A. Girault. “The Neurobiology of Dopamine Signaling”. In: Archives
of Neurology 61.5 (2004), pp. 641–644. doi: 10.1001/archneur.61.5.641.
[2] D.J. Brooks. “Functional Imaging Studies on Dopamine and Motor Control”. In:
Journal of Neural Transmission 108.11 (2001), pp. 1283–1293. doi: 10.1007/s0070-
20100005.
[3] X. Liu and A.E. Herbison. “Dopamine Regulation of Gonadotropin-Releasing Hor-
mone Neuron Excitability in Male and Female Mice”. In: Endocrinology 154.1 (2013),
pp. 340–350. doi: 10.1210/en.2012-1602.
[4] N.B. Urban et al. “Imaging human reward processing with positron emission tomog-
raphy and functional magnetic resonance imaging”. In: Psychopharmacology 221.1
(2012), pp. 66–77. doi: 10.1007/s00213-011-2543-6.
[5] D. Calu D. Caprioli and Y. Shaham. “Loss of Phasic Signaling: a New Addiction
Marker?” In: Nature Neuroscience 17.5 (2014), pp. 644–646. doi: PMID:24883455.
[6] J.J. Clark M. Wanat I. Willuhn and P.E. Phillips. “Phasic dopamine release in ap-
petitive behaviors and drug addiction”. In: Current Drug Abuse Review 2.2 (2010),
pp. 195–213. doi: PMID:19630749.
[7] W. Schultz. “Predictive Reward Signal of Dopamine Neurons”. In: Journal of Neu-
rophysiology 80.1 (1998), pp. 1–27. doi: 10.1152/jn.1998.80.1.1.
[8] W. Schultz. “Multiple Dopamine Functions at Different Time Courses”. In: Annual
Review of Neuroscience 30 (2007), pp. 259–288. doi: 10.1146/annurev.neuro.28.
061604.135722.
[9] P. Belujon and A.A. Grace. “Dopamine System Dysregulation in Major Depressive
Disorders”. In: The International Journal of Neuropsychopharmacology 20.12 (2017),
pp. 1036–1046. doi: 10.1093/ijnp/pyx056.
[10] E.H. Cook et al. “Association of attention-deficit disorder and the dopamine trans-
porter gene”. In: American Journal of Human Genetics 56.4 (1995), pp. 993–998.
doi: PMID:7717410.
39

[11] Y. Agrid P. Damier E.C. Hirsch and A.M. Graybiel. “The substantia nigra of the
human brain. II. Patterns of loss of dopamine-containing neurons in Parkinson’s
disease”. In: Brain 112.8 (1999), pp. 1437–1448. doi: PMID:10430830.
[12] A.A. Grace. “Dysregulation of the dopamine system in the pathophysiology of schizo-
phrenia and depression”. In: Nature Reviews 17.8 (2016), pp. 524–532. doi: 10.1038/
nrn.2016.57.
[13] J.M.R Delgado et al. “Dialytrode for long term intracerebral perfusion in awake mon-
keys”. In: Arch Int Pharmacodyn Ther 198.1 (1972), pp. 9–21. doi: PMID:4626478.
[14] U. Ungerstedt and C. Pycock. “Functional correlates of dopamine neurotransmis-
sion”. In: Bull Schweitz Akad Med Wiss 30.1-3 (1974), pp. 44–55. doi: PMID:4371656.
[15] V. Chefer et al. “Overview of brain microdialysis”. In: Current Protocols in Neuro-
science (2009). doi: 10.1002/0471142301.ns0701s47.
[16] H. Gu et al. “In Vivo Monitoring of Dopamine by Microdialysis with 1 min Tempo-
ral Resolution Using Online Capillary Liquid Chromatography with Electrochemical
Detection”. In: Analytical Chemistry 87.12 (2015), pp. 6088–6094. doi: 10.1021/
acs.analchem.5b00633.
[17] G.W. Cheng et al. “On-line Microdialysis Coupled with Liquid Chromatography for
Biomedical Analysis”. In: Journal of Chromatographic Science 47.8 (2009), pp. 624–
630. doi: PMID:19772738.
[18] J. Kehr. “Determination of glutamate and aspartate in microdialysis samples by
reversed-phase column liquid chromatography with fluorescence and electrochemical
detection”. In: Journal of Chromatography B Biomedical Science Applications 708.1-2
(1998), pp. 27–38. doi: PMID:9653943.
[19] A.V. Eeckhaut et al. “The absolute quantification of endogenous levels of brain neu-
ropeptides in vivo using LC-MS/MS”. In: Bioanalysis 3.11 (2011), pp. 1271–1285.
doi: 10.4155/bio.11.91.
[20] O.S. Mabrouk et al. “Microdialysis and mass spectrometric monitoring of dopamine
and enkephalins in the globus pallidus reveal reciprocal interactions that regulate
movement”. In: Journal of Nuerochemistry 118.1 (2011), pp. 24–33. doi: 10.1111/
j.1471-4159.2011.07293.x.
40

[21] R.A. Saylor et al. “A review of microdialysis coupled to microchip electrophoresis for
monitoring biological events”. In: Journal of Chromatography A 1382 (2015), pp. 48–
64. doi: 10.1016/j.chroma.2014.12.086.
[22] K.T. Ngo et al. “Monitoring Dopamine Responses to Potassium Ion and Nomifensine
by in vivo Microdialysis with Online Liquid Chromatography at One-Minute Reso-
lution”. In: ACS Chemical Neuroscience 8.2 (2017), pp. 329–388. doi: 10.1021/
acschemneuro.6b00383.
[23] K.M. Nestbitt et al. “Pharmacological mitigation of tissue damage during brain mi-
crodialysis”. In: Analytical Chemistry 85.17 (2013), pp. 8173–8179. doi: 10.1021/
ac401201x.
[24] T.K.D.Y Kozai et al. “Brain tissue responses to neural implants impact signal sen-
sitivity and intervention strategies”. In: ACS Chemical Neuroscience 6.1 (2014),
pp. 48–67. doi: doi:10.1021/cn500256e.
[25] V. Bassareo et al. “Monitoring dopamine transmission in the rat nucleus accumbens
shell and core during acquisition of nose-poking for sucrose”. In: Behavioral Brain
Research 287 (2015), pp. 200–206. doi: 10.1016/j.bbr.2015.03.056.
[26] C.W. Atcherly et al. “Fast-Scan Controlled-Adsorption Voltammetry for the Quan-
tification of Absolute Concentrations and Adsorption Dynamics”. In: Langmuir 29.48
(2013), pp. 14885–14892. doi: 10.1021/la402686s.
[27] C.E. John and S.R. Jones. “Fast Scan Cyclic Voltammetry of Dopamine and Sero-
tonin in Mouse Brain Slices”. In: Frontiers in Neuroengineering (2007). doi: PMID:
21204393.
[28] L.J. May R.M Wightman and A.C. Michael. “Detection of Dopamine Dynamics
in the Brain”. In: Analytical Chemistry 60.13 (1988), 769A–779A. doi: 10.1021/
ac00164a001.
[29] Y. Oh et al. “Monitoring In Vivo Changes in Tonic Extracellular Dopamine Level by
Charge-Balancing Multiple Waveform Fast-Scan Cyclic Voltammetry”. In: Analytical
Chemistry 88.22 (2016), pp. 10962–10970. doi: 10.1021/acs.analchem.6b02605.
[30] C.W. Atcherly et al. “The coaction of tonic and phasic dopamine dynamics.” In:
Chemical Communications 51.12 (2015), pp. 2235–2238. doi: 10.1039/c4cc06165a.
41

[31] G.T. Kovacs et al. “Silicon-substrate microelectrode arrays for parallel recording of
neural activity in peripheral and cranial nerves”. In: IEEE Translational Biomedical
Engineering 41.6 (1994), pp. 567–577.
[32] M.K. Zachek. “Microfabricated FSCV-compatible microelectrode array for real-time
monitoring of heterogeneous dopamine release”. In: Analyst 135.7 (2010), pp. 1556–
1563. doi: 10.1039/c0an00114g.
[33] M.K. Zachek. “Electrochemical dopamine detection: Comparing gold and carbon
fiber microelectrodes using backgrounds substracted fast scan cyclic voltammetry”.
In: Journal of Electroanalytical Chemistry 613.1-2 (2008), pp. 113–120. doi: 10.
1016/j.jelechem.2007.11.007.
[34] J.G. Osteryoung and R.A. Osteryoung. “Square wave voltammetry”. In: Analytical
Chemistry 57.1 (1985), pp. 101–110. doi: 10.1021/ac00279a004.
[35] Y. Oh et al. “Tracking tonic dopamine levels in vivo using multiple cyclic square
wave voltammetry”. In: Biosensors and Bioelectronics 121 (2018), pp. 174–182. doi:
10.1016/j.bios.2018.08.034.
[36] A.J. Bard and L.R. Faulkner. Electrochemical Methods. Fundamentals and Applica-
tions. 2nd ed. Wiley, 2007.
[37] N.A. Alba et al. “In Vivo Electrochemical Analysis of a PEDOT/MWCNT Neu-
ral Electrode Coating”. In: Biosensors 5.4 (2015), pp. 618–646. doi: 10 . 3390 /
bios5040618.
[38] T.D. Kozai et al. “Chronic in Vivo Evaluation of PEDOT/CNT for Stable Neural
Recordings”. In: IEEE Translational Biomedical Engineering 63.1 (2016), pp. 111–
119. doi: 10.1109/TBME.2015.2445713.
[39] I. Bokkon and I. Antal. “Schizophrenia: Redox Regulation and Volume Neurotrans-
mission”. In: Current Neuropharmacology 9.2 (2011), pp. 289–300. doi: 10.2174/
157015911795596504.
[40] J.A. Johnson et al. “Measurement of Basal Neurotransmitter Levels Using Convolution-
Based Non-fara- daic Current Removal”. In: Analytical Chemistry 90.12 (2018),
pp. 7181–7189. doi: 10.1021/acs.analchem.7b04682.
42

[41] H. Borsook and G. Keightley. “Oxidation-Reduction Potential of Ascorbic-Acid (Vi-
tamin C)”. In: Proc Natl Acad Sci USA 19.9 (1933), pp. 875–878. doi: PMCID :
PMC1086204.
[42] US National Library of Medicine. Toxicology Data Network. 2010. url: https://
toxnet.nlm.nih.gov/cgi-bin/sis/search2/r?dbs+hsdb:@term+@rn+@rel+50-
81-7 (visited on 04/05/2019).
[43] S.E. Moulton et al. “Investigation of protein adsorption and electrochemical behav-
ior at a gold electrode”. In: Journal of Colloid and Interface Science 261.2 (2003),
pp. 312–319. doi: 10.1016/S0021-9797(03)00073-0.
[44] A.J. Downard and A.D. Roddick. “Protein adsorption at glassy carbon electrodes:
The effect of covalently bound surface groups”. In: Electroanalysis 7.4 (1995), pp. 376–
378. doi: 10.1002/elan.1140070414.
[45] S. Sommakia et al. “Effects of adsorbed proteins, an antifouling agent and long-
duration DC voltage pulses on the impedance of silicon-based neural microelec-
trodes”. In: Conf Proc IEEE Eng Med Biol Soc (2009), pp. 7139–42. doi: 10.1109/
IEMBS.2009.5332456.
[46] A. Campbell and C. Wu. “Chronically implanted intracranial electrodes: tissue re-
action and electrical changes”. In: Micromachines (Basel) 9.9 (2018), p. 430. doi:
10.3390/mi9090430.
[47] D.R. Jackson et al. “Electrochemical studies of the adsorption behavior of serum
proteins on titanium”. In: Langmuir 16.12 (2000), pp. 5449–5457. doi: 10.1021/
la991497x.
[48] V. Hlady and J. Bujis. “Protein adsorption on solid surfaces”. In: Curr Opin Biotech-
nol 7.1 (2012), pp. 72–77. doi: PMCID:PMC3262180.
[49] J. Selvakumaran. “Protein adsorption on materials for recording sites on implantable
microelectrodes”. In: J Mater Sci Mater Med. 19.1 (2007), pp. 143–51. doi: 10.1007/
s10856-007-3110-x.
[50] O. Invanchenko et al. “Experimental techniques for studying poroelasticity in brain
phantom gels under high flow microinfusion”. In: J. Biomech Eng 132.5 (2010). doi:
10.1115/1.4001164.
43

[51] Z.J. Chen et al. “A realistic brain tissue phantom for intraparenchymal infusion
studies”. In: Journal of Neurosurgery 101.2 (2004), pp. 314–322. doi: 10.3171/jns.
2004.101.2.0314.
[52] M.A. Kandadai et al. “Comparison of electrical conductivities of various brain phan-
tom gels: Developing a ’Brain Gel Model’”. In: Mater Sci Eng C Mater Biol Appl
32.8 (2013), pp. 2664–2667. doi: 10.1016/j.msec.2012.07.024.
[53] I.M. Taylor et al. “Enhanced Dopamine Detection Sensitivity by PEDOT/Graphene
Oxide Coating on in vivo Carbon Fiber Electrodes”. In: Biosens Bioelectron 89.1
(2016), pp. 400–410. doi: 10.1016/j.bios.2016.05.084.
[54] C.J. Meunier et al. “The Background Signal as an In Situ Predictor of Dopamine Ox-
idation Potential: Improving Interpretation of Fast-Scan Cyclic Voltammetry Data”.
In: ACS Chemical Neuroscience 8.2 (2017). doi: 10.1021/acschemneuro.6b00325.
44