nocturnal ozone enhancement in the lower troposphere ... et al 2011... · nocturnal ozone...
TRANSCRIPT

lable at ScienceDirect
Atmospheric Environment 45 (2011) 6078e6084
Contents lists avai
Atmospheric Environment
journal homepage: www.elsevier .com/locate/atmosenv
Nocturnal ozone enhancement in the lower troposphere observed by lidarq
Shi Kuang a, M.J. Newchurch a,*, John Burris b, Lihua Wang a, Patrick I. Buckley a, Steve Johnson c,Kevin Knupp a, Guanyu Huang a, Dustin Phillips a, Wesley Cantrell a
aAtmospheric Science Department, University of Alabama in Huntsville, 320 Sparkman Dr., Huntsville, AL 35805, USAbNASA-Goddard Space Flight Center, Code 694, Greenbelt, MD 20771, USAcNASA-Marshall Space Flight Center, Office Code VP61, Huntsville, AL 35812, USA
a r t i c l e i n f o
Article history:Received 26 October 2010Received in revised form19 July 2011Accepted 20 July 2011
Keywords:Air qualityAtmospheric chemistryDIALHuntsvilleNocturnal boundary layerResidual layer
q This work was supported by NASA’s Science MisNational Environmental Satellite, Data, and Informati* Corresponding author. Tel.: þ1 256 961 7825; fax
E-mail address: [email protected] (M.J. Newchu
1352-2310/$ e see front matter Published by Elsevierdoi:10.1016/j.atmosenv.2011.07.038
a b s t r a c t
An ozone enhancement in the nocturnal residual layer was observed by the Huntsville ozone lidar fromthe late evening to midnight on 4 October 2008. The well-correlated ozone, aerosol, water vapor, andwind structures suggest a low-level jet is responsible for this ozone enhancement. HYSPLIT backwardtrajectories support this conclusion with southerly transport suggesting Birmingham, AL as the source.Correspondingly, the higher increasing rate of surface ozone observed in the morning of 5 October can beexplained by the entrainment into the mixed layer of higher ozone aloft on this day as compared with4 October. This case study demonstrates the importance of continuous high-resolution lidar profiling forcapturing short-duration ozone variations in the lower troposphere.
Published by Elsevier Ltd.
1. Introduction
Ozone variations within the planetary boundary layer (PBL) arecomplex and often rapid (Ancellet and Ravetta, 2005; Thompsonet al., 2007) because of multiple factors such as surface emissionand deposition, interaction with the free-troposphere (FT), photo-chemistry, and horizontal transport. Relative to thewell-characterizeddiurnal variations of the surface ozone (Zhang and Rao, 1999),aloft ozone is more complicated and is sometimes observed withmuch higher concentrations than seen in surface measurements(Berkowitz et al., 2004). During daytime, ozone within theconvective boundary layer (CBL) can be homogeneous due to solar-driven convective mixing; however, highly inhomogeneous struc-tures are often observed (Ancellet and Ravetta, 2005) and requirehigh-resolution measurement of ozone profiles to characterize.After the stable nocturnal boundary layer (NBL) starts to develop inthe evening, ozone generally has a positive gradient from thesurface toward the top of the NBL (Geyer and Stutz, 2004; Stutzet al., 2004) because of surface NOx titration and insufficient
sion Directorate and NOAA’son Service (NESDIS).: þ1 256 961 7755.rch).
Ltd.
downward mixing due to the nocturnal capping. Since the removalmechanism typically dominates near the surface during nighttime,a reasonable explanation for elevated ozone in the nocturnal PBL isthe regional or small-scale transport associated with mechanismssuch as the low-level wind jet (Banta et al., 1998; Corsmeier et al.,1997), topographic forcing (Zhu et al., 2006), or seaeland interac-tion (Sun et al., 1998). Among those mechanisms of particularinterest are low-level jets (LLJ) which have been extensively dis-cussed in conjunction with the Southern Oxidants Study (SOS)(Banta et al., 1998; Baumann et al., 2000; Meagher et al., 1998). Forthis case, the pollutant plume can form during the day, when themeteorological conditions are favorable to pollutant accumulation,and be transported downwind during the nighttime affecting thebackground levels on the second day.
Ozone is the most important primary pollutant for Huntsville.After the Environmental Protection Agency (EPA) lowered theground-level ozone standard from 0.08 ppm to 0.075 ppm inMarch 2008, Huntsville failed to meet the new air quality standardhaving a three-year average of the fourth-highest 8-h average of0.078 ppm (Natural Resources and Environmental ManagementDivision, 2009). Previous model studies demonstrate that airstagnation regime in the Southeast appears to have more influ-ence on the episode days than synoptic-scale transport (Hidy,2000). However, Huntsville is surrounded by several largercities: Birmingham, Memphis, Nashville, and Atlanta, which have

Fig. 1. Weather charts for 7:00 local time (12:00 UTC) 4 October, 2008 (source:National Climatic Data Center of NOAA, http://nomads.ncdc.noaa.gov/ncep/NCEP).(a) 500-hpa height contours. (b) 850-hpa height contours. (c) Surface weather map.
S. Kuang et al. / Atmospheric Environment 45 (2011) 6078e6084 6079
numerous industrial emission sources that can potentially affectHuntsville’s air quality. The impact of pollution transport onHuntsville has not been previously studied. The objective of thispaper is to report on an elevated nocturnal ozone event measuredover Huntsville and discuss its formation mechanism and impacton the surface ozone.
2. Instruments
2.1. Ozone DIAL
The tropospheric ozone Differential Absorption Lidar (DIAL),developed jointly by the University of Alabama in Huntsville andNASA/Goddard Space Flight Center, retrieves ozone profiles from0.5 tow8-km altitude at 10-min intervals with a vertical resolutionof better than 750 m. This instrument is described elsewhere(Kuang et al., 2010), so only a short description will be included inthis paper. The transmitter consists of two 20-Hz Nd: YAG-pumpeddye lasers generating w4 mJ pulse�1 at 285 and 291 nm. Thereceiving system has two telescopes, a 40-cm Newtonian telescope,which covers the altitudes from 3 to 8 km with a precision betterthan 20%, and a 10-cm Cassegrain telescope for altitudes between0.5 and 5 kmwith a precision better than 10%. The ozone retrievalsof the two altitude-channels join between 3.3 and 4.4 km, typically.Due to the lack of a third wavelength, an iterative aerosol correctionis applied to reduce the retrieval error arising from differentialaerosol backscatter in the lower troposphere. This procedure iter-atively substitutes the ozone profile from the DIAL algorithm backto the off-line (291-nm) signal to calculate the aerosol-extinctionprofile by assuming an appropriate lidar ratio. Then, the correctionterms due to differential aerosol backscatter and extinction can bederived using Browell’s approximation (Browell et al., 1985) byassuming an Ångström exponent.
2.2. Mobile Integrated Profiling System
A Mobile Integrated Profiling System (MIPS), which consists ofa 915-MHz wind profiler (Radian LAP-3000), a 12-channel micro-wave profiling radiometer (MPR; Radiometrics TP/WVP-3000),a lidar ceilometer (Vaisala CT-25k), and various other instrumen-tation (Karan and Knupp, 2006; Knupp et al., 2006) collected thelocal meteorological data used in this paper. The coaxial ceilometermeasures the atmospheric backscatter from the ground to 7.6 kmwith a 30-m vertical range resolution and 15-s temporal resolutionand covers the bottom 500 m of the PBL, a region that is notcurrently covered by the ozoneDIAL. The 915-MHz profiler provideshorizontal winds up to a 4-km altitude with a 1-m s�1 accuracy,105-m vertical range resolution, and 60-s temporal resolution. TheMPRmeasures atmosphericmicrowave emissions at twelve discretefrequency bands to derive thewater vapor densitywith an error lessthanw1.1 g m�3 and temperature with an error of less thanw2.0 Kbelow 7 km (Güldner and Spänkuch, 2001). The percentage uncer-tainty of the derived relative humidity (RH) ismostly determined bythe actual water vapor and is also related to the uncertainties ofwater vapor and temperature in a complicated manner. An esti-mated uncertainty for a derived 50% RHwhen ambient temperatureequal to 10 �C (saturated water vapor density is 9.4 g m�3) is about25%. The vertical resolution of the MPR measurement for eitherwater vapor or temperature retrieval decreases from w50 m atsurface to w1 km between 700 m and 4 km.
2.3. Ozonesondes
UAHuntsville has been routinely launching ozonesondes (EN-SCImodel 2Z with unbuffered 2% cathode solution) weekly since 1999
(Newchurch et al., 2003). The ozonesondes measure ozone profileswith aw100-mvertical resolution from the surface to 35-km altitudeat an accuracy better than 10% (Komhyr et al., 1995; Oltmans et al.,1996) and a co-located radiosonde (Vaisala RS-80-15) measurestemperature, pressure, and RH.

Fig. 2. The UAHuntsville MIPS measurements on 4e5 October 2008. (a) wind structure measured by the 915-MHz wind profiler; (b) RH retrieval by MPR (RH data after 18:59 is notavailable due to instrument issue); (c) the ceilometer backscatter.
S. Kuang et al. / Atmospheric Environment 45 (2011) 6078e60846080
3. Meteorological conditions
It is well known that meteorological conditions play animportant role in the formation, transport, and deposition ofpollution plumes (Solomon et al., 2000). The synoptic condition
responsible for the event described here was a high-pressuresystem moving slowly eastward that stalled over the UnitedStates during this period. The 500 and 850-hpa height-contourcharts in Fig. 1 illustrates a ridge tilted westward with heightand protruding over the central United States on 4 October 2008.
S. Kuang et al. / Atmospheric Environment 45 (2011) 6078e6084 6081
The upper atmosphere over Alabama displays a weak westerly tosouthwesterly wind flow. Associated with the upper-air systemwas a surface high centered over Lake Michigan and elongated tothe southeastern United States. The weak pressure gradients in thesoutheastern U.S. resulted in light surface winds (<1.5 m s�1) overa broad area. In Fig. 2(a), the wind profiler measurement revealsthe details of the wind variations up to 4 km in Huntsville on4 October. The winds in the boundary layer during the daytimewere weak, generally less than 2 m s�1 with variable directionfrom westerly to southerly. However, a southerly nocturnal low-level jet (LLJ) developed at 20:00 local time (LT) with the jetnose starting fromw1.5 km and extending downward tow0.5 km.The jet turned clockwise with height and reached a maximumspeed of w10 m s�1 between 0.5 and 1 km until it diminishedwhen the mixing layer of the second day formed. Such northerly orsoutherly jets, especially during the nighttime, have been observedand studied extensively in the central United States (Banta et al.,2002). Two major mechanisms contributing to the formations ofLLJ are synoptic-scale forcing, associated with the mesoscalecirculation features, and boundary layer forcing when the airflownear the top of the nocturnal boundary decouples from the surfacefriction especially under a stable atmosphere condition (Walterset al., 2008). From 20:00 to 06:00 in Fig. 2(a), the distinct clock-wise rotation in the direction of the jets (turning from southerly tosouthwesterly with time) and the contrary turning direction of thewinds in the boundary layer and FT (winds between 2 and 3 kmturning from northwesterly to southwesterly with time) isevidence that the boundary layer forcing is primarily responsiblefor this LLJ (Whiteman et al., 1997).
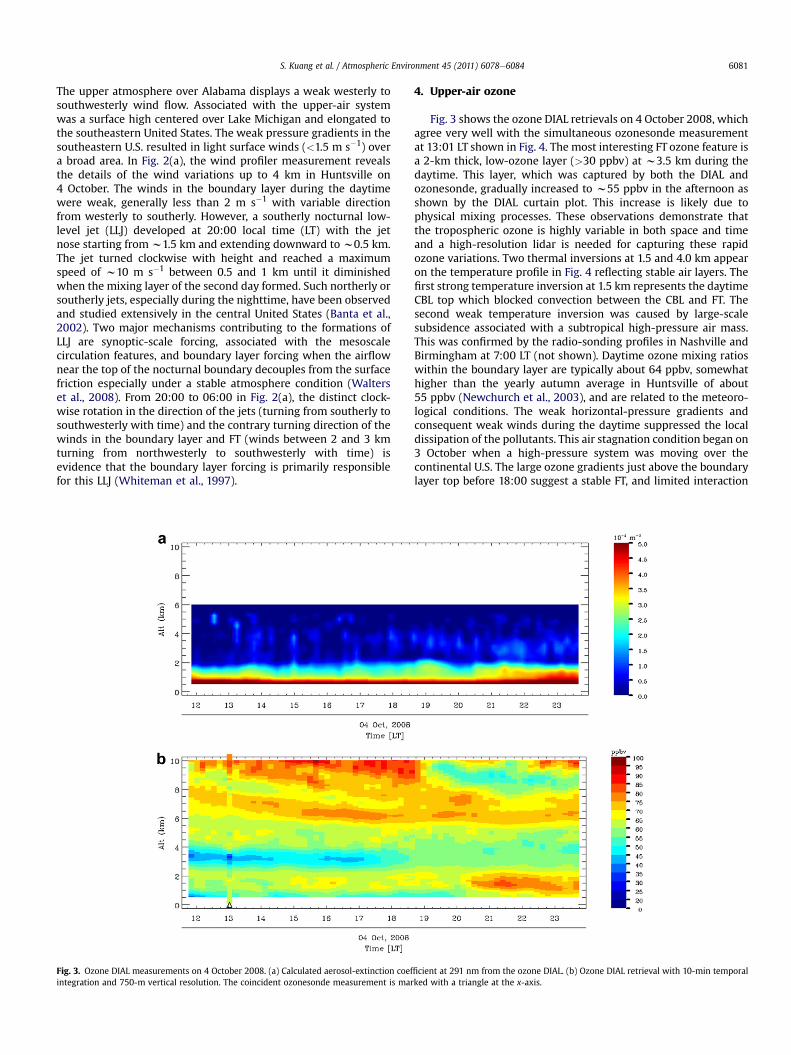
Fig. 3. Ozone DIAL measurements on 4 October 2008. (a) Calculated aerosol-extinction coefintegration and 750-m vertical resolution. The coincident ozonesonde measurement is mar
4. Upper-air ozone
Fig. 3 shows the ozone DIAL retrievals on 4 October 2008, whichagree very well with the simultaneous ozonesonde measurementat 13:01 LT shown in Fig. 4. The most interesting FT ozone feature isa 2-km thick, low-ozone layer (>30 ppbv) at w3.5 km during thedaytime. This layer, which was captured by both the DIAL andozonesonde, gradually increased to w55 ppbv in the afternoon asshown by the DIAL curtain plot. This increase is likely due tophysical mixing processes. These observations demonstrate thatthe tropospheric ozone is highly variable in both space and timeand a high-resolution lidar is needed for capturing these rapidozone variations. Two thermal inversions at 1.5 and 4.0 km appearon the temperature profile in Fig. 4 reflecting stable air layers. Thefirst strong temperature inversion at 1.5 km represents the daytimeCBL top which blocked convection between the CBL and FT. Thesecond weak temperature inversion was caused by large-scalesubsidence associated with a subtropical high-pressure air mass.This was confirmed by the radio-sonding profiles in Nashville andBirmingham at 7:00 LT (not shown). Daytime ozone mixing ratioswithin the boundary layer are typically about 64 ppbv, somewhathigher than the yearly autumn average in Huntsville of about55 ppbv (Newchurch et al., 2003), and are related to the meteoro-logical conditions. The weak horizontal-pressure gradients andconsequent weak winds during the daytime suppressed the localdissipation of the pollutants. This air stagnation condition began on3 October when a high-pressure system was moving over thecontinental U.S. The large ozone gradients just above the boundarylayer top before 18:00 suggest a stable FT, and limited interaction
ficient at 291 nm from the ozone DIAL. (b) Ozone DIAL retrieval with 10-min temporalked with a triangle at the x-axis.

Fig. 4. Ozone, temperature (T), and RH profiles measured by ozonesonde at 13:01 LT 4October at the same location as the DIAL and MIPS.
Fig. 5. 72-h HYSPLIT-model backward trajectories in Huntsville with a 6-h timeinterval ending at 21:00 LT Oct. 4, 2008 for the layers at 500, 1000, and 2000 m a.s.l.
S. Kuang et al. / Atmospheric Environment 45 (2011) 6078e60846082
between the boundary layer and FT although some vertical mixingwithin the boundary layer during the afternoon exists. A similarstructure and mostly positive correlations between ozone and MPRRH retrievals (Fig. 2(b)) suggest tropospheric sources for thoseozone laminae.
The aerosol retrieval at 291 nm (Fig. 3(a)) and ceilometer data(Fig. 2(c)) both indicate turbid air conditions below 2 km during thedaytime. A distinct ozone enhancement occurred in the residuallayer after sunset accompanied by a similar enhancement in theaerosol. The maximum nighttime ozone mixing ratio is 95 ppbv foraltitudes below 2 km with strong aerosol activity in the sametimeeheight region. This positive correlation between ozone andaerosol in the troposphere, which has also been observed in othermeasurements (Browell et al., 2003), suggests the same source isresponsible for the enhanced ozone and aerosols. The temporalvariation of the ozone and aerosol enhancement agrees well withthe wind profiler measurement in Fig. 2, which clearly shows thepollutants were carried by the southerly LLJ.
Fig. 5 shows the 72-h NOAA’s HYSPLIT-model backward trajec-tories (Draxler and Rolph, 2003) in Huntsville ending at 21:00 LT5 October 2008 for three layers at 500, 1000, and 2000 m a.s.l. Wehave performed a time sensitivity test and a horizontal sensitivitytest to increase the reliability of this analysis. These trajectories arenot time sensitive within 4 h before this event and most of the1-degree separated locations around Huntsville display similartrajectory characteristics. Therefore, the trajectory result is believedto be robust to some degree although we understand that thelocations of the trajectory calculation still can be rather uncertainespecially in the PBL due to complex turbulent mixing processes(Stohl, 1998). The recirculation backward trajectory pattern at
1000 m suggests two possible sources which may have substantialanthropogenic emission: the Birmingham metropolitan area 14 hpreviously and Memphis 60 h prior. Considering a daily-surfacemaximum ozone of 38 ppbv measured in Memphis (station ID:47-157-0021, surface data come from EPA’s Air Quality System(AQS)) on Oct. 2 and a 76-ppbv daily maximum measured at theclosest Birmingham station (ID: 01-073-5003) to Huntsville on Oct.4, which is also on the path of the backward trajectory, it appearsthat Birmingham is more likely responsible for this ozoneenhancement within the residual layer. The emissions of photo-chemical precursors from upwind locations can impact the down-wind region during a period of light winds (Baumann et al., 2000;Trainer et al., 1995). The nighttime acceleration flow above thestable NBL can carry the pollution plume away from the daytimebuildup region and redistribute it over the downwind region (Bantaet al.,1998;McNider et al.,1998). However, the LLJ is not indicated onthe Birmingham 0Z 5 October radiosonde data (not shown), so itmight play an important role only in the Huntsville area. Also, thecalculated wind speed of w2.8 m s�1 from the estimated transportdistance (w20km) at the 1000-maltitude between00and02UTC inFig. 5 is slower than that of the LLJ described foregoing and possiblysuggests a discrepancy between the HYSPLIT database and localmeasurements. Despite the fact that the ozoneDIAL cannotuniquelyidentify the pollution source even with the help of local meteoro-logical observations, it does identify features that can be exploredwith other tools such as HYSPLIT or photochemical models.
5. Discussion on the surface ozone
Because stagnant-air conditions are favorable to pollutantaccumulation, moderate ozone-polluted air quality was observed

Fig. 6. Huntsville hourly surface-ozone variations and the CBL height derived from the UAHuntsville 915 MHz profiler measurement.
S. Kuang et al. / Atmospheric Environment 45 (2011) 6078e6084 6083
by EPA surface stations over a wide area in the southeast beginning3 October and extending into the central eastern part of the U.S.by 6 October. Fig. 6 shows the hourly surface-ozone mixingratio measured at Huntsville airport road station and the CBLheight derived from the wind profiler (White, 1993) between 1 and6 October, 2008. The surface-ozone maxima during the afternoongradually increased from 45 ppbv on 1 Octobere70 ppbv on3 October due to the moving high-pressure system. The surfaceozone on the afternoon of 4 October is consistent with the lidar andozonesonde observation in the CBL under clear sky conditions. Theevening surface ozone on 4 October is only slightly higher than theprevious days. However, the increasing rate of surface ozonebetween 6:00 and 9:00 LT October 5, 20.3 ppbv h�1, is 49% higherthan that of 4 October, 13.7 ppbv h�1, with a similar CBL developingprocess. This suggests the aloft ozone in the morning on 5 Octoberis higher than that of 4 October and has already affected the surfacethrough the downward mixing process. However, on October 5, thesurface ozone maximizes at 10:00 instead of in the afternoon asusual and slightly decreases from 10:00 to 04:00 possibly becauseof the partly cloudy conditions that cause insufficient mixing andweak photochemical production. Compared with 5 October the10-ppbv higher daily-maximum surface ozone observed on 6 Octobermight be due to more complete mixing and the active photo-chemistry associated with clear sky conditions.
6. Conclusion
The PBL ozone was measured at w64 ppbv by the Huntsvilleozone lidar during daylight hours on 4 October 2008, which wasabout 20% higher than the seasonal average due to a high-pressuresystem above the southeast U.S. The PBL ozone was furtherenhanced to w95 ppbv beginning from late evening to midnight;this increase was associated with a southerly LLJ observed by theco-located wind profiler. The highly-correlated variations andvertical structure of the ozone, water vapor, and aerosols imply thesame tropospheric source for the pollution plume, which was most
likely the Birmingham area, as suggested by the HYSPLIT backwardtrajectory calculation. The high-pressure controlling meteorolog-ical conditions explains the observed stable atmosphere andresulted in distinct ozone laminae from the PBL to the FT, brought inby the air flows from different directions.
Air stagnation led to high daily-maximum surface ozone widelyobserved throughout the southeast between 3 and 6 October 2008.The higher rate of increase of surface ozone in Huntsville in theearlymorning of Oct. 5 could be explained by the higher aloft ozonecaused by the transport in the night of Oct. 4. However, theobserved daily-maximum surface ozone on Oct. 5 was not higherthan the previous day possibly due to the insufficient mixing andweak photochemical production under cloudy sky conditionsrelative to clear sky conditions. Although ozone in the nocturnalresidual layer largely explains the ozone variability in the secondday afternoon CBL (Morris et al., 2010; Neu et al., 1994), themaximum values were not always observed at the surface andcould occur aloft within the boundary layer depending on bothphotochemical and physical processes. These observations rein-force the need for ground based high-resolution ozone profiling ofthe lower troposphere.
Acknowledgments
The authors would like to thank Tom McGee, Stuart McDermid,and Thierry Leblanc for extensive discussions and Jack Kaye, P.K.Bhartia, and Rich McPeters for long-standing support. The authorsalso thank Debra Hopson of Huntsville Department of NaturalResources and Environmental Management for providing theHuntsville surface ozone data.
References
Ancellet, G., Ravetta, F., 2005. Analysis and validation of ozone variability observedby lidar during the ESCOMPTE-2001 campaign. Atmospheric Research 74,435e459.

S. Kuang et al. / Atmospheric Environment 45 (2011) 6078e60846084
Banta, R.M., Senff, C.J., White, A.B., Trainer, M., McNider, R.T., Valente, R.J., Mayor, S.D.,Alvarez, R.J., Hardesty, R.M., Parrish, D., Fehsenfeld, F.C., 1998. Daytime buildupand nighttime transport of urban ozone in the boundary layer during a stagna-tion episode. Journal of Geophysical Research 103, 22519e522544.
Banta, R.M., Newsom, R.K., Lundquist, J.K., Pichugina, Y.L., Coulter, R.L., Mahrt, L.,2002. Nocturnal low-level jet characteristics over Kansas during CASES-99.Boundary-Layer Meteorology 105, 221e252.
Baumann, K., Williams, E.J., Angevine, W.M., Roberts, J.M., Norton, R.B., Frost, G.J.,Fehsenfeld, F.C., Springston, S.R., Bertman, S.B., Hartsell, B., 2000. Ozoneproduction and transport near Nashville, Tennessee: results from the 1994study at New Hendersonville. Journal of Geophysical Research 105, 9137e9153.
Berkowitz, C.M., Jobson, T., Jiang, G., Spicer, C.W., Doskey, P.V., 2004. Chemical andmeteorological characteristics associated with rapid increases of O3 in Houston,Texas. Journal of Geophysical Research 109, D10307.
Browell, E.V., Ismail, S., Shipley, S.T., 1985. Ultraviolet DIAL measurements of O3profiles in regions of spatially inhomogeneous aerosols. Applied Optics 24,2827e2836.
Browell, E.V., Hair, J.W., Butler, C.F., Grant, W.B., DeYoung, R.J., Fenn, M.A.,Brackett, V.G., Clayton, M.B., Brasseur, L.A., Harper, D.B., Ridley, B.A.,Klonecki, A.A., Hess, P.G., Emmons, L.K., Tie, X., Atlas, E.L., Cantrell, C.A.,Wimmers, A.J., Blake, D.R., Coffey, M.T., Hannigan, J.W., Dibb, J.E., Talbot, R.W.,Flocke, F., Weinheimer, A.J., Fried, A., Wert, B., Snow, J.A., Lefer, B.L., 2003. Ozone,aerosol, potential vorticity, and trace gas trends observed at high-altitudes overNorth America from February to May 2000. Journal of Geophysical Research108, 8369.
Corsmeier, U., Kalthoff, N., Kolle, O., Kotzian, M., Fiedler, F., 1997. Ozone concen-tration jump in the stable nocturnal boundary layer during a LLJ-event.Atmospheric Environment 31, 1977e1989.
Draxler, R.R., Rolph, G.D., 2003. HYSPLIT (HYbrid Single-Particle Lagrangian Inte-grated Trajectory) Model. NOAA Air Resources Laboratory, Silver Spring, MD.
Geyer, A., Stutz, J., 2004. Vertical profiles of NO3, N2O5, O3, and NOx in the nocturnalboundary layer: 2. Model studies on the altitude dependence of compositionand chemistry. Journal of Geophysical Research 109, D12307.
Güldner, J., Spänkuch, D., 2001. Remote sensing of the thermodynamic state of theatmospheric boundary layer by ground-based microwave radiometry. Journal ofAtmospheric and Oceanic Technology 18, 925e933.
Hidy, G.M., 2000. Ozone process insights from field experiments part I: overview.Atmospheric Environment 34, 2001e2022.
Karan, H., Knupp, K., 2006. Mobile integrated profiler system (MIPS) observations oflow-level convergent boundaries during IHOP. Monthly Weather Review 134,92e112.
Knupp, K.R., Walters, J., Biggerstaff, M., 2006. Doppler profiler and radar observa-tions of boundary layer variability during the landfall of tropical storm Gabri-elle. Journal of the Atmospheric Sciences 63, 234e251.
Komhyr, W.D., Barnes, R.A., Brothers, G.B., Lanthrop, J.A., Opperman, D.P., 1995.Electrochemical concentration cell ozonesonde performance evaluation duringSTOIC 1989. Journal of Geophysical Research 100, 9231e9244.
Kuang, S., Burris, J.F., Newchurch, M.J., Johnson, S., Long, S., 2010. DifferentialAbsorption Lidar (DIAL) to measure sub-hourly variation of tropospheric ozoneprofiles. IEEE Transactions on Geoscience and Remote Sensing 49, 557e571.
McNider, R.T., Norris, W.B., Song, A.J., Clymer, R.L., Gupta, S., Banta, R.M.,Zamora, R.J., White, A.B., Trainer, M., 1998. Meteorological conditions during the1995 southern oxidants study Nashville/Middle Tennessee field Intensive.Journal of Geophysical Research 103, 22225e222243.
Meagher, J.F., Cowling, E.B., Fehsenfeld, F.C., Parkhurst, W.J., 1998. Ozone formationand transport in southeastern United States: overview of the SOS Nashville/
Middle Tennessee ozone study. Journal of Geophysical Research 103,22213e222223.
Morris, G.A., Ford, B., Rappenglück, B., Thompson, A.M., Mefferd, A., Ngan, F.,Lefer, B., 2010. An evaluation of the interaction of morning residual layer andafternoon mixed layer ozone in Houston using ozonesonde data. AtmosphericEnvironment 44, 4024e4034.
Natural Resources and Environmental Management Division, 2009. Air QualityReport, Data Summaries, Trend Analysis and Program Activities (2004e2008),Huntsville, Alabama, 1e62 pp.
Neu, U., Künzle, T., Wanner, H., 1994. On the relation between ozone storage in theresidual layer and daily variation in the near-surface ozone concentration ea case study. Boundary-Layer Meteorology 69, 221e247.
Newchurch, M.J., Ayoub, M.A., Oltmans, S., Johnson, B., Schmidlin, F.J., 2003. Verticaldistribution of ozone at four sites in the United States. Journal of GeophysicalResearch 108, 4031.
Oltmans, S.J., Levy II, H., Harris, J.M., Merrill, J.T., Moody, J.L., Lathrop, J.A., Cuevas, E.,Trainer, M., O’Neill, M.S., Prospero, J.M., Vömel, H., Johnson, B.J., 1996. Summerand spring ozone profiles over the North Atlantic from ozonesonde measure-ments. Journal of Geophysical Research 101, 29179e129200.
Solomon, P., Cowling, E., Hidy, G., Furiness, C., 2000. Comparison of scientificfindings from major ozone field studies in North America and Europe. Atmo-spheric Environment 34, 1885e1920.
Stohl, A., 1998. Computation, accuracy and applications of trajectories e a reviewand bibliography. Atmospheric Environment 32, 947e966.
Stutz, J., Alicke, B., Ackermann, R., Geyer, A., White, A., Williams, E., 2004. Verticalprofiles of NO3, N2O5, O3, and NOx in the nocturnal boundary layer: 1. Obser-vations during the Texas air quality study 2000. Journal of Geophysical Research109, D12306.
Sun, J., Desjardins, R., Mahrt, L., MacPherson, I., 1998. Transport of carbon dioxide,water vapor, and ozone by turbulence and local circulations. Journal ofGeophysical Research 103, 25873e825885.
Thompson, A.M., Stone, J.B., Witte, J.C., Miller, S.K., Oltmans, S.J., Kucsera, T.L.,Ross, K.L., Pickering, K.E., Merrill, J.T., Forbes, G., Tarasick, D.W., Joseph, E.,Schmidlin, F.J., McMillan, W.W., Warner, J., Hintsa, E.J., Johnson, J.E., 2007.Intercontinental chemical transport experiment ozonesonde network study(IONS) 2004: 2. Tropospheric ozone budgets and variability over northeasternNorth America. Journal of Geophysical Research 112, D12S13.
Trainer, M., Ridley, B.A., Buhr, M.P., Kok, G., Walega, J., Hubler, G., Parrish, D.D.,Fehsenfeld, F.C., 1995. Regional ozone and urban plumes in the southeasternUnited States: Birmingham, a case study. Journal of Geophysical Research 100,18823e18834.
Walters, C.K., Winkler, J.A., Shadbolt, R.P., Ravensway, J.v., Bierly, G.D., 2008. A long-term climatology of southerly and northerly low-level jets for the centralUnited States. Annals of the Association of American Geographers 98, 521e552.
White, A.B., 1993. Mixing depth detection using 915-MHz radar reflectivity data. In:Eighth Symposium on Observations and Instrumentation. 8th Symposium onMeteorological Observations and Instrumentation, Anaheim, CA. AmericanMeteorological Society, Boston MA, pp. 248e250.
Whiteman, C.D., Bian, X., Zhong, S., 1997. Low-level jet climatology from enhancedRawinsonde observations at a site in the southern Great Plains. Journal ofApplied Meteorology 36, 1363e1376.
Zhang, J., Rao, S.T.,1999.Theroleofverticalmixing in the temporal evolutionofground-level ozone concentrations. Journal of Applied Meteorology 38, 1674e1691.
Zhu, T., Lin, W., Song, Y., Cai, X., Zou, H., Kang, L., Zhou, L., Akimoto, H., 2006.Downward transport of ozone-rich air near Mt. Everest. Geophysical ResearchLetters 33, L23809.