noise analysis technical report · the purpose of this noise analysis technical report is to...
TRANSCRIPT
SOAPSTONE CONNECTOR
FAIRFAX COUNTY PROJECT NO.: 2G40-078
RESTON, VA
NOISE ANALYSIS TECHNICAL REPORT
March 2017
Prepared for:
Fairfax County Department of Transportation
Prepared by:
PARSONS

THIS PAGE INTENTIONALLY LEFT BLANK

Project No. 2G40-078 i
Executive Summary
This Noise Analysis Technical Report analyzes possible future worst-case traffic noise impacts and subsequent abatement measures resulting from the Soapstone Connector. The Soapstone Connector would provide a direct connection between Sunset Hills Road and Sunrise Valley Drive, crossing over the Dulles Corridor, which includes VA Route 267 (Dulles Toll Road (DTR)), the Dulles International Airport Access Highway (DIAAH), and the Silver Line of the Metrorail system. The Soapstone Drive and Sunrise Valley Drive intersection will serve as the southern terminus of the Soapstone Connector, while the northern terminus will connect to Sunset Hills Road. The connector will create a new roadway and bridge that will traverse the Dulles Corridor.
The report conforms to the regulations and standards of the Federal Highway Administration’s (FHWA) 23 CFR 772 Procedures for Abatement of Highway Traffic Noise and Construction Noise (July 13, 2011) for Type I projects as well as the current Virginia Department of Transportation (VDOT) State Noise Abatement Policy. The Noise Abatement Criteria (NAC), which represent the threshold at which abatement of highway traffic noise must be considered for specific types of land uses, was used for determining traffic noise impacts as established by FHWA (23 CFR 772). The regulations do not mandate that the abatement criteria be met in all situations, but rather require that reasonable and feasible efforts be made to provide noise mitigation when the noise abatement criteria are approached or exceeded.
This study details the noise impact assessment for existing (2015) conditions as well as for the design year (2046) Build Alternatives. There are two alternatives, Alternatives 1 and 2, that are being considered for the Soapstone Connector. Traffic on Sunrise Valley Drive, Soapstone Drive, Sunset Hills Road, the DTR, the DIAAH, and the Soapstone Connector was determined to be the primary source of noise attributed to the traffic noise impacts within the study area. Traffic noise modeling was performed using FHWA’s Traffic Noise Model (TNM) Version 2.5.
Noise impacts were predicted for the design year (2046) Build condition resulting from worst noise hour traffic noise levels approaching or exceeding the NAC. Land use in the study area consists of multi-family residences, two day care centers, two golf courses, four outdoor use areas associated with office buildings, and other commercial/office building land uses without outdoor use areas.
Traffic noise levels under the Build condition would result in a total of four impacted receptors that represent six residential outdoor use areas and the playground of a day care center. Since the increase in traffic noise levels from existing (2015) to build (2046) conditions was determined to be 0 to 3 dB, there would be no substantial impacts (an increase of 10 dB or more) within the
Project No. 2G40-078 ii
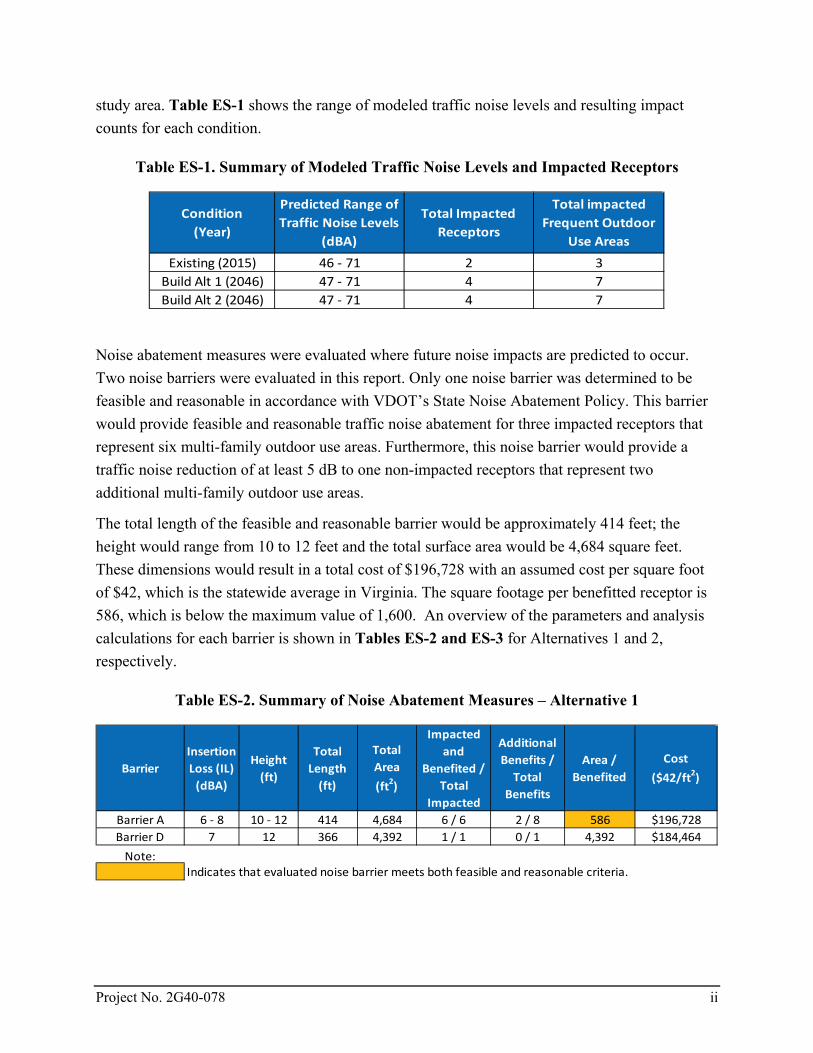
study area. Table ES-1 shows the range of modeled traffic noise levels and resulting impact counts for each condition.
Table ES-1. Summary of Modeled Traffic Noise Levels and Impacted Receptors
Condition(Year)
Predicted Range of Traffic Noise Levels
(dBA)
Total Impacted Receptors
Total impacted Frequent Outdoor
Use AreasExisting (2015) 46 - 71 2 3
Build Alt 1 (2046) 47 - 71 4 7Build Alt 2 (2046) 47 - 71 4 7
Noise abatement measures were evaluated where future noise impacts are predicted to occur. Two noise barriers were evaluated in this report. Only one noise barrier was determined to be feasible and reasonable in accordance with VDOT’s State Noise Abatement Policy. This barrier would provide feasible and reasonable traffic noise abatement for three impacted receptors that represent six multi-family outdoor use areas. Furthermore, this noise barrier would provide a traffic noise reduction of at least 5 dB to one non-impacted receptors that represent two additional multi-family outdoor use areas.
The total length of the feasible and reasonable barrier would be approximately 414 feet; the height would range from 10 to 12 feet and the total surface area would be 4,684 square feet. These dimensions would result in a total cost of $196,728 with an assumed cost per square foot of $42, which is the statewide average in Virginia. The square footage per benefitted receptor is 586, which is below the maximum value of 1,600. An overview of the parameters and analysis calculations for each barrier is shown in Tables ES-2 and ES-3 for Alternatives 1 and 2, respectively.
Table ES-2. Summary of Noise Abatement Measures – Alternative 1
BarrierInsertion Loss (IL)
(dBA)
Height (ft)
Total Length
(ft)
Total Area (ft2)
Impacted and
Benefited / Total
Impacted
Additional Benefits /
Total Benefits
Area / Benefited
Cost ($42/ft2)
Barrier A 6 - 8 10 - 12 414 4,684 6 / 6 2 / 8 586 $196,728Barrier D 7 12 366 4,392 1 / 1 0 / 1 4,392 $184,464
Note:Indicates that evaluated noise barrier meets both feasible and reasonable criteria.
Project No. 2G40-078 iii
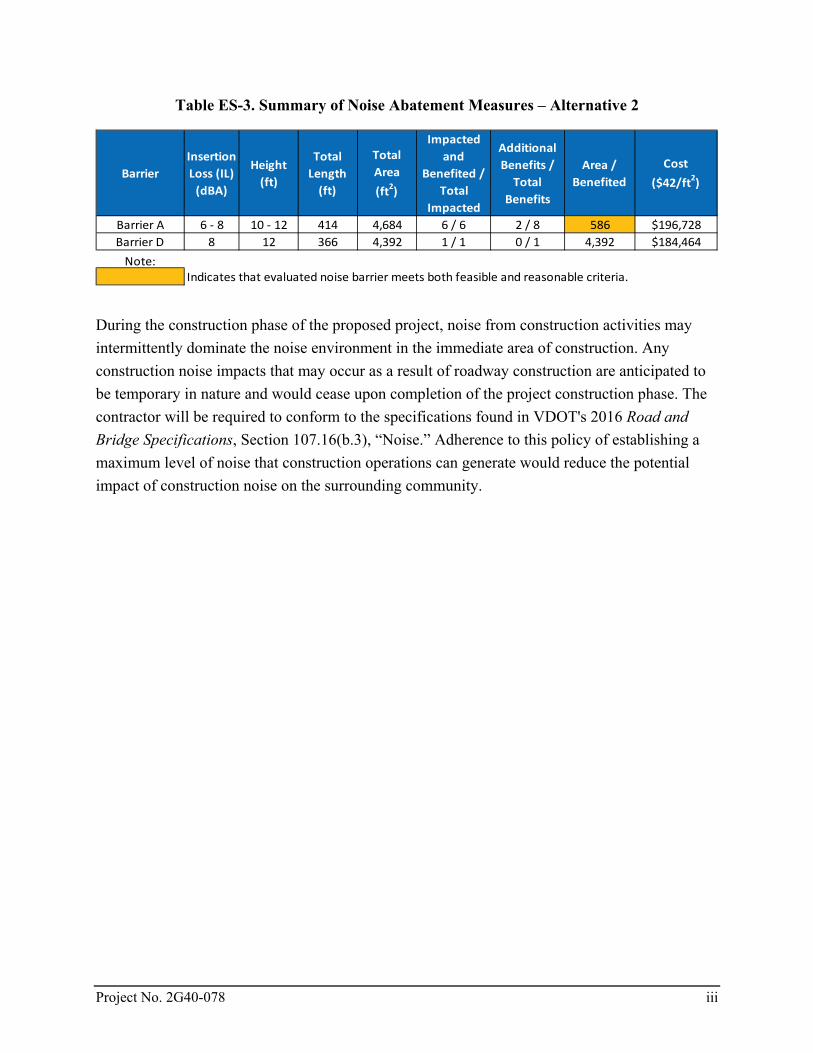
Table ES-3. Summary of Noise Abatement Measures – Alternative 2
During the construction phase of the proposed project, noise from construction activities may intermittently dominate the noise environment in the immediate area of construction. Any construction noise impacts that may occur as a result of roadway construction are anticipated to be temporary in nature and would cease upon completion of the project construction phase. The contractor will be required to conform to the specifications found in VDOT's 2016 Road and Bridge Specifications, Section 107.16(b.3), “Noise.” Adherence to this policy of establishing a maximum level of noise that construction operations can generate would reduce the potential impact of construction noise on the surrounding community.
BarrierInsertion Loss (IL)
(dBA)
Height (ft)
Total Length
(ft)
Total Area (ft2)
Impacted and
Benefited / Total
Impacted
Additional Benefits /
Total Benefits
Area / Benefited
Cost ($42/ft2)
Barrier A 6 - 8 10 - 12 414 4,684 6 / 6 2 / 8 586 $196,728Barrier D 8 12 366 4,392 1 / 1 0 / 1 4,392 $184,464
Note:Indicates that evaluated noise barrier meets both feasible and reasonable criteria.

Project No. 2G40-078 iv
.
THIS PAGE INTENTIONALLY LEFT BLANK

Project No. 2G40-078 v
TABLE OF CONTENTS PAGE
Executive Summary ....................................................................................................................................... i 1 Introduction ................................................................................................................................................ 1
1.1. ... Project Description ...................................................................................................................... 1 1.2. ... Purpose of the Noise Analysis Technical Report ........................................................................ 1
2 Methodology .............................................................................................................................................. 5 2.1. ... Federal Regulation and State Policy Compliance ........................................................................ 5 2.2. ... Sound Level Metrics .................................................................................................................... 6
2.2.1. Sound, Noise, and Acoustics .............................................................................................. 6 2.2.2. Frequency............................................................................................................................ 6 2.2.3. Sound Pressure Levels and Decibels .................................................................................. 6 2.2.4. Addition of Decibels ........................................................................................................... 6 2.2.5. A-Weighted Decibels .......................................................................................................... 7 2.2.6. Human Response to Changes in Noise Levels.................................................................... 7
2.3. ... Sound Propagation ....................................................................................................................... 8 2.3.1. Geometric Spreading .......................................................................................................... 9 2.3.2. Ground Absorption ............................................................................................................. 9 2.3.3. Atmospheric Effects ........................................................................................................... 9 2.3.4. Shielding by Natural or Human-Made Features ................................................................. 9
2.4. ... Noise Descriptors ....................................................................................................................... 10 2.5. ... Noise Abatement Criteria .......................................................................................................... 10 2.6. ... Noise Impact Determination and Analysis Procedure ............................................................... 11 2.7. ... Traffic Noise Level Prediction .................................................................................................. 12
2.7.1. Highway Noise Computation Model ................................................................................ 12 2.7.2. Modeling Assumptions and Considerations ..................................................................... 13 2.7.3. Traffic Volumes and Flow Control ................................................................................... 13
3 Existing Noise Environment .................................................................................................................... 15 3.1. ... Noise Measurement Procedure .................................................................................................. 15 3.2. ... Noise Measurement Results....................................................................................................... 16 3.3. ... Traffic Noise Model Validation ................................................................................................. 17 3.4. ... Undeveloped Lands and Permitted Developments .................................................................... 18 3.5. ... Common Noise Environment (CNE) Determination and Existing Noise Setting ..................... 18
4 Future Noise Environment, Impacts, and Noise Abatement Determination ............................................ 21 4.1. ... Traffic Noise Impacts ................................................................................................................ 21 4.2. ... Noise Abatement Determination ............................................................................................... 28
4.2.1. Warranted Criterion .......................................................................................................... 28 4.2.2. Feasibility Criteria for Noise Barriers ............................................................................... 28 4.2.3. Reasonableness Criteria for Noise Barriers ...................................................................... 28
4.3. ... Alternative Abatement Measures ............................................................................................... 29 4.4. ... Noise Barriers ............................................................................................................................ 31
4.4.1. Barrier A – CNE A – Alternatives 1 and 2 ....................................................................... 31

Project No. 2G40-078 vi
4.4.2. Barrier F – CNE F – Alternatives 1 and 2 ........................................................................ 32
5 Construction Noise ................................................................................................................................... 37
6 Public Involvement Process ..................................................................................................................... 39 6.1. ... Noise-Compatible Land-Use Planning ...................................................................................... 39 6.2. ... Public Involvement Efforts ........................................................................................................ 40
7 References ................................................................................................................................................ 41
8 List of Preparers ....................................................................................................................................... 42
Appendix A Receptor Locations and Evaluated Noise Barrier Locations
Appendix B Noise Measurement Data, Site Photographs, and Equipment Calibration Records
Appendix C Model Validation, Existing, and Future Traffic Data
Appendix D Worst Noise Hour Determination Data
Appendix E Proposed Barrier Top of Wall Elevations
Appendix F Warranted, Feasible, and Reasonable Worksheets
Appendix G Computer Noise Modeling Files (CD-ROM)
LIST OF TABLES
Table 2-1. Activity Categories and Noise Abatement Criteria ................................................................... 11
Table 3-1. Long-Term Noise Measurement Results ................................................................................... 16
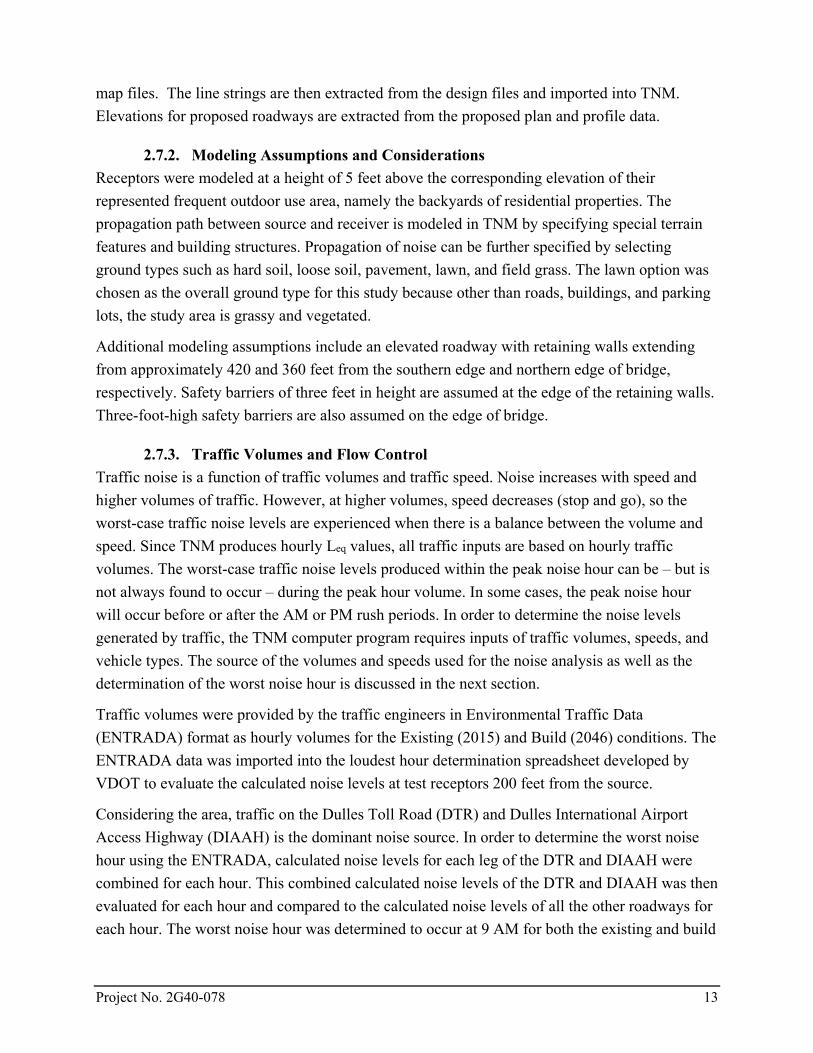
Table 3-2. Short-Term Noise Measurement Results ................................................................................... 17
Table 3-3. Noise Model Validation Results ................................................................................................ 18
Table 4-1. Predicted Traffic Noise Levels – Alternative 1 ......................................................................... 24
Table 4-2. Predicted Traffic Noise Levels – Alternative 2 ......................................................................... 26
Table 4-3. Evaluated Noise Barrier Parameters – Alternative 1 ................................................................. 33
Table 4-4. Evaluated Noise Barrier Parameters – Alternative 2 ................................................................. 33
Table 4-5. Predicted Noise Barrier Insertion Loss – Alternative 1 ............................................................. 34
Table 4-6. Predicted Noise Barrier Insertion Loss – Alternative 2 ............................................................. 35
LIST OF FIGURES
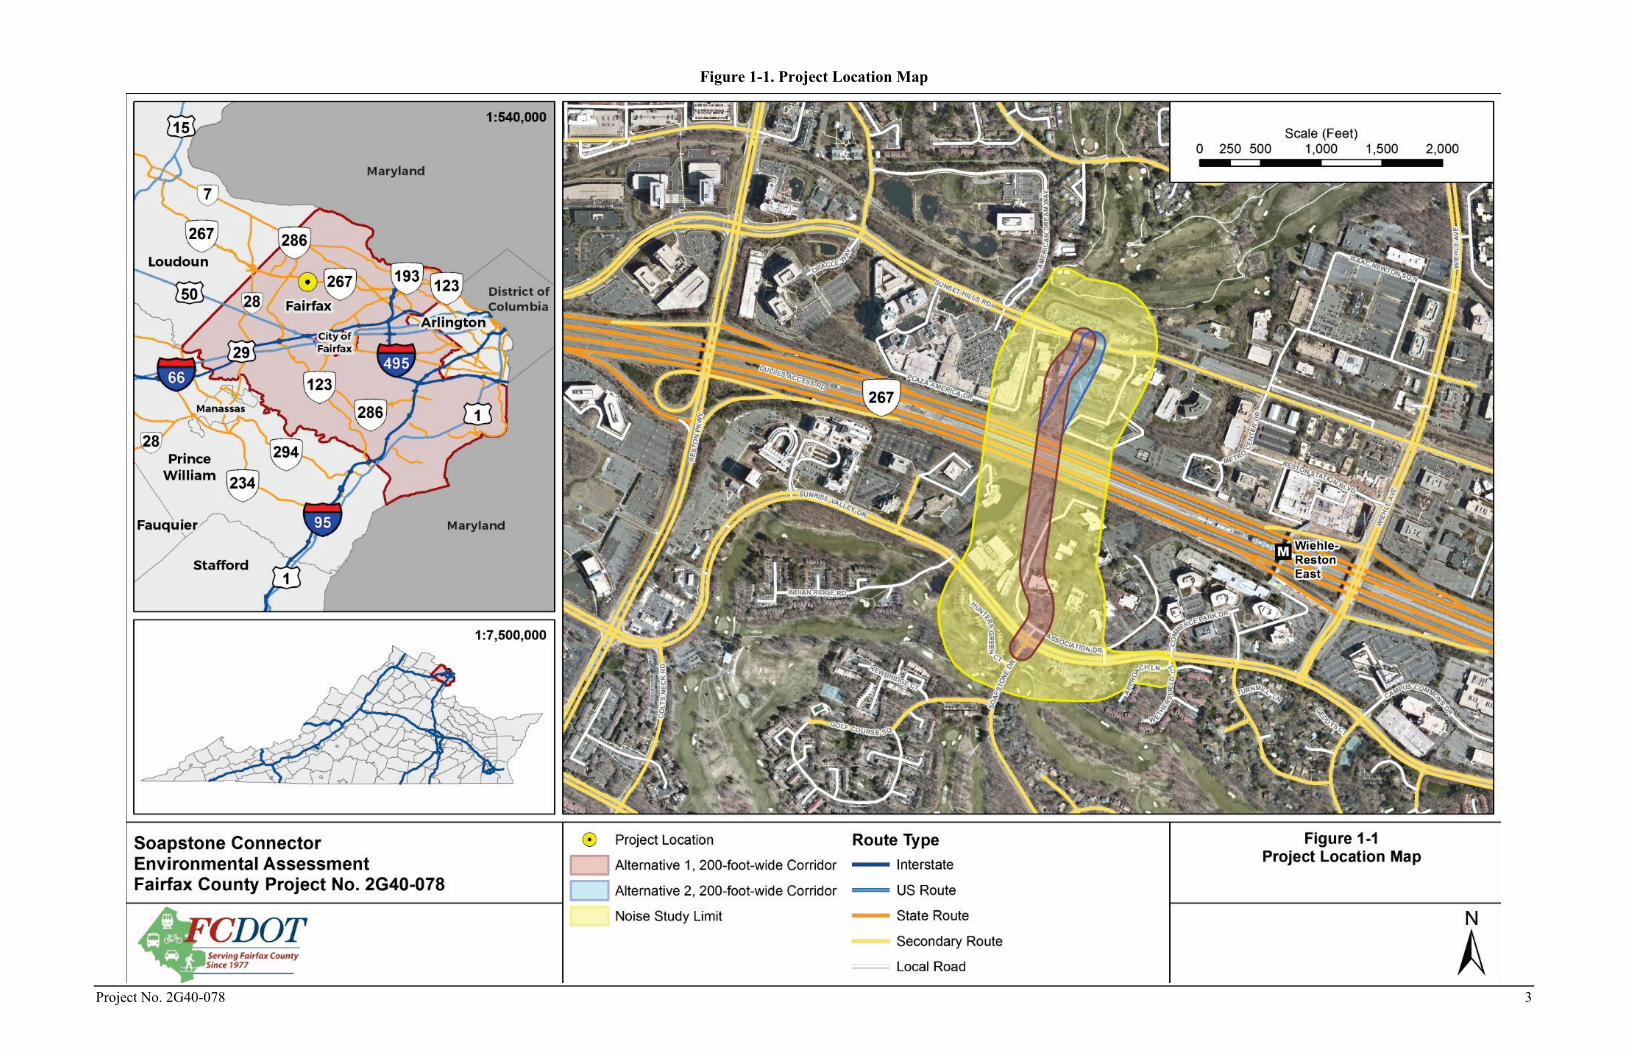
Figure 1-1. Project Location Map ................................................................................................................. 3
Figure 2-1. Typical A-Weighted Noise Levels ............................................................................................. 8
Project No. 2G40-078 1
1 Introduction
1.1. Project Description The Soapstone Connector would provide a direct connection between Sunset Hills Road and Sunrise Valley Drive, crossing over the Dulles Corridor, which includes VA Route 267 (Dulles Toll Road (DTR)), the Dulles International Airport Access Highway (DIAAH), and the Silver Line of the Metrorail system. The idea for this connection originated in the Reston Metrorail Access Group (RMAG) Reston Metrorail Station Access Management Plan. The RMAG planning study was conducted between 2008 and 2009 and reported that the Soapstone Connector would improve traffic operations on Wiehle Avenue and enhance multimodal access to the Wiehle-Reston East Metrorail Station.
Based on the Soapstone Connector Feasibility Study subsequently completed in November 2013, the Soapstone Drive and Sunrise Valley Drive intersection will serve as the southern terminus of the Soapstone Connector, while the northern terminus will connect to Sunset Hills Road. The connector will create a new roadway and bridge that will traverse the Dulles Corridor. The proposed Soapstone Connector alignment is a composition of two previously evaluated alternatives and was chosen due to its advantages over the numerous alternatives studied. These advantages include benefits to multimodal users, connectivity to Soapstone Drive, and minimization of impacts to environmentally sensitive areas. The plan view of the recommended Alternative (Alternative 1) is shown in Figure 1-1.
In addition to Alternative 1, this document also studied a second alignment, as shown in Figure 1-1. The alignment of Alternative 2 follows the same alignment as Alternative 1 south of the Dulles Corridor, but north of the crossing, the alignments diverge and are offset by up to 150 feet.
1.2. Purpose of the Noise Analysis Technical Report The purpose of this Noise Analysis Technical Report is to evaluate noise impacts and abatement under the requirements of Title 23, Part 772 of the Code of Federal Regulations (23 CFR 772) “Procedures for Abatement of Highway Traffic Noise.” The 23 CFR 772 regulations provide procedures for preparing operational and construction noise studies and evaluating noise abatement/mitigation considered for federal and federal-aid highway projects. According to 23 CFR 772.3, all highway projects that are developed in conformance with this regulation are deemed to be in conformance with Federal Highway Administration (FHWA) noise regulations.
The report evaluated barriers for any locations where future design year build impacts were predicted to occur.

Project No. 2G40-078 2
This study includes (a) long-term and short-term noise measurements; (b) roadway traffic noise modeling using FHWA’s Traffic Noise Model (TNM); and (c) feasible and reasonable noise abatement measures.
Project No. 2G40-078 3
Figure 1-1. Project Location Map
Project No. 2G40-078 4
THIS PAGE INTENTIONALLY LEFT BLANK

Project No. 2G40-078 5
2 Methodology
2.1. Federal Regulation and State Policy Compliance The Noise Control Act of 1972 gives the US Environmental Protection Agency (USEPA) the authority to establish noise regulations to control major noise sources, including motor vehicles and construction equipment. Furthermore, the USEPA is required to set noise emission standards for motor vehicles used for interstate commerce and the FHWA is required to enforce the USEPA noise emission standards through the Office of Motor Carrier Safety. The National Environmental Policy Act (NEPA) of 1969 gives broad authority and responsibility to Federal agencies to evaluate and mitigate adverse environmental impacts caused by Federal actions. FHWA is required to comply with NEPA, including mitigating adverse highway traffic noise effects.
The Federal-Aid Highway Act of 1970 mandates FHWA to develop standards for mitigating highway traffic noise. It also requires FHWA to establish traffic noise level criteria for various types of land uses. The Act prohibits FHWA approval of federal-aid highway projects unless adequate consideration has been made for noise abatement measures to comply with the standards. FHWA regulations for highway traffic noise for federal-aid highway projects are contained in 23 CFR 772 Procedures for Abatement of Highway Traffic Noise and Construction Noise (23 CFR 772 2011). The regulations contain noise abatement criteria, which represent the threshold at which abatement of highway traffic noise must be considered for specific types of land uses. The regulations do not mandate that the abatement criteria be met in all situations, but rather require that reasonable and feasible efforts be made to provide noise mitigation when the abatement criteria are approached or exceeded.
The Virginia Department of Transportation (VDOT) State Noise Abatement Policy was developed to implement the requirements of 23 CFR 772 Procedures for Abatement of Highway Traffic Noise and Construction Noise, FHWA’s Highway Traffic Noise Analysis and Abatement Policy and Guidance (FHWA 2011), and the noise-related requirements of NEPA. The current VDOT State Noise Abatement Policy became effective on July 13, 2011 and was updated on July 14, 2015 (VDOT 2015a).
Under Title 23 CFR 772.7, projects are categorized as Type I, Type II, or Type III projects. Type I projects include those that create a completely new noise source, as well as those that increase the volume or speed of traffic or move the traffic closer to a receiver. Type I projects include the physical alteration of an existing highway where there is substantial horizontal alterations and the addition of through-traffic lanes. A Type II project is a noise barrier retrofit project that involves no changes to highway capacity or alignment. Projects unrelated to increased noise levels, such as striping, lighting, signing, and landscaping projects would be considered Type III. Soapstone Connector would be considered a Type I project.
Project No. 2G40-078 6
2.2. Sound Level Metrics The following sections describe the necessary technical terminologies and concepts that are used when presenting and discussing the noise study analysis.
2.2.1. Sound, Noise, and Acoustics Sound can be described as the mechanical energy of a vibrating object transmitted by pressure waves through a liquid or gaseous medium (e.g., air) to a hearing organ, such as a human ear. Noise is defined as loud, unexpected, or annoying sound. In the science of acoustics, the fundamental model consists of a sound (or noise) source, a receiver, and the propagation path between the two. The loudness of the noise source and obstructions or atmospheric factors affecting the propagation path to the receiver determines the sound level and characteristics of the noise perceived by the receiver. The field of acoustics deals primarily with the propagation and control of sound.
2.2.2. Frequency Continuous sound can be described by frequency (pitch) and amplitude (loudness). A low-frequency sound is perceived as low in pitch. Frequency is expressed in terms of cycles per second, or Hertz (Hz) (e.g., a frequency of 250 cycles per second is referred to as 250 Hz). High frequencies are sometimes more conveniently expressed in kilohertz (kHz), or thousands of Hertz. The audible frequency range for humans is generally between 20 Hz and 20,000 Hz.
2.2.3. Sound Pressure Levels and Decibels The amplitude of pressure waves generated by a sound source determines the loudness of that source. Sound pressure amplitude is measured in micro-Pascals (µPa). One µPa is approximately one hundred billionth (0.00000000001) of normal atmospheric pressure. Sound pressure amplitudes for different kinds of noise environments can range from less than 100 to 100,000,000 µPa. Because of this huge range of values, sound is rarely expressed in terms of µPa. Instead, a logarithmic scale is used to describe sound pressure level (SPL) in terms of decibels (dB). The threshold of hearing for humans is 0 dB, which corresponds to 20 µPa.
2.2.4. Addition of Decibels Because decibels are logarithmic units, SPLs cannot be added or subtracted through ordinary arithmetic means. Under the decibel scale, a doubling of sound energy corresponds to a 3-dB increase. In other words, when two identical sources are each producing sound of the same loudness, the resulting sound level at a given distance would be 3 dB higher than one source under the same conditions. For example, if one automobile produces an SPL of 70 dB when it passes an observer, two cars passing simultaneously would not produce 140 dB—rather, they would combine to produce 73 dB. Under the decibel scale, three sources of equal loudness together produce a sound level 5 dB louder than one source.

Project No. 2G40-078 7
2.2.5. A-Weighted Decibels The decibel scale alone does not adequately characterize how humans perceive noise. The dominant frequencies of a sound have a substantial effect on the human response to that sound. Although the intensity (energy per unit area) of the sound is a purely physical quantity, the loudness or human response is determined by the characteristics of the human ear.
Human hearing is limited in the range of audible frequencies as well as in the way it perceives the SPL in that range. In general, people are most sensitive to the frequency range of 1,000–8,000 Hz, and perceive sounds within that range better than sounds of the same amplitude in higher or lower frequencies. To approximate the response of the human ear, sound levels of individual frequency bands are weighted, depending on the human sensitivity to those frequencies. Then, an “A-weighted” sound level (expressed in units of dBA) can be computed based on this information.
The A-weighting network approximates the frequency response of the average young ear when listening to most ordinary sounds. When people make judgments of the relative loudness or annoyance of a sound, their judgments correlate well with the A-weighted levels of those sounds. Other weighting networks have been devised to address high noise levels or other special problems (e.g., B-, C-, and D-scales), but these scales are rarely used in conjunction with highway-traffic noise. Noise levels for traffic noise reports are typically reported in terms of A-weighted decibels or dBA. Figure 2-1 shows typical A-weighted noise levels for various noise sources.
2.2.6. Human Response to Changes in Noise Levels As discussed above, doubling sound energy results in a 3-dB increase in sound. However, given a sound level change measured with precise instrumentation, the subjective human perception of a doubling of loudness will usually be different than what is measured.
Under controlled conditions in an acoustical laboratory, the trained, healthy human ear is able to discern 1-dB changes in sound levels, when exposed to steady, single-frequency (“pure-tone”) signals in the mid-frequency (1,000 Hz–8,000 Hz) range. In typical noisy environments, changes in noise of 1 to 2 dB are generally not perceptible. However, it is widely accepted that people are able to begin to detect sound level increases of 3 dB in typical noisy environments. Furthermore, a 5-dB increase is generally perceived as a distinctly noticeable increase, and a 10-dB increase is generally perceived as a doubling of loudness. Therefore, a doubling of sound energy (e.g., doubling the volume of traffic on a highway) that would result in a 3-dB increase in sound would generally be perceived as barely detectable.

Project No. 2G40-078 8
Figure 2-1. Typical A-Weighted Noise Levels
2.3. Sound Propagation When sound propagates over a distance, it changes in level and frequency content. The manner in which noise reduces with distance depends on the following factors.
Project No. 2G40-078 9
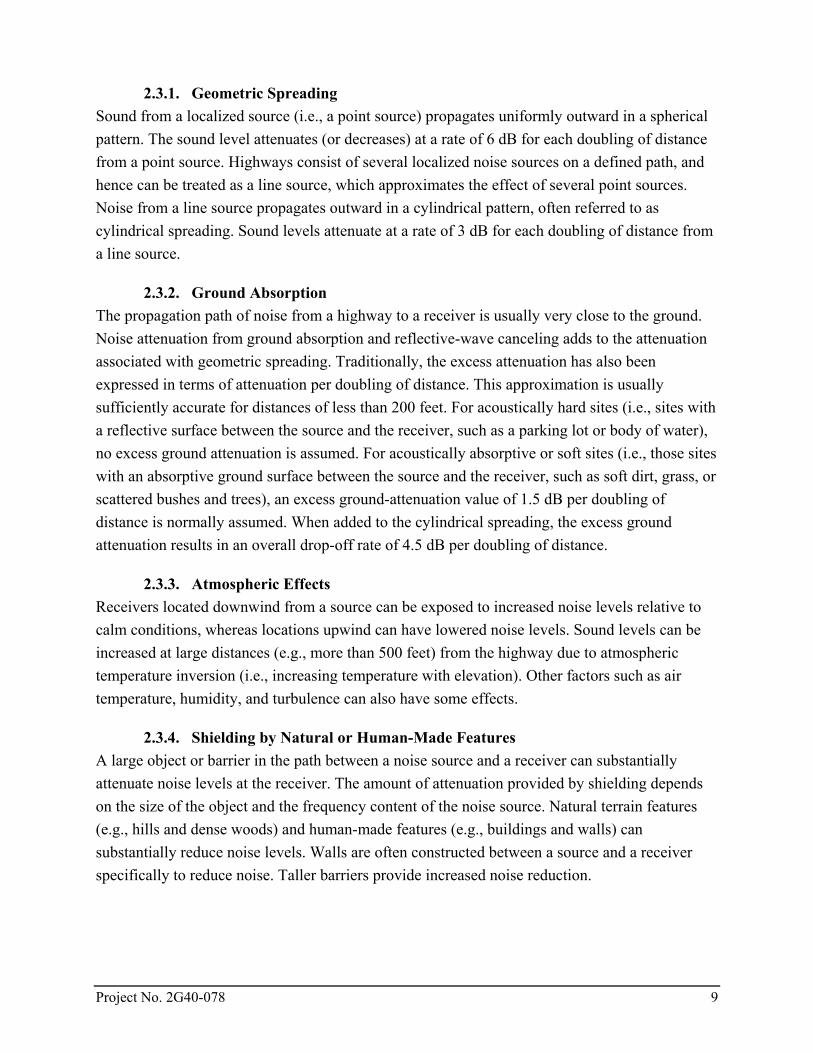
2.3.1. Geometric Spreading Sound from a localized source (i.e., a point source) propagates uniformly outward in a spherical pattern. The sound level attenuates (or decreases) at a rate of 6 dB for each doubling of distance from a point source. Highways consist of several localized noise sources on a defined path, and hence can be treated as a line source, which approximates the effect of several point sources. Noise from a line source propagates outward in a cylindrical pattern, often referred to as cylindrical spreading. Sound levels attenuate at a rate of 3 dB for each doubling of distance from a line source.
2.3.2. Ground Absorption The propagation path of noise from a highway to a receiver is usually very close to the ground. Noise attenuation from ground absorption and reflective-wave canceling adds to the attenuation associated with geometric spreading. Traditionally, the excess attenuation has also been expressed in terms of attenuation per doubling of distance. This approximation is usually sufficiently accurate for distances of less than 200 feet. For acoustically hard sites (i.e., sites with a reflective surface between the source and the receiver, such as a parking lot or body of water), no excess ground attenuation is assumed. For acoustically absorptive or soft sites (i.e., those sites with an absorptive ground surface between the source and the receiver, such as soft dirt, grass, or scattered bushes and trees), an excess ground-attenuation value of 1.5 dB per doubling of distance is normally assumed. When added to the cylindrical spreading, the excess ground attenuation results in an overall drop-off rate of 4.5 dB per doubling of distance.
2.3.3. Atmospheric Effects Receivers located downwind from a source can be exposed to increased noise levels relative to calm conditions, whereas locations upwind can have lowered noise levels. Sound levels can be increased at large distances (e.g., more than 500 feet) from the highway due to atmospheric temperature inversion (i.e., increasing temperature with elevation). Other factors such as air temperature, humidity, and turbulence can also have some effects.
2.3.4. Shielding by Natural or Human-Made Features A large object or barrier in the path between a noise source and a receiver can substantially attenuate noise levels at the receiver. The amount of attenuation provided by shielding depends on the size of the object and the frequency content of the noise source. Natural terrain features (e.g., hills and dense woods) and human-made features (e.g., buildings and walls) can substantially reduce noise levels. Walls are often constructed between a source and a receiver specifically to reduce noise. Taller barriers provide increased noise reduction.
Project No. 2G40-078 10
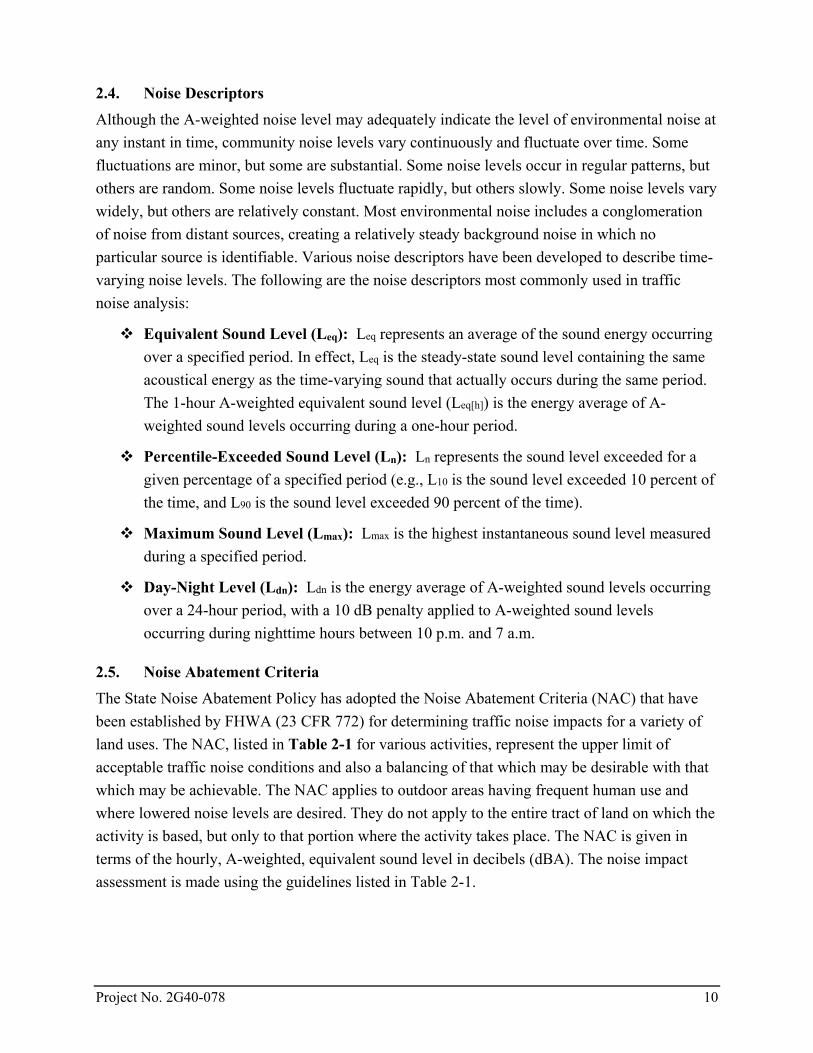
2.4. Noise Descriptors Although the A-weighted noise level may adequately indicate the level of environmental noise at any instant in time, community noise levels vary continuously and fluctuate over time. Some fluctuations are minor, but some are substantial. Some noise levels occur in regular patterns, but others are random. Some noise levels fluctuate rapidly, but others slowly. Some noise levels vary widely, but others are relatively constant. Most environmental noise includes a conglomeration of noise from distant sources, creating a relatively steady background noise in which no particular source is identifiable. Various noise descriptors have been developed to describe time-varying noise levels. The following are the noise descriptors most commonly used in traffic noise analysis:
Equivalent Sound Level (Leq): Leq represents an average of the sound energy occurring over a specified period. In effect, Leq is the steady-state sound level containing the same acoustical energy as the time-varying sound that actually occurs during the same period. The 1-hour A-weighted equivalent sound level (Leq[h]) is the energy average of A-weighted sound levels occurring during a one-hour period.
Percentile-Exceeded Sound Level (Ln): Ln represents the sound level exceeded for a given percentage of a specified period (e.g., L10 is the sound level exceeded 10 percent of the time, and L90 is the sound level exceeded 90 percent of the time).
Maximum Sound Level (Lmax): Lmax is the highest instantaneous sound level measured during a specified period.
Day-Night Level (Ldn): Ldn is the energy average of A-weighted sound levels occurring over a 24-hour period, with a 10 dB penalty applied to A-weighted sound levels occurring during nighttime hours between 10 p.m. and 7 a.m.
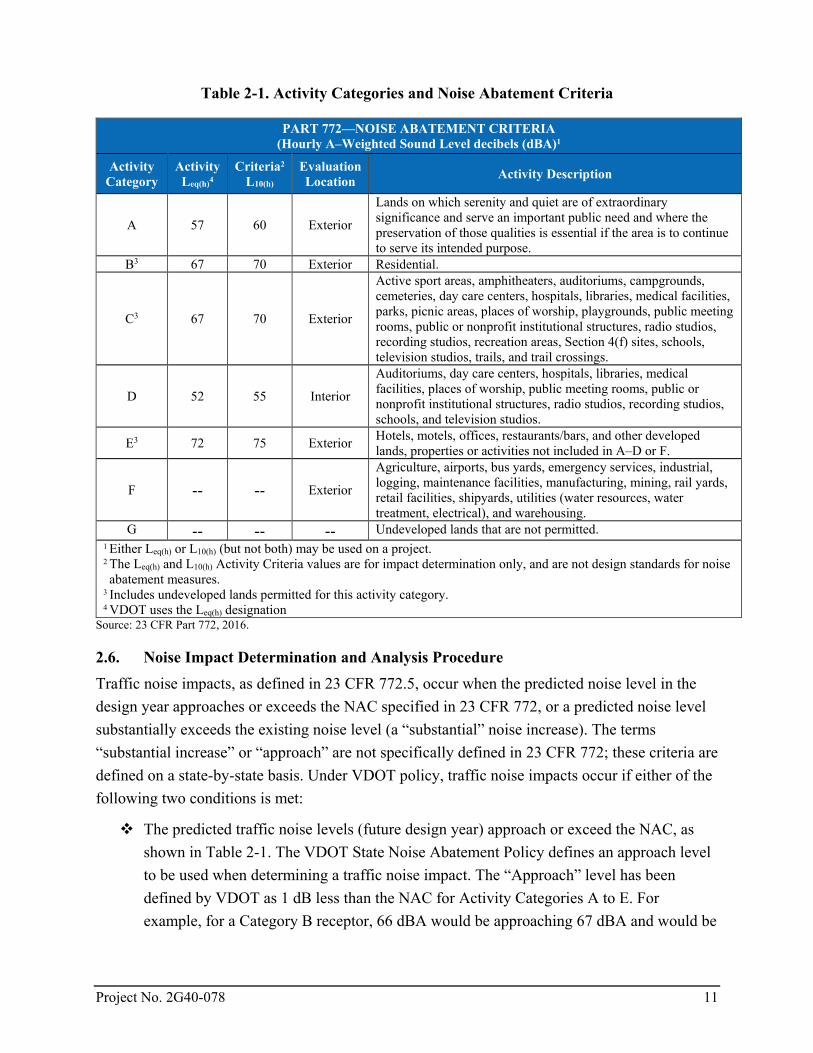
2.5. Noise Abatement Criteria The State Noise Abatement Policy has adopted the Noise Abatement Criteria (NAC) that have been established by FHWA (23 CFR 772) for determining traffic noise impacts for a variety of land uses. The NAC, listed in Table 2-1 for various activities, represent the upper limit of acceptable traffic noise conditions and also a balancing of that which may be desirable with that which may be achievable. The NAC applies to outdoor areas having frequent human use and where lowered noise levels are desired. They do not apply to the entire tract of land on which the activity is based, but only to that portion where the activity takes place. The NAC is given in terms of the hourly, A-weighted, equivalent sound level in decibels (dBA). The noise impact assessment is made using the guidelines listed in Table 2-1.
Project No. 2G40-078 11
Table 2-1. Activity Categories and Noise Abatement Criteria
PART 772—NOISE ABATEMENT CRITERIA (Hourly A–Weighted Sound Level decibels (dBA)1
Activity Category
Activity Leq(h)4
Criteria2
L10(h) Evaluation Location Activity Description
A 57 60 Exterior
Lands on which serenity and quiet are of extraordinary significance and serve an important public need and where the preservation of those qualities is essential if the area is to continue to serve its intended purpose.
B3 67 70 Exterior Residential.
C3 67 70 Exterior
Active sport areas, amphitheaters, auditoriums, campgrounds, cemeteries, day care centers, hospitals, libraries, medical facilities, parks, picnic areas, places of worship, playgrounds, public meeting rooms, public or nonprofit institutional structures, radio studios, recording studios, recreation areas, Section 4(f) sites, schools, television studios, trails, and trail crossings.
D 52 55 Interior
Auditoriums, day care centers, hospitals, libraries, medical facilities, places of worship, public meeting rooms, public or nonprofit institutional structures, radio studios, recording studios, schools, and television studios.
E3 72 75 Exterior Hotels, motels, offices, restaurants/bars, and other developed lands, properties or activities not included in A–D or F.
F -- -- Exterior
Agriculture, airports, bus yards, emergency services, industrial, logging, maintenance facilities, manufacturing, mining, rail yards, retail facilities, shipyards, utilities (water resources, water treatment, electrical), and warehousing.
G -- -- -- Undeveloped lands that are not permitted. 1 Either Leq(h) or L10(h) (but not both) may be used on a project. 2 The Leq(h) and L10(h) Activity Criteria values are for impact determination only, and are not design standards for noise abatement measures.
3 Includes undeveloped lands permitted for this activity category. 4 VDOT uses the Leq(h) designation
Source: 23 CFR Part 772, 2016.
2.6. Noise Impact Determination and Analysis Procedure Traffic noise impacts, as defined in 23 CFR 772.5, occur when the predicted noise level in the design year approaches or exceeds the NAC specified in 23 CFR 772, or a predicted noise level substantially exceeds the existing noise level (a “substantial” noise increase). The terms “substantial increase” or “approach” are not specifically defined in 23 CFR 772; these criteria are defined on a state-by-state basis. Under VDOT policy, traffic noise impacts occur if either of the following two conditions is met:
The predicted traffic noise levels (future design year) approach or exceed the NAC, as shown in Table 2-1. The VDOT State Noise Abatement Policy defines an approach level to be used when determining a traffic noise impact. The “Approach” level has been defined by VDOT as 1 dB less than the NAC for Activity Categories A to E. For example, for a Category B receptor, 66 dBA would be approaching 67 dBA and would be

Project No. 2G40-078 12
considered an impact. If design year noise levels “approach or exceed” the NAC, then the activity is impacted and a series of abatement measures must be considered.
The predicted traffic noise levels are substantially higher than the existing noise levels. A substantial noise increase has been defined by VDOT when the predicted (future design year) highway traffic noise levels exceed existing noise levels by 10 dB or more for all noise-sensitive exterior activity categories. For example, if a receptor’s existing noise level is 50 dBA, and if the future noise level is 60 dBA, then it would be considered an impact. The noise levels of the substantial increase impact do not have to exceed the appropriate NAC. Receptors that satisfy this condition warrant consideration of highway traffic noise abatement.
If a traffic noise impact is identified within the project corridor, then consideration of noise abatement measures is necessary. The final decision on whether or not to provide noise abatement along a project corridor will take into account the feasibility of the design, the reasonableness or cost-effectiveness, and input from benefited property owners.
2.7. Traffic Noise Level Prediction
2.7.1. Highway Noise Computation Model Since roadway noise can be determined accurately through computer modeling techniques for areas that are dominated by roadway traffic, design year traffic noise calculations have been predicted using FHWA’s Traffic Noise Model (TNM) Version 2.5, which is the latest approved version. The TNM was developed and sponsored by the U. S. Department of Transportation and John A. Volpe National Transportation Systems Center, Acoustics facility. The TNM estimates vehicle noise emissions and resulting noise levels based on reference energy mean emission levels. The existing and proposed alignments (horizontal and vertical) are input into the model, along with the receptor locations, traffic volumes of cars, medium trucks (vehicles with 2 axles and 6 tires), heavy trucks, average vehicle speeds, pavement type, and any traffic control devices. The TNM uses its acoustic algorithms to predict noise levels at the selected receptor locations by taking into account sound propagation variables, such as atmospheric absorption, divergence, intervening ground, barriers, and building rows (FHWA, 2004).
TNM input is based on a three-dimensional grid created for the study area to be modeled. All roadways, barriers, terrain lines, and receiver points are defined by x, y, and z coordinates. Receptors, defined as single points, are typically located at frequent outdoor use areas such as residences, playgrounds, and golf courses. Roadways, terrain lines, and barriers are coded into TNM as line segments defined by a series of points. A series of line segments that represent a particular modeling feature is often referred as a “line string”. Line strings are created for all pertinent roadways and distinguishing terrain features within the study area. To obtain the elevations for existing areas, line strings are draped onto three dimensional (3D) digital terrain
Project No. 2G40-078 13
map files. The line strings are then extracted from the design files and imported into TNM. Elevations for proposed roadways are extracted from the proposed plan and profile data.
2.7.2. Modeling Assumptions and Considerations Receptors were modeled at a height of 5 feet above the corresponding elevation of their represented frequent outdoor use area, namely the backyards of residential properties. The propagation path between source and receiver is modeled in TNM by specifying special terrain features and building structures. Propagation of noise can be further specified by selecting ground types such as hard soil, loose soil, pavement, lawn, and field grass. The lawn option was chosen as the overall ground type for this study because other than roads, buildings, and parking lots, the study area is grassy and vegetated.
Additional modeling assumptions include an elevated roadway with retaining walls extending from approximately 420 and 360 feet from the southern edge and northern edge of bridge, respectively. Safety barriers of three feet in height are assumed at the edge of the retaining walls. Three-foot-high safety barriers are also assumed on the edge of bridge.
2.7.3. Traffic Volumes and Flow Control Traffic noise is a function of traffic volumes and traffic speed. Noise increases with speed and higher volumes of traffic. However, at higher volumes, speed decreases (stop and go), so the worst-case traffic noise levels are experienced when there is a balance between the volume and speed. Since TNM produces hourly Leq values, all traffic inputs are based on hourly traffic volumes. The worst-case traffic noise levels produced within the peak noise hour can be – but is not always found to occur – during the peak hour volume. In some cases, the peak noise hour will occur before or after the AM or PM rush periods. In order to determine the noise levels generated by traffic, the TNM computer program requires inputs of traffic volumes, speeds, and vehicle types. The source of the volumes and speeds used for the noise analysis as well as the determination of the worst noise hour is discussed in the next section.
Traffic volumes were provided by the traffic engineers in Environmental Traffic Data (ENTRADA) format as hourly volumes for the Existing (2015) and Build (2046) conditions. The ENTRADA data was imported into the loudest hour determination spreadsheet developed by VDOT to evaluate the calculated noise levels at test receptors 200 feet from the source.
Considering the area, traffic on the Dulles Toll Road (DTR) and Dulles International Airport Access Highway (DIAAH) is the dominant noise source. In order to determine the worst noise hour using the ENTRADA, calculated noise levels for each leg of the DTR and DIAAH were combined for each hour. This combined calculated noise levels of the DTR and DIAAH was then evaluated for each hour and compared to the calculated noise levels of all the other roadways for each hour. The worst noise hour was determined to occur at 9 AM for both the existing and build

Project No. 2G40-078 14
conditions. Data extracted from the worst hour determination spreadsheet is shown in Appendix D.
Appendix C presents the comprehensive listing of the worst noise hour traffic volumes, speeds, and traffic distribution per direction of travel used for the noise analysis for the Existing and Build conditions as determined from the ENTRADA.

Project No. 2G40-078 15
3 Existing Noise Environment
A field investigation was conducted to identify frequent outdoor use areas that could be subject to traffic noise impacts from the proposed project. Noise monitoring was also conducted in order to develop a comparison between the monitored results and the output obtained from the noise prediction model. This exercise was performed to validate the model so that it could be used with confidence to predict the worst hour traffic noise levels for the existing and future conditions. Long-term measurements were conducted from November 16 through 17, 2015 at two locations for a minimum of 24 hours. The purpose of the long-term noise measurements was to determine the existing worst noise hours in the study area in which to conduct the short-term measurements. Short-term noise measurements of 20 minutes in duration were conducted at a total of seven sites on November 18 and 20, 2015 within the project corridor. Four of the short-term measurements were conducted with simultaneous traffic recordings for noise model validation purposes. The short-term noise measurements were conducted during the existing worst noise hours as established by the nearby long-term noise measurements.
3.1. Noise Measurement Procedure Noise measurements were conducted in conformance with the guidelines outlined in the FHWA’s “Measuring of Highway Related Noise,” FHWA-DP-96-046. The following are brief descriptions of the measurement procedures used for this project:
Microphones were primarily placed approximately 5 feet above the ground and were positioned more than 10 feet from any wall or building to prevent reflections or unrepresentative shielding of the noise where possible.
Sound level meters were calibrated before and after each set of measurements.
Following the calibration of equipment, a windscreen was placed over the microphone.
Frequency weighting was set on “A”, and the slow detector response was selected.
Results of the short-term noise measurements were recorded on data sheets in the field.
Traffic was counted during four of the short-term measurements for model validation. Vehicle types were separated into three vehicle groups: automobiles, medium trucks (2-axle with 6-wheels but not including dually pick-up trucks), and heavy trucks (3 or more axle vehicles). Average traffic speeds were measured using a radar gun.
Wind speed, temperature, humidity, and sky conditions were observed and documented during the short-term noise measurements.
The instruments used for the noise measurements included the following:
Sound Level Meter – Larson Davis model 812.

Project No. 2G40-078 16
Larson Davis 812 Transducer Components – Larson Davis model PRM 828 microphone preamp; Larson Davis model 2560, ½-inch pressure microphone.
Acoustic Field Calibrators – Larson Davis model CA250 constant pressure microphone calibrator.
4-inch diameter windscreen and tripods.
Wind Monitor/Temperature and Humidity Gauge – Kestrel 3000 Pocket Weather Meter.
Handheld Traffic Radar Detector – Kustom Radar Detector.
Documentation of the long-term and short-term measurements, graphs, site photographs, and equipment certifications are located in Appendix B.
NOTE: Short-term noise monitoring is not a process to determine design year noise impacts or barrier locations. Short-term noise monitoring provides a level of consistency between what is present in real-world situations and how that is represented in the computer noise model. Short-term monitoring does not need to occur within every Common Noise Environment (CNE) to validate the computer noise model.
3.2. Noise Measurement Results The dominant source of noise for all the long and short-term measurement sites was traffic on Sunrise Valley Drive, the DTR and DIAAH, and Sunset Hills Road. Project layout plans shown in Figures 1 through 3 in Appendix A present the measurement locations and the CNE designations. A CNE is defined as a group of receptors that share similar noise sources, traffic variables, and topographic features. Results for the long-term measurements are presented in Table 3-1. Results for the short-term measurements are presented in Table 3-2.
Table 3-1. Long-Term Noise Measurement Results
Site No. Street Address, City CNE Land Use Meas. Dates
Duration, hrs
Meas. Worst
Hour Leq, dBA
Meas. Worst Hour
LT1 11604 Hunters Green Court A Residential 11/16/15 – 11/17/15 32 59 07:00
LT2 11501 Sunset Hills Road E Offices 11/16/15 – 11/17/15 26 66 18:00
Project No. 2G40-078 17
Table 3-2. Short-Term Noise Measurement Results
Site No. Street Address, City CNE Land Use Meas. Date
Start Time
Meas. Leq, dBA1
ST1 11639 Hunters Green Court A Residential 11/18/15 16:40 58.4
ST2 11501 Sunrise Valley Drive B Day Care 11/18/15 16:40 59.6
ST3 2011 Approach Lane B Residential 11/20/15 07:00 59.3
ST4 11600 Sunrise Valley Drive C Offices 11/18/15 07:00 58.7
ST5 1900 Association Drive -- Offices 11/18/15 07:40 62.9
ST6 11519 Sunset Hills Road E Commercial 11/18/15 08:20 64.7
ST7 11505 Sunset Hills Road D Day Care 11/20/15 07:40 69.0
Note: 1. All short-term measured noise levels are 20-minute Leq.
3.3. Traffic Noise Model Validation Measurement data at four of the short-term sites were used for model validation. During the validation measurements, traffic volumes and speeds on Sunrise Valley Drive and Sunset Hills Road were concurrently recorded. Only four of the seven measurement sites were used to validate the noise model because either the traffic was located far from the measurement site or it was not possible to capture the traffic volumes. The traffic counts were tabulated according to vehicle types, including automobiles, medium trucks (2-axle with 6-wheels but not including dually pick-up trucks), and heavy trucks (3 or more axle vehicles). Traffic volumes were normalized to 1-hour after counting the traffic during the measurement periods by reviewing simultaneous video recordings of traffic. These normalized volumes were assigned to the corresponding roadways within the project area to simulate the noise source strength at the roadways during the actual measurement periods. After inputting the traffic counts, site geometry, and any other pertinent existing features, noise levels at the validation sites were calculated in the TNM software. Table 3-3 presents the results of the model validation. Traffic volumes collected during the validation measurements are included in Appendix C.

Project No. 2G40-078 18
Table 3-3. Noise Model Validation Results
Measurement Site Date Start
Time
Noise Levels, Deviation, dB
(Modeled - Measured) Leq(h), dBA
Measured Modeled
ST1 11/18/15 16:40 58.4 59.3 0.9
ST2 11/18/15 16:40 59.6 59.3 -0.3
ST3 11/20/15 07:00 59.3 58.8 -0.5
ST6 11/18/15 08:20 64.7 63.9 -0.8
Source: Parsons 2016.
According to VDOT’s Highway Traffic Noise Impact Analysis Guidance Manual, the difference between measured and modeled values must lie within ±3 dB to fall within the accepted level of accuracy. Differences greater than ±3 dB require that both the observed and predicted data be carefully examined to determine the reason(s) for the margin of error (VDOT, 2015a). Because the difference between measured and modeled values fall within ±1 dB, the noise model is within the accepted level of accuracy.
3.4. Undeveloped Lands and Permitted Developments Highway traffic noise analyses are performed for developed lands as well as undeveloped lands if they are considered “permitted.” Undeveloped lands are deemed to be permitted when there is a definite commitment to develop land with an approved specific design of land use activities as evidenced by the issuance of at least one building permit.
In accordance with the VDOT Traffic Noise Policy, an undeveloped lot is considered to be planned, designed, and programmed if a building permit has been issued by the local authorities prior to the Date of Public Knowledge for the relevant project. VDOT considers the “Date of Public Knowledge” as the date that the final NEPA approval is made. VDOT has no obligation to provide noise mitigation for any undeveloped land that is permitted or constructed after this date. There are no undeveloped parcels within the study limits of this project.
3.5. Common Noise Environment (CNE) Determination and Existing Noise Setting This section outlines the CNEs within the project area that contain all of the noise sensitive receptors within at least 500 feet of the proposed project limits that were considered for evaluation of traffic noise analysis. A CNE is defined as a group of receptors that share similar noise sources, traffic variables, and topographic features. Generally, CNEs will also be separated by NAC Category but not in all cases. Six CNE areas were determined to be present within the study area.
Project No. 2G40-078 19
Land use in the study area is predominately commercial/office buildings with multi-family residential along Sunrise Valley Drive as well as two day care centers, two golf courses, and a trail. Modeled noise receptors were placed at the frequent outdoor use areas of the residential properties, day care centers, golf courses, trail, and four frequent outdoor use areas associated with three office buildings. The land uses associated with the remaining commercial/office buildings were not considered noise sensitive because there are no frequent outdoor use areas on the properties; therefore, modeled noise receptors were not included at these locations.
Tables 4-1 and 4-2 in the next section presents the existing (2015) noise levels for all sites. Traffic noise levels under the existing condition are predicted to range from 46 to 71 dBA and would result in a total of two impacted receptors that represent two residential frequent outdoor use areas and the playground of a day care center.
CNE A CNE A is located in the southwest quadrant of the existing Sunrise Valley Drive / Soapstone Drive intersection and contains 15 receptors (A01 to A15), representing 28 multi-family residences. The dominant noise sources within CNE A are traffic on Sunrise Valley Drive and Soapstone Drive. For all studied sites, the existing condition (2015) noise levels are predicted to range from 46 to 67 dBA. Site A08, representing two multi-family residences, is predicted to be impacted under the existing condition (2015).
CNE B CNE B is located in the southeast quadrant of the existing Sunrise Valley Drive / Soapstone Drive intersection and contains eight receptors (B01 to B08), representing eight multi-family residences, two areas of a golf course, and two outdoor use areas of a day care center. The dominant noise sources within CNE B are mainly traffic on Sunrise Valley Drive as well as Soapstone Drive. For all studied sites, the existing condition (2015) noise levels are predicted to range from 57 to 63 dBA. Traffic noise impacts are not predicted for this CNE under the existing condition (2015).
CNE C CNE C is located north of Sunrise Valley Drive, south of the DTR, and west of the proposed Soapstone Connector and contains three receptors (C01 to C03), representing two outdoor use areas (volleyball net and gazebo) associated with an office building, and a patio of a second office building. While CNE C is located between Sunrise Valley Drive and the DTR, the traffic noise from Sunrise Valley Drive is shielded by an office building and parking structure. Therefore, the dominant noise source within CNE C is traffic within the Dulles Corridor. The existing condition (2015) noise levels are predicted to be 60 and 63 dBA. Traffic noise impacts are not predicted for this CNE under the existing condition (2015).

Project No. 2G40-078 20
CNE D CNE D is located north of the DTR, south of Sunset Hills Road, and west of the proposed Soapstone Connector and contains one receptor (D01), representing the playground of a day care center. The dominant noise source within CNE D is traffic within the Dulles Corridor. The existing condition (2015) noise level is predicted to be 71 dBA. Site D01 is predicted to be impacted under the existing condition (2015).
NOTE-Only one receptor has been used to represent the playground because the playground is too small to include additional receptors in a 100-foot grid as suggested in VDOT’s Highway Traffic Noise Impact Analysis Guidance Manual.
CNE E CNE E is located north of the DTR and south of Sunset Hills Road and contains one receptor (E01), representing the third story deck of an office building. The dominant noise source within CNE E is traffic on Sunset Hills Road. The existing condition (2015) noise level is predicted to be 63 dBA. Traffic noise impacts are not predicted for this CNE under the existing condition (2015).
CNE F CNE F is located north of Sunset Hills Road and contains five receptors (F01 to F05), representing three areas of the Washington and Old Dominion (W&OD) Railroad Regional Park (bicycle and pedestrian trail) as well as two areas of a golf course. The dominant noise source within CNE F is traffic on Sunset Hills Road. For all studied sites, the existing condition (2015) noise levels are predicted to range from 52 to 59 dBA. Traffic noise impacts are not predicted for this CNE under the existing condition (2015).

Project No. 2G40-078 21
4 Future Noise Environment, Impacts, and Noise Abatement Determination
This section presents predicted worst noise hour traffic noise levels within the project area under the Build Alternatives (Alternatives 1 and 2). Design year no-build noise levels are not required for this traffic noise study because the project is not related to the interstate system and does not involve a “constructive use” 4(f) determination, as stated in the VDOT State Noise Abatement Policy (VDOT, 2015a). An analysis with barrier heights ranging from 8 to 20 feet was conducted for the potentially impacted areas. Analysis for barriers above 20 feet was not considered because all impacted receptor sites are located at ground elevation and analysis showed that additional benefits could not be gained by heights above 20 feet. The worst noise hour traffic noise levels for the design year were predicted using TNM.
4.1. Traffic Noise Impacts Tables 4-1 and 4-2 present the calculated noise levels for noise sensitive sites for the worst noise hour under existing conditions and Build Alternatives 1 and 2 in design year 2046, respectively.
Traffic noise levels under both Build Alternatives 1 and 2 are predicted to range between 47 and 71 dBA in design year 2046 and both would result in a total of four impacted receptors that represent six residential frequent outdoor use areas and the playground of a day care center. Since the increase in traffic noise levels from existing conditions to build conditions was determined to be 0 to 2 dB for Alternative 1 and 0 to 3 dB for Alternative 2, there would be no substantial impacts (an increase of 10 dB or more) within the study area. Figures 1 and 2 in Appendix A show the predicted 66 dBA contours for Build Alternative 1 and Figures 1 and 3 in Appendix A shows the predicted 66 dBA contours for Build Alternative 2.
Build Alternatives 1 and 2 are identical south of the Dulles Corridor and have the same predicted noise levels for CNEs A through C; therefore, the results for these CNEs will be grouped under Alternatives 1 and 2. The results for CNE D through F are separated under each alternative.
Alternatives 1 and 2 CNE A Future design year (2046) build noise levels are predicted to range from 47 to 68 dBA. Three sites (Receptors A08, A09, and A11) representing six multi-family residences are predicted to experience noise impacts due to levels approaching or exceeding the NAC under the future design year (2046) build condition. None of the sites are predicted to be impacted under the substantial increase criterion. Figure 1 in Appendix A shows CNE A.

Project No. 2G40-078 22
CNE B Future design year (2046) build noise levels are predicted to range from 59 to 64 dBA. Traffic noise impacts are not predicted for this CNE under the future design year (2046) build condition. Additionally, none of the sites are predicted to be impacted under the substantial increase criterion. Figure 1 in Appendix A shows CNE B.
NOTE-A grid system was not applied at the golf course since there were no impacts predicted in the future design year condition in this area.
CNE C Future design year (2046) build noise levels are predicted to range from 60 to 63 dBA. Traffic noise impacts are not predicted for this CNE under the future design year (2046) build condition. Additionally, none of the sites are predicted to be impacted under the substantial increase criterion. Figures 1, 2, and 3 in Appendix A show CNE C.
Alternative 1 CNE D Future design year (2046) build noise level is predicted to be 71 dBA. One site (Receptor D01) representing the playground of a day care center is predicted to experience noise impacts due to levels exceeding the NAC under the future design year (2046) build condition. Receptor D01 is not predicted to be impacted under the substantial increase criterion. Figure 2 in Appendix A shows CNE D under Alternative 1.
CNE E It is assumed that Receptor E01 will not exist under the Build Alternative 1 condition as the building this receptor represents may be demolished. Figure 2 in Appendix A shows CNE E under Alternative 1.
CNE F Future design year (2046) build noise levels are predicted to range from 54 to 60 dBA. There are no sites that are predicted to experience noise impacts due to levels approaching or exceeding the NAC under the future design year (2046) build condition. None of the sites are predicted to be impacted under the substantial increase criterion. Figure 2 in Appendix A shows CNE F under Alternative 1.
NOTE-A grid system was not applied at the golf course and the trail since there were no impacts predicted in the future design year condition in this area.
Alternative 2 CNE D Future design year (2046) build noise level is predicted to be 71 dBA. One site (Receptor D01) representing the playground of a day care center is predicted to experience noise impacts due to
Project No. 2G40-078 23
levels exceeding the NAC under the future design year (2046) build condition. Receptor D01 is not predicted to be impacted under the substantial increase criterion. Figure 3 in Appendix A shows CNE D under Alternative 2.
CNE E It is assumed that Receptor E01 may not exist under the Build Alternative 2 condition as the building this receptor represents is located within the 200-foot wide study corridor and may be demolished; however, efforts will be made during the design phase to minimize or avoid impacts. Figure 3 in Appendix A shows CNE E under Alternative 2.
CNE F Future design year (2046) build noise levels are predicted to range from 54 to 60 dBA. There are no sites that are predicted to experience noise impacts due to levels approaching or exceeding the NAC under the future design year (2046) build condition. None of the sites are predicted to be impacted under the substantial increase criterion. Figure 3 in Appendix A shows CNE F under Alternative 2.
NOTE-A grid system was not applied at the golf course and the trail since there were no impacts predicted in the future design year condition in this area.

Project No. 2G40-078 24
Table 4-1. Predicted Traffic Noise Levels – Alternative 1
Existing
Condition (2015)
Build Condition
(2046)
A01/ST1 B Residential 1 63 64 66 No A02 B Residential 2 54 55 64 No A03 B Residential 2 52 53 62 No A04 B Residential 2 50 51 60 No A05 B Residential 1 49 50 59 No A06 B Residential 1 56 57 66 No A07 B Residential 3 49 50 59 No A08 B Residential 2 67 68 66 Yes A09 B Residential 2 65 66 66 Yes
A10/LT1 B Residential 2 63 65 66 Yes A11 B Residential 2 64 66 66 Yes A12 B Residential 2 48 50 58 No A13 B Residential 2 46 47 56 No A14 B Residential 2 57 58 66 No A15 B Residential 2 62 64 66 No
B01 C Golf Course 1 62 64 66 No B02 C Golf Course 1 57 59 66 No B03 C Day Care 1 60 61 66 No B04 C Day Care 1 61 62 66 No B05 B Residential 1 61 62 66 No
B06/ST3 B Residential 3 63 64 66 No B07 B Residential 3 61 62 66 No B08 B Residential 1 59 60 66 No
C01 EOutdoor Use Area
1 60 60 70 No
C02 EOutdoor Use Area
1 60 61 70 No
C03 E Patio 1 63 63 71 No
D01/ST7 C Day Care 1 71 71 66 Yes
E01/LT2 EDeck
(3rd Story)1 63 --† 71 No
Abatement Considered
CNE A
Predicted Noise Levels (dBA)Receptor
NumberNAC Land Use
No. of Dwelling Units /
Recreational Units
Noise Abatement
Criteria*
CNE B
CNE C
CNE D
CNE E

Project No. 2G40-078 25
Table 4-1. Predicted Traffic Noise Levels – Alternative 1 (Cont’d)
Existing
Condition (2015)
Build Condition
(2046)
F01 C Trail 1 56 58 66 No F02 C Trail 1 56 58 66 No F03 C Trail 1 59 60 66 No F04 C Golf Course 1 52 54 62 No F05 C Golf Course 1 53 55 63 No
Existing Build 2 4
Existing Build Min -> 46 47Max -> 71 71
Notes:*
†
CNE F
Number of Impacted Sites
It is assumed this building may be demolished under the Build Alternative 1 Condition and this receptor will be located within the project right-of-way.
Range of Predicted Noise Levels
Criteria based on NAC or substantial increase, whichever is lower.Indicates noise impact.
Receptor Number
NAC Land Use
No. of Dwelling Units /
Recreational Units
Predicted Noise Levels (dBA) Noise
Abatement Criteria*
Abatement Considered

Project No. 2G40-078 26
Table 4-2. Predicted Traffic Noise Levels – Alternative 2
Existing Condition
(2015)
Build Condition
(2046)
A01/ST1 B Residential 1 63 64 66 No A02 B Residential 2 54 55 64 No A03 B Residential 2 52 53 62 No A04 B Residential 2 50 51 60 No A05 B Residential 1 49 50 59 No A06 B Residential 1 56 57 66 No A07 B Residential 3 49 50 59 No A08 B Residential 2 67 68 66 Yes A09 B Residential 2 65 66 66 Yes
A10/LT1 B Residential 2 63 65 66 Yes A11 B Residential 2 64 66 66 Yes A12 B Residential 2 48 50 58 No A13 B Residential 2 46 47 56 No A14 B Residential 2 57 58 66 No A15 B Residential 2 62 64 66 No
B01 C Golf Course 1 62 64 66 No B02 C Golf Course 1 57 59 66 No B03 C Day Care 1 60 61 66 No B04 C Day Care 1 61 62 66 No B05 B Residential 1 61 62 66 No
B06/ST3 B Residential 3 63 64 66 No B07 B Residential 3 61 62 66 No B08 B Residential 1 59 60 66 No
C01 EOutdoor Use Area
1 60 60 70 No
C02 EOutdoor Use Area
1 60 61 70 No
C03 E Patio 1 63 63 71 No
D01/ST7 C Day Care 1 71 71 66 Yes
E01/LT2 EDeck
(3rd Story)1 63 66† 71 No
CNE B
CNE E
Abatement Considered
CNE A
Receptor Number
NAC Land Use
No. of Dwelling Units /
Recreational Units
Predicted Noise Levels (dBA) Noise
Abatement Criteria*
CNE C
CNE D

Project No. 2G40-078 27
Table 4-2. Predicted Traffic Noise Levels – Alternative 2 (Cont’d)
Existing Condition
(2015)
Build Condition
(2046)
F01 C Trail 1 56 58 66 No F02 C Trail 1 56 58 66 No F03 C Trail 1 59 60 66 No F04 C Golf Course 1 52 54 62 No F05 C Golf Course 1 53 55 63 No
Existing Build 2 4
Existing Build Min -> 46 47Max -> 71 71
Notes:*
† This building is located within the 200-foot-wide study corridor and may be demolished under the Build Alternative 2 condition; however, efforts will be made during the design phase to minimize or avoid impacts.
CNE F
Number of Impacted Sites
Range of Predicted Noise Levels
Criteria based on NAC or substantial increase, whichever is lower.Indicates noise impact.
Noise Abatement
Criteria*
Abatement Considered
Receptor Number
NAC Land Use
No. of Dwelling Units /
Recreational Units
Predicted Noise Levels (dBA)

Project No. 2G40-078 28
4.2. Noise Abatement Determination The progression of noise abatement determination follows three phases where each must be considered and satisfied before proceeding further.
4.2.1. Warranted Criterion This first phase of the process is to determine if highway traffic noise abatement consideration is warranted for the affected land uses and/or the affected receptors. In order to make a determination that a noise impact exists, one of the following conditions must be met:
Predicted highway traffic noise levels (for the design year) approach or exceed the highway traffic noise abatement criteria in Table 2-1. “Approach” has been defined by VDOT as 1 dB below the noise abatement criteria.
A substantial noise increase has been defined by VDOT as a 10 dB increase above existing noise levels for all noise-sensitive exterior activity categories. A 10 dB increase in noise reflects the generally accepted range of a perceived doubling of the loudness.
Receptors that satisfy either of these conditions warrant consideration of highway traffic noise abatement.
4.2.2. Feasibility Criteria for Noise Barriers To determine feasibility of a highway traffic noise barrier, the following two conditions shall be considered:
At least a 5 dB highway traffic noise reduction at impacted receptors. Per 23 CFR 772, FHWA requires the highway agency to determine the number of impacted receptors required to achieve at least 5 dB of reduction. VDOT requires that fifty percent (50%) or more of the impacted receptors experience 5 dB or more of insertion loss to be feasible.
The determination that it is possible to design and construct the noise abatement measure. The factors related to the design and construction include: safety, barrier height, topography, drainage, utilities, and maintenance of the abatement measure, maintenance access to adjacent properties, and general access to adjacent properties (i.e. arterial widening projects).
4.2.3. Reasonableness Criteria for Noise Barriers Noise barrier reasonableness is determined by assessing multiple issues including:
The viewpoints of the benefited receptors;
Cost effectiveness value, based on a square foot cost ceiling (maximum square footage of abatement per benefited receptor); and

Project No. 2G40-078 29
Noise reduction design goal of 7 dB of insertion loss for at least one impacted receptor.
Typically, the limiting factor related to barrier reasonableness is the cost effectiveness value, where the total surface area of the barrier is divided by the number of benefited receptors receiving at least a 5 dB reduction in noise level. VDOT’s approved cost is based on a maximum square footage of abatement per benefited receptor. VDOT’s noise barrier cost effectiveness value is 1,600 square feet per benefited receptor.
4.3. Alternative Abatement Measures VDOT guidelines recommend a variety of mitigation measures that should be considered in response to transportation-related noise impacts. While noise barriers and/or earth berms are generally the most effective form of noise mitigation, additional mitigation measures exist that have the potential to provide considerable noise reductions, under certain circumstances. Mitigation measures considered for this project included:
Traffic management;
Alignment modifications;
Acoustical insulation of public use and non-profit facilities;
Buffer lands;
Construction of noise barriers; and
Construction of earth berms.
Additionally, the Noise Policy Code of Virginia (HB 2577, as amended by HB 2025) “Requires that whenever the Commonwealth Transportation Board or the Department plan for or undertake any highway construction or improvement project and such project includes or may include the requirement for the mitigation of traffic noise impacts, first consideration should be given to the use of noise reducing design and low noise pavement materials and techniques in lieu of construction of noise walls or sound barriers. Vegetative screening, such as the planting of appropriate conifers, in such a design would be utilized to act as a visual screen if visual screening is required. Consideration will be given to these measures during the final design stage, where feasible.
Each of the mitigation measures is further described below.
Traffic Control Measures (TCM): Traffic control measures, such as speed limit restrictions, truck traffic restrictions, and other traffic control measures that may be considered for the reduction of noise emission levels are not considered practical for this project. These traffic control measures would be counterproductive to the project’s objective of improving traffic flow, accessibility, and mobility in the area surrounding the Wiehle-Reston East Metrorail Station and

Project No. 2G40-078 30
reducing congestion and delay. Reducing speeds will not be an effective noise mitigation measure since a substantial decrease in speed is necessary to provide adequate noise reduction. Typically, a 10 mph reduction in speed will result in only a 2 dB decrease in noise level, which would not eliminate all impacts.
Alteration of Horizontal and Vertical Alignments: The alteration of the horizontal alignment has been considered in the screening process of the 2013 Feasibility Study to reduce or eliminate the impacts created by the proposed project.
Insulation: This noise abatement measure option applies only to public and institutional use buildings. Since no public use or institutional structures are anticipated to have interior noise levels exceeding FHWA’s interior NAC, this noise abatement option will not be applied.
Acquisition of Buffering Land: The purchase of property and/or buildings for noise barrier construction or the creation of a “buffer zone” to reduce noise impacts is only considered for predominantly unimproved properties because the amount of property required for this option to be effective would create significant additional impacts (e.g., in terms of residential and commercial displacements), which were determined to outweigh the benefits of land acquisition.
Construction of Noise Barriers / Berms: Construction of noise barriers can be an effective way to reduce noise levels at areas of outdoor activity. Noise barriers can be wall structures, earthen berms, or a combination of the two. The effectiveness of a noise barrier depends on the distance and elevation difference between roadway and receptor and the available placement location for a barrier.
Noise walls and earth berms are often implemented in the highway design in response to the identified traffic noise impacts. The effectiveness of a freestanding (post and panel) noise barrier and an earth berm of equivalent height are relatively consistent; however, an earth berm is perceived as a more aesthetically pleasing option.
In contrast, the use of earth berms is not always an option due to the excessive space they require adjacent to the roadway corridor. At a standard slope of 2:1, every one foot in height would require four feet of horizontal width. This requirement becomes more complex in urban settings where residential properties often abut the proposed roadway corridor. In these situations, implementation of earth berms can require significant property acquisitions to accommodate noise mitigation. The cost associated with the acquisition of property to construct a berm can significantly increase the total costs to implement this form of noise mitigation and make it unreasonable. Therefore, earth berms have not been considered for this project. Noise barriers considered for this project are noise walls.
As a general practice, noise barriers are most effective when placed at a relatively high point between the roadway and the impacted noise sensitive land use. To achieve the greatest benefit

Project No. 2G40-078 31
from a potential noise barrier, the goal of the barrier should focus on breaking the line-of-sight (to the greatest degree possible) from the roadway to the receptor.
The effectiveness of a noise barrier is measured by examining the barrier’s capability to reduce future noise levels. Noise reduction is measured by comparing design year pre- and post-barrier noise levels. This difference between unabated and abated noise levels is known as insertion loss (IL). The following discussion presents potential mitigation measures for each of the impacted noise sensitive land uses.
4.4. Noise Barriers Noise barriers in the form of noise walls were evaluated for areas predicted to experience traffic noise impacts in the Build Alternatives. Two noise barriers were evaluated under each alternative in this report. The evaluated noise barriers would all be ground mounted. Only one noise barrier for each alternative was determined to be feasible and reasonable in accordance with VDOT’s State Noise Abatement Policy. Figures 1 through 3 in Appendix A show the barrier locations as well as the lengths required to provide feasible and reasonable abatement. Figures 1 and 2 show Alternative 1 while Figures 1 and 3 show Alternative 2.
Tables 4-3 and 4-4 present an overview of the evaluated barrier parameters for Alternatives 1 and 2, respectively. Details of the barrier insertion loss associated with each evaluated barrier are listed in Tables 4-5 and 4-6 for Alternatives 1 and 2, respectively. Top-of-wall elevations for all noise barriers are shown in Appendix E. Warranted, Feasible, and Reasonableness Worksheets are located in Appendix F.
The following discussions present the noise abatement measures for each of the impacted CNE areas. Because CNE A through C are identical under both alternatives and have the same predicted traffic noise level results, the barrier for the impacted area of CNE A is only presented once. Furthermore, because all the parameters for Barrier D are identical except for achievable insertion loss between the two alternatives, Barrier D will also only be presented once. Barriers were not evaluated for CNEs B, C, E, and F because there were no traffic noise impacts within these CNEs and traffic noise abatement consideration is not warranted.
4.4.1. Barrier A – CNE A – Alternatives 1 and 2 Barrier A would be located at the southwest corner of the intersection of Sunrise Valley Drive and Soapstone Drive within CNE A. Barrier A would be at the right-of-way along eastbound Sunrise Valley Drive and wrap around southbound Soapstone Drive. At the corner of the intersection, Barrier A cuts through private property to provide line-of-sight to eastbound traffic. Barrier A would have a height of 10 to 12 feet and an approximate total length of 414 feet, resulting in a total surface area of 4,684 square feet. With an assumed cost per square foot of
Project No. 2G40-078 32
$42, which is the statewide average in Virginia, the estimated cost of Barrier A would be $196,728. Figure 1 in Appendix A shows Barrier A.
Barrier A would provide feasible abatement for the three impacted Receptors A08, A09, and A11, which represent six multi-family residences. Two additional residences were added to the benefited residences since non-impacted Receptor A10 was able to attain a reduction in predicted future traffic noise levels of at least 5 dB. An overview of the evaluated barrier parameters and analysis calculations is shown in Tables 4-3 and 4-4 for Alternatives 1 and 2, respectively. Details of the barrier analysis including barrier insertion losses are listed in Tables 4-5 and 4-6 for Alternatives 1 and 2 respectively.
This barrier would provide feasible abatement for at least 50% of impacted receivers, meets the noise reduction design goal of 7 dB for at least one impacted receptor, and has a square feet per benefited receptor value of 586, which is less than 1,600; therefore, Barrier A would be both feasible and reasonable in accordance with VDOT’s State Noise Abatement Policy.
The total number of receptors and frequent outdoor use areas used for feasibility and reasonableness calculations are presented in Appendix F within the Warranted, Feasible, and Reasonableness Worksheet.
4.4.2. Barrier D – CNE D – Alternatives 1 and 2 Barrier D would be located along the edge of shoulder of westbound DTR. Barrier D has a height of 12 feet and an approximate total length of 366 feet, resulting in a total surface area of 4,392 square feet. The estimated cost of Barrier D would be $184,464. Figures 2 and 3 in Appendix A show Barrier D under Alternatives 1 and 2, respectively.
Barrier D would provide feasible abatement for impacted Receptor D01. An overview of the evaluated barrier parameters and analysis calculations is shown in Tables 4-3 and 4-4 for Alternatives 1 and 2, respectively. Details of the barrier analysis including barrier insertion losses are listed in Tables 4-5 and 4-6 for Alternatives 1 and 2 respectively.
This barrier would provide feasible abatement for at least 50% of impacted receptors and meets the noise reduction design goal of 7 dB for the one impacted receptor; however, since there is only one benefited land use within the evaluation limit, the square feet per benefited receptor value would be 4,392, which is greater than 1,600. Therefore, Barrier D would be feasible but not reasonable based on cost effectiveness in accordance with VDOT’s State Noise Abatement Policy.
The total number of receptors and frequent outdoor use areas used for feasibility and reasonableness calculations are presented in Appendix F within the Warranted, Feasible, and Reasonableness Worksheet.
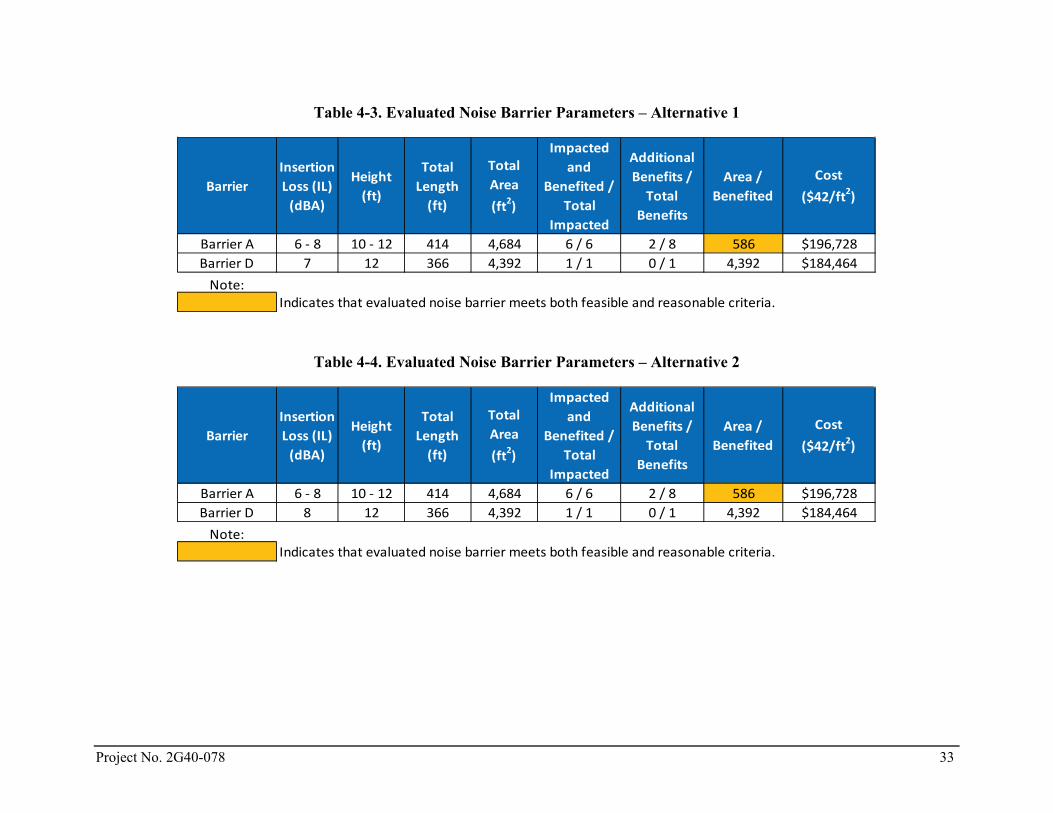
Project No. 2G40-078 33
Table 4-3. Evaluated Noise Barrier Parameters – Alternative 1
Table 4-4. Evaluated Noise Barrier Parameters – Alternative 2
BarrierInsertion Loss (IL)
(dBA)
Height (ft)
Total Length
(ft)
Total Area (ft2)
Impacted and
Benefited / Total
Impacted
Additional Benefits /
Total Benefits
Area / Benefited
Cost ($42/ft2)
Barrier A 6 - 8 10 - 12 414 4,684 6 / 6 2 / 8 586 $196,728Barrier D 7 12 366 4,392 1 / 1 0 / 1 4,392 $184,464
Note:Indicates that evaluated noise barrier meets both feasible and reasonable criteria.
BarrierInsertion Loss (IL)
(dBA)
Height (ft)
Total Length
(ft)
Total Area (ft2)
Impacted and
Benefited / Total
Impacted
Additional Benefits /
Total Benefits
Area / Benefited
Cost ($42/ft2)
Barrier A 6 - 8 10 - 12 414 4,684 6 / 6 2 / 8 586 $196,728Barrier D 8 12 366 4,392 1 / 1 0 / 1 4,392 $184,464
Note:Indicates that evaluated noise barrier meets both feasible and reasonable criteria.

Project No. 2G40-078 34
Table 4-5. Predicted Noise Barrier Insertion Loss – Alternative 1
Level IL* Level IL* Level IL* Level IL* Level IL* Level IL* Level IL*
A08 68 61 7 60 8 60 8 59 9 59 9 58 10 58 10 A09 66 60 6 59 7 58 8 57 9 57 9 56 10 56 10
A10/LT1 65 59 5 58 6 57 7 57 8 56 8 56 9 56 9 A11 66 61 5 60 6 60 6 60 6 59 7 59 7 59 7
D01/ST7 71 65 6 65 6 63 7 63 8 62 8 62 8 62 9Notes:
*
Denotes predicted noise impact.Denotes benefit.
Receptor Number
Build Condition (2046) - With BarrierPredicted Noise Levels (dBA)
Predicted Insertion Losses (IL) may be different than the no barrier noise level minus the level with barrier due to rounding.
Denotes benefit and recommended barrier height.
8ft 10ft 12ft 14ft
Barrier A
Barrier D
20ft16ft 18ftBuild
Condition (2046) - No
Barrier

Project No. 2G40-078 35
Table 4-6. Predicted Noise Barrier Insertion Loss – Alternative 2
Level IL* Level IL* Level IL* Level IL* Level IL* Level IL* Level IL*
A08 68 61 7 60 8 60 8 59 9 59 9 58 10 58 10 A09 66 60 6 59 7 58 8 57 9 57 9 56 10 56 10
A10/LT1 65 59 5 58 6 57 7 57 8 56 8 56 9 56 9 A11 66 61 5 60 6 60 6 60 6 59 7 59 7 59 7
D01/ST7 71 65 6 64 6 63 8 62 8 62 9 62 9 62 9Notes:
*
16ft 18ft
Predicted Insertion Losses (IL) may be different than the no barrier noise level minus the level with barrier due to rounding.
Denotes benefit.Denotes benefit and recommended barrier height.
20ft
Barrier A
Barrier D
Denotes predicted noise impact.
Receptor Number
Predicted Noise Levels (dBA)
Build Condition
(2046) - No Barrier
Build Condition (2046) - With Barrier8ft 10ft 12ft 14ft

Project No. 2G40-078 36
THIS PAGE INTENTIONALLY LEFT BLANK

Project No. 2G40-078 37
5 Construction Noise
VDOT is also concerned with noise generated during the construction phase of the proposed project since noise from construction activities may intermittently dominate the noise environment in the immediate area of construction. The degree of construction noise impact will vary, as it is directly related to the types and number of equipment used and the proximity to the noise-sensitive land uses within the project area. Land uses that are sensitive to traffic noise are also potentially considered to be sensitive to construction noise. Any construction noise impacts that do occur as a result of roadway construction measures are anticipated to be temporary in nature and will cease upon completion of the project construction phase.
A method of controlling construction noise is to establish the maximum level of noise that construction operations can generate. In view of this, VDOT has developed and FHWA has approved a specification that establishes construction noise limits. This specification can be located in VDOT's 2016 Road and Bridge Specifications, Section 107.16(b.3), “Noise”. The contractor will be required to conform to this specification to reduce the impact of construction noise on the surrounding community.
The specifications have been reproduced below:
The Contractor’s operations shall be performed so that exterior noise levels measured during a noise-sensitive activity shall not exceed 80 decibels. Such noise level measurements shall be taken at a point on the perimeter of the construction limit that is closest to the adjoining property on which a noise-sensitive activity is occurring. A noise-sensitive activity is any activity for which lowered noise levels are essential if the activity is to serve its intended purpose and not present an unreasonable public nuisance. Such activities include, but are not limited to, those associated with residences, hospitals, nursing homes, churches, schools, libraries, parks, and recreational areas.
VDOT may monitor construction-related noise. If construction noise levels exceed 80 decibels during noise-sensitive activities, the Contractor shall take corrective action before proceeding with operations. The Contractor shall be responsible for costs associated with the abatement of construction noise and the delay of operations attributable to noncompliance with these requirements.
VDOT may prohibit or restrict certain portions of the project any work that produces objectionable noise between 10 PM and 6 AM. If other hours are established by local ordinance, the local ordinance shall govern.
Equipment shall in no way be altered so as to result in noise levels that are greater than those produced by the original equipment.
Project No. 2G40-078 38
When feasible, the Contractor shall establish haul routes that direct his vehicles away from developed areas and ensure that noise from hauling operations is kept to a minimum.
These requirements shall not be applicable if the noise produced by sources other than the Contractor’s operation at the point of reception is greater than the noise from the Contractor’s operation at the same point.

Project No. 2G40-078 39
6 Public Involvement Process
FHWA and VDOT policies require that VDOT provides certain information to local officials within whose jurisdiction the highway project is located to minimize future traffic noise impacts of Type I projects on currently undeveloped lands (Type I projects involve highway improvements with noise analysis). This information must include information on noise-compatible land-use planning and noise impact zones in undeveloped land in the highway project corridor. This section of the report provides that information, as well as information about VDOT’s noise abatement program.
6.1. Noise-Compatible Land-Use Planning Sections 12.1 and 12.2 of VDOT’s 2011 Highway Traffic Noise Impact Analysis Guidance Manual outline VDOT’s approach to communication with local officials and provide information and resources on highway noise and noise-compatible land-use planning. VDOT’s intention is to assist local officials in planning the uses of undeveloped land adjacent to highways to minimize the potential impacts of highway traffic noise.
Entering the Quiet Zone is a brochure that provides general information and examples to elected officials, planners, developers, and the general public about the problem of traffic noise and effective responses to it. A link to this brochure on FHWA’s website is provided:
http://www.fhwa.dot.gov/environment/noise/noise_compatible_planning/federal_approach/land_use/qz00.cfm
A wide variety of administrative strategies may be used to minimize or eliminate potential highway noise impacts, thereby preventing the need or desire for costly noise abatement structures such as noise barriers in future years. There are five broad categories of such strategies:
Zoning,
Other legal restrictions (subdivision control, building codes, health codes),
Municipal ownership or control of the land,
Financial incentives for compatible development, and
Educational and advisory services.
The Audible Landscape: A Manual for Highway and Land Use is a very well-written and comprehensive guide addressing these noise-compatible land use planning strategies, with significant detailed information. This document is available through FHWA’s Website, at
http://www.fhwa.dot.gov/environment/noise/noise_compatible_planning/federal_approach/audible_landscape/al00.cfm

Project No. 2G40-078 40
Noise Impact Zones in Undeveloped Land along the Study Corridor
Also required under the revised 2011 FHWA and VDOT noise policies is information on the noise impact zones adjacent to project roadways in undeveloped lands. To determine these zones, noise levels are computed at various distances from the edge of the project roadways in each of the undeveloped areas of the project study area. Then, the distances from the edge of the roadway to the NAC sound levels are determined through interpolation. Distances vary in the project corridor due to changes in traffic volumes or terrain features. Any noise sensitive sites within these zones should be considered noise impacted if no barrier is present to reduce sound levels. The figures in Appendix A show the predicted 66 dBA contours for the project.
6.2. Public Involvement Efforts For noise barriers determined to be feasible and reasonable, the affected public will be given an opportunity to decide whether they are in favor of construction of the noise barrier. A final determination as to the construction of barriers will be made after the public hearing process. As part of the final design noise analysis, for barriers that are determined to be feasible and reasonable, input from the impacted property owners and renters must be obtained through citizen surveys via certified mail. Of the votes tallied, 50% or more must be in favor of a proposed noise barrier in order for that barrier to be considered further.
Upon completion of the citizen survey, the VDOT Noise Abatement staff which will make recommendations to the Chief Engineer for approval. Approved barriers will be incorporated into the road project plans. A technical memorandum (noise barrier survey addendum report) will be prepared after the voting process has been completed, which documents the voting results and summary of public comments of the noise barrier public survey process.
Project No. 2G40-078 41
7 References
23 CFR Part 772, 2016. Procedures for Abatement of Highway Traffic Noise and Construction Noise, 23 Codes of Federal Regulations, Part 772, July.
FHWA, 2004. U.S. Department of Transportation, FHWA Traffic Noise Model, TNM 2.5, Report No. FHWA–PD–96–010, Revision No. 1, April.
FHWA, 2011. U.S. Department of Transportation, FHWA Highway Traffic Noise Analysis and Abatement Policy and Guidance, December.
VDOT, 2015a. Highway Traffic Noise Impact Analysis Guidance Manual. Virginia Department of Transportation. Version No. 7. July.
VDOT, 2015b. Noise Report Development and Guidance Document. Virginia Department of Transportation. Version No. 5. August.
VDOT, 2016. Road and Bridge Specifications, Section 107.16(b.3), “Noise”. Virginia Department of Transportation.

Project No. 2G40-078 42
8 List of Preparers
Greg Berg, Senior Noise Control Specialist. Bachelor of Arts, Acoustics, Columbia College Chicago, Chicago, IL; 12 years of experience in environmental noise and vibration analysis. Contribution: Lead author of Noise Analysis Technical Report. Performed all traffic noise analysis, noise barrier design, and quality assurance/quality control.
Areg Gharabegian, Principal Project Manager. Master of Science, Energy, Resources, and Environment, George Washington University, Washington, D.C.; 37 years of experience in environmental and transportation noise and vibration analysis. Contribution: Conducted review and quality control for the Noise Analysis Technical Report.