non-potable water reuse as a demand management option for ... · non-potable water reuse as a...
TRANSCRIPT
Thames Water
Non-Potable Water Reuse as a
Demand Management Option for
WRMP19
Options Appraisal Report
Issue | 9 June 2017
This report takes into account the particular
instructions and requirements of our client.
It is not intended for and should not be relied
upon by any third party and no responsibility
is undertaken to any third party.
Ove Arup & Partners Ltd
13 Fitzroy Street
London
W1T 4BQ
United Kingdom
www.arup.com
Thames Water Non-Potable Water Reuse as a Demand Management Option for WRMP19Options Appraisal Report
Issue | 9 June 2017
Project Team
The project was delivered by a consortium of
Organisation Role
Arup Project Manager / Technical / Modelling
AECOM Planning / Technical
Aquality Industry input / Commercials
SHSWS Regulations / Governance
Report Review
Report version Authors Reviews Signoff
Draft 1 Martin Shouler (MS)
Siraj Tahir (ST)
Mike Henderson (MH)
Melinda Davies (MD)
Lutz Johnen (LJ)
Sian Hills (SH)
Martin Shouler (MS)
ST, MH, MD, LJ, SH
MS
Draft 2 MS, ST, MH, MD, LJ MS, ST, MH, LJ MS
Draft 3 MS, ST, MH, LJ MS, ST, MH, LJ, SH MS
Issue MS, ST, MH, LJ MS, ST, MH, LJ MS
Disclaimer - Information class
Forecasts and assessment are based on information available at the time of the
report, and don’t include:
• Forecast impact of future inflation on costs, such as energy, labour, materials.
• Future or upcoming changes in regulations.
Thames Water Non-Potable Water Reuse as a Demand Management Option for WRMP19Options Appraisal Report
Issue | 9 June 2017
Contents Page
1 Introduction 1
2 Background 3
2.1 Potable and Non-Potable Water Use 3
2.2 Non-Potable Water Sources 3
2.3 Non-Potable Water Systems 4
2.4 Regulatory Requirements for NPWR Systems 5
2.5 Co-Benefits of NPWR 5
3 Methodology 7
3.1 Overview 7
3.2 Stage Criteria 7
3.3 Stage A Methodology – Available Yield 8
3.4 Stage B – Technical Yield 11
3.5 Stage C – Allowable Yield 16
3.6 Stage D – Economically Effective Yield 20
4 Options Appraisal 23
4.1 Stage A – Available Yield Options Appraisal 23
4.2 Stage B – Technical Yield Options Appraisal 26
4.3 Stage C – Allowable Yield Options Appraisal 28
4.4 Stage D – Economically Effective Yield Options Appraisal 32
5 Summary & Conclusions 36
Appendix A
Installation and Performance Review of Systems
Appendix B
Regulations, Standards and Policies
Appendix C
Governance and Perception Review
Appendix D
Detailed Methodology
Appendix E
Case Studies
Thames Water Non-Potable Water Reuse as a Demand Management Option for WRMP19Options Appraisal Report
Issue | 9 June 2017 Page i
List of Abbreviations and Glossary
Term / Acronym Description / Explanation
BCIS Building Cost Information Services
Blackwater Water from foul drainage system
BRE Building Research Establishment
BREEAM BRE Environmental Assessment Method
Brownfield land Land that has previously been built upon
BSI British Standards Institute
BWR Blackwater Reuse
CAPEX Capital Expenditure
CfSH Code for Sustainable Homes (now abrogated)
CIRIA Construction Industry Research and Information Association
DMA District Metering Area
DWI Drinking Water Inspectorate
EA Environment Agency
GFA Gross Floor Area
GIS Geographic Information Systems
GLA Greater London Authority
Greenfield land Land that has not been previously built upon
Greywater Water from showers, sinks and washing machines
GWR Greywater Reuse
IDM model Integrated Demand Management model
Inset Appointee Company replacing the incumbent as monopoly provider of water and /
or sewerage services on new developments level
ISO International Standards Organisation
LPA Local Planning Authority
MUSCo Multi Utility Service Company
NIA Net Internal Area
Non-potable water Water treated to non-potable standards. For this project it is limited to
Rainwater, Stormwater, and Greywater
NPWR Non-potable water reuse
NRM New Rules of Measurement (by RCIS)
OFWAT Water Services Regulation Authority
OPEX Operational Expenditure
OA Opportunity area
Rainwater Water captured primarily from roof surfaces

Thames Water Non-Potable Water Reuse as a Demand Management Option for WRMP19Options Appraisal Report
Issue | 9 June 2017 Page ii
Term / Acronym Description / Explanation
RCIS Royal Chartered Institute of Surveyors
RWH Rainwater Harvesting
SHLAA Strategic Housing Land Availability Assessment
Stormwater Water captured primarily from ground surfaces
SWH Stormwater harvesting
SuDS Sustainable Drainage Systems
TOTEX Total Expenditure
WaSCo Independent Water and Sewerage Services Company (a third party
operator similar to a MUSCo)
WRAS Water Regulations Advisory Scheme
WRMP Water Resource Management Plan
Thames Water Non-Potable Water Reuse as a Demand Management Option for WRMP19Options Appraisal Report
Issue | 9 June 2017 Page i
Executive Summary
The predicted growth of London’s population, coupled with expected changes to the climate and the
need to take less water from the environment, means that Thames Water projects a gap between
supply and demand for water of around 414 million litres per day (Ml/d) by 2040. Thames Water is
exploring a range of options for its Water Resources Management Plan (WRMP19) that will increase
supply and reduce the demand for water to close this gap.
One of the options being considered to reduce the demand for potable water is non-potable water
reuse (NPWR). This is the use of water that does not require being of drinking water quality for non-
potable uses such as toilet flushing, laundry and garden irrigation. The water for NPWR can come
from a number of sources – rainwater, stormwater, greywater and blackwater.
This study focuses on the feasibility, costs and benefits of incorporating NPWR opportunities in new
development. The outcomes of this study will be inputted in the Integrated Demand Management
(IDM) model as part of the WRMP19 programme appraisal modelling.
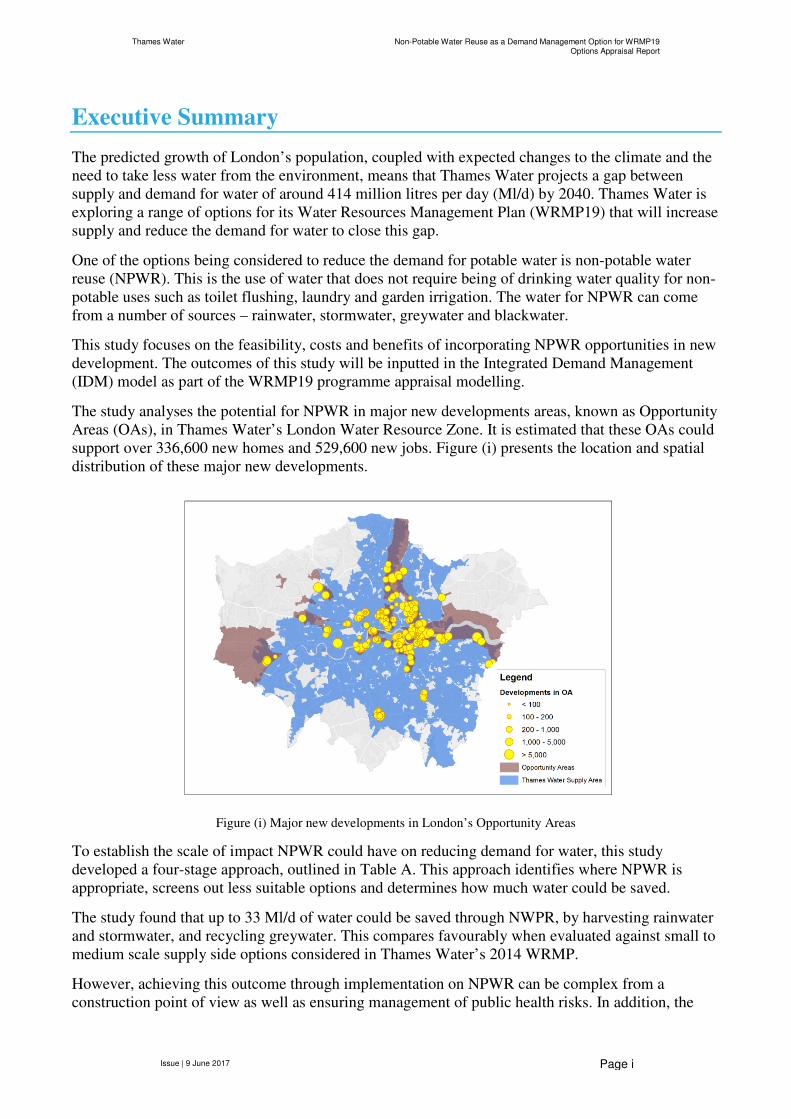
The study analyses the potential for NPWR in major new developments areas, known as Opportunity
Areas (OAs), in Thames Water’s London Water Resource Zone. It is estimated that these OAs could
support over 336,600 new homes and 529,600 new jobs. Figure (i) presents the location and spatial
distribution of these major new developments.
Figure (i) Major new developments in London’s Opportunity Areas
To establish the scale of impact NPWR could have on reducing demand for water, this study
developed a four-stage approach, outlined in Table A. This approach identifies where NPWR is
appropriate, screens out less suitable options and determines how much water could be saved.
The study found that up to 33 Ml/d of water could be saved through NWPR, by harvesting rainwater
and stormwater, and recycling greywater. This compares favourably when evaluated against small to
medium scale supply side options considered in Thames Water’s 2014 WRMP.
However, achieving this outcome through implementation on NPWR can be complex from a
construction point of view as well as ensuring management of public health risks. In addition, the
Thames Water Non-Potable Water Reuse as a Demand Management Option for WRMP19Options Appraisal Report
Issue | 9 June 2017 Page ii
delivery of NPWR will require cooperation of multiple organisations, such as Local Authority,
Thames Water, the developers, and the eventual operators of NPWR systems.
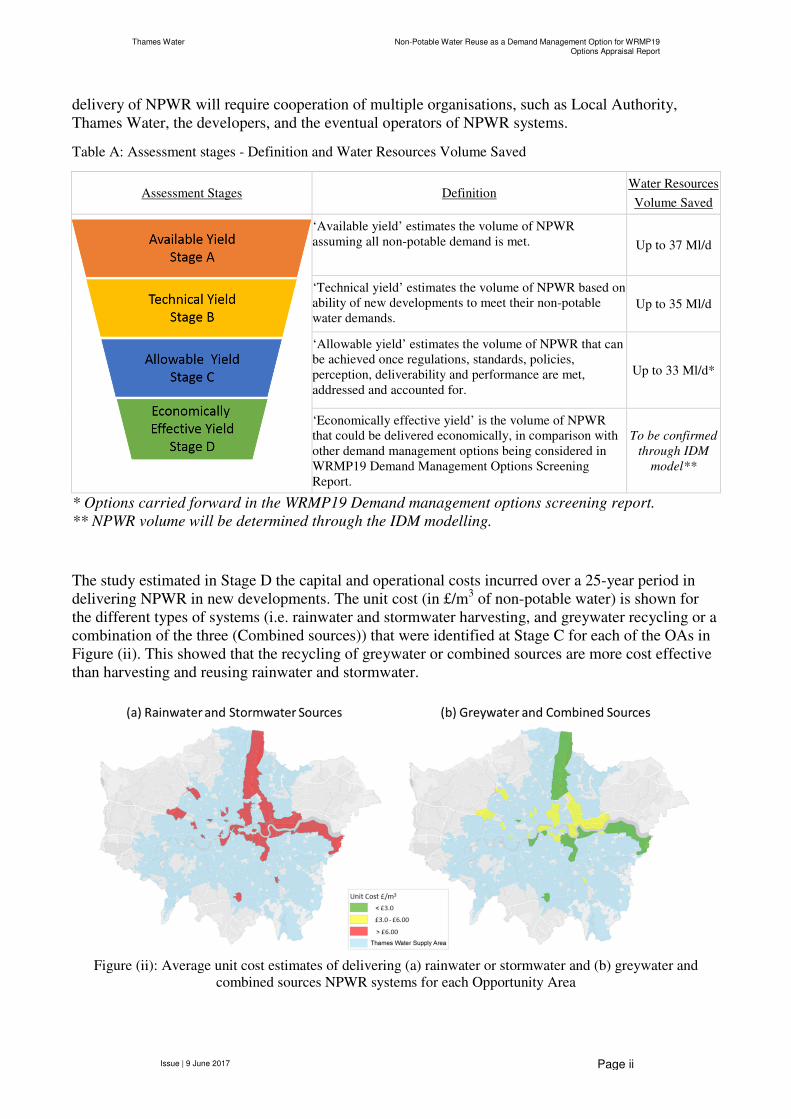
Table A: Assessment stages - Definition and Water Resources Volume Saved
Assessment Stages Definition Water Resources
Volume Saved
‘Available yield’ estimates the volume of NPWR
assuming all non-potable demand is met. Up to 37 Ml/d
‘Technical yield’ estimates the volume of NPWR based on
ability of new developments to meet their non-potable
water demands. Up to 35 Ml/d
‘Allowable yield’ estimates the volume of NPWR that can
be achieved once regulations, standards, policies,
perception, deliverability and performance are met,
addressed and accounted for.
Up to 33 Ml/d*
‘Economically effective yield’ is the volume of NPWR
that could be delivered economically, in comparison with
other demand management options being considered in
WRMP19 Demand Management Options Screening
Report.
To be confirmed
through IDM
model**
* Options carried forward in the WRMP19 Demand management options screening report.
** NPWR volume will be determined through the IDM modelling.
The study estimated in Stage D the capital and operational costs incurred over a 25-year period in
delivering NPWR in new developments. The unit cost (in £/m3 of non-potable water) is shown for
the different types of systems (i.e. rainwater and stormwater harvesting, and greywater recycling or a
combination of the three (Combined sources)) that were identified at Stage C for each of the OAs in
Figure (ii). This showed that the recycling of greywater or combined sources are more cost effective
than harvesting and reusing rainwater and stormwater.
Figure (ii): Average unit cost estimates of delivering (a) rainwater or stormwater and (b) greywater and
combined sources NPWR systems for each Opportunity Area
Thames Water Non-Potable Water Reuse as a Demand Management Option for WRMP19Options Appraisal Report
Issue | 9 June 2017 Page iii
Note: To be consistent with WRMP19 methodology, options that are mutually exclusives and are least cost efficient
were not inputted into the IDM model. Combined sources NPWR systems are mutually exclusive with RWH, SWH and
RWH and more cost efficient.
In addition to its potential to manage demand for water, NPWR can deliver further co-benefits in
comparison to a business as usual approach. These include:
• Providing more headroom in water supply and drainage networks due to reduced peak demand;
• Deferring or avoiding infrastructure reinforcements to meet the increase in demand from new
developments;
• Reducing surface water flood risk due to capturing and using rain and stormwater onsite.
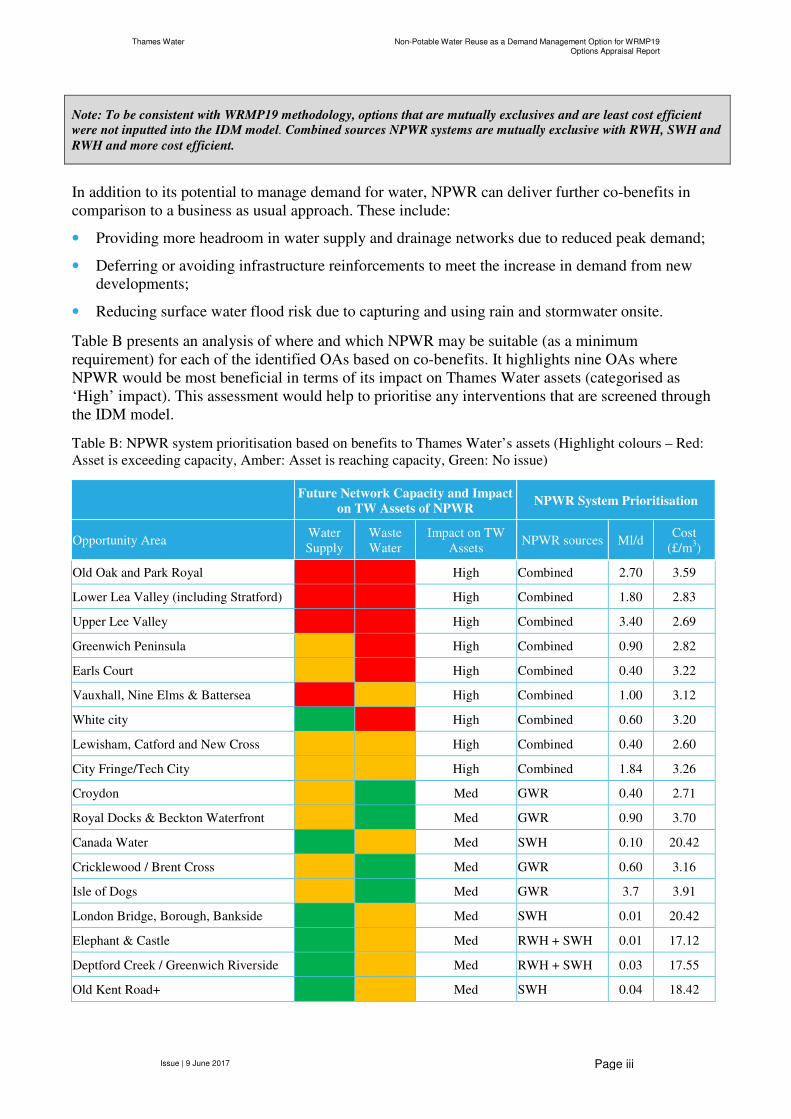
Table B presents an analysis of where and which NPWR may be suitable (as a minimum
requirement) for each of the identified OAs based on co-benefits. It highlights nine OAs where
NPWR would be most beneficial in terms of its impact on Thames Water assets (categorised as
‘High’ impact). This assessment would help to prioritise any interventions that are screened through
the IDM model.
Table B: NPWR system prioritisation based on benefits to Thames Water’s assets (Highlight colours – Red:
Asset is exceeding capacity, Amber: Asset is reaching capacity, Green: No issue)
Future Network Capacity and Impact
on TW Assets of NPWR NPWR System Prioritisation
Opportunity Area Water
Supply
Waste
Water
Impact on TW
Assets NPWR sources Ml/d
Cost
(£/m3)
Old Oak and Park Royal High Combined 2.70 3.59
Lower Lea Valley (including Stratford) High Combined 1.80 2.83
Upper Lee Valley High Combined 3.40 2.69
Greenwich Peninsula High Combined 0.90 2.82
Earls Court High Combined 0.40 3.22
Vauxhall, Nine Elms & Battersea High Combined 1.00 3.12
White city High Combined 0.60 3.20
Lewisham, Catford and New Cross High Combined 0.40 2.60
City Fringe/Tech City High Combined 1.84 3.26
Croydon Med GWR 0.40 2.71
Royal Docks & Beckton Waterfront Med GWR 0.90 3.70
Canada Water Med SWH 0.10 20.42
Cricklewood / Brent Cross Med GWR 0.60 3.16
Isle of Dogs Med GWR 3.7 3.91
London Bridge, Borough, Bankside Med SWH 0.01 20.42
Elephant & Castle Med RWH + SWH 0.01 17.12
Deptford Creek / Greenwich Riverside Med RWH + SWH 0.03 17.55
Old Kent Road+ Med SWH 0.04 18.42
Thames Water Non-Potable Water Reuse as a Demand Management Option for WRMP19Options Appraisal Report
Issue | 9 June 2017 Page iv
Future Network Capacity and Impact
on TW Assets of NPWR NPWR System Prioritisation
Opportunity Area Water
Supply
Waste
Water
Impact on TW
Assets NPWR sources Ml/d
Cost
(£/m3)
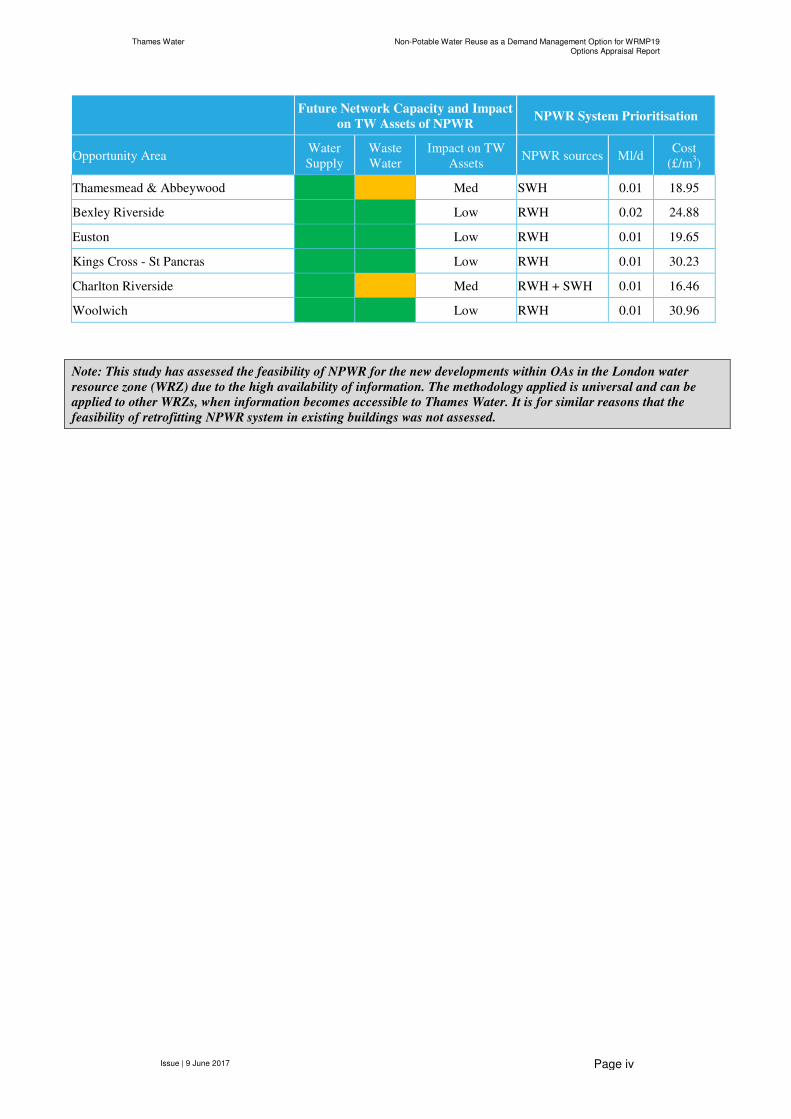
Thamesmead & Abbeywood Med SWH 0.01 18.95
Bexley Riverside Low RWH 0.02 24.88
Euston Low RWH 0.01 19.65
Kings Cross - St Pancras Low RWH 0.01 30.23
Charlton Riverside Med RWH + SWH 0.01 16.46
Woolwich Low RWH 0.01 30.96
Note: This study has assessed the feasibility of NPWR for the new developments within OAs in the London water
resource zone (WRZ) due to the high availability of information. The methodology applied is universal and can be
applied to other WRZs, when information becomes accessible to Thames Water. It is for similar reasons that the
feasibility of retrofitting NPWR system in existing buildings was not assessed.
Thames Water Non-Potable Water Reuse as a Demand Management Option for WRMP19Options Appraisal Report
Issue | 9 June 2017
Page 1
1 Introduction
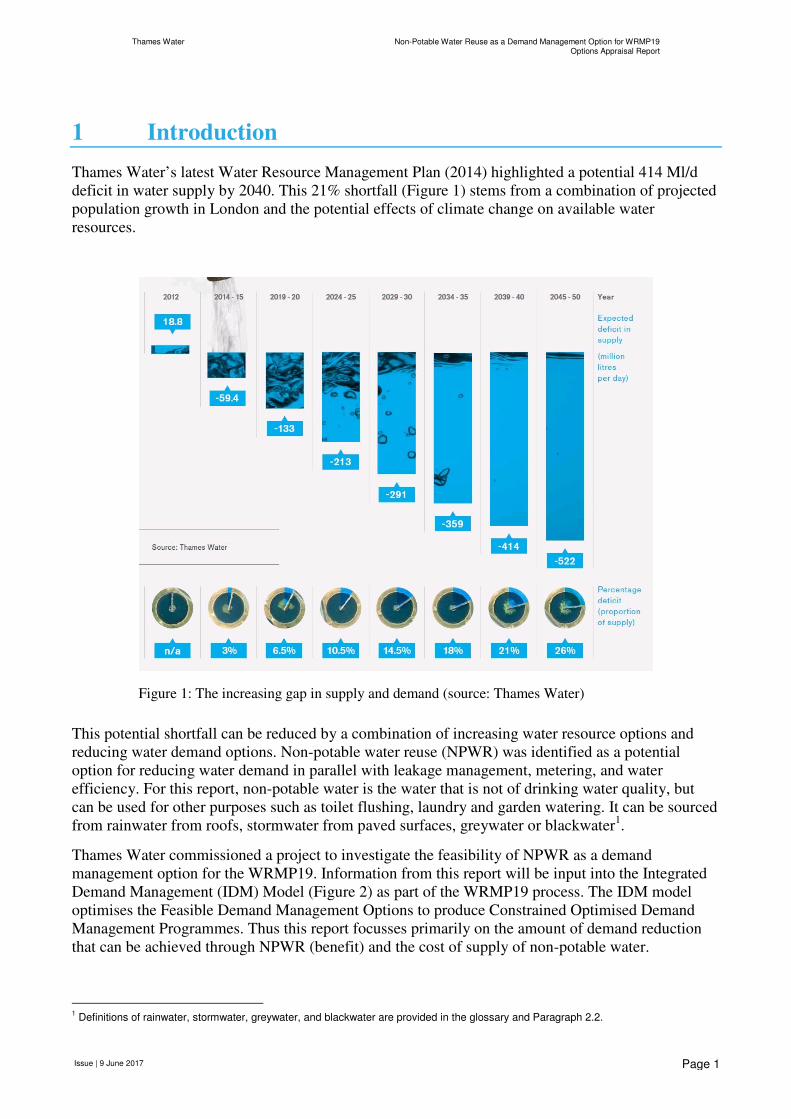
Thames Water’s latest Water Resource Management Plan (2014) highlighted a potential 414 Ml/d
deficit in water supply by 2040. This 21% shortfall (Figure 1) stems from a combination of projected
population growth in London and the potential effects of climate change on available water
resources.
This potential shortfall can be reduced by a combination of increasing water resource options and
reducing water demand options. Non-potable water reuse (NPWR) was identified as a potential
option for reducing water demand in parallel with leakage management, metering, and water
efficiency. For this report, non-potable water is the water that is not of drinking water quality, but
can be used for other purposes such as toilet flushing, laundry and garden watering. It can be sourced
from rainwater from roofs, stormwater from paved surfaces, greywater or blackwater1.
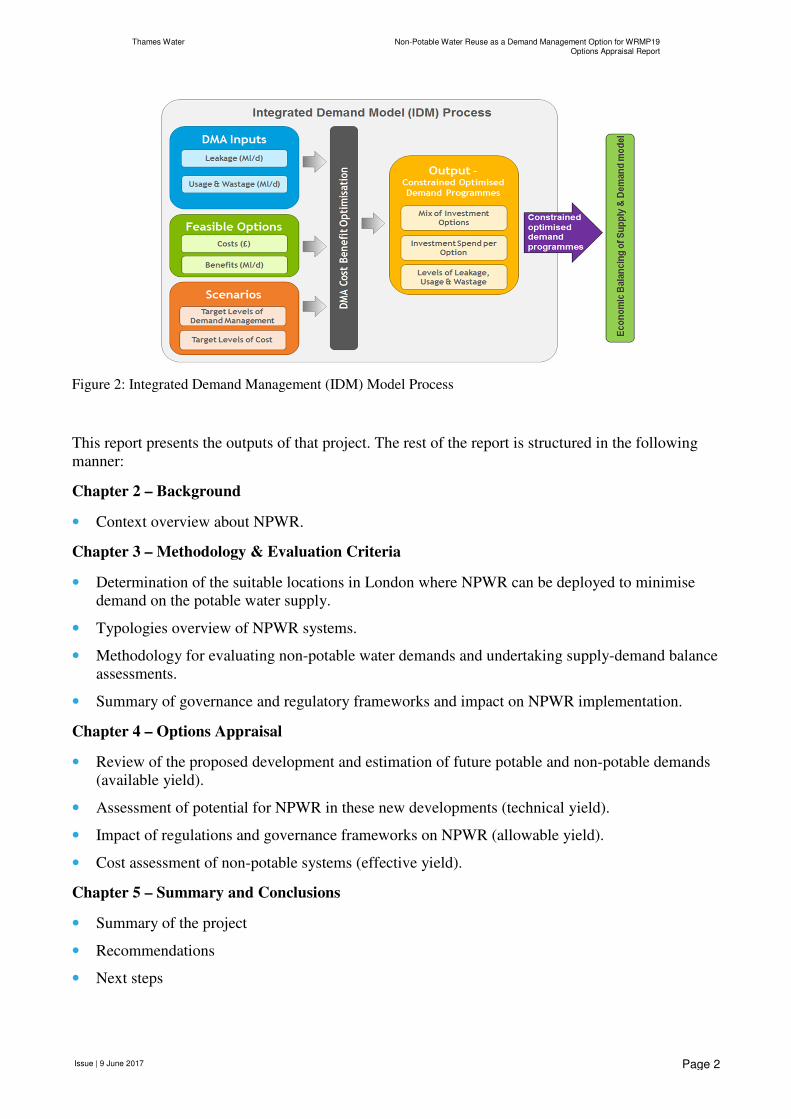
Thames Water commissioned a project to investigate the feasibility of NPWR as a demand
management option for the WRMP19. Information from this report will be input into the Integrated
Demand Management (IDM) Model (Figure 2) as part of the WRMP19 process. The IDM model
optimises the Feasible Demand Management Options to produce Constrained Optimised Demand
Management Programmes. Thus this report focusses primarily on the amount of demand reduction
that can be achieved through NPWR (benefit) and the cost of supply of non-potable water.
1 Definitions of rainwater, stormwater, greywater, and blackwater are provided in the glossary and Paragraph 2.2.
Figure 1: The increasing gap in supply and demand (source: Thames Water)
Thames Water Non-Potable Water Reuse as a Demand Management Option for WRMP19Options Appraisal Report
Issue | 9 June 2017
Page 2
Figure 2: Integrated Demand Management (IDM) Model Process
This report presents the outputs of that project. The rest of the report is structured in the following
manner:
Chapter 2 – Background
• Context overview about NPWR.
Chapter 3 – Methodology & Evaluation Criteria
• Determination of the suitable locations in London where NPWR can be deployed to minimise
demand on the potable water supply.
• Typologies overview of NPWR systems.
• Methodology for evaluating non-potable water demands and undertaking supply-demand balance
assessments.
• Summary of governance and regulatory frameworks and impact on NPWR implementation.
Chapter 4 – Options Appraisal
• Review of the proposed development and estimation of future potable and non-potable demands
(available yield).
• Assessment of potential for NPWR in these new developments (technical yield).
• Impact of regulations and governance frameworks on NPWR (allowable yield).
• Cost assessment of non-potable systems (effective yield).
Chapter 5 – Summary and Conclusions
• Summary of the project
• Recommendations
• Next steps
Thames Water Non-Potable Water Reuse as a Demand Management Option for WRMP19Options Appraisal Report
Issue | 9 June 2017
Page 3
2 Background
2.1 Potable and Non-Potable Water Use
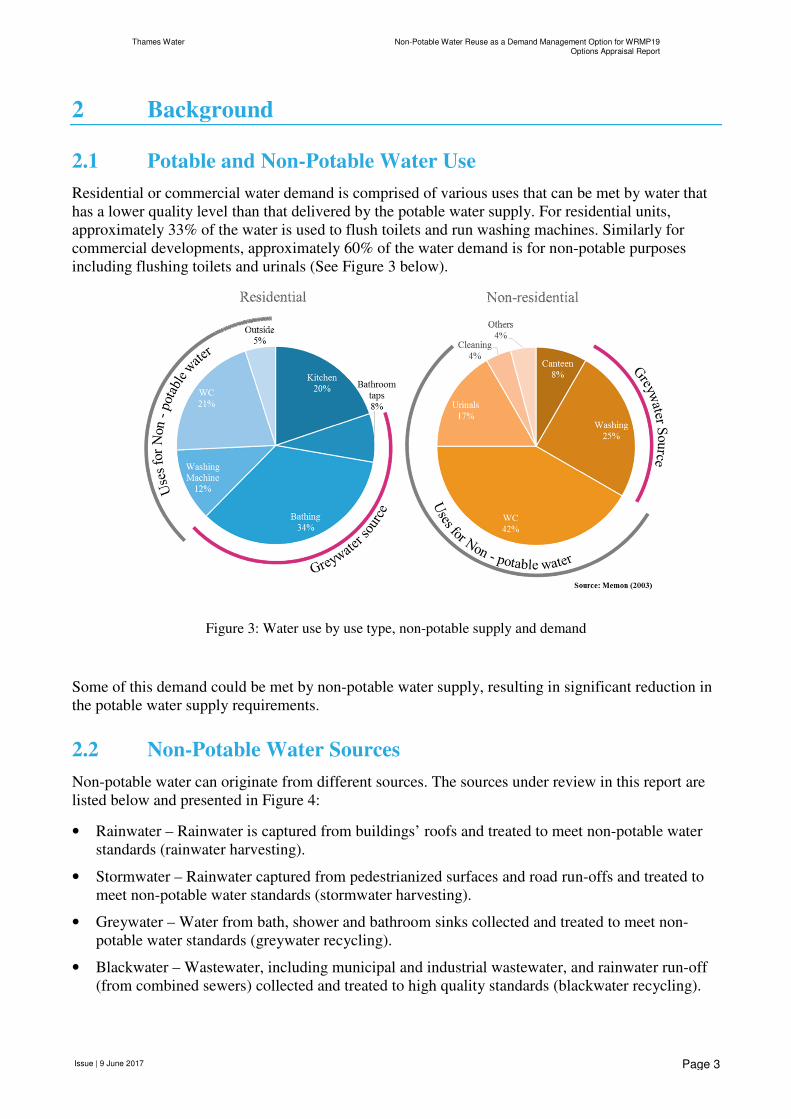
Residential or commercial water demand is comprised of various uses that can be met by water that
has a lower quality level than that delivered by the potable water supply. For residential units,
approximately 33% of the water is used to flush toilets and run washing machines. Similarly for
commercial developments, approximately 60% of the water demand is for non-potable purposes
including flushing toilets and urinals (See Figure 3 below).
Figure 3: Water use by use type, non-potable supply and demand
Some of this demand could be met by non-potable water supply, resulting in significant reduction in
the potable water supply requirements.
2.2 Non-Potable Water Sources
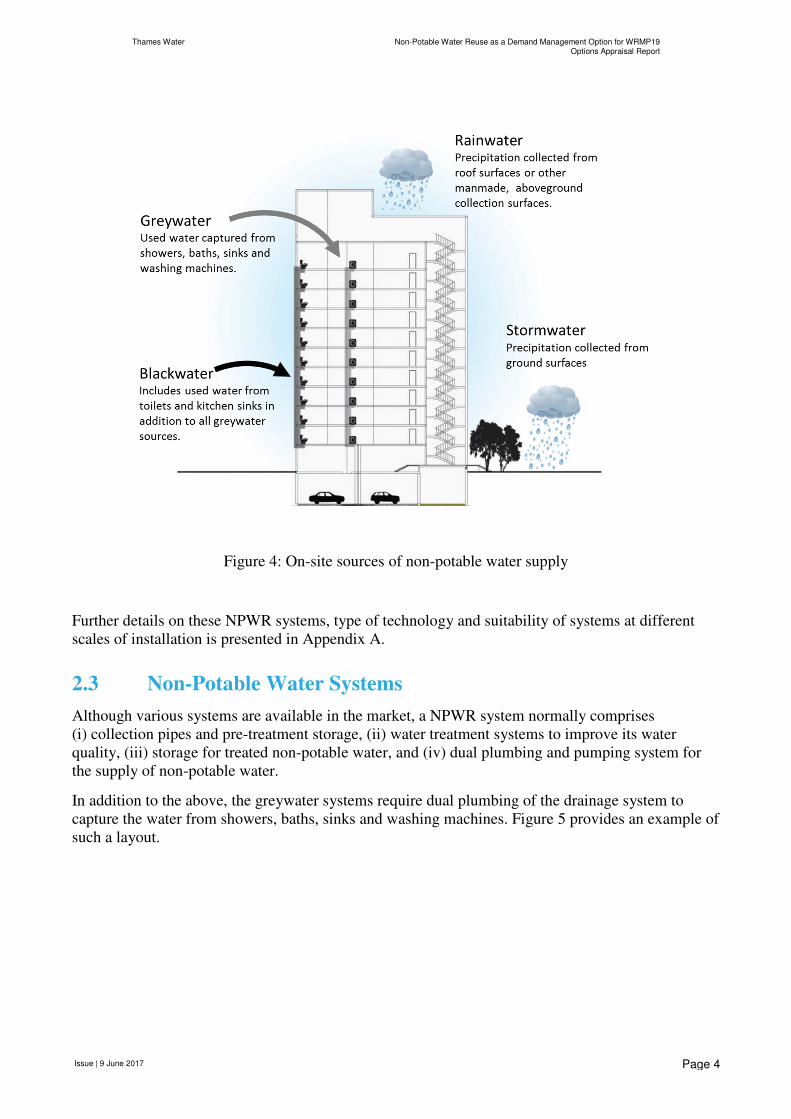
Non-potable water can originate from different sources. The sources under review in this report are
listed below and presented in Figure 4:
• Rainwater – Rainwater is captured from buildings’ roofs and treated to meet non-potable water
standards (rainwater harvesting).
• Stormwater – Rainwater captured from pedestrianized surfaces and road run-offs and treated to
meet non-potable water standards (stormwater harvesting).
• Greywater – Water from bath, shower and bathroom sinks collected and treated to meet non-
potable water standards (greywater recycling).
• Blackwater – Wastewater, including municipal and industrial wastewater, and rainwater run-off
(from combined sewers) collected and treated to high quality standards (blackwater recycling).
Thames Water Non-Potable Water Reuse as a Demand Management Option for WRMP19Options Appraisal Report
Issue | 9 June 2017
Page 4
Figure 4: On-site sources of non-potable water supply
Further details on these NPWR systems, type of technology and suitability of systems at different
scales of installation is presented in Appendix A.
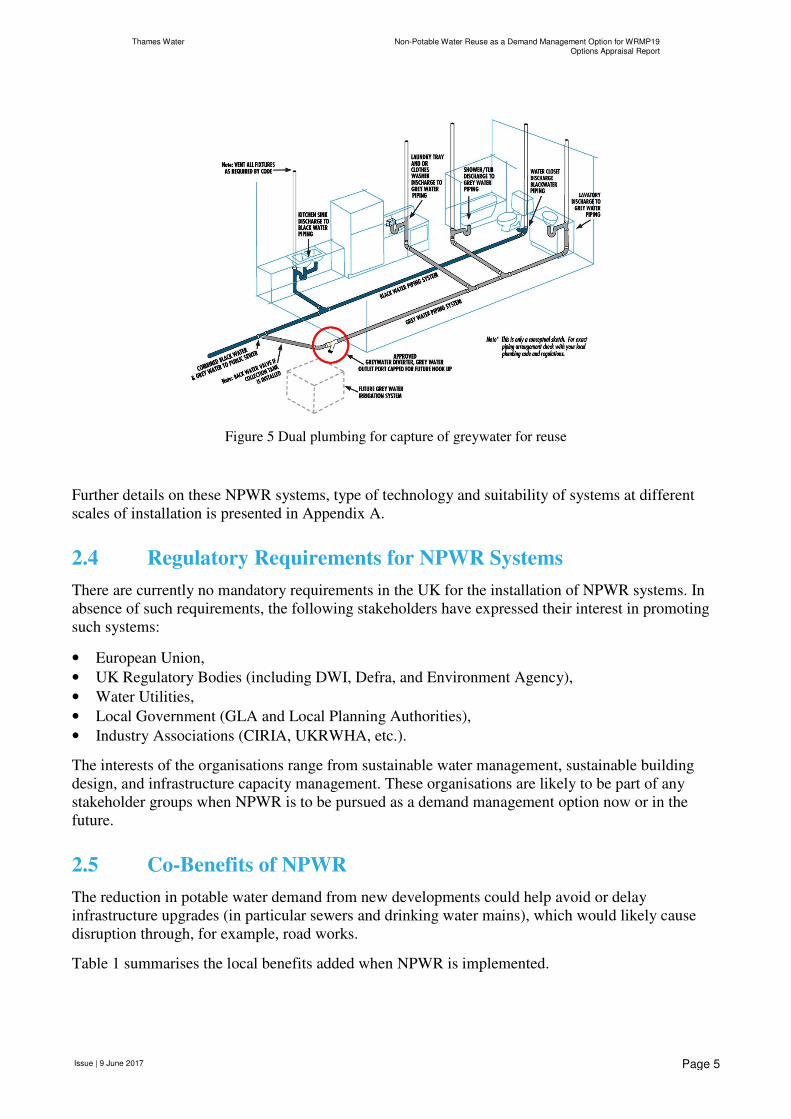
2.3 Non-Potable Water Systems
Although various systems are available in the market, a NPWR system normally comprises
(i) collection pipes and pre-treatment storage, (ii) water treatment systems to improve its water
quality, (iii) storage for treated non-potable water, and (iv) dual plumbing and pumping system for
the supply of non-potable water.
In addition to the above, the greywater systems require dual plumbing of the drainage system to
capture the water from showers, baths, sinks and washing machines. Figure 5 provides an example of
such a layout.
Thames Water Non-Potable Water Reuse as a Demand Management Option for WRMP19Options Appraisal Report
Issue | 9 June 2017
Page 5
Figure 5 Dual plumbing for capture of greywater for reuse
Further details on these NPWR systems, type of technology and suitability of systems at different
scales of installation is presented in Appendix A.
2.4 Regulatory Requirements for NPWR Systems
There are currently no mandatory requirements in the UK for the installation of NPWR systems. In
absence of such requirements, the following stakeholders have expressed their interest in promoting
such systems:
• European Union,
• UK Regulatory Bodies (including DWI, Defra, and Environment Agency),
• Water Utilities,
• Local Government (GLA and Local Planning Authorities),
• Industry Associations (CIRIA, UKRWHA, etc.).
The interests of the organisations range from sustainable water management, sustainable building
design, and infrastructure capacity management. These organisations are likely to be part of any
stakeholder groups when NPWR is to be pursued as a demand management option now or in the
future.
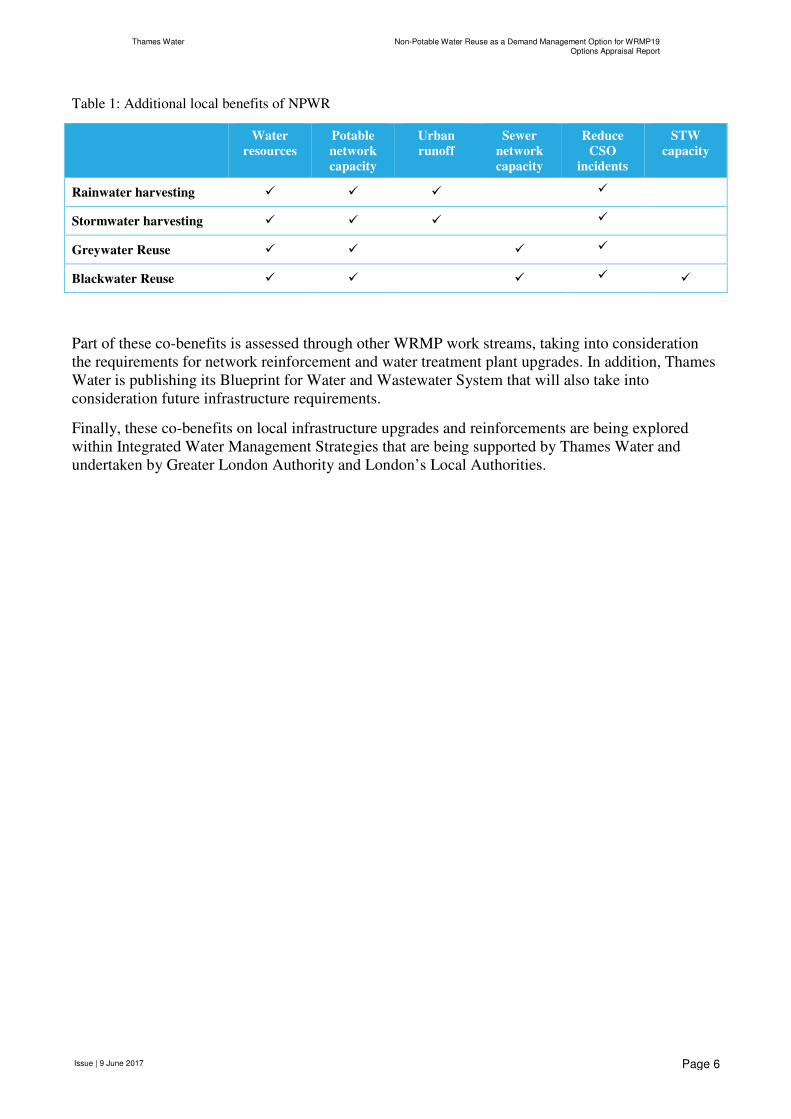
2.5 Co-Benefits of NPWR
The reduction in potable water demand from new developments could help avoid or delay
infrastructure upgrades (in particular sewers and drinking water mains), which would likely cause
disruption through, for example, road works.
Table 1 summarises the local benefits added when NPWR is implemented.
Thames Water Non-Potable Water Reuse as a Demand Management Option for WRMP19Options Appraisal Report
Issue | 9 June 2017
Page 6
Table 1: Additional local benefits of NPWR
Water
resources
Potable
network
capacity
Urban
runoff
Sewer
network
capacity
Reduce
CSO
incidents
STW
capacity
Rainwater harvesting � � � �
Stormwater harvesting � � � �
Greywater Reuse � � � �
Blackwater Reuse � � � � �
Part of these co-benefits is assessed through other WRMP work streams, taking into consideration
the requirements for network reinforcement and water treatment plant upgrades. In addition, Thames
Water is publishing its Blueprint for Water and Wastewater System that will also take into
consideration future infrastructure requirements.
Finally, these co-benefits on local infrastructure upgrades and reinforcements are being explored
within Integrated Water Management Strategies that are being supported by Thames Water and
undertaken by Greater London Authority and London’s Local Authorities.
Thames Water Non-Potable Water Reuse as a Demand Management Option for WRMP19Options Appraisal Report
Issue | 9 June 2017
Page 7
3 Methodology
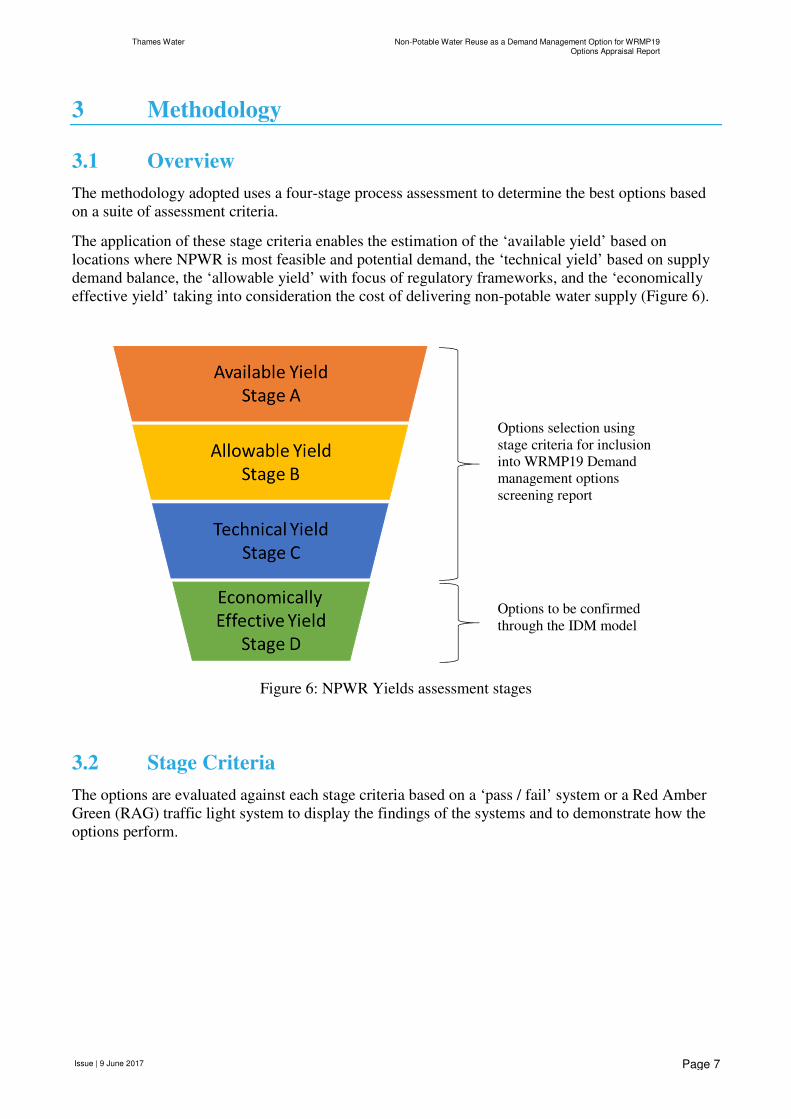
3.1 Overview
The methodology adopted uses a four-stage process assessment to determine the best options based
on a suite of assessment criteria.
The application of these stage criteria enables the estimation of the ‘available yield’ based on
locations where NPWR is most feasible and potential demand, the ‘technical yield’ based on supply
demand balance, the ‘allowable yield’ with focus of regulatory frameworks, and the ‘economically
effective yield’ taking into consideration the cost of delivering non-potable water supply (Figure 6).
Figure 6: NPWR Yields assessment stages
3.2 Stage Criteria
The options are evaluated against each stage criteria based on a ‘pass / fail’ system or a Red Amber
Green (RAG) traffic light system to display the findings of the systems and to demonstrate how the
options perform.
Options selection using
stage criteria for inclusion
into WRMP19 Demand
management options
screening report
Options to be confirmed
through the IDM model
Thames Water Non-Potable Water Reuse as a Demand Management Option for WRMP19Options Appraisal Report
Issue | 9 June 2017
Page 8
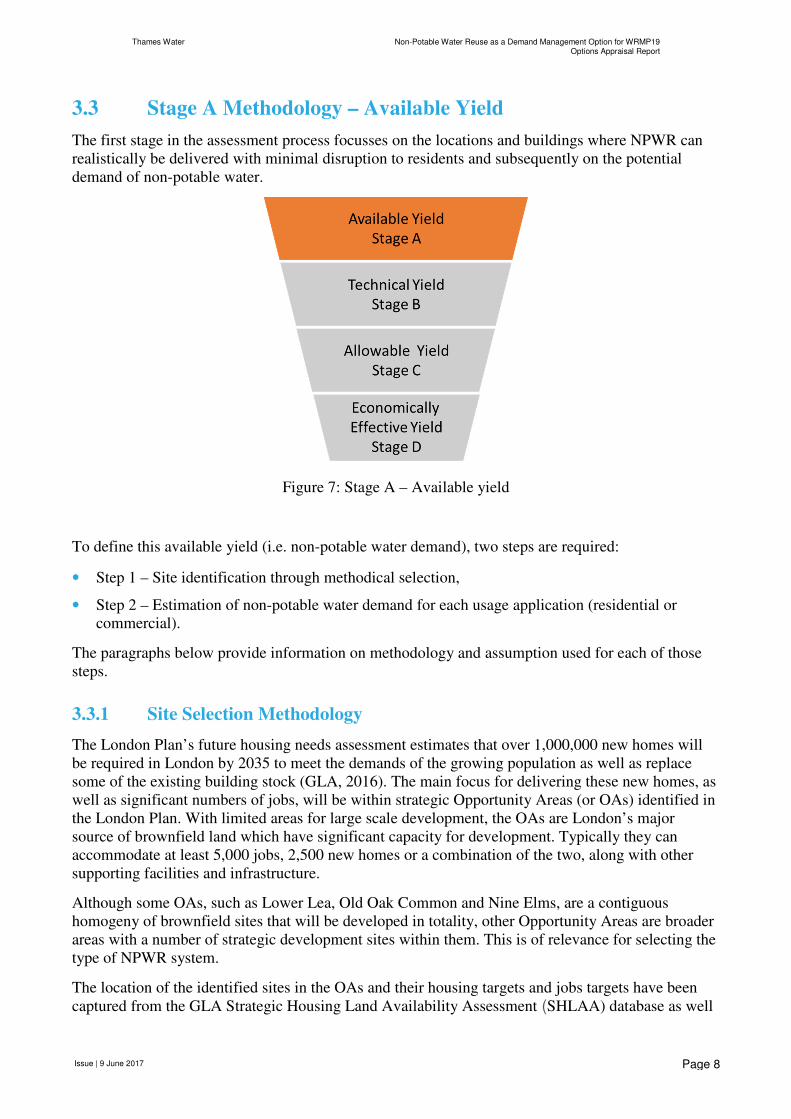
3.3 Stage A Methodology – Available Yield
The first stage in the assessment process focusses on the locations and buildings where NPWR can
realistically be delivered with minimal disruption to residents and subsequently on the potential
demand of non-potable water.
Figure 7: Stage A – Available yield
To define this available yield (i.e. non-potable water demand), two steps are required:
• Step 1 – Site identification through methodical selection,
• Step 2 – Estimation of non-potable water demand for each usage application (residential or
commercial).
The paragraphs below provide information on methodology and assumption used for each of those
steps.
3.3.1 Site Selection Methodology
The London Plan’s future housing needs assessment estimates that over 1,000,000 new homes will
be required in London by 2035 to meet the demands of the growing population as well as replace
some of the existing building stock (GLA, 2016). The main focus for delivering these new homes, as
well as significant numbers of jobs, will be within strategic Opportunity Areas (or OAs) identified in
the London Plan. With limited areas for large scale development, the OAs are London’s major
source of brownfield land which have significant capacity for development. Typically they can
accommodate at least 5,000 jobs, 2,500 new homes or a combination of the two, along with other
supporting facilities and infrastructure.
Although some OAs, such as Lower Lea, Old Oak Common and Nine Elms, are a contiguous
homogeny of brownfield sites that will be developed in totality, other Opportunity Areas are broader
areas with a number of strategic development sites within them. This is of relevance for selecting the
type of NPWR system.
The location of the identified sites in the OAs and their housing targets and jobs targets have been
captured from the GLA Strategic Housing Land Availability Assessment (SHLAA) database as well
Thames Water Non-Potable Water Reuse as a Demand Management Option for WRMP19Options Appraisal Report
Issue | 9 June 2017
Page 9
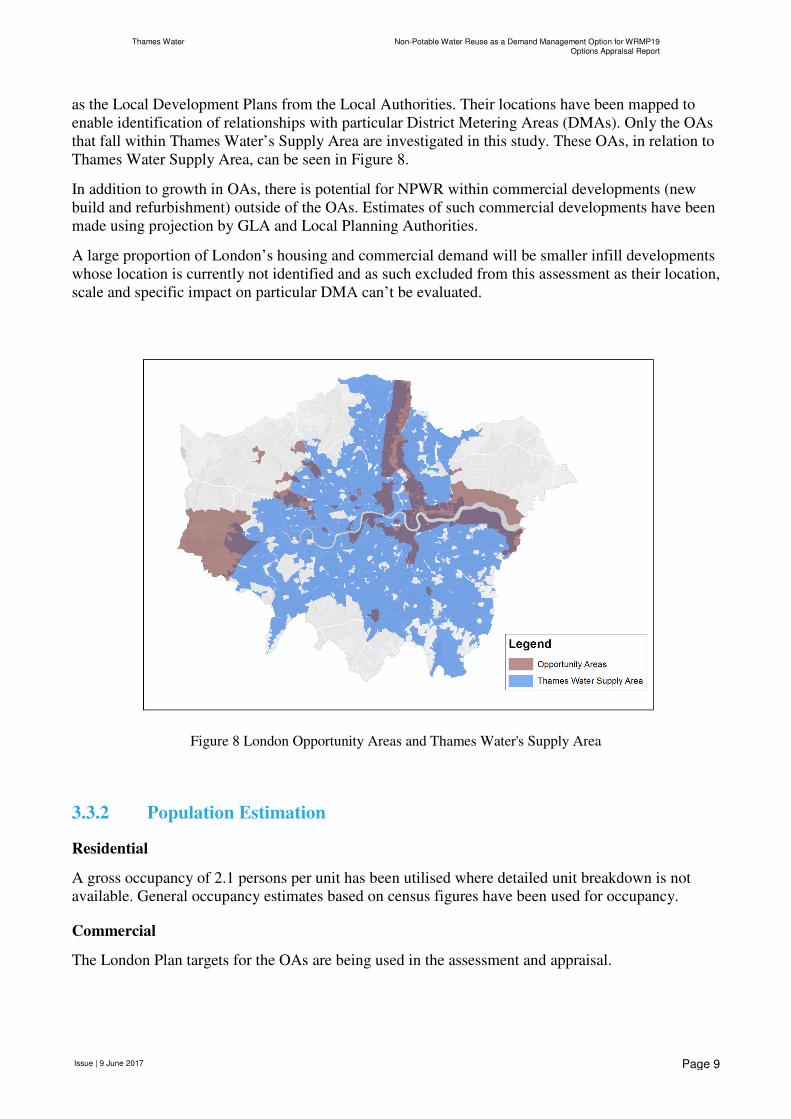
as the Local Development Plans from the Local Authorities. Their locations have been mapped to
enable identification of relationships with particular District Metering Areas (DMAs). Only the OAs
that fall within Thames Water’s Supply Area are investigated in this study. These OAs, in relation to
Thames Water Supply Area, can be seen in Figure 8.
In addition to growth in OAs, there is potential for NPWR within commercial developments (new
build and refurbishment) outside of the OAs. Estimates of such commercial developments have been
made using projection by GLA and Local Planning Authorities.
A large proportion of London’s housing and commercial demand will be smaller infill developments
whose location is currently not identified and as such excluded from this assessment as their location,
scale and specific impact on particular DMA can’t be evaluated.
Figure 8 London Opportunity Areas and Thames Water's Supply Area
3.3.2 Population Estimation
Residential
A gross occupancy of 2.1 persons per unit has been utilised where detailed unit breakdown is not
available. General occupancy estimates based on census figures have been used for occupancy.
Commercial
The London Plan targets for the OAs are being used in the assessment and appraisal.
Thames Water Non-Potable Water Reuse as a Demand Management Option for WRMP19Options Appraisal Report
Issue | 9 June 2017
Page 10
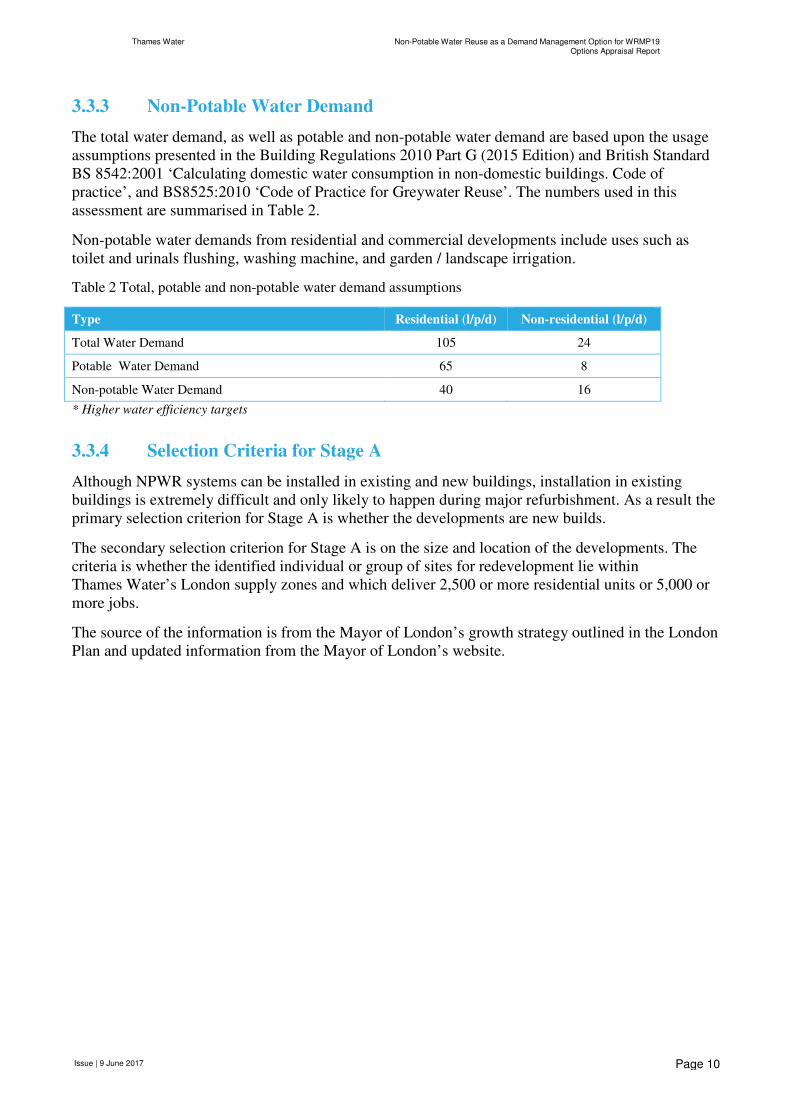
3.3.3 Non-Potable Water Demand
The total water demand, as well as potable and non-potable water demand are based upon the usage
assumptions presented in the Building Regulations 2010 Part G (2015 Edition) and British Standard
BS 8542:2001 ‘Calculating domestic water consumption in non-domestic buildings. Code of
practice’, and BS8525:2010 ‘Code of Practice for Greywater Reuse’. The numbers used in this
assessment are summarised in Table 2.
Non-potable water demands from residential and commercial developments include uses such as
toilet and urinals flushing, washing machine, and garden / landscape irrigation.
Table 2 Total, potable and non-potable water demand assumptions
Type Residential (l/p/d) Non-residential (l/p/d) Total Water Demand 105 24 Potable Water Demand 65 8 Non-potable Water Demand 40 16 * Higher water efficiency targets
3.3.4 Selection Criteria for Stage A
Although NPWR systems can be installed in existing and new buildings, installation in existing
buildings is extremely difficult and only likely to happen during major refurbishment. As a result the
primary selection criterion for Stage A is whether the developments are new builds.
The secondary selection criterion for Stage A is on the size and location of the developments. The
criteria is whether the identified individual or group of sites for redevelopment lie within
Thames Water’s London supply zones and which deliver 2,500 or more residential units or 5,000 or
more jobs.
The source of the information is from the Mayor of London’s growth strategy outlined in the London
Plan and updated information from the Mayor of London’s website.
Thames Water Non-Potable Water Reuse as a Demand Management Option for WRMP19Options Appraisal Report
Issue | 9 June 2017
Page 11
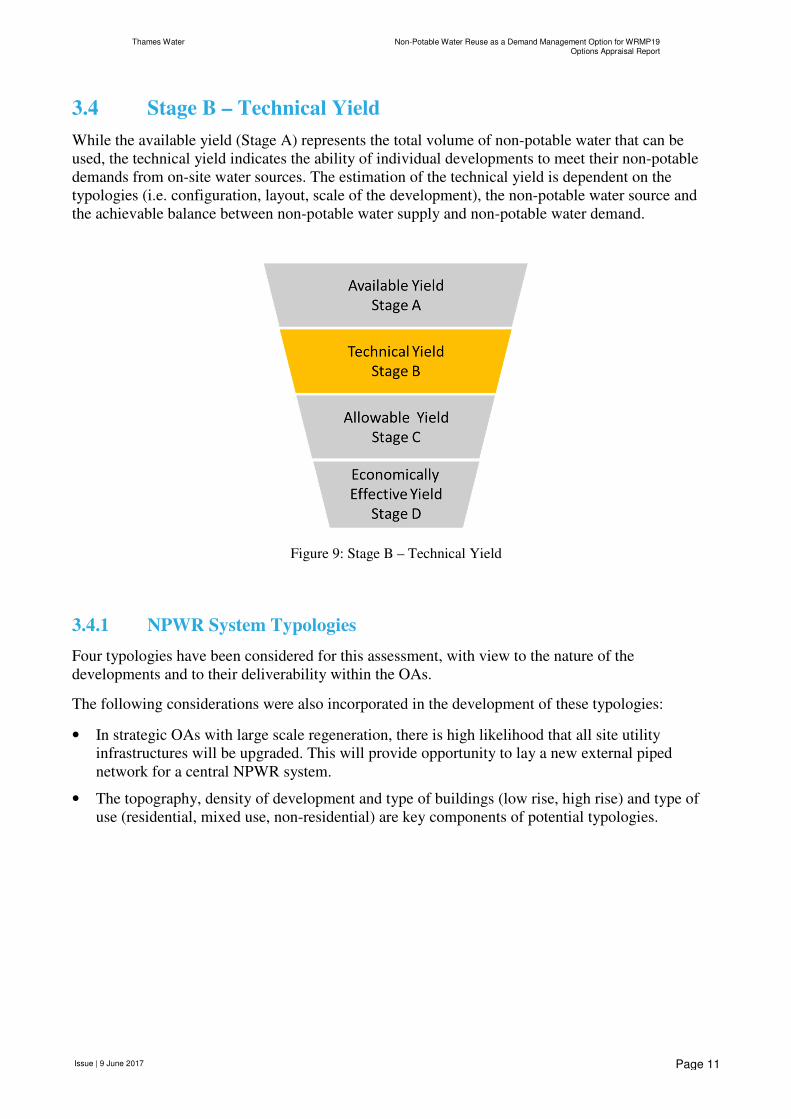
3.4 Stage B – Technical Yield
While the available yield (Stage A) represents the total volume of non-potable water that can be
used, the technical yield indicates the ability of individual developments to meet their non-potable
demands from on-site water sources. The estimation of the technical yield is dependent on the
typologies (i.e. configuration, layout, scale of the development), the non-potable water source and
the achievable balance between non-potable water supply and non-potable water demand.
Figure 9: Stage B – Technical Yield
3.4.1 NPWR System Typologies
Four typologies have been considered for this assessment, with view to the nature of the
developments and to their deliverability within the OAs.
The following considerations were also incorporated in the development of these typologies:
• In strategic OAs with large scale regeneration, there is high likelihood that all site utility
infrastructures will be upgraded. This will provide opportunity to lay a new external piped
network for a central NPWR system.
• The topography, density of development and type of buildings (low rise, high rise) and type of
use (residential, mixed use, non-residential) are key components of potential typologies.
Thames Water Non-Potable Water Reuse as a Demand Management Option for WRMP19Options Appraisal Report
Issue | 9 June 2017
Page 12
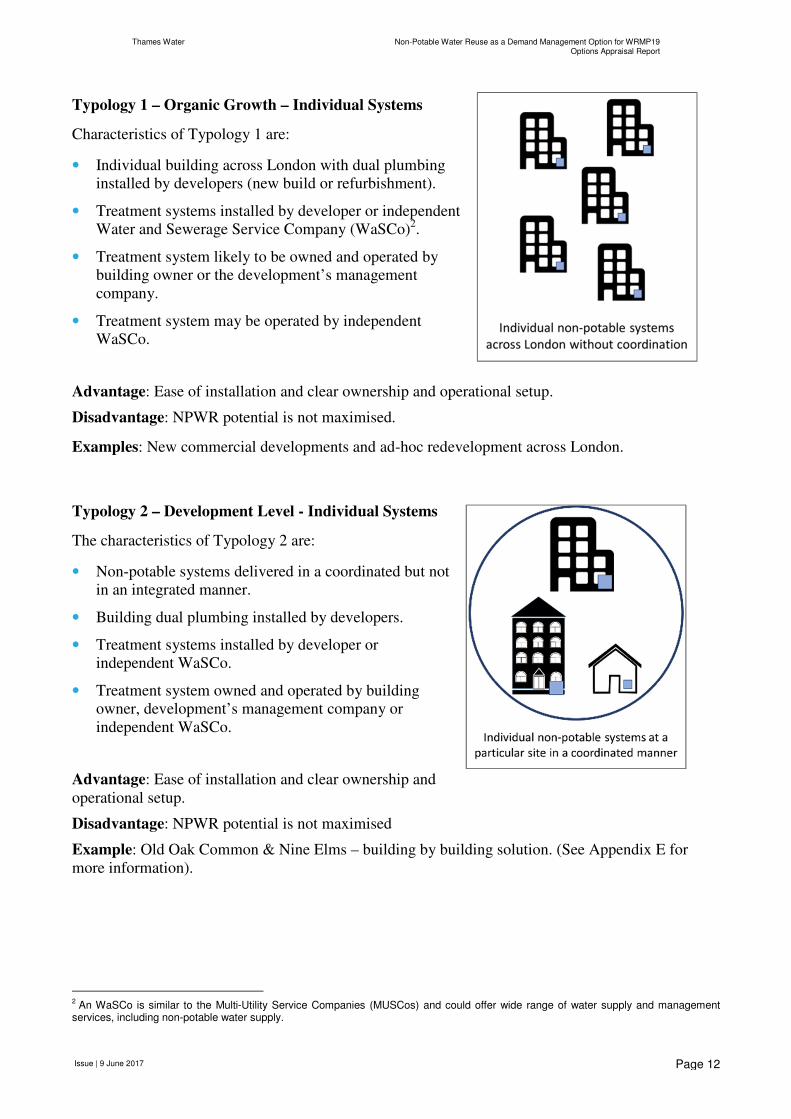
Typology 1 – Organic Growth – Individual Systems
Characteristics of Typology 1 are:
• Individual building across London with dual plumbing
installed by developers (new build or refurbishment).
• Treatment systems installed by developer or independent
Water and Sewerage Service Company (WaSCo)2.
• Treatment system likely to be owned and operated by
building owner or the development’s management
company.
• Treatment system may be operated by independent
WaSCo.
Advantage: Ease of installation and clear ownership and operational setup.
Disadvantage: NPWR potential is not maximised.
Examples: New commercial developments and ad-hoc redevelopment across London.
Typology 2 – Development Level - Individual Systems
The characteristics of Typology 2 are:
• Non-potable systems delivered in a coordinated but not
in an integrated manner.
• Building dual plumbing installed by developers.
• Treatment systems installed by developer or
independent WaSCo.
• Treatment system owned and operated by building
owner, development’s management company or
independent WaSCo.
Advantage: Ease of installation and clear ownership and
operational setup.
Disadvantage: NPWR potential is not maximised
Example: Old Oak Common & Nine Elms – building by building solution. (See Appendix E for
more information).
2 An WaSCo is similar to the Multi-Utility Service Companies (MUSCos) and could offer wide range of water supply and management
services, including non-potable water supply.
Thames Water Non-Potable Water Reuse as a Demand Management Option for WRMP19Options Appraisal Report
Issue | 9 June 2017
Page 13
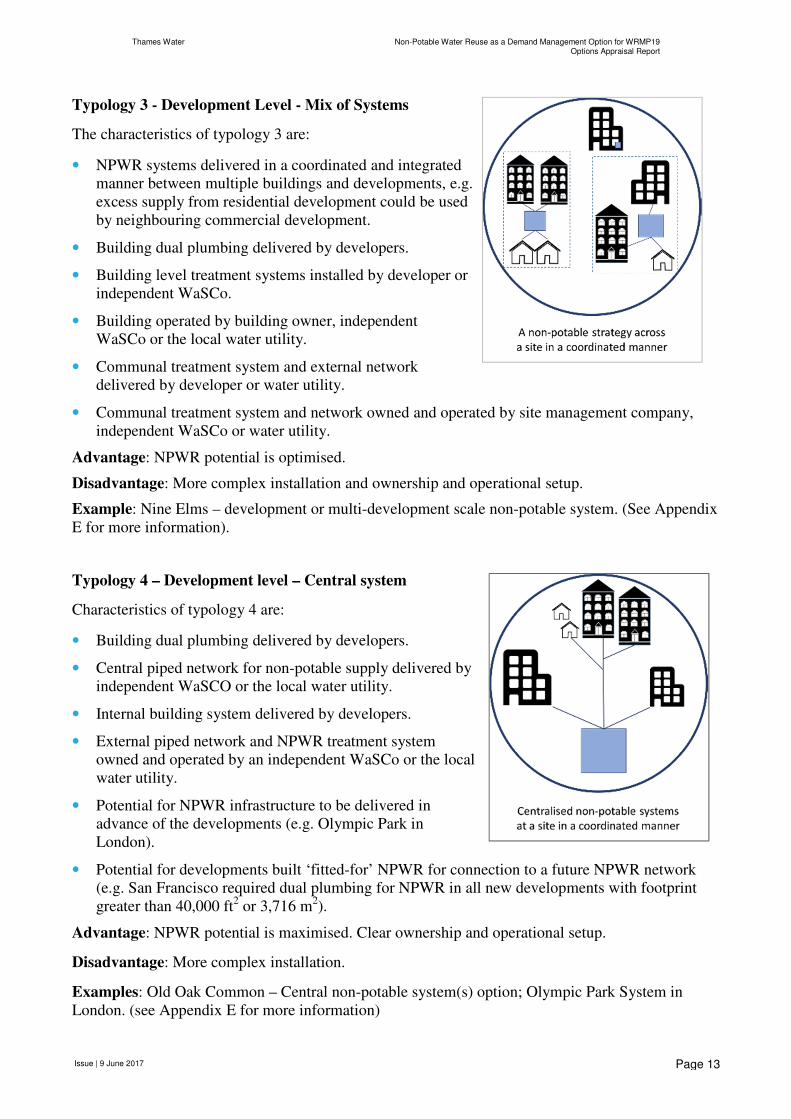
Typology 3 - Development Level - Mix of Systems
The characteristics of typology 3 are:
• NPWR systems delivered in a coordinated and integrated
manner between multiple buildings and developments, e.g.
excess supply from residential development could be used
by neighbouring commercial development.
• Building dual plumbing delivered by developers.
• Building level treatment systems installed by developer or
independent WaSCo.
• Building operated by building owner, independent
WaSCo or the local water utility.
• Communal treatment system and external network
delivered by developer or water utility.
• Communal treatment system and network owned and operated by site management company,
independent WaSCo or water utility.
Advantage: NPWR potential is optimised.
Disadvantage: More complex installation and ownership and operational setup.
Example: Nine Elms – development or multi-development scale non-potable system. (See Appendix
E for more information).
Typology 4 – Development level – Central system
Characteristics of typology 4 are:
• Building dual plumbing delivered by developers.
• Central piped network for non-potable supply delivered by
independent WaSCO or the local water utility.
• Internal building system delivered by developers.
• External piped network and NPWR treatment system
owned and operated by an independent WaSCo or the local
water utility.
• Potential for NPWR infrastructure to be delivered in
advance of the developments (e.g. Olympic Park in
London).
• Potential for developments built ‘fitted-for’ NPWR for connection to a future NPWR network
(e.g. San Francisco required dual plumbing for NPWR in all new developments with footprint
greater than 40,000 ft2 or 3,716 m
2).
Advantage: NPWR potential is maximised. Clear ownership and operational setup.
Disadvantage: More complex installation.
Examples: Old Oak Common – Central non-potable system(s) option; Olympic Park System in
London. (see Appendix E for more information)
Thames Water Non-Potable Water Reuse as a Demand Management Option for WRMP19Options Appraisal Report
Issue | 9 June 2017
Page 14
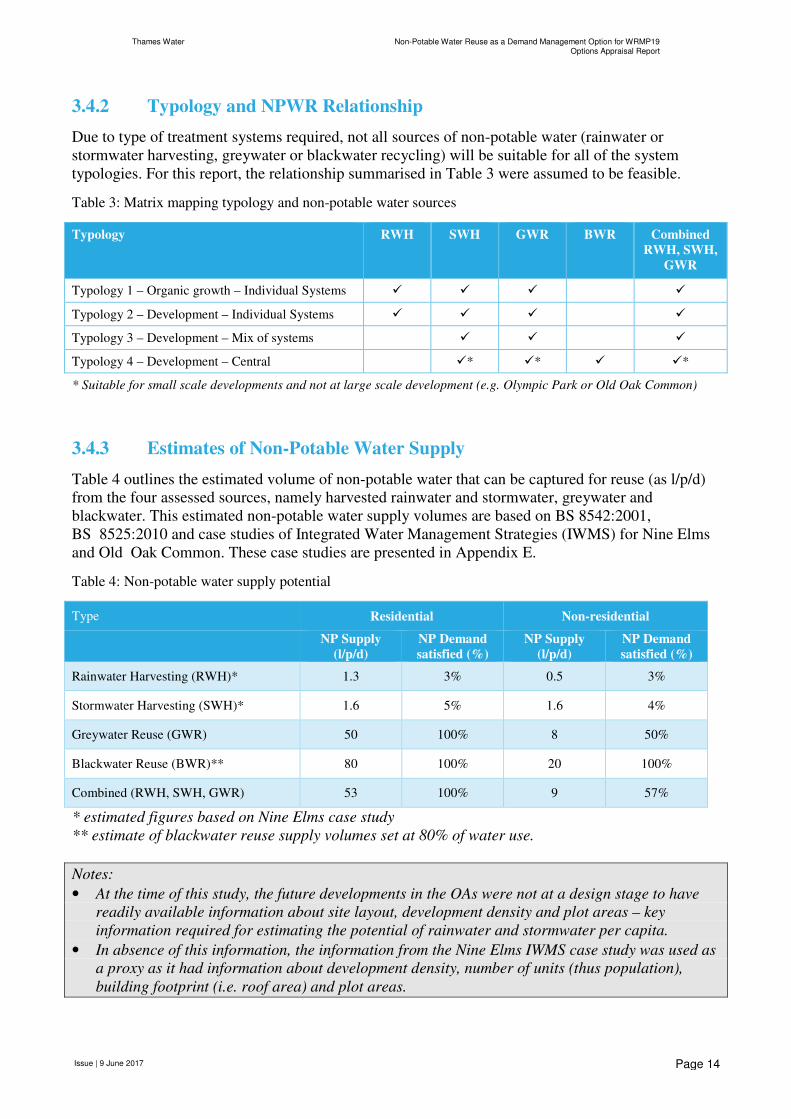
3.4.2 Typology and NPWR Relationship
Due to type of treatment systems required, not all sources of non-potable water (rainwater or
stormwater harvesting, greywater or blackwater recycling) will be suitable for all of the system
typologies. For this report, the relationship summarised in Table 3 were assumed to be feasible.
Table 3: Matrix mapping typology and non-potable water sources
Typology RWH SWH GWR BWR Combined
RWH, SWH,
GWR
Typology 1 – Organic growth – Individual Systems � � � �
Typology 2 – Development – Individual Systems � � � �
Typology 3 – Development – Mix of systems � � �
Typology 4 – Development – Central �* �* � �*
* Suitable for small scale developments and not at large scale development (e.g. Olympic Park or Old Oak Common)
3.4.3 Estimates of Non-Potable Water Supply
Table 4 outlines the estimated volume of non-potable water that can be captured for reuse (as l/p/d)
from the four assessed sources, namely harvested rainwater and stormwater, greywater and
blackwater. This estimated non-potable water supply volumes are based on BS 8542:2001,
BS 8525:2010 and case studies of Integrated Water Management Strategies (IWMS) for Nine Elms
and Old Oak Common. These case studies are presented in Appendix E.
Table 4: Non-potable water supply potential
Type Residential Non-residential
NP Supply
(l/p/d)
NP Demand
satisfied (%)
NP Supply
(l/p/d)
NP Demand
satisfied (%)
Rainwater Harvesting (RWH)* 1.3 3% 0.5 3%
Stormwater Harvesting (SWH)* 1.6 5% 1.6 4%
Greywater Reuse (GWR) 50 100% 8 50%
Blackwater Reuse (BWR)** 80 100% 20 100%
Combined (RWH, SWH, GWR) 53 100% 9 57%
* estimated figures based on Nine Elms case study
** estimate of blackwater reuse supply volumes set at 80% of water use.
Notes:
• At the time of this study, the future developments in the OAs were not at a design stage to have
readily available information about site layout, development density and plot areas – key
information required for estimating the potential of rainwater and stormwater per capita.
• In absence of this information, the information from the Nine Elms IWMS case study was used as
a proxy as it had information about development density, number of units (thus population),
building footprint (i.e. roof area) and plot areas.

Thames Water Non-Potable Water Reuse as a Demand Management Option for WRMP19Options Appraisal Report
Issue | 9 June 2017
Page 15
3.4.4 Selection Criteria for Stage B
Based on information captured from Old Oak Common and Nine Elms Integrated Water
Management Strategies and input from industry experts, it was ascertained that the cost effectiveness
for NPWR systems would be low for systems below a certain threshold.
Below this threshold, the impact of implementing NPWR on water demand and local infrastructure
would be low; therefore the effectiveness of implementing NPWR would be limited.
For purposes of this assessment, a minimum threshold of 10 m3/d was set for each OAs.
Thames Water Non-Potable Water Reuse as a Demand Management Option for WRMP19Options Appraisal Report
Issue | 9 June 2017
Page 16
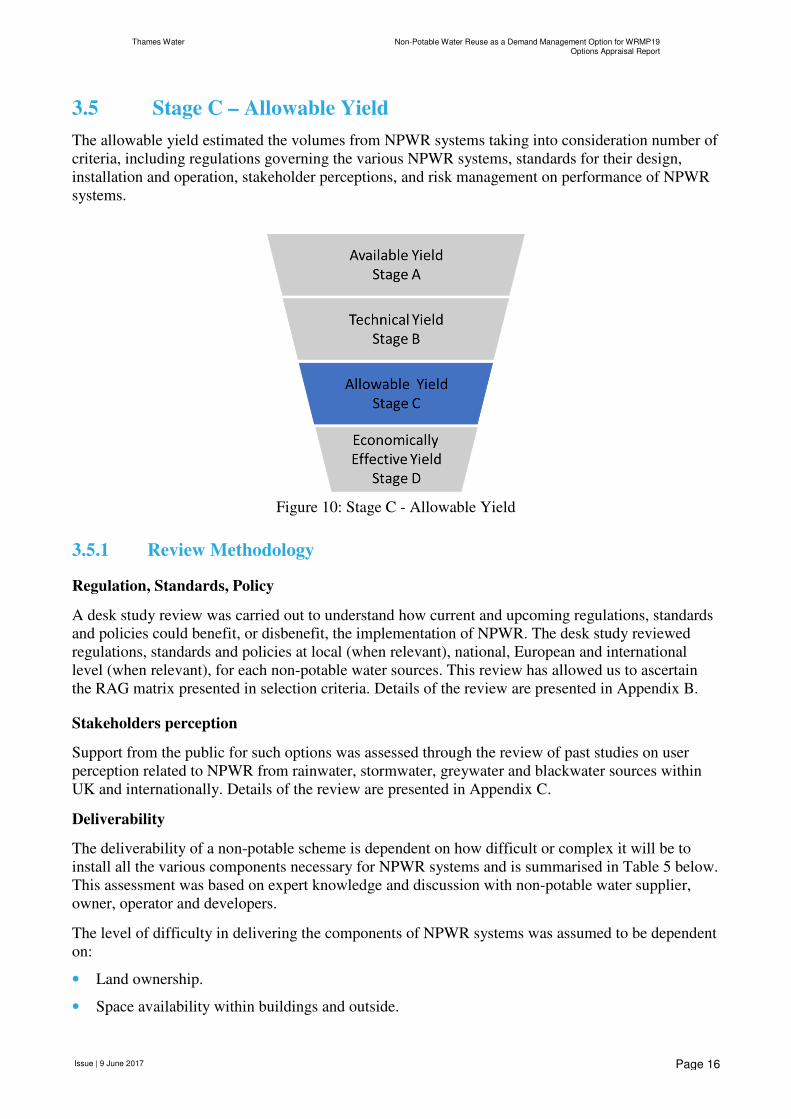
3.5 Stage C – Allowable Yield
The allowable yield estimated the volumes from NPWR systems taking into consideration number of
criteria, including regulations governing the various NPWR systems, standards for their design,
installation and operation, stakeholder perceptions, and risk management on performance of NPWR
systems.
Figure 10: Stage C - Allowable Yield
3.5.1 Review Methodology
Regulation, Standards, Policy
A desk study review was carried out to understand how current and upcoming regulations, standards
and policies could benefit, or disbenefit, the implementation of NPWR. The desk study reviewed
regulations, standards and policies at local (when relevant), national, European and international
level (when relevant), for each non-potable water sources. This review has allowed us to ascertain
the RAG matrix presented in selection criteria. Details of the review are presented in Appendix B.
Stakeholders perception
Support from the public for such options was assessed through the review of past studies on user
perception related to NPWR from rainwater, stormwater, greywater and blackwater sources within
UK and internationally. Details of the review are presented in Appendix C.
Deliverability
The deliverability of a non-potable scheme is dependent on how difficult or complex it will be to
install all the various components necessary for NPWR systems and is summarised in Table 5 below.
This assessment was based on expert knowledge and discussion with non-potable water supplier,
owner, operator and developers.
The level of difficulty in delivering the components of NPWR systems was assumed to be dependent
on:
• Land ownership.
• Space availability within buildings and outside.
Thames Water Non-Potable Water Reuse as a Demand Management Option for WRMP19Options Appraisal Report
Issue | 9 June 2017
Page 17
• Ownership of NPWR systems (incl. external pipes and treatment systems).
• Presence of other infrastructure services, or space required for their delivery in new development.
Table 5: Assumption about the level of difficulty in delivery of various components of NPWR systems
System types
Rainwater &
Stormwater
(Typologies 1,
2, 3)
Greywater
(Typologies 1,
2, 3)
Greywater
(Typologies 4)
Blackwater
(Typologies 4)
Rainwater,
Stormwater,
Greywater
(Typologies 4)
Internal Storage Low / Medium Low N / A N / A Low
External Storage Medium N / A High High Medium
External pipework – outflow Low N / A High High High
Treatment system Location Low / Medium Low High High High
External pipework – Inflow Low N / A High High High
The following assumptions were made based on expert judgement:
• Communal and Central NPWR systems (Typologies 3 and 4) have ‘high’ difficulty in delivery of
external dual plumbing infrastructure in mixed land ownership model as well as issues related to
utility routing and availability of space.
• From land ownership, system ownership and network delivery viewpoints, the implementation of
NPWR is easiest for systems that source their supply from rainwater & stormwater harvesting
systems, and the distributed greywater systems (with systems in each building unit).
• The difficulty is deemed ‘high’ where agreement with multiple parties will be necessary to
implement the system, and ‘low’ where single party (such as a developer) can implement the
whole system. This is likely to be the case with Typology 4 NPWR systems.
Risk management
In addition to the various challenges in delivering parts of the NPWR system, there are issues with
ensuring system performance for water quality as well as reduction in water use forming the basis of
the system design. Table 6 highlights the level of risks in relation to water quality and system
meeting their design specification for the options under review. This assessment was based on expert
knowledge and discussion with non-potable water supplier, owner, operator and developers.
Table 6: System operations and performance
Rainwater &
Stormwater
(Typology 1, 2, 3)
Greywater
(Typology 1, 2, 3)
Greywater
(Typology 4)
Blackwater
(Typology 4)
Greywater,
Rainwater &
Stormwater
(Typology 3,4)
Risks from water
quality Low risk Medium – High Low – Medium Medium Medium
Likelihood of meeting
design performance Low Low – Medium Medium Medium Low – Medium
Note:
1. The risks from water quality would be present if the NPWR systems were not operated as designed and specified.
2. The design performance refers to ability to meet design reduction in demand
Thames Water Non-Potable Water Reuse as a Demand Management Option for WRMP19Options Appraisal Report
Issue | 9 June 2017
Page 18
In the UK, the regulations & guidelines do not include requirements for water quality or system
operation monitoring of installed NPWR systems. This could disincentivise water companies from
implementing such solution as water companies; water companies are responsible up to the
customer’s meter, but are liable up to the customer tap (i.e., a cross-connection between the non-
potable and the potable supply is therefore regarded as a high risk for water companies).
For greater acceptance of NPWR systems, guidelines for monitoring and reporting of the systems
may be necessary. There are international examples where local regulations have been enacted for
monitoring and reporting of NPWR systems to manage the risks associated with these systems.
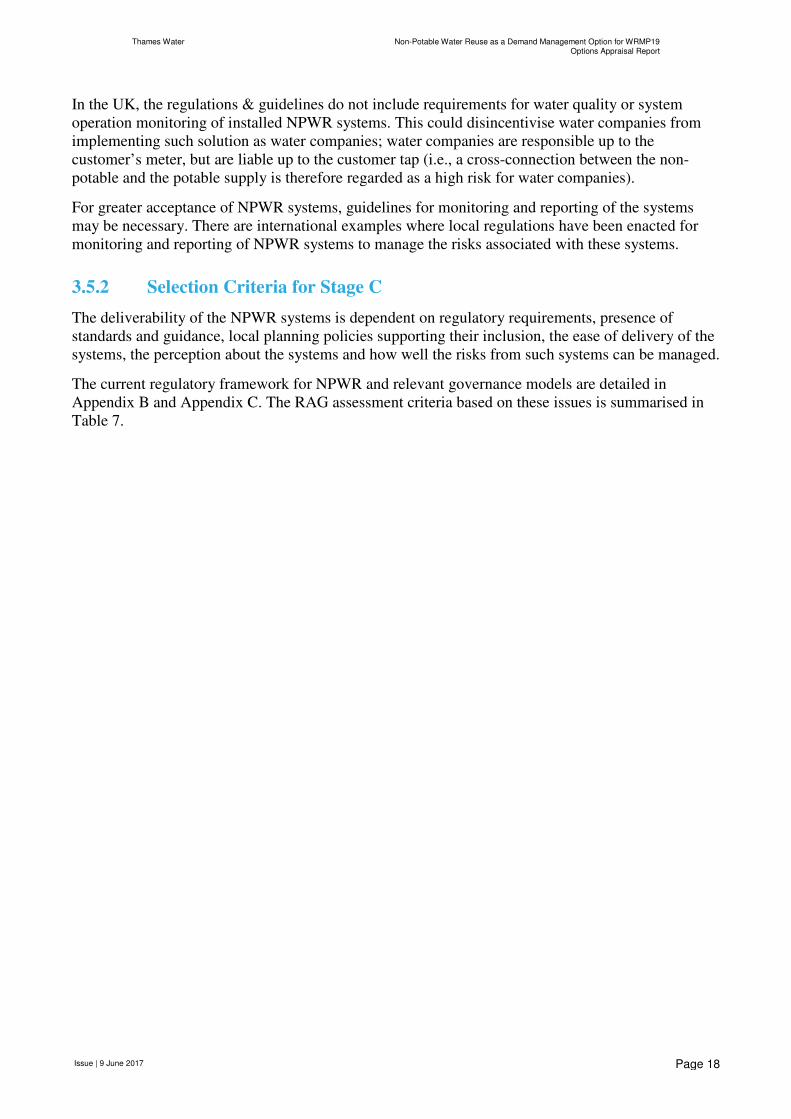
3.5.2 Selection Criteria for Stage C
The deliverability of the NPWR systems is dependent on regulatory requirements, presence of
standards and guidance, local planning policies supporting their inclusion, the ease of delivery of the
systems, the perception about the systems and how well the risks from such systems can be managed.
The current regulatory framework for NPWR and relevant governance models are detailed in
Appendix B and Appendix C. The RAG assessment criteria based on these issues is summarised in
Table 7.
Thames Water Non-Potable Water Reuse as a Demand Management Option for WRMP19Options Appraisal Report
Issue | 9 June 2017
Page 19
Table 7: Stage C Assessment Criteria
Basis for assessment
Criterion title Selection Criteria Green Amber Red
Regulation Are regulations in
effect?
Regulations are
present
Regulations are in
development
Regulations are not
being pursued at this
time
Standards Are standards
present?
Standards are
present
Standards are in
development
Standards are not
being pursued at this
time
Policy Are policies present? Approved
government policy
(national, regional,
local) are present
Policies are
published but not
approved.
No policies exist at
this time
Perception Do the solutions
have a positive
perception by
owners?
Full support Some support No support
Deliverability Complexity in
delivery of NP
treatment and supply
systems
Low complexity Medium Complexity High complexity
Complexity in
operation and maintenance of NP
treatment and supply
systems
Low complexity Medium complexity High complexity
Likelihood of
meeting design
specification
(volumes)
High Medium Low
Risk Management Risk to public health
from cross
connections
Low risk Medium risk High risk
Ability to manage
risks
High Medium Low
Likelihood of
meeting design
specification
(quality)
High Medium Low
Thames Water Non-Potable Water Reuse as a Demand Management Option for WRMP19Options Appraisal Report
Issue | 9 June 2017
Page 20
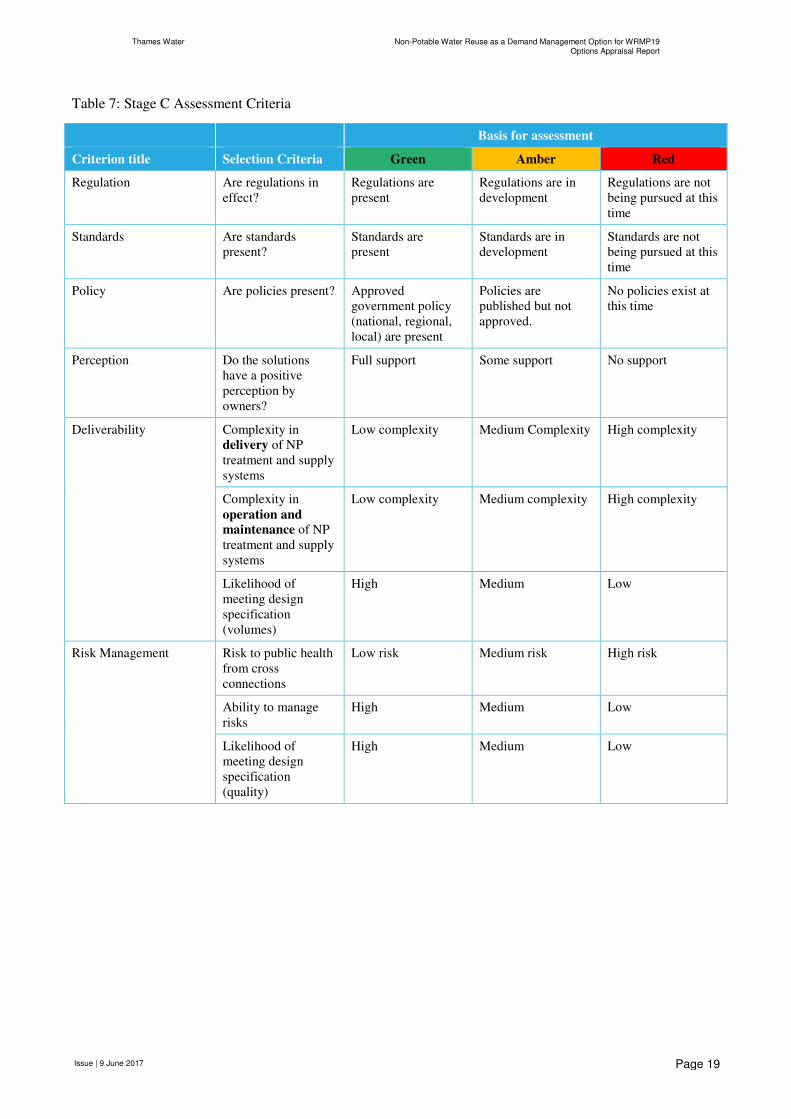
3.6 Stage D – Economically Effective Yield
Feasible options identified in Stage C will be included in the WRMP19 Demand management option
fine screening report along with other demand management options and will be compared in terms of
cost. Stage D aims at provided the cost of NPWR at DMA level for inclusion into the WRMP19
Integrated Demand Management (IDM) model. Stage D also identified NPWR options that have
highest impact in terms of co-benefits associated with NPWR.
Figure 11: Stage D - Economically Effective Yield
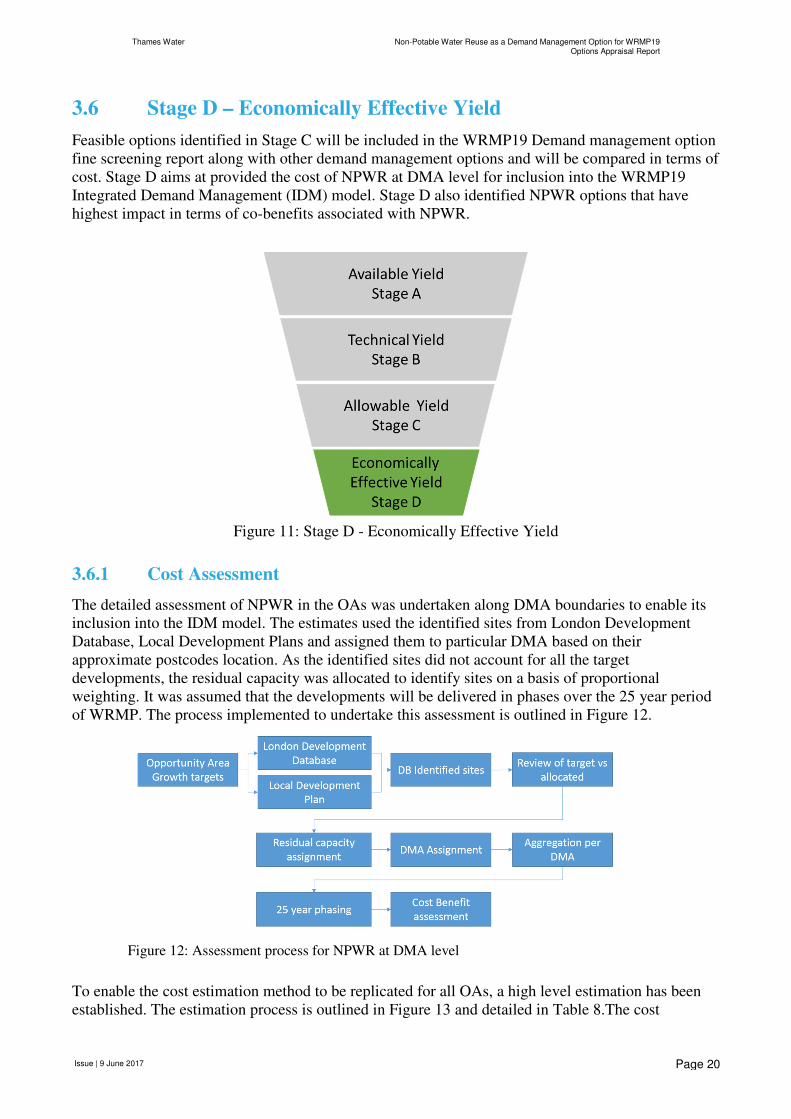
3.6.1 Cost Assessment
The detailed assessment of NPWR in the OAs was undertaken along DMA boundaries to enable its
inclusion into the IDM model. The estimates used the identified sites from London Development
Database, Local Development Plans and assigned them to particular DMA based on their
approximate postcodes location. As the identified sites did not account for all the target
developments, the residual capacity was allocated to identify sites on a basis of proportional
weighting. It was assumed that the developments will be delivered in phases over the 25 year period
of WRMP. The process implemented to undertake this assessment is outlined in Figure 12.
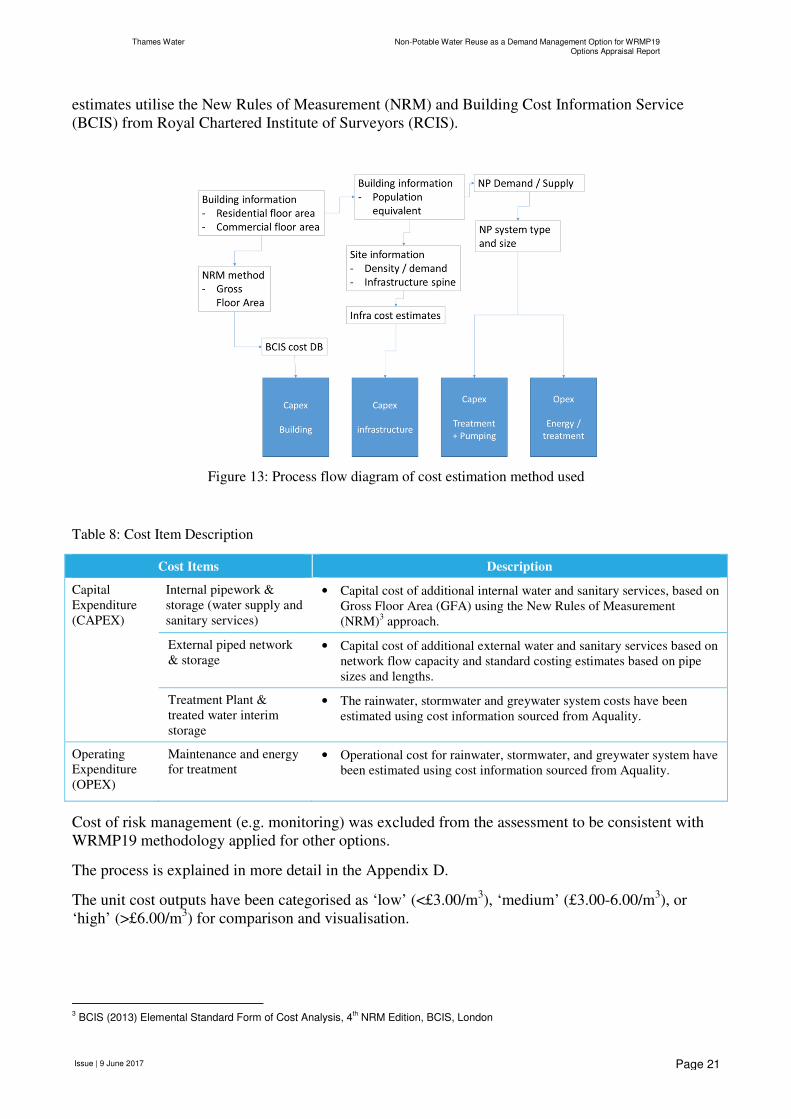
To enable the cost estimation method to be replicated for all OAs, a high level estimation has been
established. The estimation process is outlined in Figure 13 and detailed in Table 8.The cost
Figure 12: Assessment process for NPWR at DMA level
Thames Water Non-Potable Water Reuse as a Demand Management Option for WRMP19Options Appraisal Report
Issue | 9 June 2017
Page 21
estimates utilise the New Rules of Measurement (NRM) and Building Cost Information Service
(BCIS) from Royal Chartered Institute of Surveyors (RCIS).
Figure 13: Process flow diagram of cost estimation method used
Table 8: Cost Item Description
Cost Items Description
Capital
Expenditure
(CAPEX)
Internal pipework &
storage (water supply and
sanitary services)
• Capital cost of additional internal water and sanitary services, based on
Gross Floor Area (GFA) using the New Rules of Measurement
(NRM)3 approach.
External piped network
& storage • Capital cost of additional external water and sanitary services based on
network flow capacity and standard costing estimates based on pipe
sizes and lengths.
Treatment Plant &
treated water interim
storage
• The rainwater, stormwater and greywater system costs have been
estimated using cost information sourced from Aquality.
Operating
Expenditure
(OPEX)
Maintenance and energy
for treatment • Operational cost for rainwater, stormwater, and greywater system have
been estimated using cost information sourced from Aquality.
Cost of risk management (e.g. monitoring) was excluded from the assessment to be consistent with
WRMP19 methodology applied for other options.
The process is explained in more detail in the Appendix D.
The unit cost outputs have been categorised as ‘low’ (<£3.00/m3), ‘medium’ (£3.00-6.00/m
3), or
‘high’ (>£6.00/m3) for comparison and visualisation.
3 BCIS (2013) Elemental Standard Form of Cost Analysis, 4
th NRM Edition, BCIS, London
Thames Water Non-Potable Water Reuse as a Demand Management Option for WRMP19Options Appraisal Report
Issue | 9 June 2017
Page 22
Note: Although the non-potable water demand and cost assessments were undertaken at DMA levels,
the outputs in the report are aggregated and presented along the OA boundaries for purpose of
consistency and presentation.
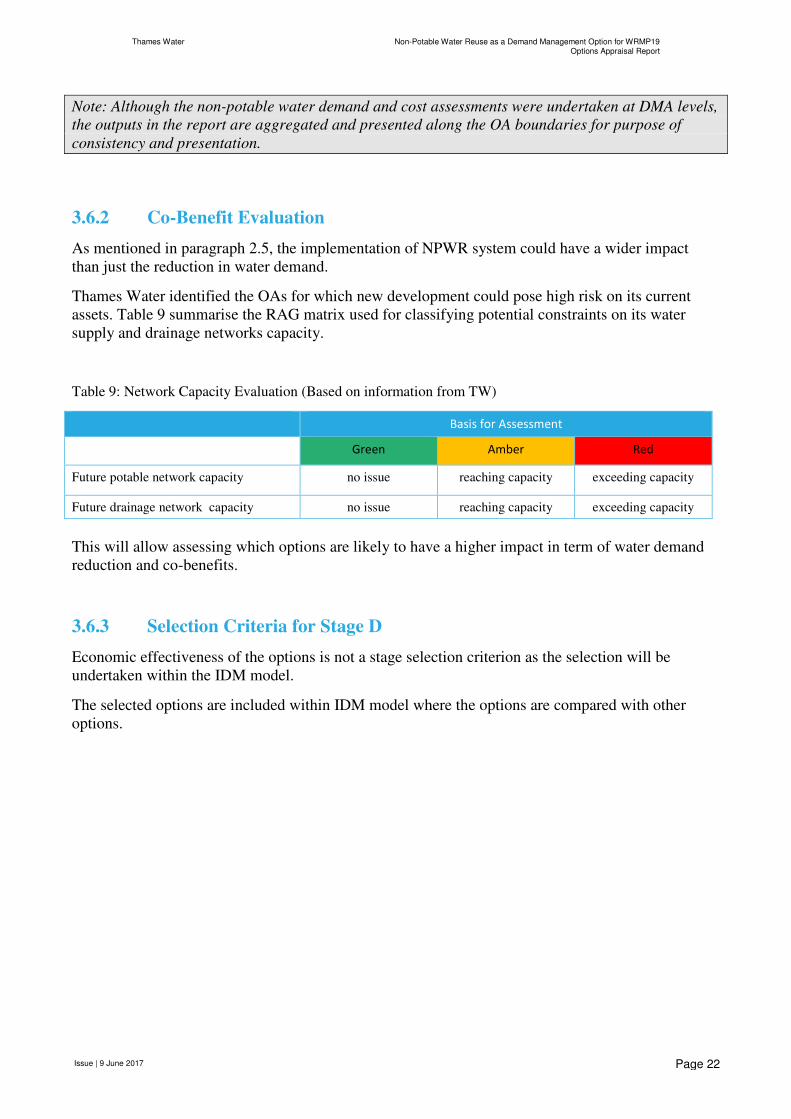
3.6.2 Co-Benefit Evaluation
As mentioned in paragraph 2.5, the implementation of NPWR system could have a wider impact
than just the reduction in water demand.
Thames Water identified the OAs for which new development could pose high risk on its current
assets. Table 9 summarise the RAG matrix used for classifying potential constraints on its water
supply and drainage networks capacity.
Table 9: Network Capacity Evaluation (Based on information from TW)
Basis for Assessment
Green Amber Red
Future potable network capacity no issue reaching capacity exceeding capacity
Future drainage network capacity no issue reaching capacity exceeding capacity
This will allow assessing which options are likely to have a higher impact in term of water demand
reduction and co-benefits.
3.6.3 Selection Criteria for Stage D
Economic effectiveness of the options is not a stage selection criterion as the selection will be
undertaken within the IDM model.
The selected options are included within IDM model where the options are compared with other
options.
Thames Water Non-Potable Water Reuse as a Demand Management Option for WRMP19Options Appraisal Report
Issue | 9 June 2017
Page 23
4 Options Appraisal
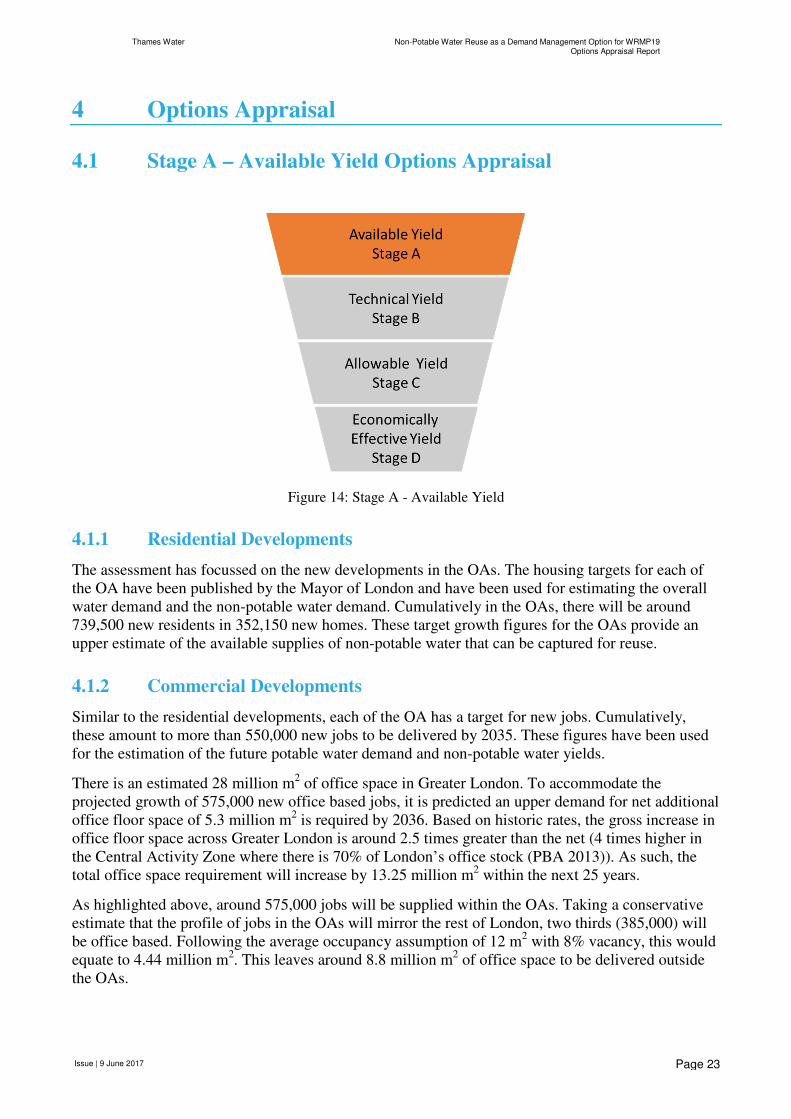
4.1 Stage A – Available Yield Options Appraisal
Figure 14: Stage A - Available Yield
4.1.1 Residential Developments
The assessment has focussed on the new developments in the OAs. The housing targets for each of
the OA have been published by the Mayor of London and have been used for estimating the overall
water demand and the non-potable water demand. Cumulatively in the OAs, there will be around
739,500 new residents in 352,150 new homes. These target growth figures for the OAs provide an
upper estimate of the available supplies of non-potable water that can be captured for reuse.
4.1.2 Commercial Developments
Similar to the residential developments, each of the OA has a target for new jobs. Cumulatively,
these amount to more than 550,000 new jobs to be delivered by 2035. These figures have been used
for the estimation of the future potable water demand and non-potable water yields.
There is an estimated 28 million m2 of office space in Greater London. To accommodate the
projected growth of 575,000 new office based jobs, it is predicted an upper demand for net additional
office floor space of 5.3 million m2 is required by 2036. Based on historic rates, the gross increase in
office floor space across Greater London is around 2.5 times greater than the net (4 times higher in
the Central Activity Zone where there is 70% of London’s office stock (PBA 2013)). As such, the
total office space requirement will increase by 13.25 million m2 within the next 25 years.
As highlighted above, around 575,000 jobs will be supplied within the OAs. Taking a conservative
estimate that the profile of jobs in the OAs will mirror the rest of London, two thirds (385,000) will
be office based. Following the average occupancy assumption of 12 m2 with 8% vacancy, this would
equate to 4.44 million m2. This leaves around 8.8 million m
2 of office space to be delivered outside
the OAs.
Thames Water Non-Potable Water Reuse as a Demand Management Option for WRMP19Options Appraisal Report
Issue | 9 June 2017
Page 24
Again taking the same office density assumptions, this new office space outside OAs would
accommodate 705,000 office employees.
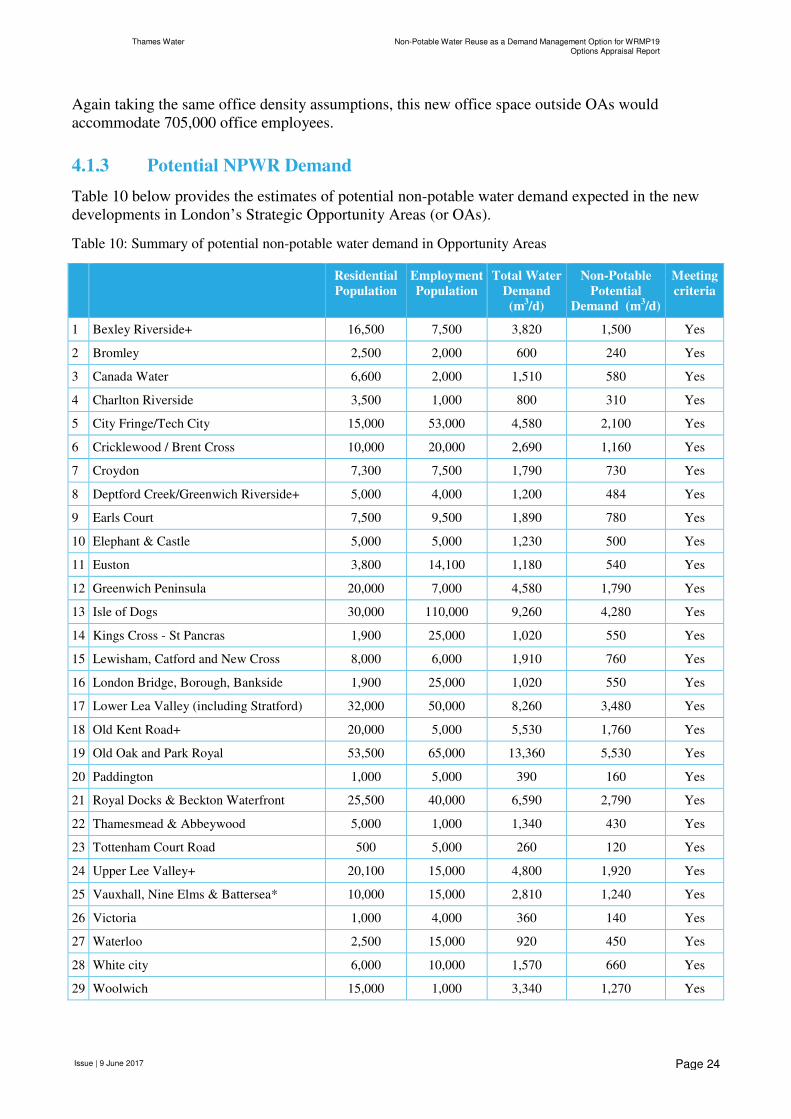
4.1.3 Potential NPWR Demand
Table 10 below provides the estimates of potential non-potable water demand expected in the new
developments in London’s Strategic Opportunity Areas (or OAs).
Table 10: Summary of potential non-potable water demand in Opportunity Areas
Residential
Population
Employment
Population
Total Water
Demand
(m3/d)
Non-Potable
Potential
Demand (m3/d)
Meeting
criteria
1 Bexley Riverside+ 16,500 7,500 3,820 1,500 Yes
2 Bromley 2,500 2,000 600 240 Yes
3 Canada Water 6,600 2,000 1,510 580 Yes
4 Charlton Riverside 3,500 1,000 800 310 Yes
5 City Fringe/Tech City 15,000 53,000 4,580 2,100 Yes
6 Cricklewood / Brent Cross 10,000 20,000 2,690 1,160 Yes
7 Croydon 7,300 7,500 1,790 730 Yes
8 Deptford Creek/Greenwich Riverside+ 5,000 4,000 1,200 484 Yes
9 Earls Court 7,500 9,500 1,890 780 Yes
10 Elephant & Castle 5,000 5,000 1,230 500 Yes
11 Euston 3,800 14,100 1,180 540 Yes
12 Greenwich Peninsula 20,000 7,000 4,580 1,790 Yes
13 Isle of Dogs 30,000 110,000 9,260 4,280 Yes
14 Kings Cross - St Pancras 1,900 25,000 1,020 550 Yes
15 Lewisham, Catford and New Cross 8,000 6,000 1,910 760 Yes
16 London Bridge, Borough, Bankside 1,900 25,000 1,020 550 Yes
17 Lower Lea Valley (including Stratford) 32,000 50,000 8,260 3,480 Yes
18 Old Kent Road+ 20,000 5,000 5,530 1,760 Yes
19 Old Oak and Park Royal 53,500 65,000 13,360 5,530 Yes
20 Paddington 1,000 5,000 390 160 Yes
21 Royal Docks & Beckton Waterfront 25,500 40,000 6,590 2,790 Yes
22 Thamesmead & Abbeywood 5,000 1,000 1,340 430 Yes
23 Tottenham Court Road 500 5,000 260 120 Yes
24 Upper Lee Valley+ 20,100 15,000 4,800 1,920 Yes
25 Vauxhall, Nine Elms & Battersea* 10,000 15,000 2,810 1,240 Yes
26 Victoria 1,000 4,000 360 140 Yes
27 Waterloo 2,500 15,000 920 450 Yes
28 White city 6,000 10,000 1,570 660 Yes
29 Woolwich 15,000 1,000 3,340 1,270 Yes
Thames Water Non-Potable Water Reuse as a Demand Management Option for WRMP19Options Appraisal Report
Issue | 9 June 2017
Page 25
Residential
Population
Employment
Population
Total Water
Demand
(m3/d)
Non-Potable
Potential
Demand (m3/d)
Meeting
criteria
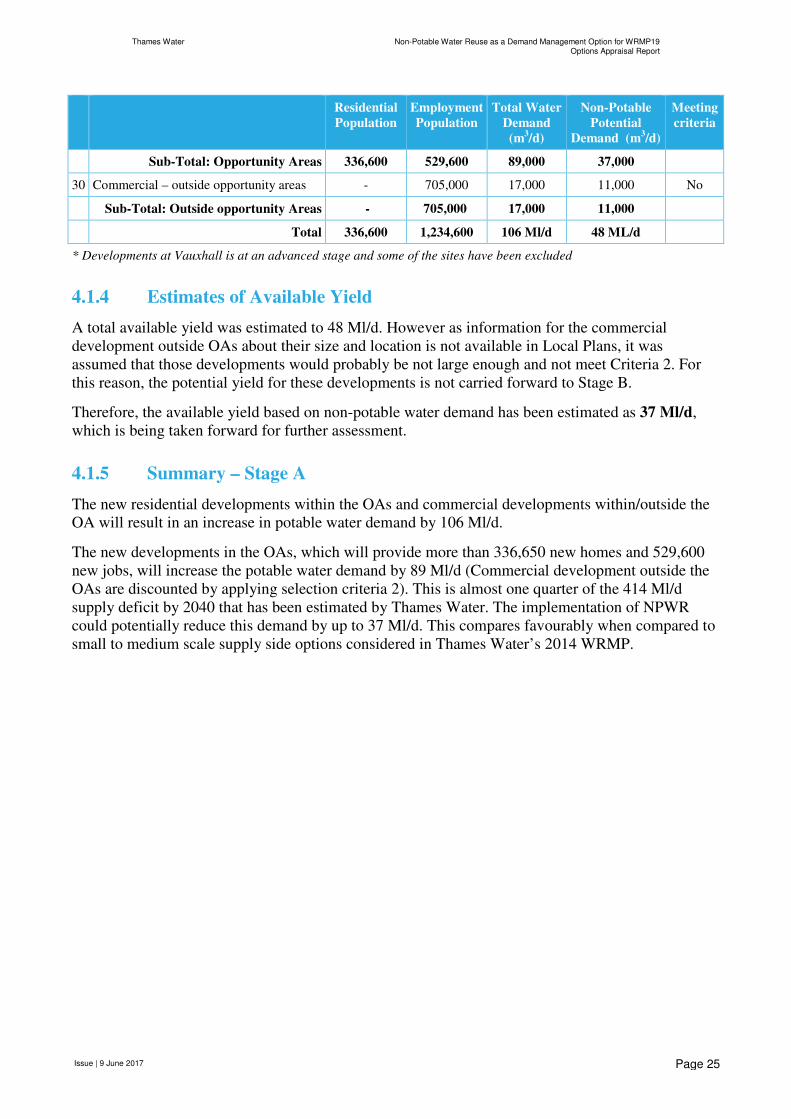
Sub-Total: Opportunity Areas 336,600 529,600 89,000 37,000
30 Commercial – outside opportunity areas - 705,000 17,000 11,000 No
Sub-Total: Outside opportunity Areas - 705,000 17,000 11,000
Total 336,600 1,234,600 106 Ml/d 48 ML/d
* Developments at Vauxhall is at an advanced stage and some of the sites have been excluded
4.1.4 Estimates of Available Yield
A total available yield was estimated to 48 Ml/d. However as information for the commercial
development outside OAs about their size and location is not available in Local Plans, it was
assumed that those developments would probably be not large enough and not meet Criteria 2. For
this reason, the potential yield for these developments is not carried forward to Stage B.
Therefore, the available yield based on non-potable water demand has been estimated as 37 Ml/d,
which is being taken forward for further assessment.
4.1.5 Summary – Stage A
The new residential developments within the OAs and commercial developments within/outside the
OA will result in an increase in potable water demand by 106 Ml/d.
The new developments in the OAs, which will provide more than 336,650 new homes and 529,600
new jobs, will increase the potable water demand by 89 Ml/d (Commercial development outside the
OAs are discounted by applying selection criteria 2). This is almost one quarter of the 414 Ml/d
supply deficit by 2040 that has been estimated by Thames Water. The implementation of NPWR
could potentially reduce this demand by up to 37 Ml/d. This compares favourably when compared to
small to medium scale supply side options considered in Thames Water’s 2014 WRMP.
Thames Water Non-Potable Water Reuse as a Demand Management Option for WRMP19Options Appraisal Report
Issue | 9 June 2017
Page 26
4.2 Stage B – Technical Yield Options Appraisal
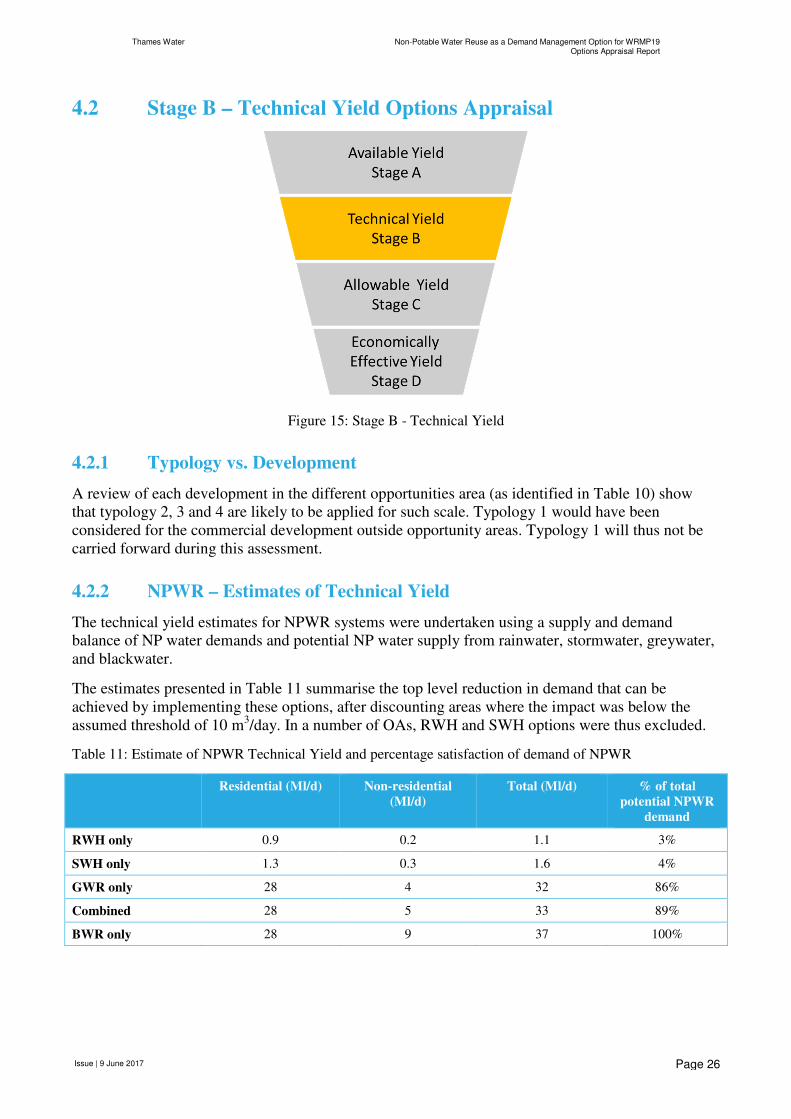
Figure 15: Stage B - Technical Yield
4.2.1 Typology vs. Development
A review of each development in the different opportunities area (as identified in Table 10) show
that typology 2, 3 and 4 are likely to be applied for such scale. Typology 1 would have been
considered for the commercial development outside opportunity areas. Typology 1 will thus not be
carried forward during this assessment.
4.2.2 NPWR – Estimates of Technical Yield
The technical yield estimates for NPWR systems were undertaken using a supply and demand
balance of NP water demands and potential NP water supply from rainwater, stormwater, greywater,
and blackwater.
The estimates presented in Table 11 summarise the top level reduction in demand that can be
achieved by implementing these options, after discounting areas where the impact was below the
assumed threshold of 10 m3/day. In a number of OAs, RWH and SWH options were thus excluded.
Table 11: Estimate of NPWR Technical Yield and percentage satisfaction of demand of NPWR
Residential (Ml/d) Non-residential
(Ml/d)
Total (Ml/d) % of total
potential NPWR
demand
RWH only 0.9 0.2 1.1 3%
SWH only 1.3 0.3 1.6 4%
GWR only 28 4 32 86%
Combined 28 5 33 89%
BWR only 28 9 37 100%
Thames Water Non-Potable Water Reuse as a Demand Management Option for WRMP19Options Appraisal Report
Issue | 9 June 2017
Page 27
With the exception of blackwater reuse, where all the non-potable demand can be met, the supply-
demand balance was undertaken for type of development within each DMA.
These options are taken forward for further assessment in Stage C.
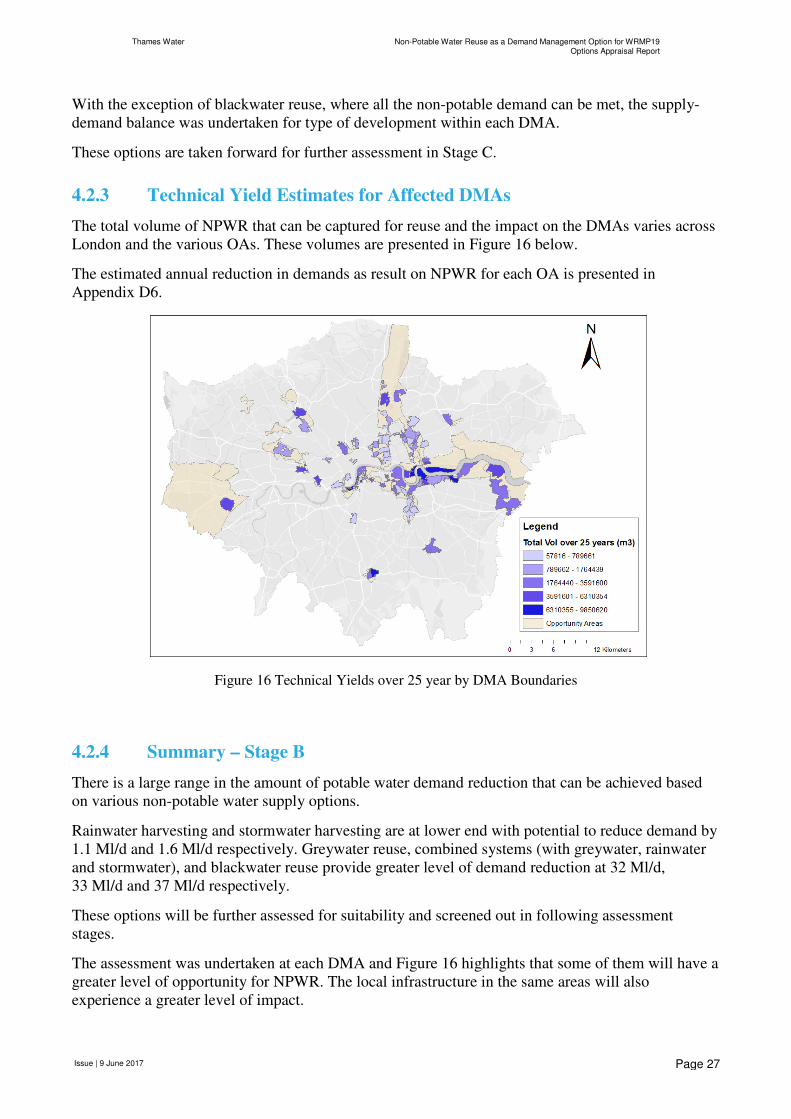
4.2.3 Technical Yield Estimates for Affected DMAs
The total volume of NPWR that can be captured for reuse and the impact on the DMAs varies across
London and the various OAs. These volumes are presented in Figure 16 below.
The estimated annual reduction in demands as result on NPWR for each OA is presented in
Appendix D6.
Figure 16 Technical Yields over 25 year by DMA Boundaries
4.2.4 Summary – Stage B
There is a large range in the amount of potable water demand reduction that can be achieved based
on various non-potable water supply options.
Rainwater harvesting and stormwater harvesting are at lower end with potential to reduce demand by
1.1 Ml/d and 1.6 Ml/d respectively. Greywater reuse, combined systems (with greywater, rainwater
and stormwater), and blackwater reuse provide greater level of demand reduction at 32 Ml/d,
33 Ml/d and 37 Ml/d respectively.
These options will be further assessed for suitability and screened out in following assessment
stages.
The assessment was undertaken at each DMA and Figure 16 highlights that some of them will have a
greater level of opportunity for NPWR. The local infrastructure in the same areas will also
experience a greater level of impact.
Thames Water Non-Potable Water Reuse as a Demand Management Option for WRMP19Options Appraisal Report
Issue | 9 June 2017
Page 28
4.3 Stage C – Allowable Yield Options Appraisal
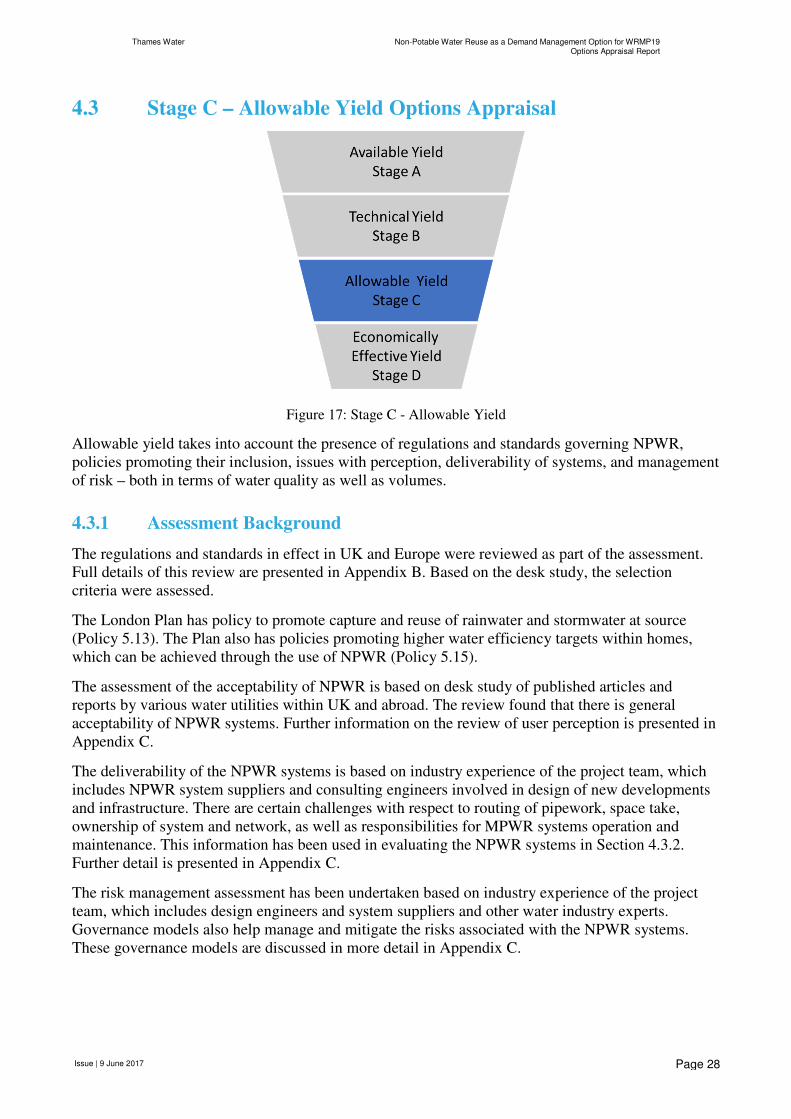
Figure 17: Stage C - Allowable Yield
Allowable yield takes into account the presence of regulations and standards governing NPWR,
policies promoting their inclusion, issues with perception, deliverability of systems, and management
of risk – both in terms of water quality as well as volumes.
4.3.1 Assessment Background
The regulations and standards in effect in UK and Europe were reviewed as part of the assessment.
Full details of this review are presented in Appendix B. Based on the desk study, the selection
criteria were assessed.
The London Plan has policy to promote capture and reuse of rainwater and stormwater at source
(Policy 5.13). The Plan also has policies promoting higher water efficiency targets within homes,
which can be achieved through the use of NPWR (Policy 5.15).
The assessment of the acceptability of NPWR is based on desk study of published articles and
reports by various water utilities within UK and abroad. The review found that there is general
acceptability of NPWR systems. Further information on the review of user perception is presented in
Appendix C.
The deliverability of the NPWR systems is based on industry experience of the project team, which
includes NPWR system suppliers and consulting engineers involved in design of new developments
and infrastructure. There are certain challenges with respect to routing of pipework, space take,
ownership of system and network, as well as responsibilities for MPWR systems operation and
maintenance. This information has been used in evaluating the NPWR systems in Section 4.3.2.
Further detail is presented in Appendix C.
The risk management assessment has been undertaken based on industry experience of the project
team, which includes design engineers and system suppliers and other water industry experts.
Governance models also help manage and mitigate the risks associated with the NPWR systems.
These governance models are discussed in more detail in Appendix C.

Thames Water Non-Potable Water Reuse as a Demand Management Option for WRMP19Options Appraisal Report
Issue | 9 June 2017
Page 29
4.3.2 System Suitability Analysis
Table 12 presents the suitability of the various NPWR system types based on the above criteria.
Table 12: Suitability matrix of NPWR systems
Criterion title Criteria RWH SWH GWR Combined BWR
Regulation Are regulations in
effect?
Not being
pursued at
this time
Not being
pursued at
this time
Not being
pursued at
this time
Not being
pursued at
this time
Not being
pursued at
this time
Standards Are standards
present?
Standards are
present
Standards are
present
Standards are
present
Standards are
present
Not being
pursued at
this time
Policy Are policies
present?
Policies are
present
Policies are
present
Policies are
present
Policies are
present
Not excluded
as a solution,
but there are
no specific
policies in
support.
Perception Do the solutions
have a positive
perception by
owners?
Full support Some support Some support Some support Some support
(non-
residential)
Deliverability Complexity in
delivery of NP
treatment and
supply systems
Low Medium Medium Medium High
Complexity in
operation and maintenance of
NP treatment and
supply systems
Low Medium Medium Medium High
Likelihood of
meeting design
performance
(volumes)
Low Medium High High High
Risk
Management
Risk to public
health from
operational
incidents and
undetected cross
connections
Low risk Medium risk Medium risk Medium risk High risk
Ability to manage
risks
High Medium Medium Medium Medium
Likelihood of
meeting design
performance
(quality)
High Medium Medium Medium High
Red 2 1 1 5
Amber 0 7 6 3
Green 8 2 3 2
Thames Water Non-Potable Water Reuse as a Demand Management Option for WRMP19Options Appraisal Report
Issue | 9 June 2017
Page 30
As the worst performing options, blackwater recycling system, as a non-potable water source, is not
carried forward in the assessment.
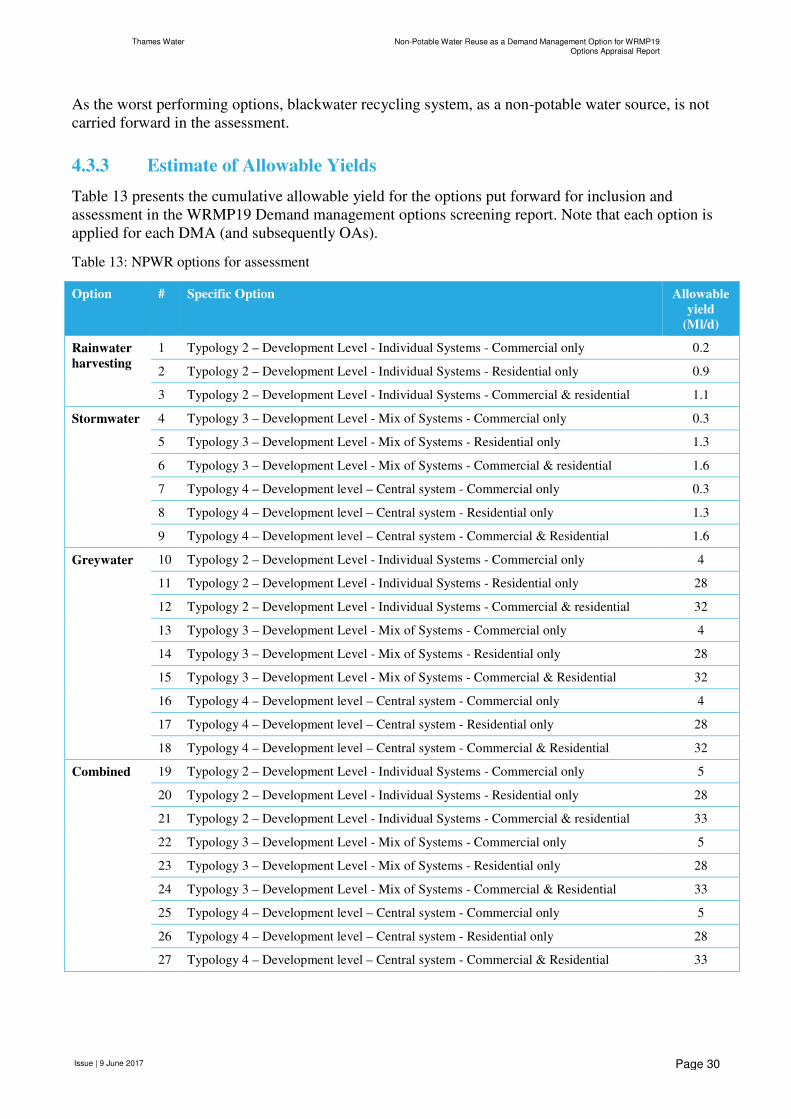
4.3.3 Estimate of Allowable Yields
Table 13 presents the cumulative allowable yield for the options put forward for inclusion and
assessment in the WRMP19 Demand management options screening report. Note that each option is
applied for each DMA (and subsequently OAs).
Table 13: NPWR options for assessment
Option # Specific Option Allowable
yield
(Ml/d)
Rainwater
harvesting
1 Typology 2 – Development Level - Individual Systems - Commercial only 0.2
2 Typology 2 – Development Level - Individual Systems - Residential only 0.9
3 Typology 2 – Development Level - Individual Systems - Commercial & residential 1.1
Stormwater 4 Typology 3 – Development Level - Mix of Systems - Commercial only 0.3
5 Typology 3 – Development Level - Mix of Systems - Residential only 1.3
6 Typology 3 – Development Level - Mix of Systems - Commercial & residential 1.6
7 Typology 4 – Development level – Central system - Commercial only 0.3
8 Typology 4 – Development level – Central system - Residential only 1.3
9 Typology 4 – Development level – Central system - Commercial & Residential 1.6
Greywater 10 Typology 2 – Development Level - Individual Systems - Commercial only 4
11 Typology 2 – Development Level - Individual Systems - Residential only 28
12 Typology 2 – Development Level - Individual Systems - Commercial & residential 32
13 Typology 3 – Development Level - Mix of Systems - Commercial only 4
14 Typology 3 – Development Level - Mix of Systems - Residential only 28
15 Typology 3 – Development Level - Mix of Systems - Commercial & Residential 32
16 Typology 4 – Development level – Central system - Commercial only 4
17 Typology 4 – Development level – Central system - Residential only 28
18 Typology 4 – Development level – Central system - Commercial & Residential 32
Combined 19 Typology 2 – Development Level - Individual Systems - Commercial only 5
20 Typology 2 – Development Level - Individual Systems - Residential only 28
21 Typology 2 – Development Level - Individual Systems - Commercial & residential 33
22 Typology 3 – Development Level - Mix of Systems - Commercial only 5
23 Typology 3 – Development Level - Mix of Systems - Residential only 28
24 Typology 3 – Development Level - Mix of Systems - Commercial & Residential 33
25 Typology 4 – Development level – Central system - Commercial only 5
26 Typology 4 – Development level – Central system - Residential only 28
27 Typology 4 – Development level – Central system - Commercial & Residential 33
Thames Water Non-Potable Water Reuse as a Demand Management Option for WRMP19Options Appraisal Report
Issue | 9 June 2017
Page 31
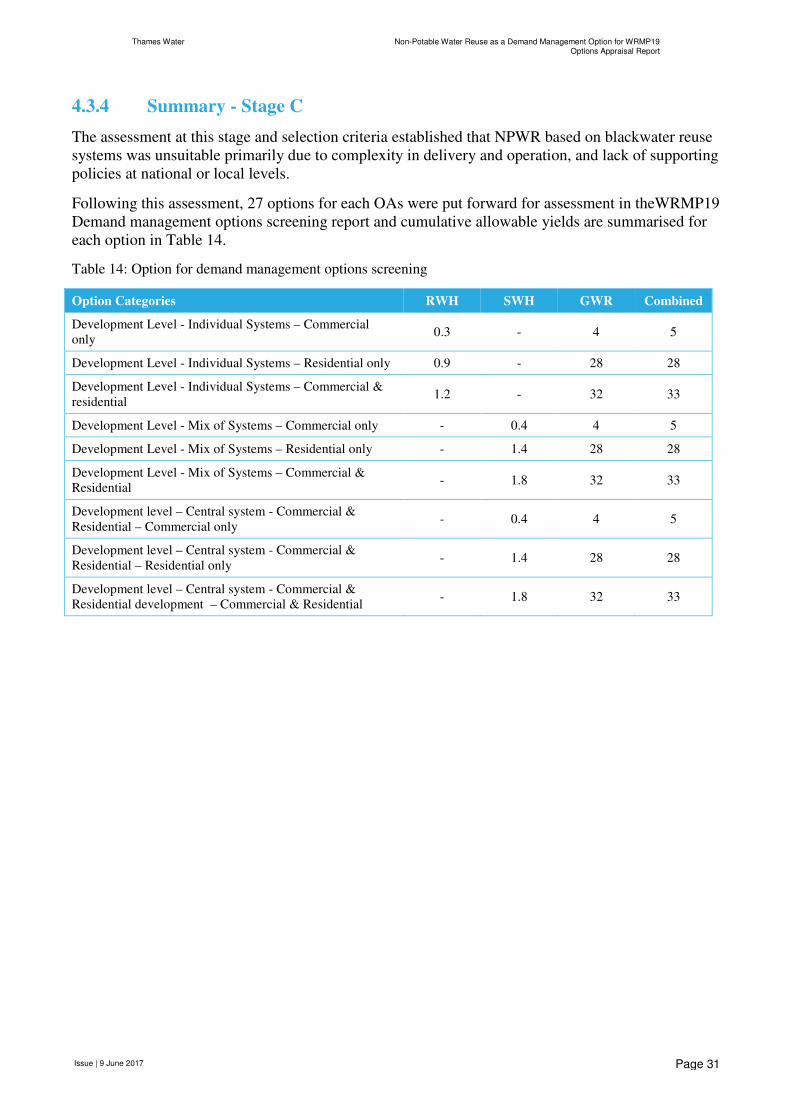
4.3.4 Summary - Stage C
The assessment at this stage and selection criteria established that NPWR based on blackwater reuse
systems was unsuitable primarily due to complexity in delivery and operation, and lack of supporting
policies at national or local levels.
Following this assessment, 27 options for each OAs were put forward for assessment in theWRMP19
Demand management options screening report and cumulative allowable yields are summarised for
each option in Table 14.
Table 14: Option for demand management options screening
Option Categories RWH SWH GWR Combined
Development Level - Individual Systems – Commercial
only 0.3 - 4 5
Development Level - Individual Systems – Residential only 0.9 - 28 28
Development Level - Individual Systems – Commercial &
residential 1.2 - 32 33
Development Level - Mix of Systems – Commercial only - 0.4 4 5
Development Level - Mix of Systems – Residential only - 1.4 28 28
Development Level - Mix of Systems – Commercial &
Residential - 1.8 32 33
Development level – Central system - Commercial &
Residential – Commercial only - 0.4 4 5
Development level – Central system - Commercial &
Residential – Residential only - 1.4 28 28
Development level – Central system - Commercial &
Residential development – Commercial & Residential - 1.8 32 33
Thames Water Non-Potable Water Reuse as a Demand Management Option for WRMP19Options Appraisal Report
Issue | 9 June 2017
Page 32
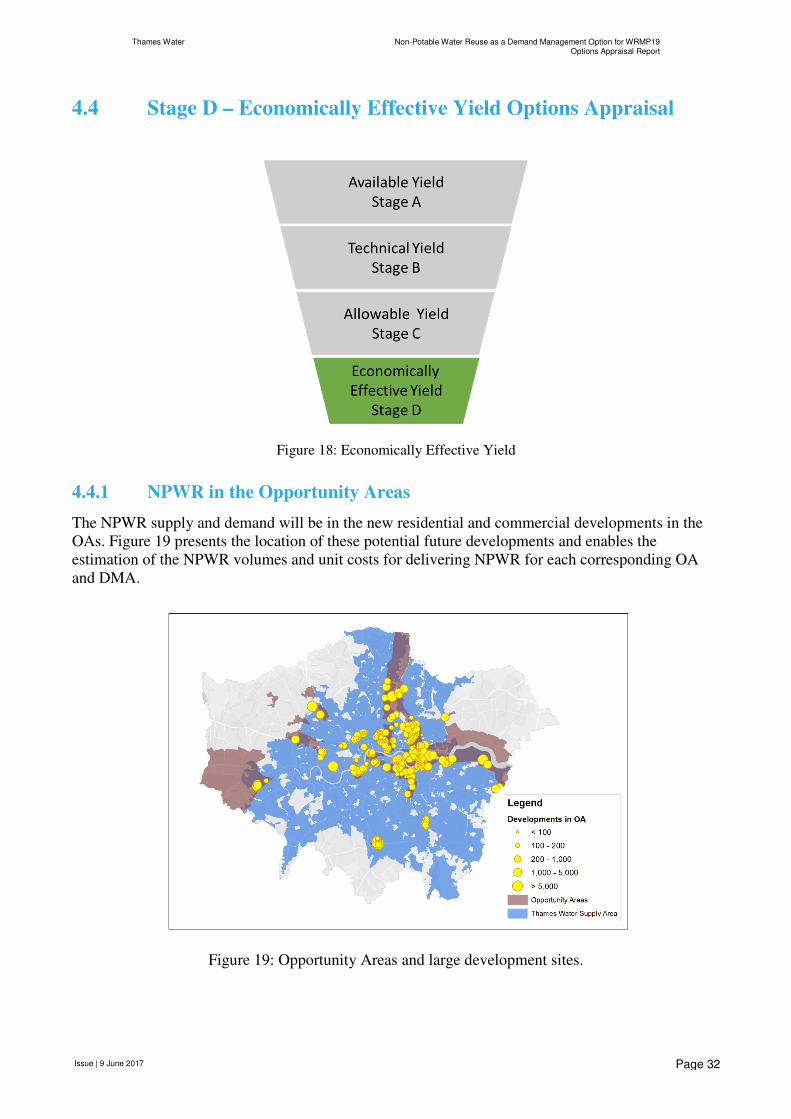
4.4 Stage D – Economically Effective Yield Options Appraisal
Figure 18: Economically Effective Yield
4.4.1 NPWR in the Opportunity Areas
The NPWR supply and demand will be in the new residential and commercial developments in the
OAs. Figure 19 presents the location of these potential future developments and enables the
estimation of the NPWR volumes and unit costs for delivering NPWR for each corresponding OA
and DMA.
Figure 19: Opportunity Areas and large development sites.
Thames Water Non-Potable Water Reuse as a Demand Management Option for WRMP19Options Appraisal Report
Issue | 9 June 2017
Page 33
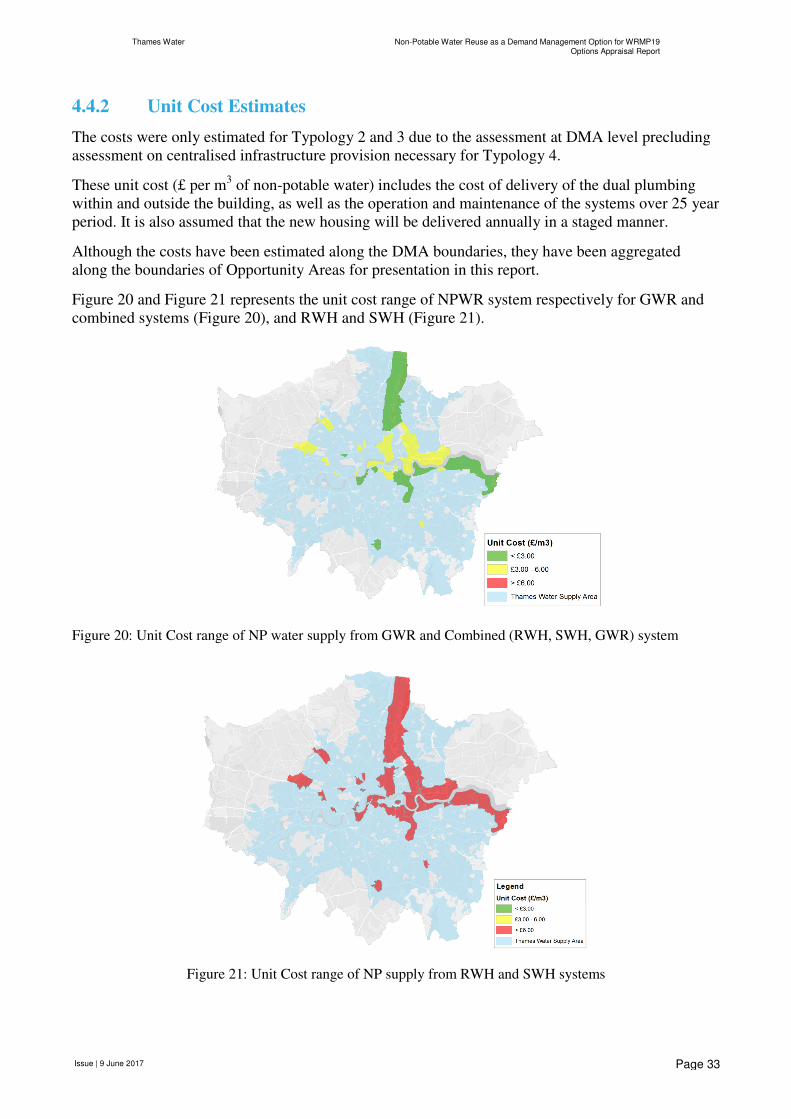
4.4.2 Unit Cost Estimates
The costs were only estimated for Typology 2 and 3 due to the assessment at DMA level precluding
assessment on centralised infrastructure provision necessary for Typology 4.
These unit cost (£ per m3 of non-potable water) includes the cost of delivery of the dual plumbing
within and outside the building, as well as the operation and maintenance of the systems over 25 year
period. It is also assumed that the new housing will be delivered annually in a staged manner.
Although the costs have been estimated along the DMA boundaries, they have been aggregated
along the boundaries of Opportunity Areas for presentation in this report.
Figure 20 and Figure 21 represents the unit cost range of NPWR system respectively for GWR and
combined systems (Figure 20), and RWH and SWH (Figure 21).
Figure 20: Unit Cost range of NP water supply from GWR and Combined (RWH, SWH, GWR) system
Figure 21: Unit Cost range of NP supply from RWH and SWH systems
Thames Water Non-Potable Water Reuse as a Demand Management Option for WRMP19Options Appraisal Report
Issue | 9 June 2017
Page 34
4.4.3 Estimate of Economically Effective Yield
Cost is not a stage selection criteria and the appraisal will be undertaken in the IDM model. The
Economically Effective Yield will be based on the outputs of the latter process.
However, in order to be consistent with WRMP19 methodology, options that are mutually exclusives
and are least cost efficient were not selected for input into the IDM model. Combined NPWR
systems are mutually exclusive with RWH, SWH and RWH and the most cost efficient NPWR
option for each OAs.
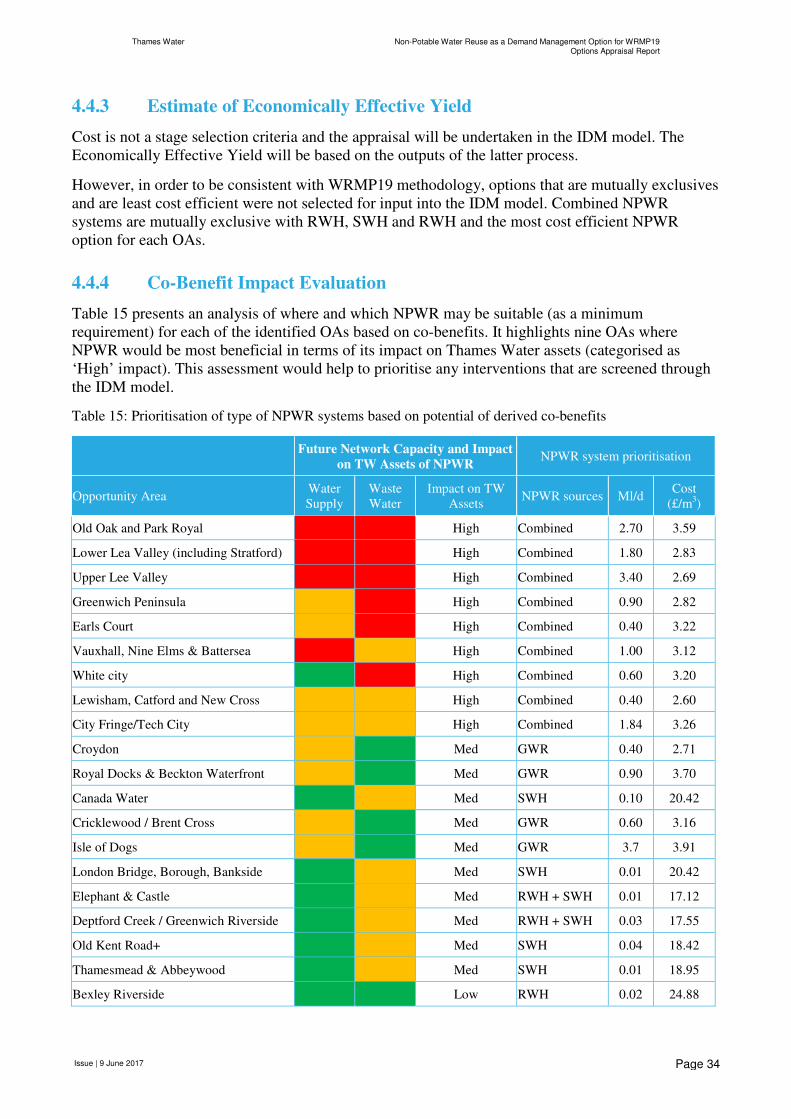
4.4.4 Co-Benefit Impact Evaluation
Table 15 presents an analysis of where and which NPWR may be suitable (as a minimum
requirement) for each of the identified OAs based on co-benefits. It highlights nine OAs where
NPWR would be most beneficial in terms of its impact on Thames Water assets (categorised as
‘High’ impact). This assessment would help to prioritise any interventions that are screened through
the IDM model.
Table 15: Prioritisation of type of NPWR systems based on potential of derived co-benefits
Future Network Capacity and Impact
on TW Assets of NPWR NPWR system prioritisation
Opportunity Area Water
Supply
Waste
Water
Impact on TW
Assets NPWR sources Ml/d
Cost
(£/m3)
Old Oak and Park Royal High Combined 2.70 3.59
Lower Lea Valley (including Stratford) High Combined 1.80 2.83
Upper Lee Valley High Combined 3.40 2.69
Greenwich Peninsula High Combined 0.90 2.82
Earls Court High Combined 0.40 3.22
Vauxhall, Nine Elms & Battersea High Combined 1.00 3.12
White city High Combined 0.60 3.20
Lewisham, Catford and New Cross High Combined 0.40 2.60
City Fringe/Tech City High Combined 1.84 3.26
Croydon Med GWR 0.40 2.71
Royal Docks & Beckton Waterfront Med GWR 0.90 3.70
Canada Water Med SWH 0.10 20.42
Cricklewood / Brent Cross Med GWR 0.60 3.16
Isle of Dogs Med GWR 3.7 3.91
London Bridge, Borough, Bankside Med SWH 0.01 20.42
Elephant & Castle Med RWH + SWH 0.01 17.12
Deptford Creek / Greenwich Riverside Med RWH + SWH 0.03 17.55
Old Kent Road+ Med SWH 0.04 18.42
Thamesmead & Abbeywood Med SWH 0.01 18.95
Bexley Riverside Low RWH 0.02 24.88
Thames Water Non-Potable Water Reuse as a Demand Management Option for WRMP19Options Appraisal Report
Issue | 9 June 2017
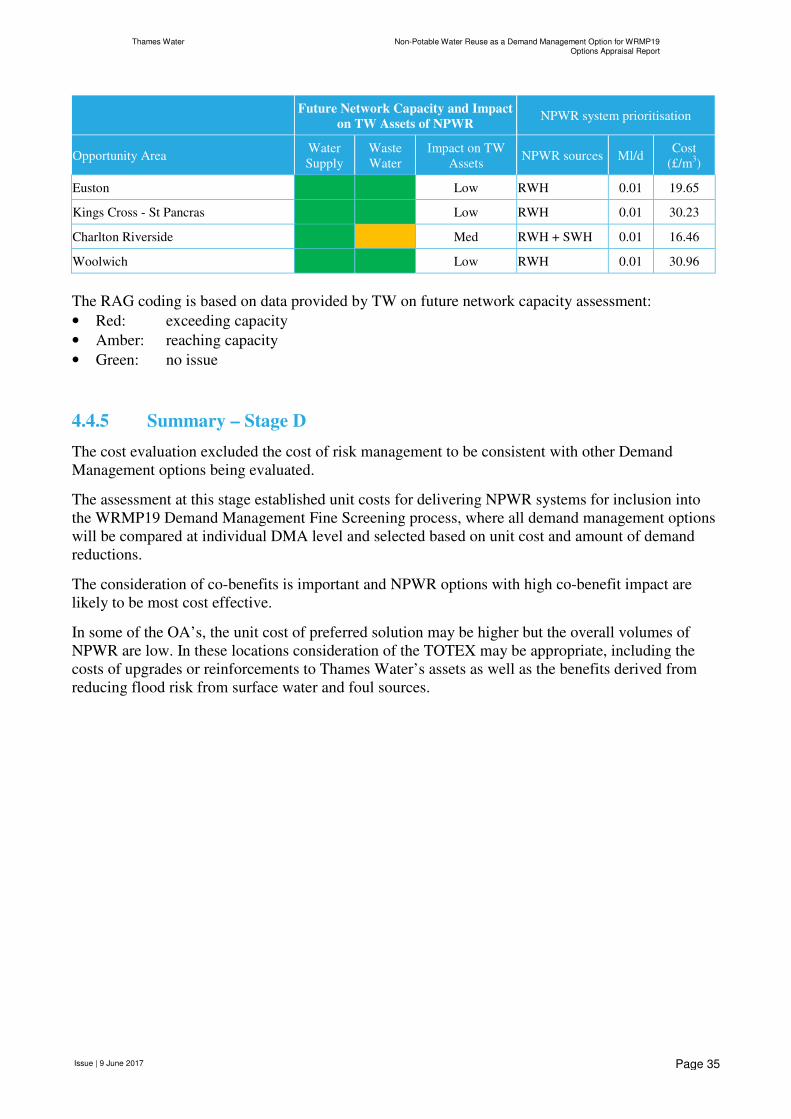
Page 35
Future Network Capacity and Impact
on TW Assets of NPWR NPWR system prioritisation
Opportunity Area Water
Supply
Waste
Water
Impact on TW
Assets NPWR sources Ml/d
Cost
(£/m3)
Euston Low RWH 0.01 19.65
Kings Cross - St Pancras Low RWH 0.01 30.23
Charlton Riverside Med RWH + SWH 0.01 16.46
Woolwich Low RWH 0.01 30.96
The RAG coding is based on data provided by TW on future network capacity assessment:
• Red: exceeding capacity
• Amber: reaching capacity
• Green: no issue
4.4.5 Summary – Stage D
The cost evaluation excluded the cost of risk management to be consistent with other Demand
Management options being evaluated.
The assessment at this stage established unit costs for delivering NPWR systems for inclusion into
the WRMP19 Demand Management Fine Screening process, where all demand management options
will be compared at individual DMA level and selected based on unit cost and amount of demand
reductions.
The consideration of co-benefits is important and NPWR options with high co-benefit impact are
likely to be most cost effective.
In some of the OA’s, the unit cost of preferred solution may be higher but the overall volumes of
NPWR are low. In these locations consideration of the TOTEX may be appropriate, including the
costs of upgrades or reinforcements to Thames Water’s assets as well as the benefits derived from
reducing flood risk from surface water and foul sources.
Thames Water Non-Potable Water Reuse as a Demand Management Option for WRMP19Options Appraisal Report
Issue | 9 June 2017
Page 36
5 Summary & Conclusions
The project has evaluated the potential of NPWR to reduce potable water demand. It has shown that
NPWR in new developments can have a material impact on the overall demand for potable water
within London. However the level of impact varies across the Opportunity Areas and the District
Metered Areas.
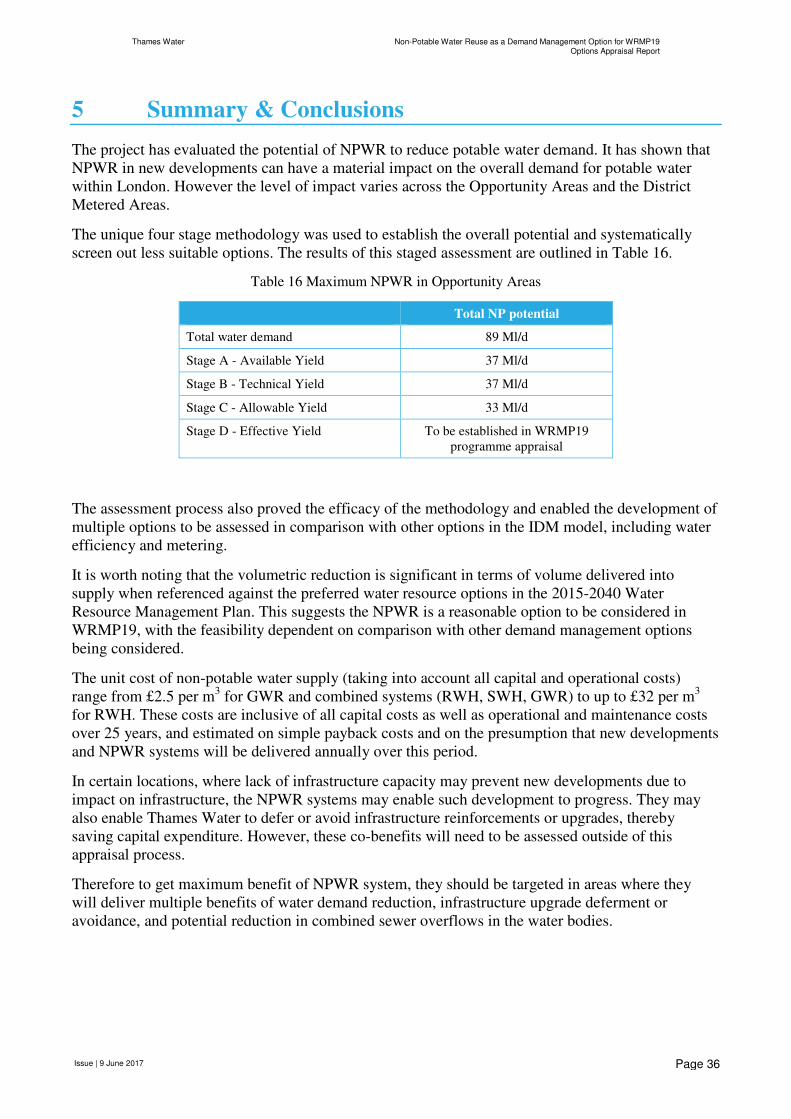
The unique four stage methodology was used to establish the overall potential and systematically
screen out less suitable options. The results of this staged assessment are outlined in Table 16.
Table 16 Maximum NPWR in Opportunity Areas
Total NP potential
Total water demand 89 Ml/d
Stage A - Available Yield 37 Ml/d
Stage B - Technical Yield 37 Ml/d
Stage C - Allowable Yield 33 Ml/d
Stage D - Effective Yield To be established in WRMP19
programme appraisal
The assessment process also proved the efficacy of the methodology and enabled the development of
multiple options to be assessed in comparison with other options in the IDM model, including water
efficiency and metering.
It is worth noting that the volumetric reduction is significant in terms of volume delivered into
supply when referenced against the preferred water resource options in the 2015-2040 Water
Resource Management Plan. This suggests the NPWR is a reasonable option to be considered in
WRMP19, with the feasibility dependent on comparison with other demand management options
being considered.
The unit cost of non-potable water supply (taking into account all capital and operational costs)
range from £2.5 per m3 for GWR and combined systems (RWH, SWH, GWR) to up to £32 per m
3
for RWH. These costs are inclusive of all capital costs as well as operational and maintenance costs
over 25 years, and estimated on simple payback costs and on the presumption that new developments
and NPWR systems will be delivered annually over this period.
In certain locations, where lack of infrastructure capacity may prevent new developments due to
impact on infrastructure, the NPWR systems may enable such development to progress. They may
also enable Thames Water to defer or avoid infrastructure reinforcements or upgrades, thereby
saving capital expenditure. However, these co-benefits will need to be assessed outside of this
appraisal process.
Therefore to get maximum benefit of NPWR system, they should be targeted in areas where they
will deliver multiple benefits of water demand reduction, infrastructure upgrade deferment or
avoidance, and potential reduction in combined sewer overflows in the water bodies.

Appendix A
Installation and Performance
Review of NPWR systems
Thames Water Non-Potable Water Reuse as a Demand Management Option for WRMP19Options Appraisal Report
Issue | 9 June 2017 Page A1
A1 Technology Overview
Various systems are available in the marketplace for capture and reuse of harvested rainwater, and
stormwater, greywater and blackwater (or wastewater) for non-potable applications.
A1.1 Rainwater Harvesting
Rainwater from roof surface is the least polluted source of non-potable water and in most
circumstances it can be used without further treatment. Therefore, physical treatment systems, such
as filtration, can suffice. However, for large installations, filtration and disinfection of the harvested
rainwater using chlorine dosing or UV disinfection is commonly applied to minimise risks to health
and wellbeing of building occupants.
A1.2 Stormwater Harvesting
Stormwater from pedestrianized areas or road surfaces have a higher pollutant load than rainwater
and requires physical and chemical treatment prior to NPWR. Where pollutant loads are highest,
such as highly urbanised areas, a number of pre-filtration solutions are available that use
geosythentic membranes for filtration (e.g. fibrous geotextiles) and treatment (e.g. Biomat by
Polypipe).
To manage risk to health and wellbeing from NPWR within buildings, following initial filtration the
harvested stormwater can be treated using similar treatment systems that are used to treat greywater.
A1.3 Greywater Recycling
Greywater is collected from bath, shower and bathroom sinks. For greywater recycling there is not
yet an established treatment process. Different processes have entered the market and some are no
longer available. Below are some illustrative examples of systems and technologies that have entered
the market.
a) Short retention systems
Although small and fairly cost effective, short retention systems such as the EcoPlay have not meet
required water quality standards set by the BS 8525:2010 and have been removed from the market.
Similarly, a later version from ReAqua with chemical dosing was taken off the market as the system
was not as ‘maintenance free’ as expected.
b) Biological system with UV disinfection
A biological treatment process combined with UV disinfection, mainly introduced by Pontos, has
had initial success but was withdrawn from the market. The process relies heavily on the biology
operating effectively at all times and any disturbance of the biology can have an impact on the water
quality and operation of the system.
c) Physical treatment systems with chemical disinfection
A sand filter system called “Spruce” filter has been used to treat greywater. As the water quality does
not achieve BS 8525 standards, it uses a chlorine disinfection component. Although the system can
treat water quickly, the treatment process seems unreliable, the biological characterisitcs of the raw
Thames Water Non-Potable Water Reuse as a Demand Management Option for WRMP19Options Appraisal Report
Issue | 9 June 2017 Page A2
greywater having an impact. The use of chemicals makes the system less sustainable and adds to
operational issues that come with chemical dosing.
d) Bio-mechanical systems
Bio-mechanical systems are dominating the market using all types of membranes. Although using
biology for pre-treatment, the various systems do not reliable completely on the biology. The final
treatment step is a membrane. Using ultra-filtration membranes, it withholds bacteria and viruses
thus disinfecting the treated water. The system only uses electricity to operate which makes the
system very sustainable.
A1.3.1 Trends in System Costs
Greywater recycling systems were introduced in the domestic market over 20 years ago. Early
designs aimed for standard one family houses using all types of “treatment”. With time, systems for
apartments or hotels etc. were introduced. In order to cope with larger treatment capacity, a multiple
of smaller systems were used to achieve this. Due to rising demand for larger systems suppliers
started to offer larger standardised systems at reduced cost. With further demand, especially for
membranes due to MBR technology becoming the dominating treatment process, membrane
suppliers started to develop bespoke membranes for greywater treatment. This allowed the treatment
efficiency to increase by 30% and therefore a reduction in price per m3 treatment capacity.
A1.3.2 Change Factors
Prices are influenced by three factors: competition, technological development and market size.
Competition forces suppliers of systems to apply discounts in order to win projects. These discounts
can differ quite significantly depending on how keen the suppliers are to win a project.
Greywater recycling is undergoing quite a development in terms of the technology used. The market
is young and new concepts constantly evolve to treat greywater more effectively or to higher
standards. Not only has the technology itself an impact on the price but also the standardisation of
the process and the way this is assembled.
With a growing market, supply chain and manufacturing further reduces price simply due to number
of system produced and increased competition as it will attract more players
A1.3.3 Technology Trends
There are new membrane systems developed offering further treatment efficiencies, space and
operational cost reductions. They are being developed and tested and should hit the market within the
next two years.
Detailed information about their operational capabilities, capital costs and cost of operation are not
available. However, based on historic improvements, they are likely to be more efficient in terms of
treatment and thus cost.
A1.4 Blackwater Recycling
Blackwater (or wastewater) is the waste effluent within municipal sewerage network and the
blackwater treatment systems capture and treat the waste effluent stream for further use. The treated
effluent from the blackwater treatment systems around the world are predominantly used for non-
potable uses (e.g. reclaimed water networks in San Francisco and Bay Area).
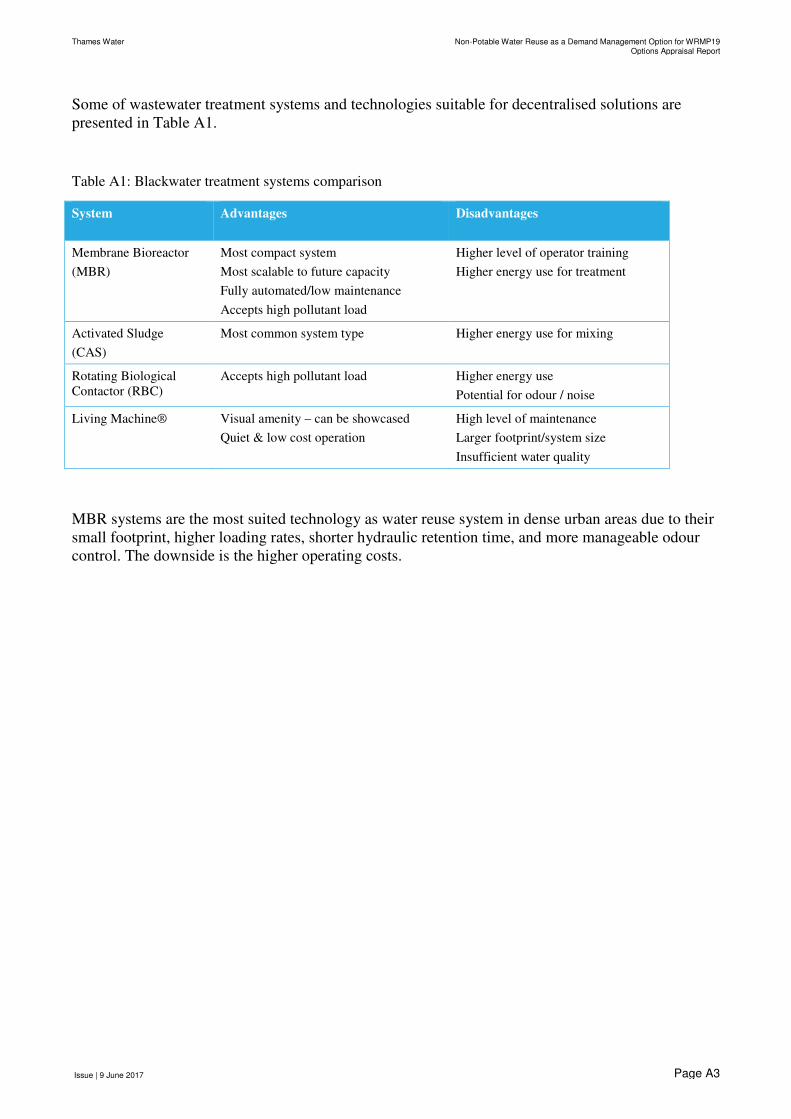
Thames Water Non-Potable Water Reuse as a Demand Management Option for WRMP19Options Appraisal Report
Issue | 9 June 2017 Page A3
Some of wastewater treatment systems and technologies suitable for decentralised solutions are
presented in Table A1.
Table A1: Blackwater treatment systems comparison
System Advantages Disadvantages
Membrane Bioreactor
(MBR)
Most compact system
Most scalable to future capacity
Fully automated/low maintenance
Accepts high pollutant load
Higher level of operator training
Higher energy use for treatment
Activated Sludge
(CAS)
Most common system type Higher energy use for mixing
Rotating Biological
Contactor (RBC)
Accepts high pollutant load Higher energy use
Potential for odour / noise
Living Machine® Visual amenity – can be showcased
Quiet & low cost operation
High level of maintenance
Larger footprint/system size
Insufficient water quality
MBR systems are the most suited technology as water reuse system in dense urban areas due to their
small footprint, higher loading rates, shorter hydraulic retention time, and more manageable odour
control. The downside is the higher operating costs.
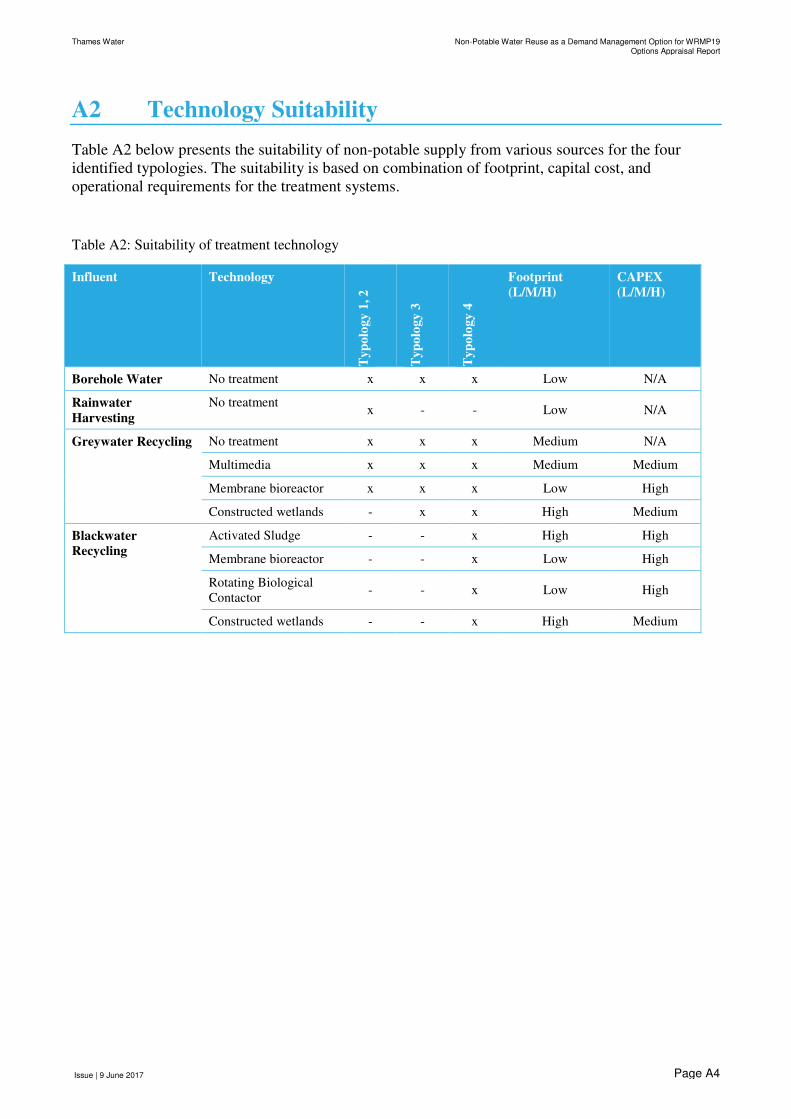
Thames Water Non-Potable Water Reuse as a Demand Management Option for WRMP19Options Appraisal Report
Issue | 9 June 2017 Page A4
A2 Technology Suitability
Table A2 below presents the suitability of non-potable supply from various sources for the four
identified typologies. The suitability is based on combination of footprint, capital cost, and
operational requirements for the treatment systems.
Table A2: Suitability of treatment technology
Influent Technology
Ty
po
log
y 1
, 2
Ty
po
log
y 3
Ty
po
log
y 4
Footprint
(L/M/H)
CAPEX
(L/M/H)
Borehole Water No treatment x x x Low N/A
Rainwater
Harvesting
No treatment x - - Low N/A
Greywater Recycling No treatment x x x Medium N/A
Multimedia x x x Medium Medium
Membrane bioreactor x x x Low High
Constructed wetlands - x x High Medium
Blackwater
Recycling
Activated Sludge - - x High High
Membrane bioreactor - - x Low High
Rotating Biological
Contactor - - x Low High
Constructed wetlands - - x High Medium

Appendix B
Regulations, Standards and
Policies
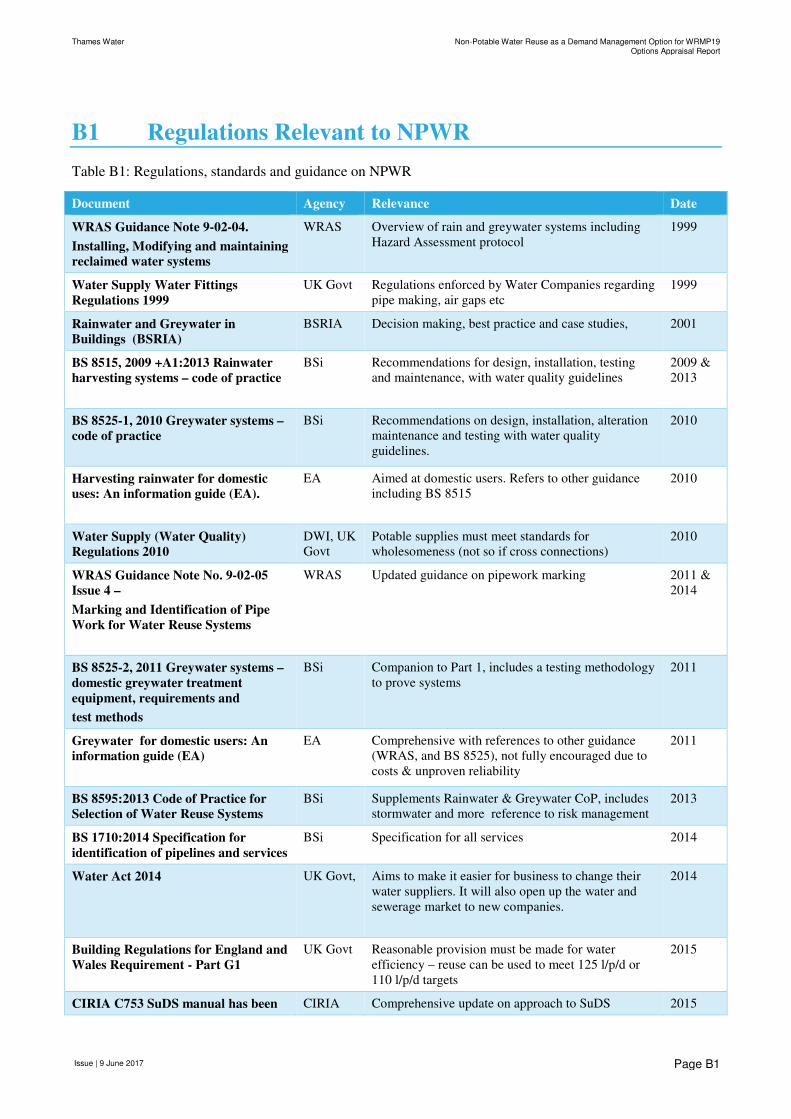
Thames Water Non-Potable Water Reuse as a Demand Management Option for WRMP19Options Appraisal Report
Issue | 9 June 2017
Page B1
B1 Regulations Relevant to NPWR
Table B1: Regulations, standards and guidance on NPWR
Document Agency Relevance Date
WRAS Guidance Note 9-02-04.
Installing, Modifying and maintaining
reclaimed water systems
WRAS Overview of rain and greywater systems including
Hazard Assessment protocol
1999
Water Supply Water Fittings
Regulations 1999
UK Govt Regulations enforced by Water Companies regarding
pipe making, air gaps etc
1999
Rainwater and Greywater in
Buildings (BSRIA)
BSRIA Decision making, best practice and case studies, 2001
BS 8515, 2009 +A1:2013 Rainwater
harvesting systems – code of practice
BSi Recommendations for design, installation, testing
and maintenance, with water quality guidelines
2009 &
2013
BS 8525-1, 2010 Greywater systems –
code of practice
BSi Recommendations on design, installation, alteration
maintenance and testing with water quality
guidelines.
2010
Harvesting rainwater for domestic
uses: An information guide (EA).
EA Aimed at domestic users. Refers to other guidance
including BS 8515
2010
Water Supply (Water Quality)
Regulations 2010
DWI, UK
Govt
Potable supplies must meet standards for
wholesomeness (not so if cross connections)
2010
WRAS Guidance Note No. 9-02-05
Issue 4 –
Marking and Identification of Pipe
Work for Water Reuse Systems
WRAS Updated guidance on pipework marking 2011 &
2014
BS 8525-2, 2011 Greywater systems –
domestic greywater treatment
equipment, requirements and
test methods
BSi Companion to Part 1, includes a testing methodology
to prove systems
2011
Greywater for domestic users: An
information guide (EA)
EA Comprehensive with references to other guidance
(WRAS, and BS 8525), not fully encouraged due to
costs & unproven reliability
2011
BS 8595:2013 Code of Practice for
Selection of Water Reuse Systems
BSi Supplements Rainwater & Greywater CoP, includes
stormwater and more reference to risk management
2013
BS 1710:2014 Specification for
identification of pipelines and services
BSi Specification for all services 2014
Water Act 2014 UK Govt, Aims to make it easier for business to change their
water suppliers. It will also open up the water and
sewerage market to new companies.
2014
Building Regulations for England and
Wales Requirement - Part G1
UK Govt Reasonable provision must be made for water
efficiency – reuse can be used to meet 125 l/p/d or
110 l/p/d targets
2015
CIRIA C753 SuDS manual has been CIRIA Comprehensive update on approach to SuDS 2015
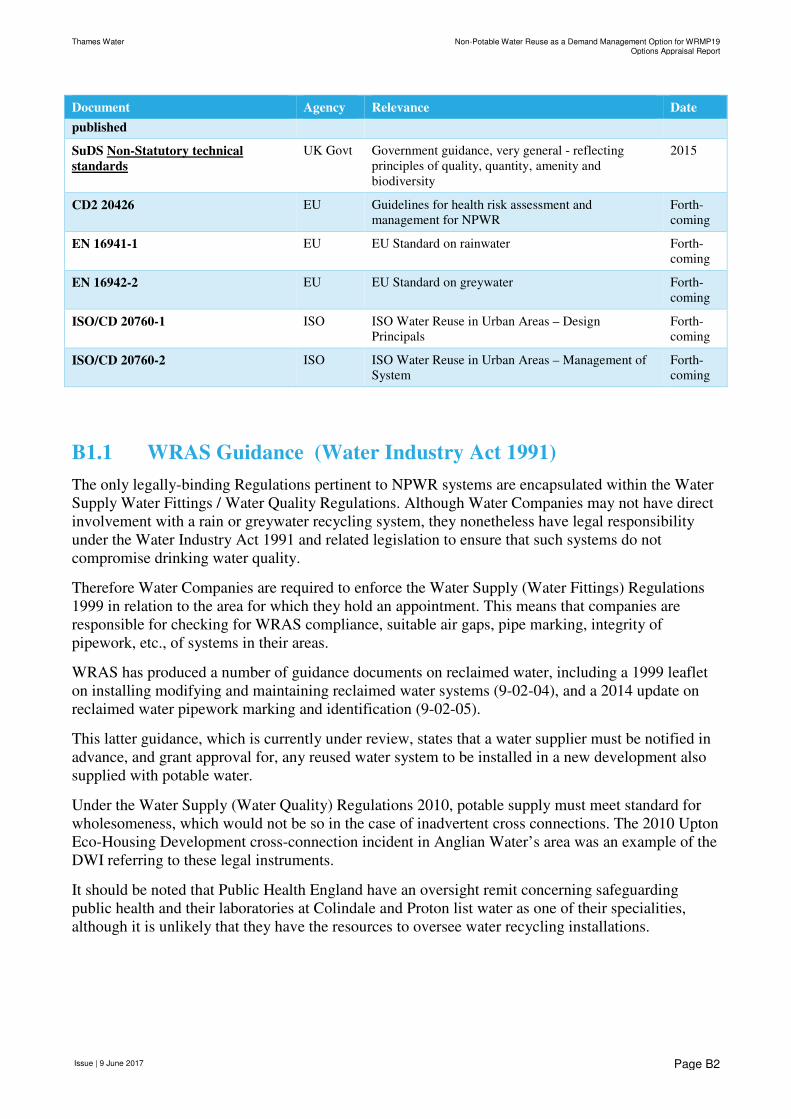
Thames Water Non-Potable Water Reuse as a Demand Management Option for WRMP19Options Appraisal Report
Issue | 9 June 2017
Page B2
Document Agency Relevance Date
published
SuDS Non-Statutory technical
standards
UK Govt Government guidance, very general - reflecting
principles of quality, quantity, amenity and
biodiversity
2015
CD2 20426 EU Guidelines for health risk assessment and
management for NPWR
Forth-
coming
EN 16941-1 EU EU Standard on rainwater Forth-
coming
EN 16942-2 EU EU Standard on greywater Forth-
coming
ISO/CD 20760-1 ISO ISO Water Reuse in Urban Areas – Design
Principals
Forth-
coming
ISO/CD 20760-2 ISO ISO Water Reuse in Urban Areas – Management of
System
Forth-
coming
B1.1 WRAS Guidance (Water Industry Act 1991)
The only legally-binding Regulations pertinent to NPWR systems are encapsulated within the Water
Supply Water Fittings / Water Quality Regulations. Although Water Companies may not have direct
involvement with a rain or greywater recycling system, they nonetheless have legal responsibility
under the Water Industry Act 1991 and related legislation to ensure that such systems do not
compromise drinking water quality.
Therefore Water Companies are required to enforce the Water Supply (Water Fittings) Regulations
1999 in relation to the area for which they hold an appointment. This means that companies are
responsible for checking for WRAS compliance, suitable air gaps, pipe marking, integrity of
pipework, etc., of systems in their areas.
WRAS has produced a number of guidance documents on reclaimed water, including a 1999 leaflet
on installing modifying and maintaining reclaimed water systems (9-02-04), and a 2014 update on
reclaimed water pipework marking and identification (9-02-05).
This latter guidance, which is currently under review, states that a water supplier must be notified in
advance, and grant approval for, any reused water system to be installed in a new development also
supplied with potable water.
Under the Water Supply (Water Quality) Regulations 2010, potable supply must meet standard for
wholesomeness, which would not be so in the case of inadvertent cross connections. The 2010 Upton
Eco-Housing Development cross-connection incident in Anglian Water’s area was an example of the
DWI referring to these legal instruments.
It should be noted that Public Health England have an oversight remit concerning safeguarding
public health and their laboratories at Colindale and Proton list water as one of their specialities,
although it is unlikely that they have the resources to oversee water recycling installations.
Thames Water Non-Potable Water Reuse as a Demand Management Option for WRMP19Options Appraisal Report
Issue | 9 June 2017
Page B3
B2 British Standards
According to the British Standards Institute, a standard is an agreed way of doing something. The
difference between a standard and a technical regulation lies in compliance. While conformity with
standards is voluntary, technical regulations are by nature mandatory.
Standards can be about making a product, managing a process, delivering a service or supplying
materials – standards can cover a huge range of activities undertaken by organizations and used by
their customers. The point of a standard is to provide a reliable basis for people to share the same
expectations about a product or service. This helps to:
• Facilitate trade,
• Provide a framework for achieving economies, efficiencies and interoperability,
• Enhance consumer protection and confidence.
There are a number of British Standards related to NPWR:
B2.1 BS8515 - Rainwater Code of Practice
This Code of Practice (CoP) came into effect on 31 January 2009 and was updated in 2013. It sets
out recommendations on the design, installation, testing and maintenance of rainwater harvesting
systems supplying non-potable water in the UK. It states that a system conforming to filtration
technology as set out in Section 4.3 of the standard (maintainable, 90% efficient and passes
maximum particle size <1.25 mm) should produce water of a suitable quality for WC, laundry and
garden watering in most situations.
The implementation of additional UV or chemical disinfection is advised in some situations. The
CoP gives installation and air gap requirements and monitoring recommendations. Guideline
microbiological and physiochemical water quality parameters are provided in Section 6 and risk
assessments are recommended.
B2.2 BS 8525 - Greywater Systems Code of Practice
This Code of Practice is in two parts. It solely concerns the use of greywater from bathrooms. The
end uses are the same as the rainwater CoP, i.e. WC, laundry and garden watering. Guideline
microbiological and physiochemical water quality parameters are provided in Section 6 of the CoP
(see Appendix 3).
Part 1 (2010) gives recommendations on the design, installation, alteration, testing and maintenance
of greywater systems. Guideline microbiological and physic-chemical water quality parameters are
provided.
Part 2 (2011) concerns specifications for the greywater equipment (e.g. flows, controls, markings and
fail safes) as well as a methodology for testing the systems using synthetic greywater against a set of
water quality criteria for different end uses.
Thames Water Non-Potable Water Reuse as a Demand Management Option for WRMP19Options Appraisal Report
Issue | 9 June 2017
Page B4
B2.3 BS 8595 - Code of Practice for Selection of Water Reuse
Systems
This Code of Practice (CoP) is very much a supplement/addition to the aforementioned rainwater and
greywater CoP. In addition to greywater and rainwater, it considers the utilisation of stormwater. It
gives information on how to select appropriate schemes giving consideration to site-specific
conditions and relevant supply/demand issues in the relevant locations.
The CoP also considers the design and complexity of different configurations. It makes the point (in
section 8) that there are no current legislative water quality criteria (i.e. only guidelines as presented
in the rainwater & greywater CoP). In more detail than in previous CoP, it makes reference to risk
management requiring Health Impact Assessments (HIAs) and the use of Water Safety Plans.
Thames Water Non-Potable Water Reuse as a Demand Management Option for WRMP19Options Appraisal Report
Issue | 9 June 2017
Page B5
B3 Other Related UK Guidance
B3.1 Rainwater / Greywater – Guidance
There have been a number of guidance and recommendation documents produced (aside from the
British Standards and WRAS Guidance Notes) by bodies and organisations aiming to summarise the
relevant information available at the time and encourage good practice in rainwater and greywater
recycling.
These have included BSRIA, CIRIA, UKRHA, Water Companies (e.g. Alternative Water Systems –
Information Leaflet and Guide available from the WRAS website), The Market Transformation
Programme, the Environment Agency and others.
Also the recent updated SuDS manual from CIRIA details how rainwater harvesting systems can be
used to help manage surface runoff. However the British Standards and WRAS publications should
be referred to as the primary sources of guidance.
B3.2 Blackwater – Guidance
There is no current guidance on the use of treated effluent (blackwater) for non-potable purposes in
UK, with the British Standards and other guidance focussing on rainwater and greywater use.
In the absence of such guidance, Thames Water chose to use US regulations (by the US EPA
unrestricted urban reuse quality guidelines) for the reclaimed water on their two recent blackwater
schemes (BedZed and the Olympic Park).
In addition, the EA were consulted about classification on the treated effluent as it was being stored.
Further to discussions, the EA issued a “regulatory position statement” that a permit was not required
at the Olympic Park.
The most recent British Standard (BS 8595:2013 Code of Practice for the Selection of Water Reuse
Systems) explicitly states that it does not cover treated effluents.
B3.3 SuDS – Guidance
There have been some recent outputs related to SuDS (Sustainable Urban Drainage Systems) which
have relevance to approaches for rainwater and stormwater management on sites.
As mentioned above, a recent update of the CIRIA SuDS manual has been published (CIRIA C753)
and the Thames Water region the Mayor’s London Plan and initiatives such as the Sustainable
Drainage Action Plan are also relevant.
The Government have released 14 Non-Statutory Technical Standards to guide planning authorities,
designers and developers (March 2015) but these are considered to be much less prescriptive than the
much more detailed regulations drafted, but never enacted, as a part of the Flood and Water
Management Act.
Thames Water Non-Potable Water Reuse as a Demand Management Option for WRMP19Options Appraisal Report
Issue | 9 June 2017
Page B6
B4 Forthcoming Standards & Guidance
There has been recent activity by the European and International Standards bodies related to water
reuse. In the UK this is being coordinated through BSi (British Standards Institution) who circulate
the various documents for comment. The current, live working documents cover both proposed ISO
standards and EU standards.
The ISO (International Organisation for Standardisation) is a worldwide federation of national
standards bodies (ISO member bodies). The work of preparing International Standards is normally
carried out through ISA technical committees. Each member body interested in a subject has the
right to be represented on that committee. Other organisations may also take part in the work. Draft
standards adopted by the technical committees are circulated to member bodies for voting and are
only approved if agreed by at least 75% on the member bodies voting.
The ISO water reuse technical subcommittee (TC 282/SC3) of the Water Group of ISO (WG50) met
in Beijing in November 2015 which also expedited the production of a number of new drafts for
comment.
In parallel, the relevant EU committees (CEN TC 165/WG50) are working on European standards
which are again being co-ordinated in the UK through BSi.
It should be noted that none of the following standards/guidance are yet adopted; they are at various
stages of consultation and as such are not fully in the public domain.
The following are referred in this report for reference purposes and should not be quoted outside of
this report.
B4.1 ISO Guidelines for Health Risk Assessment and Management
for Non-Potable Water Reuse
On 4 March 2016, a draft of Guidelines for Health Risk Assessment and Management for Non-
potable water reuse (CD2 20426) was circulated via the UK’s BSi. The aim of this guidance is to
provide a consistent approach to water reuse focussing on people’s health. Working towards an ISO
International Standard it is based on health risk assessments and disability-adjusted life year
(DALY). It is very much influenced by the Australian Guidelines for Water Recycling: Managing
Health and Environmental Risk (Phase 1) published in 2006.
It is a complex document that requires comprehension of health risk characterisation and dose-
response rates. However a particular advantage, if striving for a consistency of approach, maybe that
it is applicable to all sources of reclaimed water (black, grey, rain, storm, etc.) treated for non-
potable purposes.
B4.2 EU Standards on NPWR Systems
These two documents are being circulated by the CEN technical committee via the BSI. CEN is one
of three European Standardization Organizations (together with CENELEC and ETSI) that have been
officially recognized by the European Union and by the European Free Trade Association (EFTA) as
being responsible for developing and defining voluntary standards at European level. The two
documents both appear to mirror the two related UK British standards for rainwater and greywater
(BS 8515 & BS 8525-1).
Thames Water Non-Potable Water Reuse as a Demand Management Option for WRMP19Options Appraisal Report
Issue | 9 June 2017
Page B7
B4.2.1 EN 16941-1 on Rainwater Harvesting
This proposed EU standard follows a similar approach to the British Standard for systems for the use
of rainwater. However, unlike the British Standard, the current draft (circulated via BSi on 25/11/15)
does not give recommendations on water quality standards, with the only comment on water quality
being that the reclaimed rainwater should be “fit for purpose and present no undue health risk”.
B4.2.2 EN 16941-2 on Greywater Reuse
Part 2 refers to systems for the use of treated greywater. (EN-16941-2 greywater). This standard was
circulated via BSi on 7/1/2016 as a draft from the CEN technical committee 165/WG50. In the same
way as Part 1 concerning rainwater, it appears informed by the British Standard for greywater
(Part 1). It is comprehensive, covering design, installation, commissioning and includes annexes with
water quality guidelines and dye testing etc.
It should be noted that there is no EU equivalent to the section in the British Standard (Part 2) that
refers to test methods for the specification of equipment.
B4.3 ISO Guidelines for Water Quality Grade Symbols for Water
Reuse.
The latest draft (dated 12 Feb 2016 – ISO WD2 20469) proposes a very simplistic marking system
based on two types of star ratings: (i) related to the health risk to end-users, and (ii) risks to the
environment.
The proposal has been prepared by ISO committee TC/262. For comparison, some Australian States
still use a similar classification concept (Class A* to Class D) but, in the national Australian
Guidelines, they have moved away from this concept, to that of reclaimed water being “fit for
purpose” (rather than conforming to a particular standard).
B4.3.1 ISO Water Reuse in Urban Areas – Guidelines for Centralised Water
Reuse Systems (ISO/CD 20760-1 & 2)
These currently draft guidelines are targeted at centralised water reuse systems, principally from
municipal waste water. The guidelines are in two parts. The drafts are currently out for consultation
and in the UK and being coordinated through BSI.
Part 1 – covers the Design Principals. It appears informed by Australian and USA approaches. It
considers various models / configurations of centralised systems and subsequent treatment,
distribution systems, storage, monitoring etc.
Part 2 – covers Management of Systems. It covers risk management of the systems and guidelines
for management of individual elements, such as the storage, reclaimed water distribution systems
(labelling /colour coding), monitoring, management of incidents etc.
Thames Water Non-Potable Water Reuse as a Demand Management Option for WRMP19Options Appraisal Report
Issue | 9 June 2017
Page B8
B5 Position of various bodies on NPWR
B5.1 European Union
The EU promotes water recycling and reuse.
• The “Blueprint to Safeguard Europe’s Water Resources”, adopted by the European Commission
in November 2012, makes it clear that maximisation of water reuse is a specific objective.
• The development of a regulatory instrument to ensure this was proposed, with a (now passed)
target for this to be achieved by 2015.
• The Urban Wastewater Directive (1991) states that wastewater should be reused wherever
appropriate (although there is no clear definition of what is “appropriate”).
B5.2 UK Regulatory Bodies
UK Regulatory Bodies such as the Environment Agency can likewise promote consideration of
recycling schemes and do produce guidance for those wishing to consider such schemes.
• Defra’s “Future Water - The Government’s Water Strategy for England” 2008, (Ref 3) cites
rainwater and greywater harvesting as future opportunities.
• The EA’s Water Resources Strategy - Water for People and the Environment 2009 (Ref 4)
welcomes the increased interest in rainwater and greywater harvesting schemes, with the proviso
that they are cost-effective and appropriate.
B5.3 Water Utilities
Water companies may promote the uptake of non-potable systems as one measure towards securing
the gap between current and projected water supply and demand (e.g. Thames Water WRMP14). In
the past they have also helped with the implementation of schemes to further understanding through
research, such as Thames Water’s Millennium Dome, BedZed and Olympic Park initiatives.
B5.4 Local & Regional Government (GLA, LPA)
The 2011 London Plan’s policy 5.13 sets out the drainage hierarchy, where storage of rainwater for
later use is identified as they first option, thereby promoting the use of non-potable water within new
developments.
GLA with Thames Water and the EA (London Sustainable Drainage Action Plan Consultation Oct
2015) aims for a 25% reduction in surface water flows to sewers by 2040. The capture and use of
rainwater at local level is one means of achieving this target.
Local Government can also champion incorporation of non-potable systems in new developments.
Mayor of London’s Sustainable Design and Construction Policy (Implementation Framework 2011)
directs the London Boroughs to ensure “Developers maximise the opportunities for water saving
measures and appliances in all developments, including the reuse and using alternative sources of
water. Boroughs should negotiate and secure from developers as many as of the water saving
initiatives listed as practical.”
Thames Water Non-Potable Water Reuse as a Demand Management Option for WRMP19Options Appraisal Report
Issue | 9 June 2017
Page B9
The initiatives listed include rainwater harvesting, groundwater and reuse (grey & black, although
black is recognised as being more energy-intensive).
B5.5 Industry Associations
Industry associations such as CIRIA, BSRIA, BSi, and RHA have, over recent years, produced
guidance documents which increase knowledge and hence confidence in implementing such
schemes.
The recent 2015 CIRIA C753 ‘The SuDS Manual’ recommends rainwater harvesting as one
approach to managing surface run-off. The Governments Market Transformation Scheme has also
provided useful work.
B5.6 Summary
There are no direct legislative requirements to mandate the use of non-potable water systems. Hence
the drivers for developers and individuals to install NPWR systems are “second order”.
Some of these drivers are listed below:
• being part of a general consideration of more sustainable water use on a development site;
• a response to local borough planning directions;
• a solution to local infrastructure challenges;
• an approach to alleviating flood risk;
• an aspiration to save money on potable water charges;
• to align with “green” values and branding (such as demonstrating high BREEAM ratings).
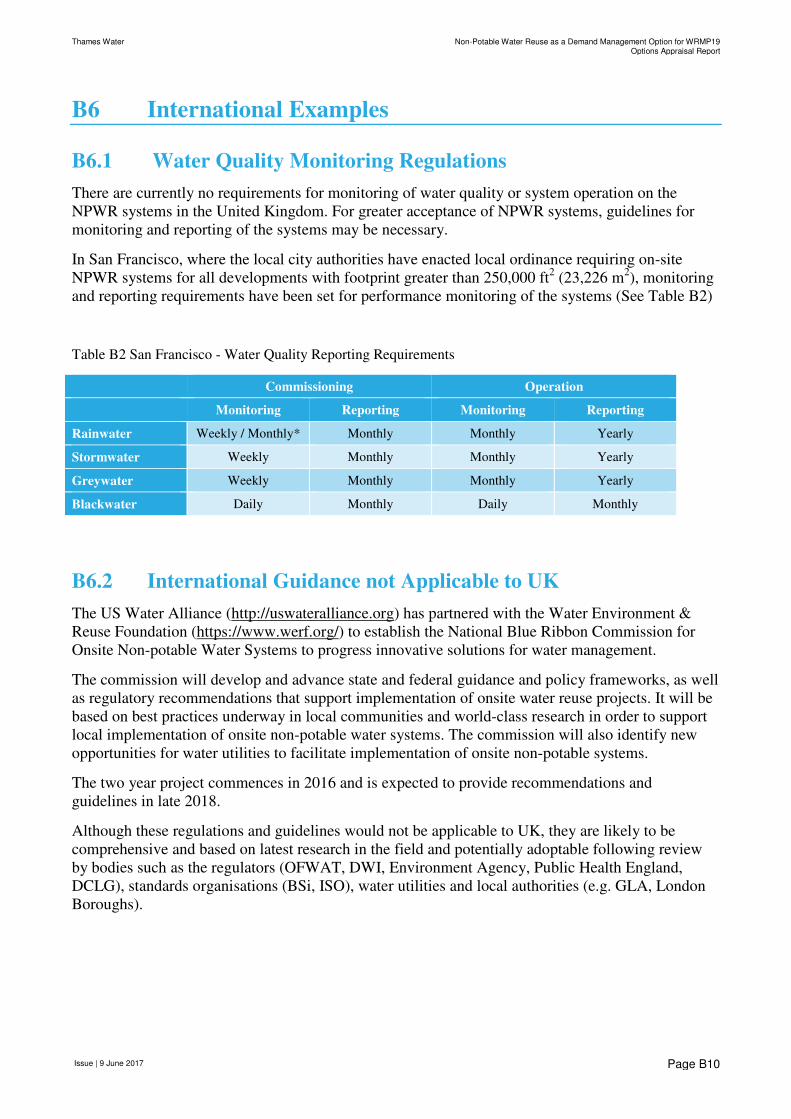
Thames Water Non-Potable Water Reuse as a Demand Management Option for WRMP19Options Appraisal Report
Issue | 9 June 2017
Page B10
B6 International Examples
B6.1 Water Quality Monitoring Regulations
There are currently no requirements for monitoring of water quality or system operation on the
NPWR systems in the United Kingdom. For greater acceptance of NPWR systems, guidelines for
monitoring and reporting of the systems may be necessary.
In San Francisco, where the local city authorities have enacted local ordinance requiring on-site
NPWR systems for all developments with footprint greater than 250,000 ft2 (23,226 m
2), monitoring
and reporting requirements have been set for performance monitoring of the systems (See Table B2)
Table B2 San Francisco - Water Quality Reporting Requirements
Commissioning Operation
Monitoring Reporting Monitoring Reporting
Rainwater Weekly / Monthly* Monthly Monthly Yearly
Stormwater Weekly Monthly Monthly Yearly
Greywater Weekly Monthly Monthly Yearly
Blackwater Daily Monthly Daily Monthly
B6.2 International Guidance not Applicable to UK
The US Water Alliance (http://uswateralliance.org) has partnered with the Water Environment &
Reuse Foundation (https://www.werf.org/) to establish the National Blue Ribbon Commission for
Onsite Non-potable Water Systems to progress innovative solutions for water management.
The commission will develop and advance state and federal guidance and policy frameworks, as well
as regulatory recommendations that support implementation of onsite water reuse projects. It will be
based on best practices underway in local communities and world-class research in order to support
local implementation of onsite non-potable water systems. The commission will also identify new
opportunities for water utilities to facilitate implementation of onsite non-potable systems.
The two year project commences in 2016 and is expected to provide recommendations and
guidelines in late 2018.
Although these regulations and guidelines would not be applicable to UK, they are likely to be
comprehensive and based on latest research in the field and potentially adoptable following review
by bodies such as the regulators (OFWAT, DWI, Environment Agency, Public Health England,
DCLG), standards organisations (BSi, ISO), water utilities and local authorities (e.g. GLA, London
Boroughs).
Thames Water Non-Potable Water Reuse as a Demand Management Option for WRMP19Options Appraisal Report
Issue | 9 June 2017
Page B11
B7 UK Guidance on NPWR Schemes
A lack of clear regulations in the UK for operational schemes has hindered the uptake of non-potable
reclaimed water schemes. This had led to a variety of approaches, some schemes being informed by
UK guidance as it has become available, some looking to regulations from countries where non-
potable recycling is more established, and others seemingly demonstrating unawareness of even
good practice.
Rainwater harvesting is the most readily taken-up example of non-potable reuse, and because of the
perceived good quality of rainwater. Despite the seasonal nature of supply, it is often considered
more favourably than greywater or blackwater.
The use of blackwater as a source for non-potable supplies is a more recent development (e.g.
BedZED and the Olympic Park).
There are a few instances where treated effluent from municipal STWs has been used for non-
municipal purposes. Two such examples are:
• Wessex Water at Avonmouth supply 30 Ml/d of treated sewage effluent as cooling water for a
gas turbine power station, and
• Seven Trent provide non-potable water for golf course watering of Coventry Golf Club from
Finham Sewage treatment works.
A lack of standardised terminology has been identified with greywater, with the term being used both
for ‘treated’ as well as ‘untreated’ greywater. In one instance the treated sewage effluent is termed as
“greywater” on golfing websites.
Early 2000 Guidance
The UK guidance on non-potable supplies has mainly been produced post 2000 and building upon
research work in the late 1990s (e.g. BSRIA) and the implementation of a non-potable water supply
at the Millennium Dome in 2000. The latter was the first such large-scale schemes in the UK and
stimulated the production of the Water Regulations Advisory Scheme (WRAS) initial 1999 guidance
note concerning the marking and identification of reclaimed water pipework.
Recent Guidance
The majority of UK guidance, mainly concerning rainwater and greywater, has been produced since
2009. It evolved from a number of initiatives including the Government’s Market Transformation
Programme.
Other bodies, such as the EA, have also produced guidance documents. The drivers have changed
over time, which may not have helped implementation.
The cessation of the Code for Sustainable Homes was considered unfortunate although some water
efficiency related targets were incorporated into Building Regulations. The key codes of practice are
now incorporated into British Standards, which take the form of Guidance and Recommendations.
However, it should be noted that these do not specifically cover blackwater. The only legally-binding
regulations are encapsulated within the Water Supply Water Fittings / Water Quality
Regulations (2010) described later, and concern preventing contamination of potable supplies.

Appendix C
Governance and Perception
Review
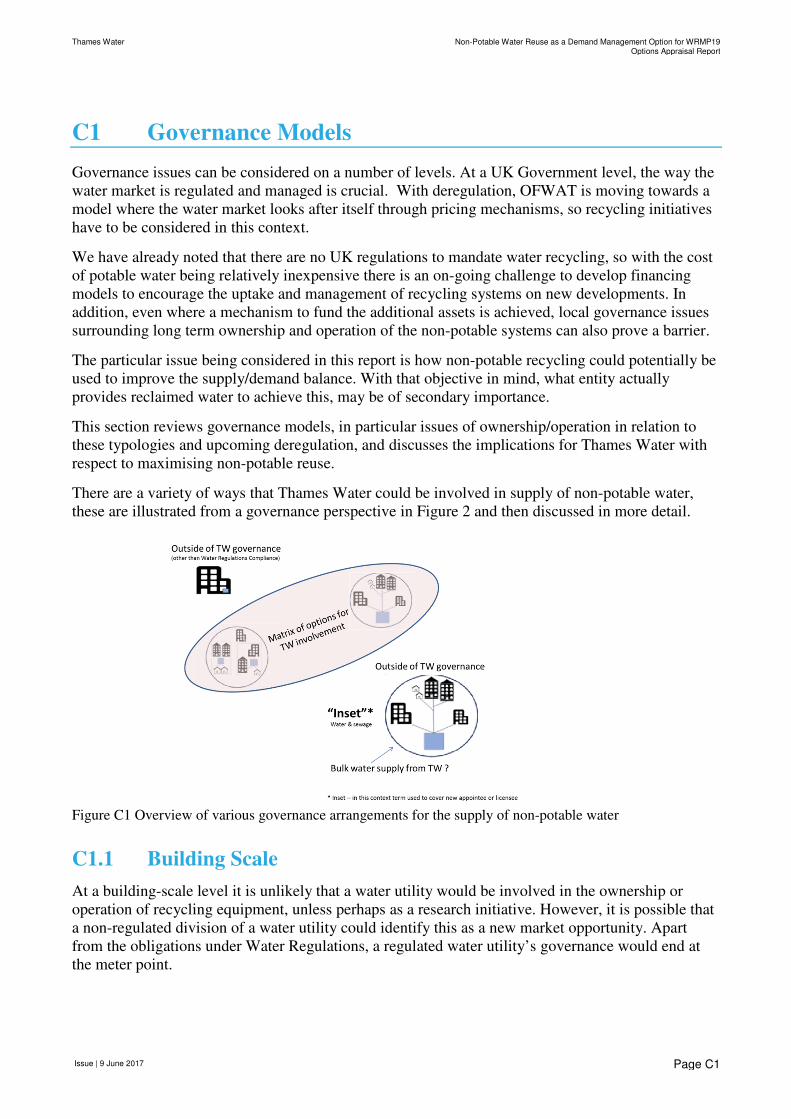
Thames Water Non-Potable Water Reuse as a Demand Management Option for WRMP19Options Appraisal Report
Issue | 9 June 2017
Page C1
C1 Governance Models
Governance issues can be considered on a number of levels. At a UK Government level, the way the
water market is regulated and managed is crucial. With deregulation, OFWAT is moving towards a
model where the water market looks after itself through pricing mechanisms, so recycling initiatives
have to be considered in this context.
We have already noted that there are no UK regulations to mandate water recycling, so with the cost
of potable water being relatively inexpensive there is an on-going challenge to develop financing
models to encourage the uptake and management of recycling systems on new developments. In
addition, even where a mechanism to fund the additional assets is achieved, local governance issues
surrounding long term ownership and operation of the non-potable systems can also prove a barrier.
The particular issue being considered in this report is how non-potable recycling could potentially be
used to improve the supply/demand balance. With that objective in mind, what entity actually
provides reclaimed water to achieve this, may be of secondary importance.
This section reviews governance models, in particular issues of ownership/operation in relation to
these typologies and upcoming deregulation, and discusses the implications for Thames Water with
respect to maximising non-potable reuse.
There are a variety of ways that Thames Water could be involved in supply of non-potable water,
these are illustrated from a governance perspective in Figure 2 and then discussed in more detail.
Figure C1 Overview of various governance arrangements for the supply of non-potable water
C1.1 Building Scale
At a building-scale level it is unlikely that a water utility would be involved in the ownership or
operation of recycling equipment, unless perhaps as a research initiative. However, it is possible that
a non-regulated division of a water utility could identify this as a new market opportunity. Apart
from the obligations under Water Regulations, a regulated water utility’s governance would end at
the meter point.
Thames Water Non-Potable Water Reuse as a Demand Management Option for WRMP19Options Appraisal Report
Issue | 9 June 2017
Page C2
C1.1.1 Design
Observations of examples where developers (or their architects/designers) have specified stand-
alone, building-scale systems (usually rainwater or greywater) have identified a number of issues.
The driver for initial installation of such systems is usually for the building to gain high ratings under
BREEAM, for marketing / branding purposes to the advantage of the building developer or owner
(i.e. not primarily for the reasons of potable water cost-saving) or for water security / scarcity
reasons.
The procurement of a stand-alone, in-building system is relatively straight forward in that it fits
within a standard contractual model. The rainwater / greywater systems and necessary pipework are
specified in the design, and procured in the usual way.
C1.1.2 Operation
Often the ultimate occupants or tenants of the building have not appreciated the requirements or
costs of operating and maintaining the systems over the lifetimes of the building and the necessary
risk management procedures. Systems are usually operated and maintained either by the building
facilities team or sub-contracted to a specialist company.
Unfortunately, following building occupation, with the cost of potable water in the UK (and
particularly the Thames Water area) being generally low, there can be little financial incentive for
building managers to keep systems operational. Unmaintained systems usually fail safely and revert
to potable water, as part of the design for risk mitigation.
Fears over liability issues related to perceived risks from non-potable water supply and ensuring
appropriate water quality, may also influence decisions on whether to keep systems running. The
responsibility and liability for the systems may be discharged through the building’s facilities
management arrangements.
From a water-saving stand-point there is an argument to incentivise both the installation of such in-
building systems, but more importantly the on-going operation and demonstration of water savings
achieved. For example, a mechanism used by developers to comply with Building Regulations to
enable high water-using fittings (e.g. high flow power showers) to be installed, usually in “high
value” residential developments, in water stressed areas, is to offset with recycling initiatives.
It is particularly important that the recycling systems are kept operational in these instances, to
ensure water savings are realised in perpetuity. There is a significant lack of evidence of actual
water-savings achieved over time in buildings with such recycling systems, as on-going metering and
monitoring is often overlooked.
C1.2 Development Scale and Larger Systems
At the scale of development-level or greater, the governance issues are more complex, particularly
with the introduction of competition. The most simplistic example would be where the incumbent
water utility maintains the licence to supply the development in the conventional way and each
individual customer is metered.
A non-potable water supply could be provided, which was the model that was adopted at the
Olympic Park. Outside of this model there numerous other governance options.
It should be noted that buildings would have to be designed with dual-plumbing to accept a
reclaimed water supply.
Thames Water Non-Potable Water Reuse as a Demand Management Option for WRMP19Options Appraisal Report
Issue | 9 June 2017
Page C3
C1.2.1 Water Utility Owned and Operated (to Designated Water Meter Point)
From a governance perspective, a water utility owned and operated model is the simplest and is the
primary model for water reuse systems in United States. This would usually involve the water utility
being responsible for the supply of non-potable quality water to a customer meter point. Typically,
the water utility owns and operates the assets upstream of that point.
Beyond the meter point the “customer” takes responsibility, although the water utility still has a
requirement under the relevant Water Regulations for inspections to prevent unintentional
contamination of potable water supplies (through cross-connections, etc.).
This was in essence the model undertaken for the non-potable water supply to the Olympic Park in
London. Thames Water owns and operates the blackwater treatment plant and the non-potable water
distribution system. The utility is responsible for all assets and activities upstream of the non-potable
water meter.
The responsibility for safe use of the non-potable water beyond the customer meter is a somewhat
ambiguous area, as in addition to the specific Water Regulations requirements. The Water
Companies (or other supplier of non-potable water) may be considered to have some “duty of care”
obligations, particularly if the non-potable water quality is specified only for certain uses.
Thames Water discharged its “duty of care” at the Olympic Park through an auditable
communications strategy and programme of comprehensive briefings to the end users.
Water companies understand the systems, procedures and costs necessary to safely manage treatment
and distribution systems and mitigate risk. This model is usually best suited to the larger scale
“development level” schemes using blackwater or municipal sewage effluent as the source water.
Such a model could also include the collection of rainwater and stormwater from a site, although
combining multiple different sources can provide an additional challenge to selecting the appropriate
treatment technology. Under this model it is still possible that the water utility could sub-contract
the operation of the assets to third parties, if they did not have sufficient resources in-house.
In the current UK regulatory regime the financing of such schemes can be a challenge for a water
utility. Funding for the use of treated effluent to augment potable supplies (not considered in this
report) can be managed under the current WRMP methodologies in the regulated business.
The mechanisms for funding of a separate, non-potable, reclaimed water supply through the
regulated business require further investigation.
The Olympic Park reclaimed water provision was delivered as a research project by Thames Water,
and included substantial contribution from the Olympic Delivery Authority (ODA).
In the same way as the building-scale examples, the building owner or operator is responsible
downstream of the meter point. This would include the dual plumbing, compliance with Water
Regulations and any additional treatment considered necessary for building-specific purposes. A
regulated Water utility has no remit to be involved with the in-building infrastructure, apart from
ensuring Water Regulations compliance through the inspection regime (and possible duty of care as
mentioned above).
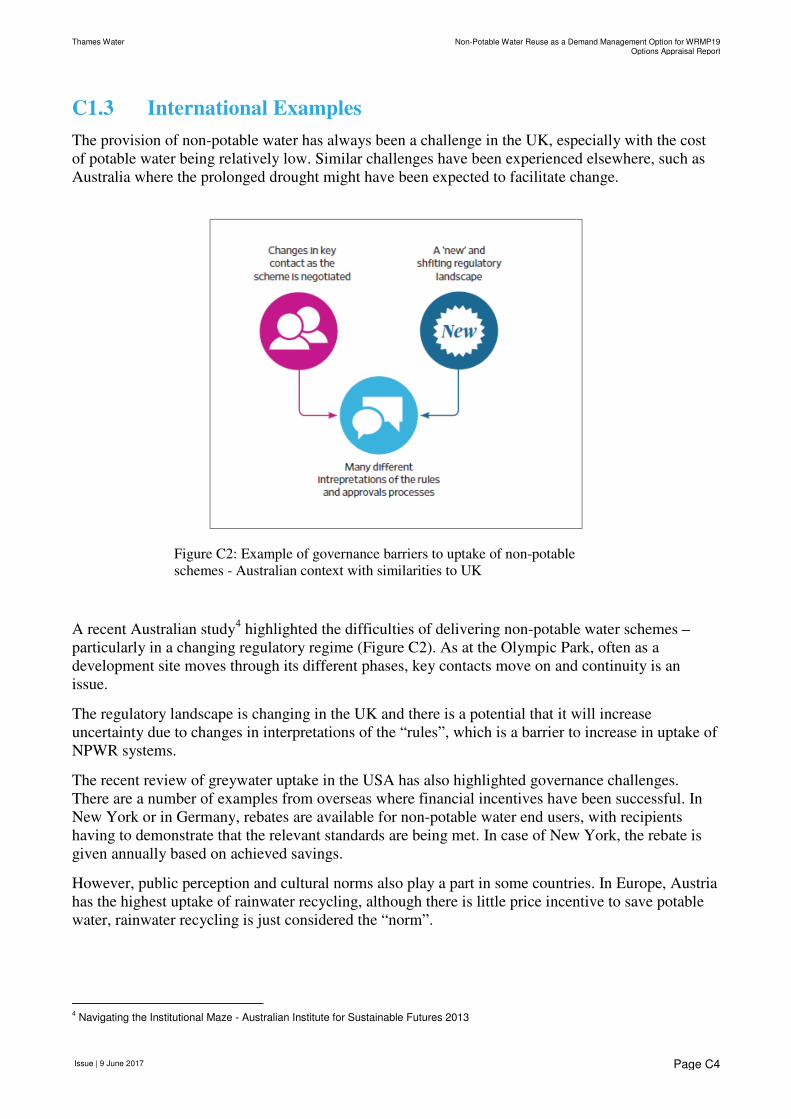
Thames Water Non-Potable Water Reuse as a Demand Management Option for WRMP19Options Appraisal Report
Issue | 9 June 2017
Page C4
C1.3 International Examples
The provision of non-potable water has always been a challenge in the UK, especially with the cost
of potable water being relatively low. Similar challenges have been experienced elsewhere, such as
Australia where the prolonged drought might have been expected to facilitate change.
A recent Australian study4 highlighted the difficulties of delivering non-potable water schemes –
particularly in a changing regulatory regime (Figure C2). As at the Olympic Park, often as a
development site moves through its different phases, key contacts move on and continuity is an
issue.
The regulatory landscape is changing in the UK and there is a potential that it will increase
uncertainty due to changes in interpretations of the “rules”, which is a barrier to increase in uptake of
NPWR systems.
The recent review of greywater uptake in the USA has also highlighted governance challenges.
There are a number of examples from overseas where financial incentives have been successful. In
New York or in Germany, rebates are available for non-potable water end users, with recipients
having to demonstrate that the relevant standards are being met. In case of New York, the rebate is
given annually based on achieved savings.
However, public perception and cultural norms also play a part in some countries. In Europe, Austria
has the highest uptake of rainwater recycling, although there is little price incentive to save potable
water, rainwater recycling is just considered the “norm”.
4 Navigating the Institutional Maze - Australian Institute for Sustainable Futures 2013
Figure C2: Example of governance barriers to uptake of non-potable
schemes - Australian context with similarities to UK

Thames Water Non-Potable Water Reuse as a Demand Management Option for WRMP19Options Appraisal Report
Issue | 9 June 2017
Page C5
C2 Constraints to Delivery
The implementation of NPWR systems is limited due to perception about the water quality, lack of
regulatory requirements, up-front costs and return on investment, and the deliverability of the
infrastructure within and outside buildings.
C2.1 Regulatory Requirements for Inclusion in New Developments
There are no mandatory requirements for inclusion of NPWR systems in new developments. A lack
of clear regulations in the UK for operational schemes has hindered the uptake of NPWR systems.
As a comparison, San Francisco became the first utility in USA to mandate new developments with
footprint greater than 40,000 ft2 to have dual plumbing installed and new developments with 250,000
ft2 or more footprint to have onsite NPWR systems installed.
The mandatory requirements were introduced in 2015 alongside grants for building or district scale
system above certain thresholds; for onsite systems for buildings with footprint greater than 100,000
ft2, or district system (typology 4) that connects two or more developments.
C2.2 Standards
Lack of standards is a constraint for the delivery of NPWR systems.
There are no current standards for Blackwater reuse in UK or Europe, and recent meeting at EU have
indicated that there is no current plans to publish one for blackwater reuse.
C2.3 Policy
The ‘now withdrawn’ Code for Sustainable Homes was the closest the UK came to requiring
adoption of NPWR in new developments.
The London Plan has a policy promoting higher water efficiency standards. However, as it is only a
policy, there is no requirement to implement it in new developments.
C2.4 Perception of Water Quality
The perceived health risk associated with NPWR acts as a barrier to people having these systems
installed. These concerns are based on reports of historic incidents of cross-connection of NPWR
systems and potable water supply.
C2.5 Qualified Installers
There is lack of adequate number of qualified plumbers that can install, maintain and ensure the
systems are running in good operating state.
A number of training courses are available to provide Certification for plumbers, however there is
low uptake of these certifications – primarily due to limited market of the NPWR systems

Appendix D
Detailed Methodology
Thames Water Non-Potable Water Reuse as a Demand Management Option for WRMP19Options Appraisal Report
Issue | 9 June 2017
Page D1
D1 Stage A
The potential future development site information was captured from the Housing and Jobs Targets
set by the Mayor of London in the London Plan and development strategies.
The methodology for estimating water demand has already been outlined in Section 3.3.
D2 Stage B
The methodology is detailed in Section 3.4.
In absence of information about plot area, site layout and building footprint, the non-potable water
yield from rainwater and stormwater were estimated based on the Nine Elms Case Study, which is
presented in Appendix E2.
D3 Stage C
The allowable yield was evaluated based on presence of regulations and standards addressing
NPWR, as well as governance and policy measures to enable NPWR systems being installed and
operated, as well as issues around perceptions and deliverability.
The above items reviewed in detail in Appendix B, and Appendix C.

Thames Water Non-Potable Water Reuse as a Demand Management Option for WRMP19Options Appraisal Report
Issue | 9 June 2017
Page D2
D4 Stage D
D4.1 NPWR Assessment for WRMP19
The cost evaluation for WRMP required information was assessed along the DMA boundaries.
The process utilised is outlined in the Figure D1 below:
The process is explained in more detail in the following sub-sections.
D4.1.1 Opportunity Areas
A number of Opportunity Areas (OA) lies partially or completely out of the Thames Water’s water
supply zone. These OAs or parts of the OAs have been excluded from the assessment for this project.
The Mayor of London has published the aspirational targets for housing and jobs for some of the
Opportunity Areas that fall within Thames Water’s water supply areas.
The SHLAA sites do not meet the growth targets in all areas. The approach to address this shortfall
has been outlined in following sub-sections.
As such, to understand the remaining strategic scale growth suitable for consideration in this Non-
Potable Water Study has taken consideration of:
• Completions to date;
• Identified residual capacity within OAs and other strategic development sites;
• Growth projections without identified sites;
Figure D1: Assessment process for NPWR at DMA level
Thames Water Non-Potable Water Reuse as a Demand Management Option for WRMP19Options Appraisal Report
Issue | 9 June 2017
Page D3
D4.1.2 Completions to Date
The greatest opportunity to incorporate non-potable water management approaches into new
development is prior to the granting of planning permission or build out. Several of the OAs have
already experienced significant growth.
To estimate the extent of the completions and as such the remaining growth expectation for each of
the OAs a review of the London Development Database cross checked against the potential OAs was
undertaken.
The London Development Database is the system used by the Mayor to monitor planning
permissions and completions across London since 2004. It records and classifies development as
‘completed’, ‘started’ and ‘not started’.
This would rule out the opportunity for developments classed as ‘completed’ and, depending on the
size of development, a decision could be taken upon whether there was still an opportunity for any
developments classed as ‘started’; and as such identified and rule out those sites where the
development as progressed to far to influence.
D4.1.3 Identification of Residual Capacity
As highlighted above, some OAs, such as Bexley Riverside, cover a wide area and include a number
of sites that could accommodate significant growth. To identify the sites where growth is planned,
the Local Development Documents (LDD) (Core Strategies, Local Plans, Area Action Plans and
Supplementary Planning Documents) for each of the London Boroughs which contain all or part of
an OA were reviewed.
Where sites and growth areas were clearly identified, these were mapped and growth aspirations
recorded. In a number of cases, however, the LDDs predate the growth aspirations of the OAs or did
not contain sufficient information.
As such, the GLA’s 2013 Strategic Housing Land Availability Assessment (SHLAA), which
provides an indicative housing capacity and a postcode, was used to identify potential growth sites in
the OAs.
These were also cross referenced to the London Development Database to ensure they had not been
built out or planning permission had not been received. Although the exact sites could not be
mapped, the postcode and indicative capacity were used to identify a centre of gravity of future
development through which a land take area could be calculated using housing density assumptions
as necessary.
D4.1.4 Growth Projections without Identified Sites
Using the LDDs and cross referencing with the SHLAA, it has been possible to identify sites to meet
OA growth aspirations in a number of the OAs. However, where there was still a shortfall between
the identified sites and the growth aspirations, for the purposes of this study, this residual shortfall
was applied to the identified sites through an assumed increase in development quantum.
D4.2 Cost Estimation Methodology
To enable replication of the cost estimation method to all opportunity areas, a high level estimation
has been established. The cost estimates utilise the New Rules of Measurement (NRM) and Building
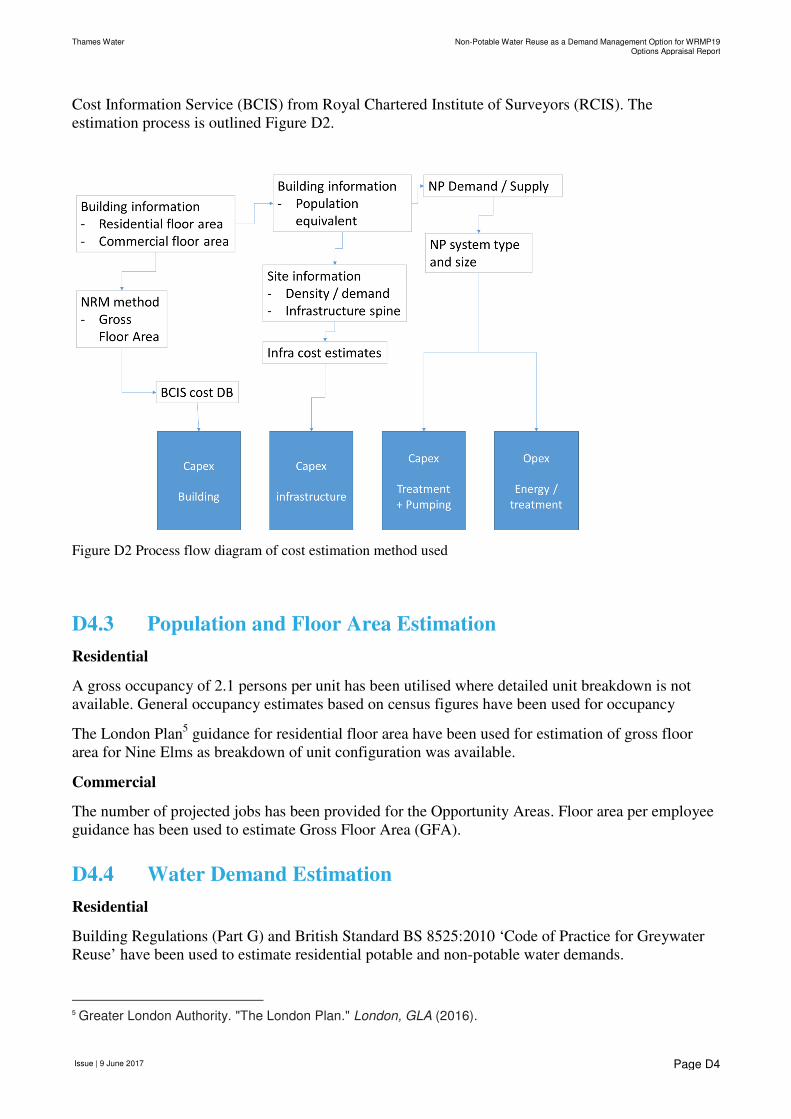
Thames Water Non-Potable Water Reuse as a Demand Management Option for WRMP19Options Appraisal Report
Issue | 9 June 2017
Page D4
Cost Information Service (BCIS) from Royal Chartered Institute of Surveyors (RCIS). The
estimation process is outlined Figure D2.
Figure D2 Process flow diagram of cost estimation method used
D4.3 Population and Floor Area Estimation
Residential
A gross occupancy of 2.1 persons per unit has been utilised where detailed unit breakdown is not
available. General occupancy estimates based on census figures have been used for occupancy
The London Plan5 guidance for residential floor area have been used for estimation of gross floor
area for Nine Elms as breakdown of unit configuration was available.
Commercial
The number of projected jobs has been provided for the Opportunity Areas. Floor area per employee
guidance has been used to estimate Gross Floor Area (GFA).
D4.4 Water Demand Estimation
Residential
Building Regulations (Part G) and British Standard BS 8525:2010 ‘Code of Practice for Greywater
Reuse’ have been used to estimate residential potable and non-potable water demands.
5 Greater London Authority. "The London Plan." London, GLA (2016).
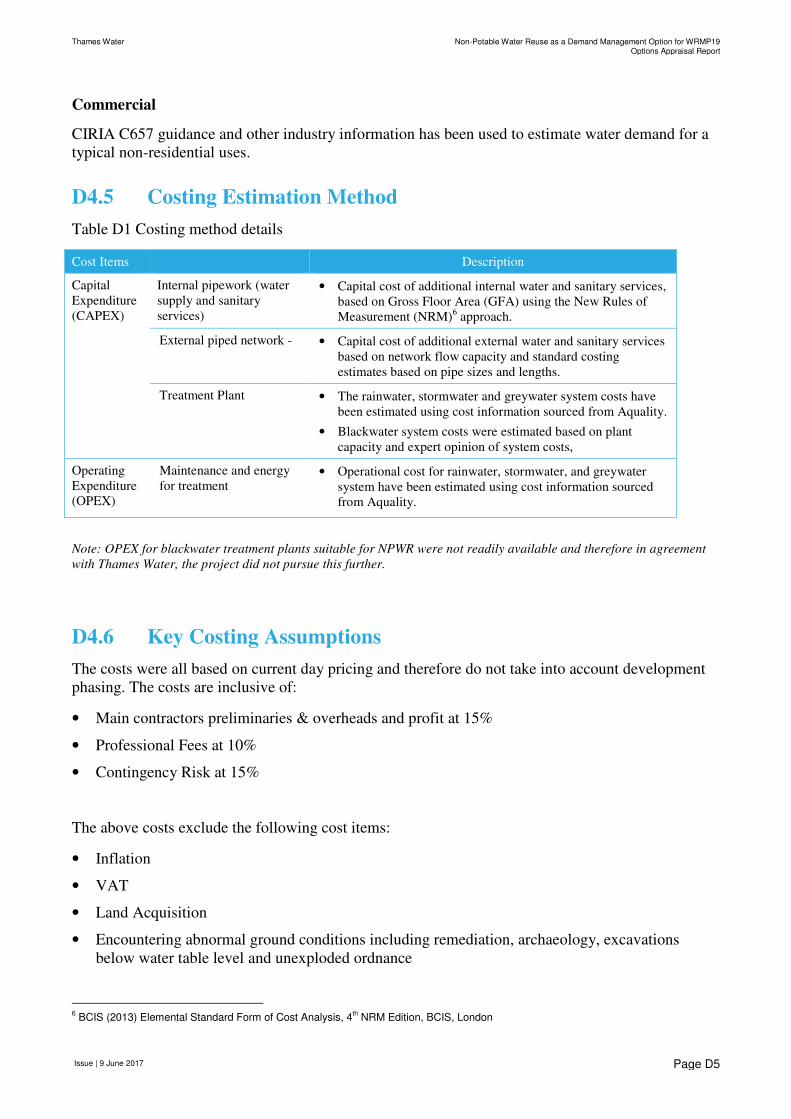
Thames Water Non-Potable Water Reuse as a Demand Management Option for WRMP19Options Appraisal Report
Issue | 9 June 2017
Page D5
Commercial
CIRIA C657 guidance and other industry information has been used to estimate water demand for a
typical non-residential uses.
D4.5 Costing Estimation Method
Table D1 Costing method details
Cost Items Description
Capital
Expenditure
(CAPEX)
Internal pipework (water
supply and sanitary
services)
• Capital cost of additional internal water and sanitary services,
based on Gross Floor Area (GFA) using the New Rules of
Measurement (NRM)6 approach.
External piped network - • Capital cost of additional external water and sanitary services
based on network flow capacity and standard costing
estimates based on pipe sizes and lengths.
Treatment Plant • The rainwater, stormwater and greywater system costs have
been estimated using cost information sourced from Aquality.
• Blackwater system costs were estimated based on plant
capacity and expert opinion of system costs,
Operating
Expenditure
(OPEX)
Maintenance and energy
for treatment • Operational cost for rainwater, stormwater, and greywater
system have been estimated using cost information sourced
from Aquality.
Note: OPEX for blackwater treatment plants suitable for NPWR were not readily available and therefore in agreement
with Thames Water, the project did not pursue this further.
D4.6 Key Costing Assumptions
The costs were all based on current day pricing and therefore do not take into account development
phasing. The costs are inclusive of:
• Main contractors preliminaries & overheads and profit at 15%
• Professional Fees at 10%
• Contingency Risk at 15%
The above costs exclude the following cost items:
• Inflation
• VAT
• Land Acquisition
• Encountering abnormal ground conditions including remediation, archaeology, excavations
below water table level and unexploded ordnance
6 BCIS (2013) Elemental Standard Form of Cost Analysis, 4
th NRM Edition, BCIS, London

Thames Water Non-Potable Water Reuse as a Demand Management Option for WRMP19Options Appraisal Report
Issue | 9 June 2017
Page D6
D5 Notes on Costs for Rainwater and Greywater systems
1. OPEX cost for RWH and GWH systems are based on single systems with dual yearly
maintenance visits at current prices.
2. CAPEX for RWH and GWH systems include for pumping systems to convey the water within
the buildings to end use.
3. The OPEX costs exclude energy costs of pumping water internally within buildings. For high
rise, any energy costs for pumping non-potable water would be offset by reduction in pumping
costs of potable water.

Thames Water Non-Potable Water Reuse as a Demand Management Option for WRMP19Options Appraisal Report
Issue | 9 June 2017
Page D7
D6 Detailed Outputs
D6.1 Technical Yield
The assessments were undertaken on DMA basis and supplied in excel spreadsheet in such format.
However, for consistency with rest of the assessments, the outputs have been presented on
Opportunity Area boundaries. The ones highlighted in red have been discounted from assessment as
they fall below the 10 m3/d threshold.
Table D2 Technical non-potable yields in residential developments
OA RWH
(Ml/d)
SWH
(Ml/d)
GWR
(Ml/d)
BWR
(Ml/d)
Combined
(Ml/d)
1 Bexley Riverside+ 0.044 0.067 1.733 2.599 1.843
2 Bromley 0.007 0.010 0.263 0.394 0.279
3 Canada Water 0.018 0.027 0.693 1.040 0.737
4 Charlton Riverside 0.009 0.014 0.368 0.551 0.391
5 City Fringe/Tech City 0.040 0.060 1.575 2.363 1.676
6 Cricklewood / Brent Cross 0.027 0.040 1.050 1.575 1.117
7 Croydon 0.020 0.029 0.767 1.150 0.816
8 Deptford Creek/Greenwich Riverside+ 0.013 0.020 0.525 0.788 0.559
9 Earls Court 0.020 0.030 0.788 1.181 0.838
10 Elephant & Castle 0.013 0.020 0.525 0.788 0.559
11 Euston 0.010 0.015 0.399 0.599 0.425
12 Greenwich Peninsula 0.054 0.081 2.100 3.150 2.234
13 Isle of Dogs 0.081 0.121 3.150 4.725 3.352
14 Kings Cross - St Pancras 0.005 0.008 0.200 0.299 0.212
15 Lewisham, Catford and New Cross 0.022 0.032 0.840 1.260 0.894
16 Lower Lea Valley (including Stratford) 0.005 0.008 0.200 0.299 0.212
17 Old Kent Road+ 0.092 0.137 3.581 5.371 3.810
18 Old Oak and Park Royal 0.054 0.081 2.100 3.150 2.234
19 Paddington 0.144 0.216 5.618 8.426 5.977
20 Royal Docks & Beckton Waterfront 0.003 0.004 0.105 0.158 0.112
21 Thamesmead & Abbeywood 0.063 0.094 2.457 3.686 2.614
22 Tottenham Court Road 0.013 0.020 0.525 0.788 0.559
23 Upper Lee Valley+ 0.001 0.002 0.053 0.079 0.056
24 Vauxhall, Nine Elms & Battersea 0.054 0.081 2.111 3.166 2.246
25 Victoria 0.027 0.040 1.050 1.575 1.117
26 Waterloo + London Bridge, Borough &
Bankside 0.003 0.004 0.105 0.158 0.112
27 White city 0.007 0.010 0.263 0.394 0.279
28 Woolwich 0.016 0.024 0.630 0.945 0.670
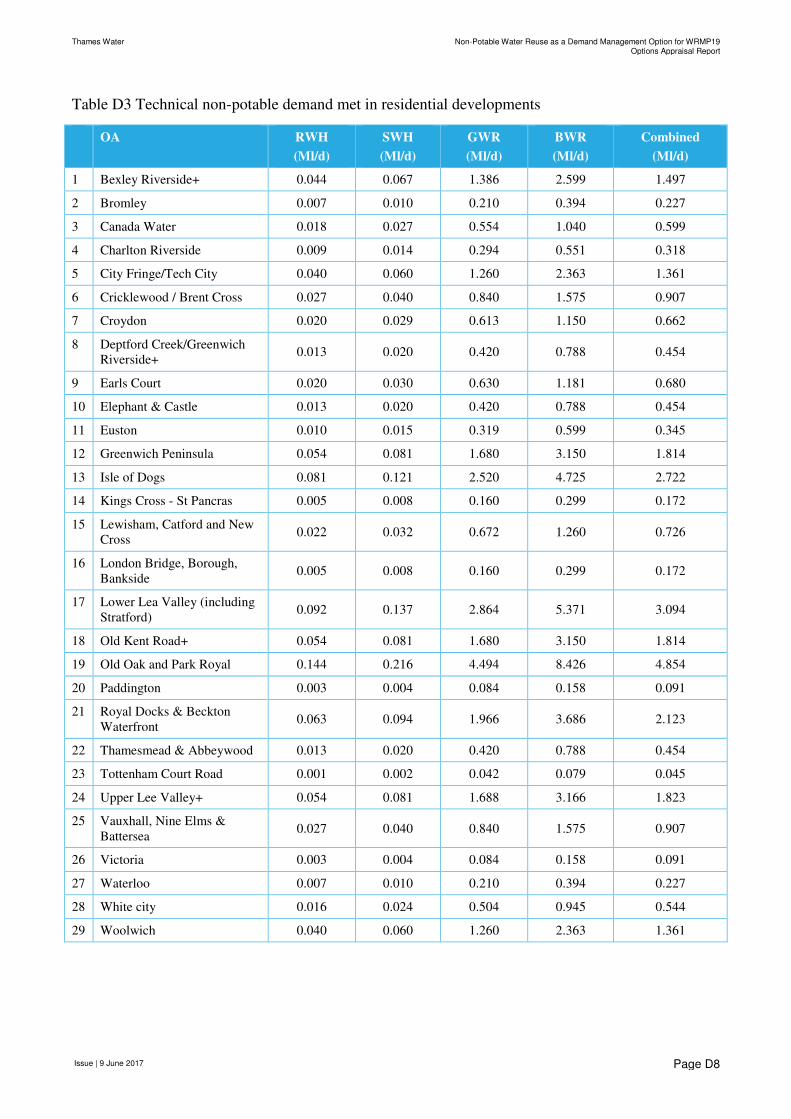
Thames Water Non-Potable Water Reuse as a Demand Management Option for WRMP19Options Appraisal Report
Issue | 9 June 2017
Page D8
Table D3 Technical non-potable demand met in residential developments
OA RWH
(Ml/d)
SWH
(Ml/d)
GWR
(Ml/d)
BWR
(Ml/d)
Combined
(Ml/d)
1 Bexley Riverside+ 0.044 0.067 1.386 2.599 1.497
2 Bromley 0.007 0.010 0.210 0.394 0.227
3 Canada Water 0.018 0.027 0.554 1.040 0.599
4 Charlton Riverside 0.009 0.014 0.294 0.551 0.318
5 City Fringe/Tech City 0.040 0.060 1.260 2.363 1.361
6 Cricklewood / Brent Cross 0.027 0.040 0.840 1.575 0.907
7 Croydon 0.020 0.029 0.613 1.150 0.662
8 Deptford Creek/Greenwich
Riverside+ 0.013 0.020 0.420 0.788 0.454
9 Earls Court 0.020 0.030 0.630 1.181 0.680
10 Elephant & Castle 0.013 0.020 0.420 0.788 0.454
11 Euston 0.010 0.015 0.319 0.599 0.345
12 Greenwich Peninsula 0.054 0.081 1.680 3.150 1.814
13 Isle of Dogs 0.081 0.121 2.520 4.725 2.722
14 Kings Cross - St Pancras 0.005 0.008 0.160 0.299 0.172
15 Lewisham, Catford and New
Cross 0.022 0.032 0.672 1.260 0.726
16 London Bridge, Borough,
Bankside 0.005 0.008 0.160 0.299 0.172
17 Lower Lea Valley (including
Stratford) 0.092 0.137 2.864 5.371 3.094
18 Old Kent Road+ 0.054 0.081 1.680 3.150 1.814
19 Old Oak and Park Royal 0.144 0.216 4.494 8.426 4.854
20 Paddington 0.003 0.004 0.084 0.158 0.091
21 Royal Docks & Beckton
Waterfront 0.063 0.094 1.966 3.686 2.123
22 Thamesmead & Abbeywood 0.013 0.020 0.420 0.788 0.454
23 Tottenham Court Road 0.001 0.002 0.042 0.079 0.045
24 Upper Lee Valley+ 0.054 0.081 1.688 3.166 1.823
25 Vauxhall, Nine Elms &
Battersea 0.027 0.040 0.840 1.575 0.907
26 Victoria 0.003 0.004 0.084 0.158 0.091
27 Waterloo 0.007 0.010 0.210 0.394 0.227
28 White city 0.016 0.024 0.504 0.945 0.544
29 Woolwich 0.040 0.060 1.260 2.363 1.361
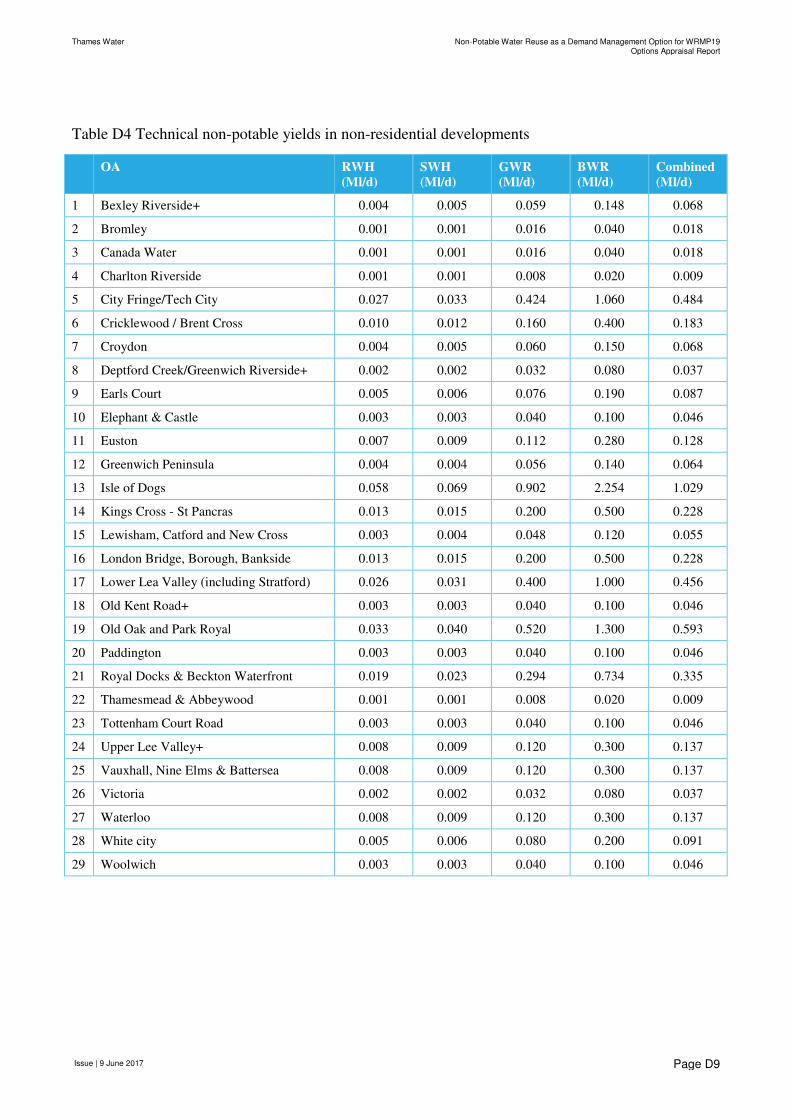
Thames Water Non-Potable Water Reuse as a Demand Management Option for WRMP19Options Appraisal Report
Issue | 9 June 2017
Page D9
Table D4 Technical non-potable yields in non-residential developments
OA RWH
(Ml/d)
SWH
(Ml/d)
GWR
(Ml/d)
BWR
(Ml/d)
Combined
(Ml/d)
1 Bexley Riverside+ 0.004 0.005 0.059 0.148 0.068
2 Bromley 0.001 0.001 0.016 0.040 0.018
3 Canada Water 0.001 0.001 0.016 0.040 0.018
4 Charlton Riverside 0.001 0.001 0.008 0.020 0.009
5 City Fringe/Tech City 0.027 0.033 0.424 1.060 0.484
6 Cricklewood / Brent Cross 0.010 0.012 0.160 0.400 0.183
7 Croydon 0.004 0.005 0.060 0.150 0.068
8 Deptford Creek/Greenwich Riverside+ 0.002 0.002 0.032 0.080 0.037
9 Earls Court 0.005 0.006 0.076 0.190 0.087
10 Elephant & Castle 0.003 0.003 0.040 0.100 0.046
11 Euston 0.007 0.009 0.112 0.280 0.128
12 Greenwich Peninsula 0.004 0.004 0.056 0.140 0.064
13 Isle of Dogs 0.058 0.069 0.902 2.254 1.029
14 Kings Cross - St Pancras 0.013 0.015 0.200 0.500 0.228
15 Lewisham, Catford and New Cross 0.003 0.004 0.048 0.120 0.055
16 London Bridge, Borough, Bankside 0.013 0.015 0.200 0.500 0.228
17 Lower Lea Valley (including Stratford) 0.026 0.031 0.400 1.000 0.456
18 Old Kent Road+ 0.003 0.003 0.040 0.100 0.046
19 Old Oak and Park Royal 0.033 0.040 0.520 1.300 0.593
20 Paddington 0.003 0.003 0.040 0.100 0.046
21 Royal Docks & Beckton Waterfront 0.019 0.023 0.294 0.734 0.335
22 Thamesmead & Abbeywood 0.001 0.001 0.008 0.020 0.009
23 Tottenham Court Road 0.003 0.003 0.040 0.100 0.046
24 Upper Lee Valley+ 0.008 0.009 0.120 0.300 0.137
25 Vauxhall, Nine Elms & Battersea 0.008 0.009 0.120 0.300 0.137
26 Victoria 0.002 0.002 0.032 0.080 0.037
27 Waterloo 0.008 0.009 0.120 0.300 0.137
28 White city 0.005 0.006 0.080 0.200 0.091
29 Woolwich 0.003 0.003 0.040 0.100 0.046
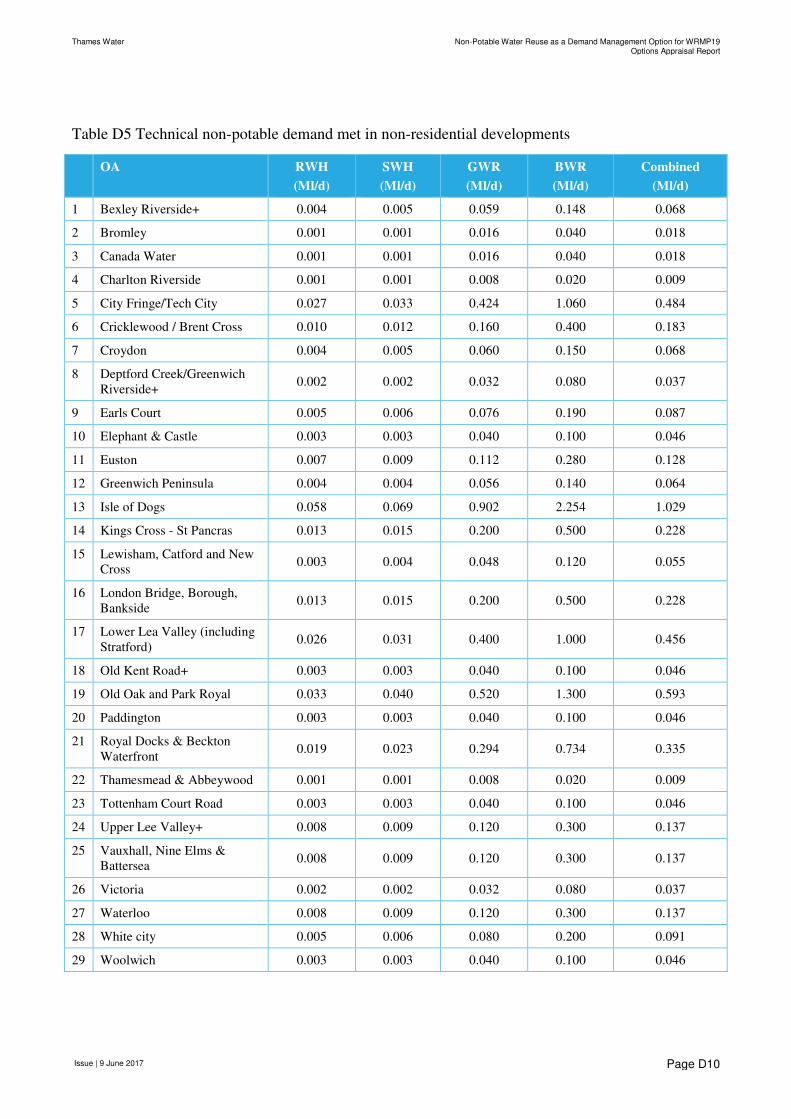
Thames Water Non-Potable Water Reuse as a Demand Management Option for WRMP19Options Appraisal Report
Issue | 9 June 2017
Page D10
Table D5 Technical non-potable demand met in non-residential developments
OA RWH
(Ml/d)
SWH
(Ml/d)
GWR
(Ml/d)
BWR
(Ml/d)
Combined
(Ml/d)
1 Bexley Riverside+ 0.004 0.005 0.059 0.148 0.068
2 Bromley 0.001 0.001 0.016 0.040 0.018
3 Canada Water 0.001 0.001 0.016 0.040 0.018
4 Charlton Riverside 0.001 0.001 0.008 0.020 0.009
5 City Fringe/Tech City 0.027 0.033 0.424 1.060 0.484
6 Cricklewood / Brent Cross 0.010 0.012 0.160 0.400 0.183
7 Croydon 0.004 0.005 0.060 0.150 0.068
8 Deptford Creek/Greenwich
Riverside+ 0.002 0.002 0.032 0.080 0.037
9 Earls Court 0.005 0.006 0.076 0.190 0.087
10 Elephant & Castle 0.003 0.003 0.040 0.100 0.046
11 Euston 0.007 0.009 0.112 0.280 0.128
12 Greenwich Peninsula 0.004 0.004 0.056 0.140 0.064
13 Isle of Dogs 0.058 0.069 0.902 2.254 1.029
14 Kings Cross - St Pancras 0.013 0.015 0.200 0.500 0.228
15 Lewisham, Catford and New
Cross 0.003 0.004 0.048 0.120 0.055
16 London Bridge, Borough,
Bankside 0.013 0.015 0.200 0.500 0.228
17 Lower Lea Valley (including
Stratford) 0.026 0.031 0.400 1.000 0.456
18 Old Kent Road+ 0.003 0.003 0.040 0.100 0.046
19 Old Oak and Park Royal 0.033 0.040 0.520 1.300 0.593
20 Paddington 0.003 0.003 0.040 0.100 0.046
21 Royal Docks & Beckton
Waterfront 0.019 0.023 0.294 0.734 0.335
22 Thamesmead & Abbeywood 0.001 0.001 0.008 0.020 0.009
23 Tottenham Court Road 0.003 0.003 0.040 0.100 0.046
24 Upper Lee Valley+ 0.008 0.009 0.120 0.300 0.137
25 Vauxhall, Nine Elms &
Battersea 0.008 0.009 0.120 0.300 0.137
26 Victoria 0.002 0.002 0.032 0.080 0.037
27 Waterloo 0.008 0.009 0.120 0.300 0.137
28 White city 0.005 0.006 0.080 0.200 0.091
29 Woolwich 0.003 0.003 0.040 0.100 0.046

Thames Water Non-Potable Water Reuse as a Demand Management Option for WRMP19Options Appraisal Report
Issue | 9 June 2017
Page D11
Thames Water Non-Potable Water Reuse as a Demand Management Option for WRMP19Options Appraisal Report
Issue | 9 June 2017
Page D12
D7 Supplementary Information
D7.1 Costing of Non-Potable Alternative Water Supply Options
The costs associated with water reclamation and reuse varies widely, particularly depending on the
technology, scale, water source and end use. In general, alternative water sources, and recycled water
in particular, typically exceed the cost of the centralised potable water supplies – from a purely
potable water supply perspective.
Considering costs for alternative water supplies systems, key factors influencing the capital and
operational costs include:
• Distance and lift required from the source of water to consumption;
• Type and quality of water source;
• Level of treatment required, which is related to national regulatory requirements; and
• Density of development, which determines the cost of distributing the water across an urban area.
Generally, energy cost, operational and maintenance cost, and capital investment are the main
contributors to the water production cost. Of these, operational and maintenance can be two of the
largest and most variable costs, and are also difficult to ascertain due to variability in applications,
regulations, building costs, and other project specific factors.
Simple cost analysis of treatment and reuse is therefore difficult to calculate, and it is important that
differences in assumptions and factors associated with allocation of costs be correctly understood.
Furthermore, a purely economic assessment often does not take full account of social and
environmental externalities and avoided costs. Avoided costs are those which may be incurred
without the initiative proceeding and may include:
• Reduced wastewater system operating and capital investment as a result of:
• Reduced loads into the wastewater system,
• Reduced water demand from the potable water system,
• Avoided upstream investments (such as alternative supply sources) as a result of reduced water
demand,
• Avoided expensive private water investment on a lot scale (such as building scale initiatives to
achieve desired sustainability accreditations); and
• Synergistic cost reduction activities in incorporating infrastructure within:
• Wider investment to reduce sewage overflows or improve system reliability; or
• Major infrastructure strategies and development areas.
• Extended Infrastructure lifecycles
Social and environmental externalities may additionally be difficult to define and evaluate,
particularly in quantifiable or monetary terms. These may include improved health of surface and
ground water resources and associated ecosystems, greater urban resilience and flexibility to respond
to climate change, and improved urban liveability.

Issue | 9 June 2017
Page E13
Appendix E
Case Studies
Issue | 9 June 2017
Page G1
E1 Old Oak Common
E1.1 Overview of the Area
Covering 650 hectares of land in West London, Old Oak Common and Park Royal Opportunity
Areas are important strategic locations for major urban regeneration, targeted to deliver a significant
contribution to crucial housing, employment and strategic growth with London.
The proposals in this area comprise a mixture of ambitious industrial, residential and commercial
regeneration and development. However, the proposals are heavily constrained by an acute lack of
capacity within the combined drainage infrastructure, contributing to downstream flood risk, and an
increasing deficit of available water to meet demand in the rapidly expanding city.
In an attempt to meet these challenges, an Integrated Water Management Strategy was developed for
these Opportunity Areas to set a framework for how water, wastewater and flood risk should be
managed, in order to move towards a more sustainable new development.
E1.2 Development Context and Assumptions
Major new development will be focused at Old Oak Common, which is proposed to be a high density
mixed-use development accommodating approximately 25,500 new homes and an indicative 65,000
new jobs.
Park Royal is proposed to be retained as a strategic industrial location, with the majority of existing
businesses retained. In addition, the Park Royal development will provide approximately 10,000 new
employment opportunities. The primary area for this development will be at the site of the High
Speed 2 (HS2) construction sites following their release upon completion of the project. The current
preferred option is for site re-development as an industrial business park, incorporating 125,750 m2
of new floor space. In addition, 1,500 new homes will be constructed to the west of Park Royal and
additional employment opportunities created through regeneration and densification of the existing
land use.
Existing and proposed development areas, land use information and occupancy were derived using
GIS layers and masterplan information provided by the Old Oak and Park Royal Development
Corporation (OPDC). The population assumptions are summarised below for the two areas:
Old Oak Common
• 50,658 residential population, assuming a 2.1 persons per dwelling occupancy rate.
• 40,000 office employment population.
• 10,000 retail employment population
Park Royal
• 3,150 additional residential population, assuming a 2.1 person per dwelling occupancy rate.
• 10,000 new industrial population.
Issue | 9 June 2017
Page G2
It should be noted that these numbers are in addition to existing population in the retained areas of
the development. In particular this includes approximately 2,000 businesses with 30,000 employees,
which will be retained and enhanced within Park Royal. Building and population characteristics for
these areas were obtained from GIS layers provided by the Old Oak and Park Royal Development
Corporation.
Building footprints were assumed to be 60% of plot coverage for new buildings. Residential floor
space was based on an assumption of 81m²/apartment.
The building and floor space assumptions for new build areas across the two Opportunity Areas are
summarised below:
• Old Oak Common
• 140 buildings, including 24,670 residential apartments, with assumed gross external area of
1,998,170 m², 35,392 m² gross external area of offices and 102,720 m² gross external area of
retail.
• Park Royal
• 1,500 residential apartments and 239,659 m² gross external area of new industrial development.
E1.3 Water Balance
An annual water balance model was developed for the Opportunity Areas to characterise and
quantify the water cycle flows anticipated from the proposed development.
Water demand and wastewater generation were estimated using usage assumptions based upon the
Building Regulations 2010 Part G (2015 Edition) and British Standard BS 8524:2001.
For both of these methodologies, the total water demand is based on assumptions on the use of
sanitary fittings. A range of efficiency scenarios were tested for the existing and new land uses;
however, it has been generally assumed that all new development would meet the maximum
‘optional’ standard of water efficiency on 110 litres per person per day, supporting the latest
guidance within the London Plan.
The anticipated pre and post development water balance for the opportunity areas is illustrated in
Figure E1 and Figure E2.
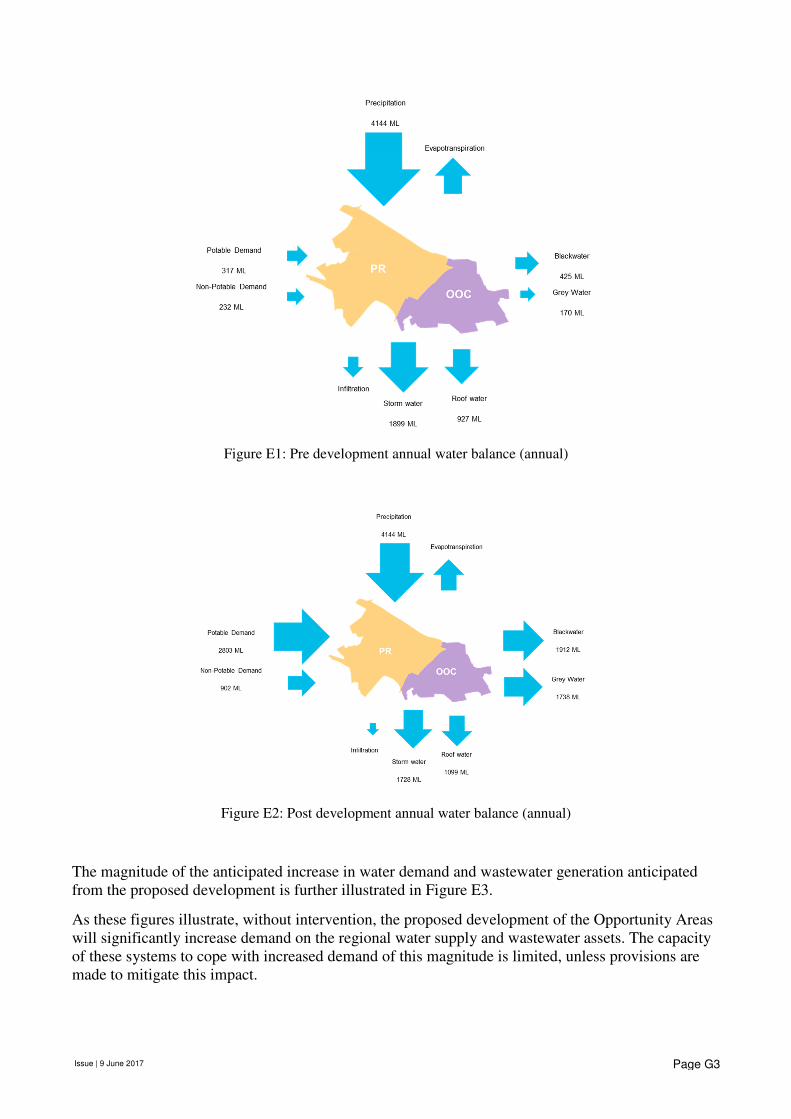
Issue | 9 June 2017
Page G3
Figure E1: Pre development annual water balance (annual)
Figure E2: Post development annual water balance (annual)
The magnitude of the anticipated increase in water demand and wastewater generation anticipated
from the proposed development is further illustrated in Figure E3.
As these figures illustrate, without intervention, the proposed development of the Opportunity Areas
will significantly increase demand on the regional water supply and wastewater assets. The capacity
of these systems to cope with increased demand of this magnitude is limited, unless provisions are
made to mitigate this impact.
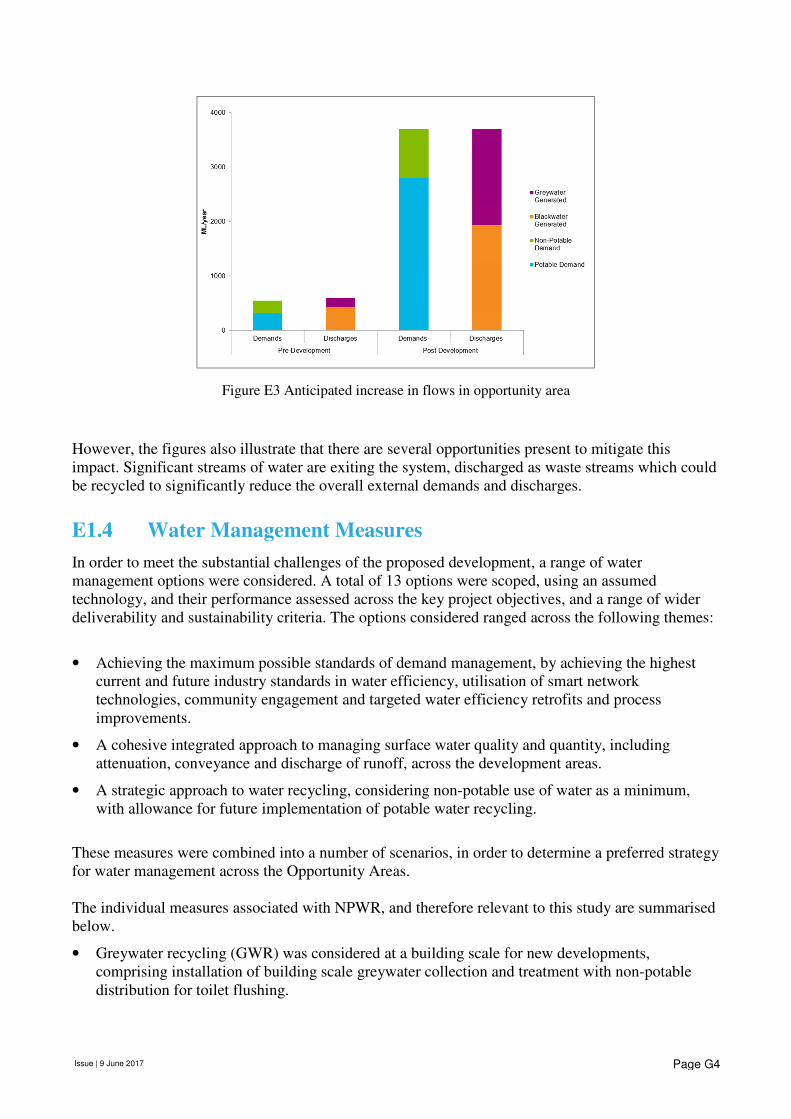
Issue | 9 June 2017
Page G4
Figure E3 Anticipated increase in flows in opportunity area
However, the figures also illustrate that there are several opportunities present to mitigate this
impact. Significant streams of water are exiting the system, discharged as waste streams which could
be recycled to significantly reduce the overall external demands and discharges.
E1.4 Water Management Measures
In order to meet the substantial challenges of the proposed development, a range of water
management options were considered. A total of 13 options were scoped, using an assumed
technology, and their performance assessed across the key project objectives, and a range of wider
deliverability and sustainability criteria. The options considered ranged across the following themes:
• Achieving the maximum possible standards of demand management, by achieving the highest
current and future industry standards in water efficiency, utilisation of smart network
technologies, community engagement and targeted water efficiency retrofits and process
improvements.
• A cohesive integrated approach to managing surface water quality and quantity, including
attenuation, conveyance and discharge of runoff, across the development areas.
• A strategic approach to water recycling, considering non-potable use of water as a minimum,
with allowance for future implementation of potable water recycling.
These measures were combined into a number of scenarios, in order to determine a preferred strategy
for water management across the Opportunity Areas.
The individual measures associated with NPWR, and therefore relevant to this study are summarised
below.
• Greywater recycling (GWR) was considered at a building scale for new developments,
comprising installation of building scale greywater collection and treatment with non-potable
distribution for toilet flushing.
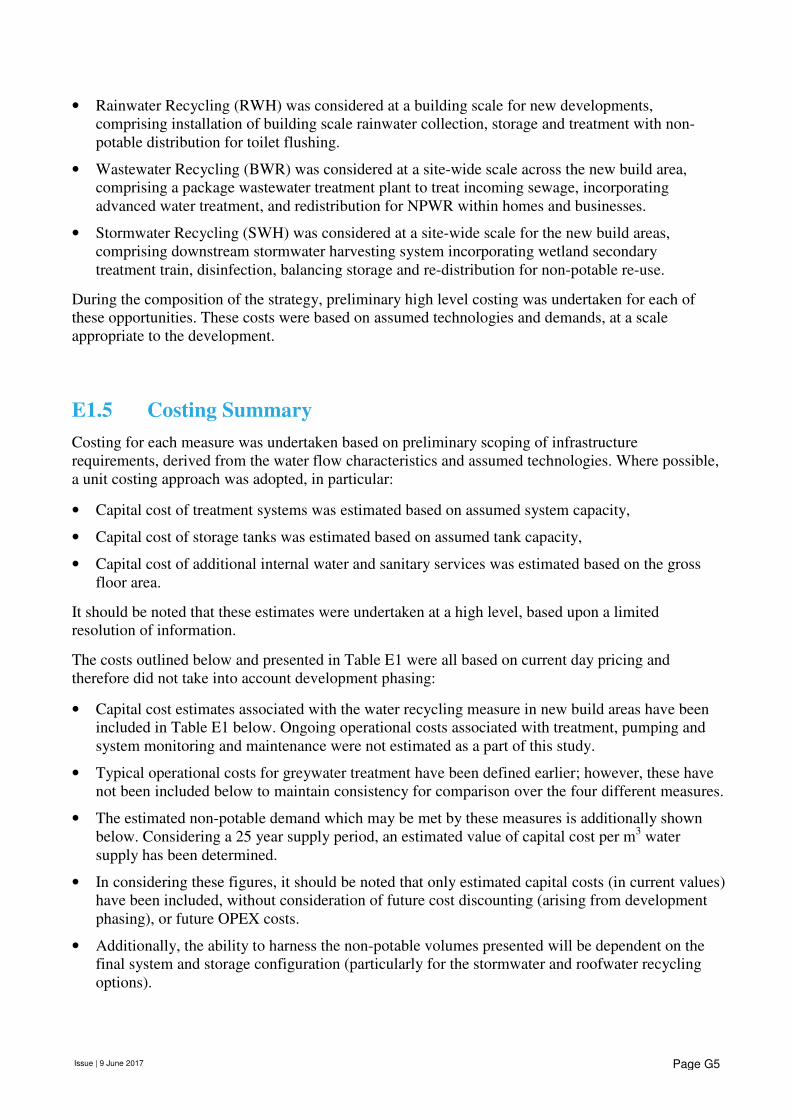
Issue | 9 June 2017
Page G5
• Rainwater Recycling (RWH) was considered at a building scale for new developments,
comprising installation of building scale rainwater collection, storage and treatment with non-
potable distribution for toilet flushing.
• Wastewater Recycling (BWR) was considered at a site-wide scale across the new build area,
comprising a package wastewater treatment plant to treat incoming sewage, incorporating
advanced water treatment, and redistribution for NPWR within homes and businesses.
• Stormwater Recycling (SWH) was considered at a site-wide scale for the new build areas,
comprising downstream stormwater harvesting system incorporating wetland secondary
treatment train, disinfection, balancing storage and re-distribution for non-potable re-use.
During the composition of the strategy, preliminary high level costing was undertaken for each of
these opportunities. These costs were based on assumed technologies and demands, at a scale
appropriate to the development.
E1.5 Costing Summary
Costing for each measure was undertaken based on preliminary scoping of infrastructure
requirements, derived from the water flow characteristics and assumed technologies. Where possible,
a unit costing approach was adopted, in particular:
• Capital cost of treatment systems was estimated based on assumed system capacity,
• Capital cost of storage tanks was estimated based on assumed tank capacity,
• Capital cost of additional internal water and sanitary services was estimated based on the gross
floor area.
It should be noted that these estimates were undertaken at a high level, based upon a limited
resolution of information.
The costs outlined below and presented in Table E1 were all based on current day pricing and
therefore did not take into account development phasing:
• Capital cost estimates associated with the water recycling measure in new build areas have been
included in Table E1 below. Ongoing operational costs associated with treatment, pumping and
system monitoring and maintenance were not estimated as a part of this study.
• Typical operational costs for greywater treatment have been defined earlier; however, these have
not been included below to maintain consistency for comparison over the four different measures.
• The estimated non-potable demand which may be met by these measures is additionally shown
below. Considering a 25 year supply period, an estimated value of capital cost per m3 water
supply has been determined.
• In considering these figures, it should be noted that only estimated capital costs (in current values)
have been included, without consideration of future cost discounting (arising from development
phasing), or future OPEX costs.
• Additionally, the ability to harness the non-potable volumes presented will be dependent on the
final system and storage configuration (particularly for the stormwater and roofwater recycling
options).

Issue | 9 June 2017
Page G6
Table E1 Old Oak and Park Royal cost estimates
Representative
typology
Estimated non-
potable demand met
(ML/ year)
Offset of potable
demand
Capital cost per m3
water supply (over
25 years)
Rainwater Harvesting Typology 2 320 12% £9
Greywater reuse Typology 2 550 20% £7
Blackwater reuse Typology 4 550 20% £3
Stormwater harvesting Typology 4 550 20% £3
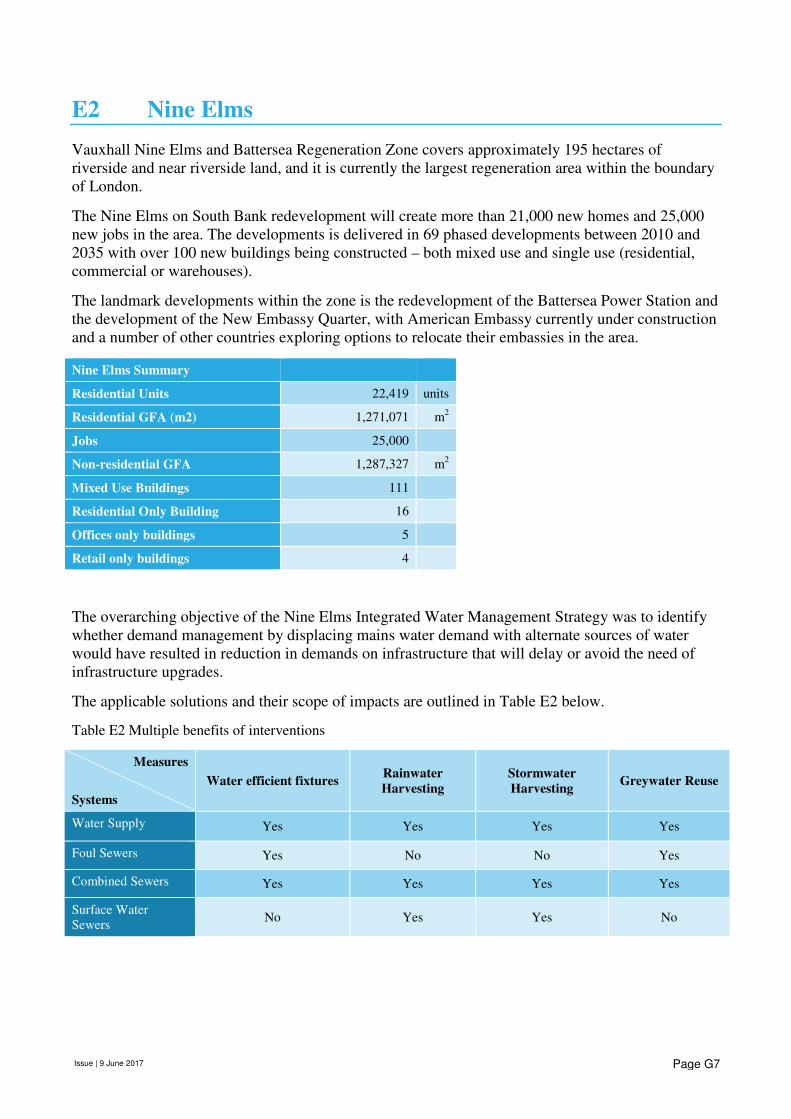
Issue | 9 June 2017
Page G7
E2 Nine Elms
Vauxhall Nine Elms and Battersea Regeneration Zone covers approximately 195 hectares of
riverside and near riverside land, and it is currently the largest regeneration area within the boundary
of London.
The Nine Elms on South Bank redevelopment will create more than 21,000 new homes and 25,000
new jobs in the area. The developments is delivered in 69 phased developments between 2010 and
2035 with over 100 new buildings being constructed – both mixed use and single use (residential,
commercial or warehouses).
The landmark developments within the zone is the redevelopment of the Battersea Power Station and
the development of the New Embassy Quarter, with American Embassy currently under construction
and a number of other countries exploring options to relocate their embassies in the area.
Nine Elms Summary
Residential Units 22,419 units
Residential GFA (m2) 1,271,071 m2
Jobs 25,000
Non-residential GFA 1,287,327 m2
Mixed Use Buildings 111
Residential Only Building 16
Offices only buildings 5
Retail only buildings 4
The overarching objective of the Nine Elms Integrated Water Management Strategy was to identify
whether demand management by displacing mains water demand with alternate sources of water
would have resulted in reduction in demands on infrastructure that will delay or avoid the need of
infrastructure upgrades.
The applicable solutions and their scope of impacts are outlined in Table E2 below.
Table E2 Multiple benefits of interventions
Measures
Systems
Water efficient fixtures Rainwater
Harvesting
Stormwater
Harvesting Greywater Reuse
Water Supply Yes Yes Yes Yes
Foul Sewers Yes No No Yes
Combined Sewers Yes Yes Yes Yes
Surface Water
Sewers No Yes Yes No
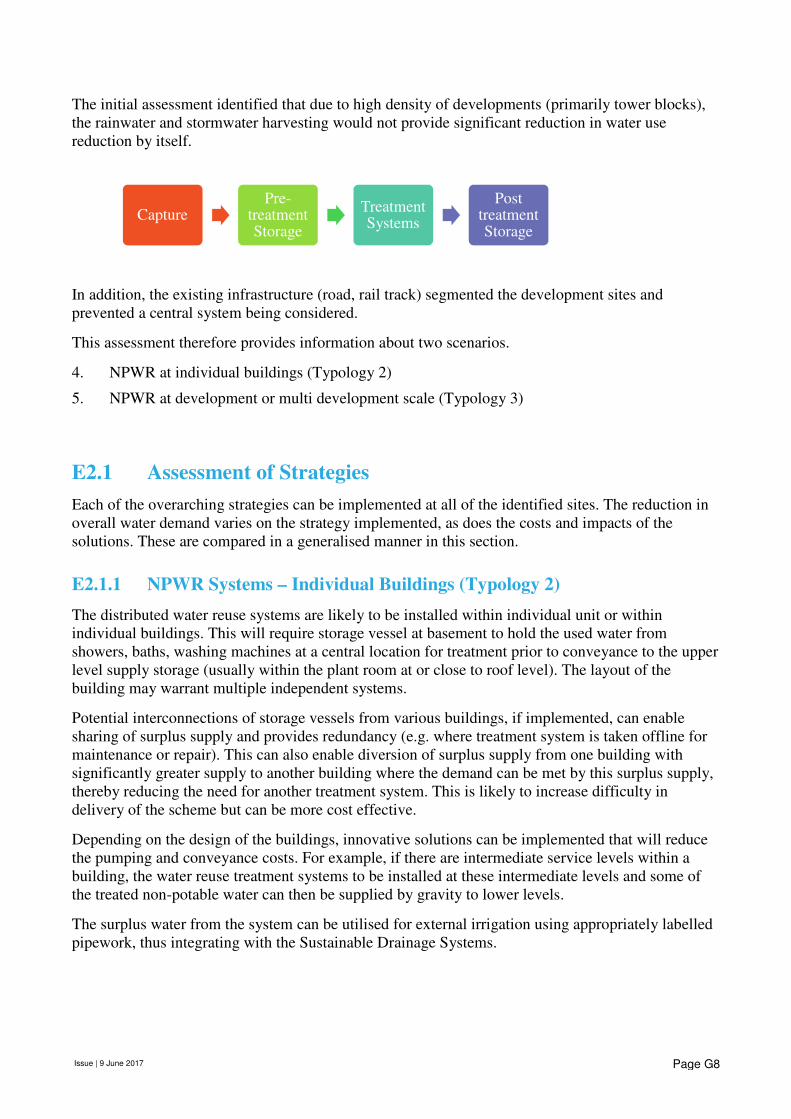
Issue | 9 June 2017
Page G8
The initial assessment identified that due to high density of developments (primarily tower blocks),
the rainwater and stormwater harvesting would not provide significant reduction in water use
reduction by itself.
In addition, the existing infrastructure (road, rail track) segmented the development sites and
prevented a central system being considered.
This assessment therefore provides information about two scenarios.
4. NPWR at individual buildings (Typology 2)
5. NPWR at development or multi development scale (Typology 3)
E2.1 Assessment of Strategies
Each of the overarching strategies can be implemented at all of the identified sites. The reduction in
overall water demand varies on the strategy implemented, as does the costs and impacts of the
solutions. These are compared in a generalised manner in this section.
E2.1.1 NPWR Systems – Individual Buildings (Typology 2)
The distributed water reuse systems are likely to be installed within individual unit or within
individual buildings. This will require storage vessel at basement to hold the used water from
showers, baths, washing machines at a central location for treatment prior to conveyance to the upper
level supply storage (usually within the plant room at or close to roof level). The layout of the
building may warrant multiple independent systems.
Potential interconnections of storage vessels from various buildings, if implemented, can enable
sharing of surplus supply and provides redundancy (e.g. where treatment system is taken offline for
maintenance or repair). This can also enable diversion of surplus supply from one building with
significantly greater supply to another building where the demand can be met by this surplus supply,
thereby reducing the need for another treatment system. This is likely to increase difficulty in
delivery of the scheme but can be more cost effective.
Depending on the design of the buildings, innovative solutions can be implemented that will reduce
the pumping and conveyance costs. For example, if there are intermediate service levels within a
building, the water reuse treatment systems to be installed at these intermediate levels and some of
the treated non-potable water can then be supplied by gravity to lower levels.
The surplus water from the system can be utilised for external irrigation using appropriately labelled
pipework, thus integrating with the Sustainable Drainage Systems.
CapturePre-
treatment Storage
Treatment Systems
Post treatment Storage
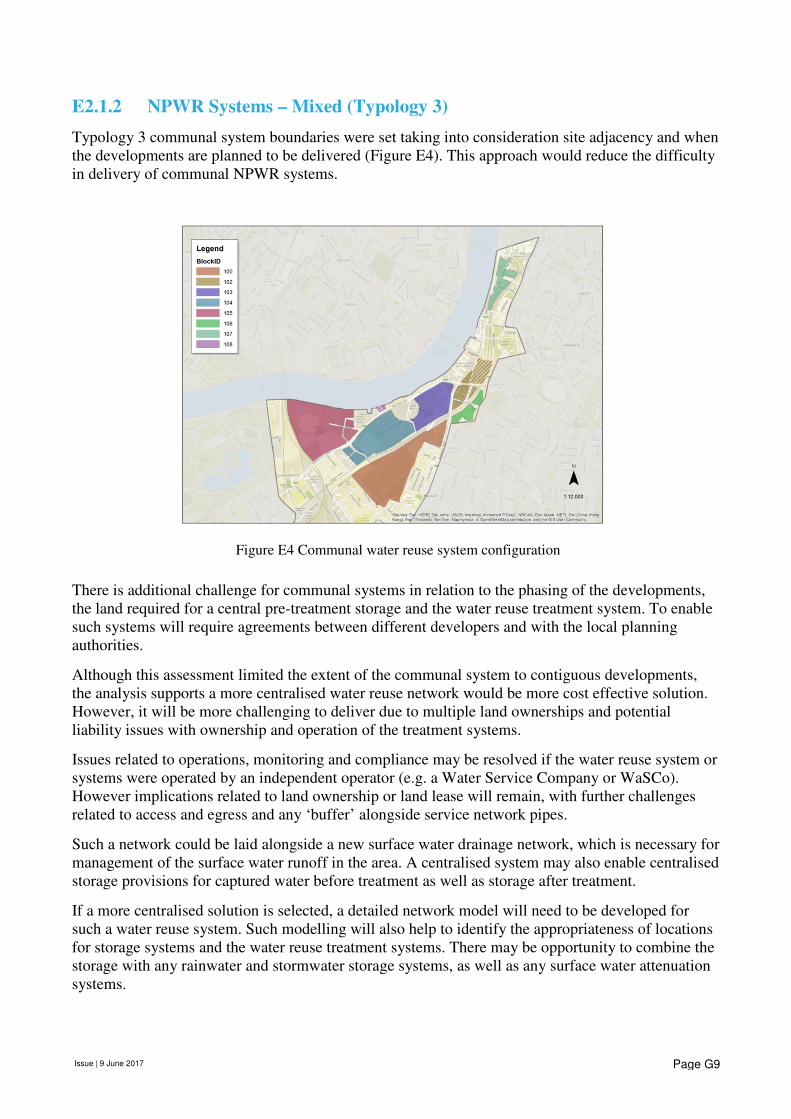
Issue | 9 June 2017
Page G9
E2.1.2 NPWR Systems – Mixed (Typology 3)
Typology 3 communal system boundaries were set taking into consideration site adjacency and when
the developments are planned to be delivered (Figure E4). This approach would reduce the difficulty
in delivery of communal NPWR systems.
There is additional challenge for communal systems in relation to the phasing of the developments,
the land required for a central pre-treatment storage and the water reuse treatment system. To enable
such systems will require agreements between different developers and with the local planning
authorities.
Although this assessment limited the extent of the communal system to contiguous developments,
the analysis supports a more centralised water reuse network would be more cost effective solution.
However, it will be more challenging to deliver due to multiple land ownerships and potential
liability issues with ownership and operation of the treatment systems.
Issues related to operations, monitoring and compliance may be resolved if the water reuse system or
systems were operated by an independent operator (e.g. a Water Service Company or WaSCo).
However implications related to land ownership or land lease will remain, with further challenges
related to access and egress and any ‘buffer’ alongside service network pipes.
Such a network could be laid alongside a new surface water drainage network, which is necessary for
management of the surface water runoff in the area. A centralised system may also enable centralised
storage provisions for captured water before treatment as well as storage after treatment.
If a more centralised solution is selected, a detailed network model will need to be developed for
such a water reuse system. Such modelling will also help to identify the appropriateness of locations
for storage systems and the water reuse treatment systems. There may be opportunity to combine the
storage with any rainwater and stormwater storage systems, as well as any surface water attenuation
systems.
Figure E4 Communal water reuse system configuration
Issue | 9 June 2017
Page G10
E2.2 Cost Estimation Approach
The costs have been estimated using the following approach:
1. Capital cost of additional internal water and sanitary services, based on gross floor area using
the New Rules of Measurement (NRM)7 approach.
2. Capital cost of additional external water and sanitary services based on network flow capacity
and standard costing estimates
3. Capital cost of treatment system(s).
4. Professional fees.
5. Operational cost of treatment system.
The cost estimation does not estimated the value of external benefits, but may be considered in the
assessment exercise by Thames Water.
These external benefits include:
• Reduction in mains water supply cost (of benefit to end user).
• Reduced pumping cost of foul water (of benefit to Thames Water).
• Reduced infrastructure reinforcements and upgrades for mains, foul and storm systems (of
benefit to end user and Thames Water).
The land use in the Nine Elms on South Bank area was changing from low rise and light industrial to
high density and high rise residential and commercial developments. Once complete, the new
developments would have resulted in an eight fold increase in water demand and wastewater
discharge.
To enable all of the developments to take place, it required upgrades and reinforcements to meet this
growing demand. These were estimated at £13 million for potable water network and £16 million for
new stormwater system.
7 BCIS (2013) Elemental Standard Form of Cost Analysis, 4
th NRM Edition, BCIS, London
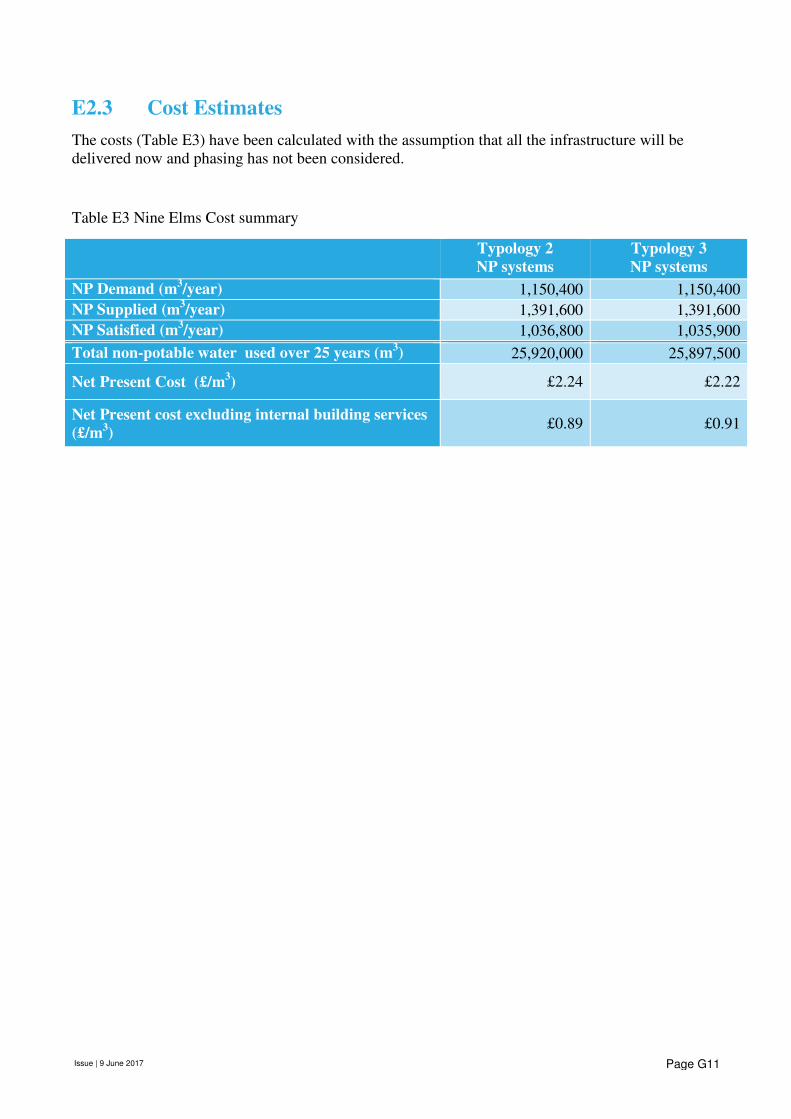
Issue | 9 June 2017
Page G11
E2.3 Cost Estimates
The costs (Table E3) have been calculated with the assumption that all the infrastructure will be
delivered now and phasing has not been considered.
Table E3 Nine Elms Cost summary
Typology 2
NP systems
Typology 3
NP systems
NP Demand (m3/year) 1,150,400 1,150,400
NP Supplied (m3/year) 1,391,600 1,391,600
NP Satisfied (m3/year) 1,036,800 1,035,900
Total non-potable water used over 25 years (m3) 25,920,000 25,897,500
Net Present Cost (£/m3) £2.24 £2.22
Net Present cost excluding internal building services
(£/m3)
£0.89 £0.91