wastewater reclamation for potable reuse -...
TRANSCRIPT

Volume 2: Integration of MBR Technology with Advanced
Treatment Processes
Graham Metcalf, Lingam Pillay, Cyprian Murutu, Sandile Chiburi,
Nhlanhla Gumede & Paul Gaydon
Wastewater Reclamation for Potable Reuse
TT 611/14


WASTEWATER RECLAMATION FOR POTABLE REUSE
VOLUME 2: INTEGRATION OF MBR TECHNOLOGY WITH ADVANCED
TREATMENT PROCESSES
Report to the Water Research Commission
by
Graham Metcalf1, Lingam Pillay2, Cyprian Murutu3, Sandile Chiburi1, Nhlanhla Gumede1 and Paul Gaydon4
1 Umgeni Water
2 Department of Process Engineering, University of Stellenbosch 3 Department of Chemical Engineering, Durban University of Technology
4 Royal Haskoning DHV
WRC Report No. TT 611/14
July 2014

Obtainable from:
Water Research Commission
Private Bag X3
Gezina, 0031
[email protected] or download from www.wrc.org.za
This report emanates from the Water Research Commission project K5/1894, entitled: Wastewater
Reclamation for Potable Reuse. Also available is Volume 1: Evaluation of membrane bioreactor
technology for pre-treatment (Report No. 1894/1/14).
DISCLAIMER
This report has been reviewed by the Water Research Commission (WRC) and approved for
publication. Approval does not signify that the contents necessarily reflect the views and policies of
the WRC, nor does mention of trade names or commercial products constitute endorsement or
recommendation for use.
ISBN 978-1-4312-0566-0 Printed in the Republic of South Africa
© Water Research Commission

i
EXECUTIVE SUMMARY ______________________________________________________________________________________
Background and Motivation
There are a range of technologies and combinations of treatment technologies that can be used to reclaim
water from domestic wastewater effluent. The choice of treatment train that will meet quality, cost and
operational requirements is thus a difficult one. The intention of this research project is to test a range of
treatment technologies in different combinations and to establish a preferred reclamation treatment process
train for the Darvill Wastewater Works (WWW) in KwaZulu-Natal. The product water quality derived from the
reclamation process should meet both South African and international drinking water standards. Reclamation
is being considered by Umgeni Water, the regional water utility, as an option to meet growing water
demands within its supply area. Although indirect potable reuse (IPR) projects are widespread, direct potable
reuse (DPR) is still only practiced in two places in the world, both in southern Africa. It is envisaged that the
results from this study will provide evidence and affirmation that the highest quality drinking water can be
produced regardless of the quality of the source water.
Objective
The objective of this research project is to consistently produce acceptable potable drinking water through
wastewater reclamation. The project is divided into two phases as follows:
- Phase 1: Bench-scale evaluation of advanced water treatment technologies for the production of potable
water using the following technologies: ozone (O3), granular activated carbon (GAC), nanofiltration (NF) /
reverse osmosis (RO), and advanced oxidation (hydrogen peroxide & ultra-violet (UV) radiation).
- Phase 2: Recommend a wastewater reclamation treatment train for the design of a full scale reclamation
plant at Darvill WWW and provide a capital and operating cost estimate.
Methodology
Volume 1 of this research reports on an assessment of MBR technologies as a pre-treatment step in
wastewater reclamation. MBR pilot plants from different manufacturers were rented and set up onsite at the
Darvill WWW. The Toray MBR demonstration plant proved to be the most reliable and easy to operate of the
pilot plants evaluated and was therefore selected to be used for all the water reclamation plant pilot trials
carried out in this second stage. Bench-scale advanced water treatment unit processes were set up adjacent
to the MBR pilot plant facility in the downstairs Darvill WWW laboratory. The MBR permeate was used to
supply these unit processes with a constant feed. Various combinations of advanced water treatment
technologies were trialled in continuous and batch tests. Routine water quality samples were taken on a daily
basis, from the feed, from the final product water and from individual unit processes, and analysed. The
various treatment trains were spiked with a number of micro-organics to determine the percentage removal
of these potentially harmful endocrine disrupting compounds. Water quality samples taken were sent to the
University of the Western Cape for analysis using the Enzyme Linked Immunosorbent Assay (ELISA)
technique.

ii
Summary of Results
The primary objective of this study was to determine the efficacy of various treatment trains and individual
unit processes in meeting set water quality objectives, including the removal of CECs (endocrine disruptors,
pharmaceuticals, and personal care products), for the production of potable water. Four treatment trains
were tested in this project, namely:
- Process A: MBR-RO-UV
- Process B: MBR-O3/GAC-NF-UV
- Process C: MBR-NF-O3/GAC-UV
- Process D: MBR-NF-UV
- Process E: MBR-O3/GAC-UF-UV
Process E was not initially included in this study and has not been tested sufficiently. However, it has
subsequently been tested, based on these initial research findings. A number of different membranes were
used in this study; these included six NF membranes and four RO membranes. The six NF membranes were
NF 90, NF 270, SR 90, ESNA-LF2, Nano-SW and UTC-60. The four RO membranes were UTC70B,
UTC70UB, LFC3 and XLE. All four treatment trains performed equally well in terms of the final potable water
quality produced. Although there were minor differences in product water quality between the processes, all
four are compliant with the SANS 241 (2011) drinking water standard. The experimental results suggest that
streamlined process trains such as MBR-RO-UV (replicating the Singapore process) or MBR-NF-UV are
equally effective as treatment trains with additional processes such as ozonation and GAC (MBR-O3/GAC-
NF-UV).
Process A: MBR-RO-UV, the membrane-based process, would require less capital investment than process
B: MBR-O3/GAC-NF-UV, the ozone/GAC-based treatment process, based on the cost estimate. The
difference in capital cost is, however, marginal at this level of accuracy. The operating cost for process A is
also marginally lower.
The disadvantage of the membrane-based (NF/RO) process trains is the additional cost of brine disposal. In
coastal environments disposing of the brine to sea is most likely to be a feasible and cost effective option as
the concentrate has a far lower TDS concentration (3,700 mg/l) than the sea (35,000 mg/l). MBR-RO-UV and
MBR-NF-UV are thus recommended reclamation processes for coastal environments. Membrane-based
process trains (NF/RO) are not feasible inland because of the cost of treating and disposing of the brine.
O3/GAC-based treatment trains are therefore recommended for inland reclamation schemes. The NF
membrane used in processes B & C will have to be replaced by a UF membrane to avoid the brine disposal
problem. As the MBR-O3/GAC-UF-UV (process E) was not part of the original scope of work, only limited
results have been obtained for this train. The process is, however, very similar to the Goreangab reclamation
plant and therefore we are confident that this train has potential and should be investigated further. The
Goreangab plant does not have an advanced oxidation process (UV/H2O2), so the proposed process E

iii
treatment train has an additional barrier. The replacement of the RO and NF membrane with a UF
membrane will reduce the cost significantly. Although UF does not remove micro-organic substances there
are three barriers, namely ozonation, GAC and advanced oxidation processes (AOP) that provide this
protection.
It is thus proposed that further trials be conducted to test the performance of this proposed treatment train. If
reclamation is to be considered feasible at Darvill and other wastewater works in the interior an alternative
treatment train such as MBR-O3/GAC-UF-UV will have to be considered.
Conclusions and Recommendations
All the process trains proposed and tested recorded zero values for E.Coli and coliphages in the final product
water, throughout the trials. The level of trace organics was also consistently reduced by greater than 96%
for the range of contaminants tested. Although the multiple-barrier approach is universally supported, the
more streamlined MBR-RO-AOP (UV/H2O2) process was demonstrated to be highly effective at achieving
the goal of delivering safe drinking water consistently, throughout the course of this research. Membrane-
based treatments coupled with advanced oxidation offer numerous advantages over more conventional
multiple-barrier reclamation schemes.
Wastewater influent is often of variable quality and membrane-based process trains are reliable in delivering
high quality water, enhanced process stability and ease of continuous quality monitoring. Membrane-based
schemes also offer flexibility in relation to changing water quality demands, which can be dealt with by future
technological upgrades. Supporting the MBR-RO-AOP process with other associated best practices is
fundamental to creating a successful reclamation scheme. Managing the quality of the raw water influent,
continuous monitoring and engineered buffering are but a few of the additional measures that can be
implemented. The MBR-RO-AOP (UV/H2O2) process train is recommended for reclamation schemes where
brine disposal can be managed cost effectively. The alternative process, MBR-O3/GAC-UF-UV, is
recommended for scenarios such as inland wastewater works, where brine treatment and disposal is not an
option, or not economically feasible.
Finally, Umgeni Water has proposed that a pilot scale reclamation plant be constructed at Darvill WWW
based on the outcomes of this research. The benefits of this reclamation pilot plant will be numerous, both
from a technical and social perspective. It is hoped that the reclamation pilot plant will be considered an ideal
facility for the education of stakeholders and the public at large on the benefits of potable reuse. Visitors will
be encouraged to drink reclaimed water, hence breaking down any preconceived notions of the quality of
used water.

iv
ACKNOWLEDGEMENTS ______________________________________________________________________________________
This project was funded by the Water Research Commission and Umgeni Water.
The project team wishes to thank the following people for their contributions to the project. First, the
guidance and input of the WRC reference group is acknowledged with special reference to Dr Jo Burgess.
Reference Group Affiliation
Dr N Kalebaila WRC (Chairperson)
Dr JE Burgess WRC (former Chairperson)
Prof. GA Ekama University of Cape Town
Mrs SD Freese Water Science CC
Mr S Gillham Umgeni Water
Prof CA Buckley University of KwaZulu-Natal
Mr DJ Nozaic D Nozaic Consultancy
Prof J Haarhoff University of Johannesburg
Mr N Macleod Ethekwini Municipality
Dr BM Brouckaert University of KwaZulu-Natal
Mr BF van der Merwe EMVESEC
Dr A van Niekerk Golder & Associates
Ms L Seele University of KwaZulu-Natal
Mr R Dyer Ethekwini Municipality
Mr C Swartz Chris Swart Water Utilization Engineers
In addition, the support and contributions of the following people are gratefully acknowledged:
Mr S Gillham GM Engineering & Scientific Services
Prof L Pillay Durban University of Technology (DUT)
Mr C Murutu DUT
Mr P Thompson Umgeni Water
Mr R Rajagopaul Umgeni Water
Mr N Toolsee Umgeni Water
Mr P Gaydon Stewart Scott Inc.
Mrs D Trollip Umgeni Water

v
Ms M Murigwathoho Umgeni Water
Mr S Terry Umgeni Water
Mr S Mdunge Umgeni Water
Mr J Rambau Umgeni Water
Dr T Manikum Umgeni Water
Mr S Mngadi Umgeni Water
Ms N Mbambo Operating Technician, DUT
Mr L Mkhwanazi Operating Technician, DUT
Mr S Chiburi Operating Technician, DUT
Mr N Gumede Operating Technician, DUT
Special thanks also go to Mr N Gumede, Mr S Chiburi, Mr L Mkhwanazi, and Ms N Mbambo for operating the
plants, taking samples and generally doing more than asked to keep the plants running.
Umgeni Water Process Services under the leadership of Mr P Thompson provided all the necessary support
and process expertise. Messrs Rajagopaul and Toolsee are gratefully acknowledged for their design of the
ozonation and GAC plants, and Mrs Trollip for all her assistance.
All the Umgeni Water Laboratory Services Management and staff members who were involved in the
analysis of the samples for the project are thanked for accommodating the extra work load so graciously.
Darvill Wastewater Works operations staff is thanked for their patience and invaluable assistance in solving
problems and always being willing to help.
This project would not have been possible without the contributions of various technology suppliers who
went out of their way to provide assistance wherever possible. Special reference must go the MBR suppliers
CHEMIMPO (Toray) and Pentair (Norit) represented by Mr J Naidoo and Mr T Moodley respectively. Mr P
Groszmann (Toray) and Mr E Scharenborg (Norit) are also thanked for their invaluable and on-going
assistance throughout the project. A number of membrane suppliers are thanked for providing a wide variety
of membranes and these included DOW, Inge, Hydranautics and Toray. Koch Membrane Systems are
thanked for the MBR design simulation they undertook.
Finally, last but not least, to my co-authors and especially Prof L Pillay and Mr C Murutu for their tireless
enthusiasm and hard work and whose commitment to the project never waned.

vi
CONTENTS
EXECUTIVE SUMMARY ..................................................................................................................................... i
ACKNOWLEDGEMENTS ................................................................................................................................. iv
CONTENTS ....................................................................................................................................................... vi
LIST OF FIGURES ............................................................................................................................................. x
LIST OF TABLES ............................................................................................................................................. xii
ACRONYMS, ABBREVIATIONS AND SYMBOLS ........................................................................................ xiii
CHAPTER 1: BACKGROUND ....................................................................................................................... 1
1.1 INTRODUCTION .................................................................................................................................... 1 1.2 APPROACH ............................................................................................................................................ 2 1.3 CONTAMINANTS OF EMERGING CONCERN ..................................................................................... 3 1.4 ADVANCED WATER TREATMENT TECHNOLOGIES ......................................................................... 2
1.4.1 Membrane Bioreactors .............................................................................................................. 2 1.4.2 Ozonation .................................................................................................................................. 2 1.4.3 Granular Activated Carbon ....................................................................................................... 4 1.4.4 Nanofiltration and Reverse Osmosis ........................................................................................ 5 1.4.5 Advanced Oxidation Processes ................................................................................................ 6 1.4.6 Chlorination ............................................................................................................................... 8
1.5 WATER RECLAMATION PROCESS CONFIGURATIONS: CASE STUDIES ....................................... 8 1.5.1 New Goreangab Reclamation Plant ......................................................................................... 8 1.5.2 Orange County Water District ................................................................................................... 9 1.5.3 Singapore NEWater Project .................................................................................................... 10 1.5.4 Western Corridor Recycling Water Project ............................................................................. 10 1.5.5 Beaufort West Reclamation Plant ........................................................................................... 11 1.5.6 eThekwini Municipality Wastewater Reclamation ................................................................... 12 1.5.7 Other Wastewater Reclamation Schemes .............................................................................. 12
1.6 EMERGING WATER RECLAMATION PROCESS CONFIGURATIONS ............................................. 13 1.6.1 MBR-RO Systems ................................................................................................................... 13
1.6.1.1 Toronto MBR-RO ................................................................................................... 13 1.6.1.2 NEWater MBR-RO ................................................................................................ 13
1.6.2 Nanofiltration ........................................................................................................................... 14 1.6.2.1 Nanofiltration and Ultra-Low Pressure Reverse Osmosis ..................................... 15
1.7 PRODUCT WATER QUALITY OBJECTIVES ...................................................................................... 15 1.7.1 SANS 241 ............................................................................................................................... 15 1.7.2 USEPA Regulations ................................................................................................................ 16 1.7.3 Australian Guidelines .............................................................................................................. 17
1.8 SUMMARY ............................................................................................................................................ 17
CHAPTER 2: WATER RECLAMATION PLANT PILOT TRIALS ................................................................ 18
2.1 INTRODUCTION .................................................................................................................................. 18 2.2 TARGET TRACE ORGANIC CONTAMINANTS .................................................................................. 18

vii
2.3 DESCRIPTION OF SELECTED WATER RECLAMATION UNIT PROCESSES ................................. 19 2.4 MEMBRANE BIOREACTOR SYSTEM ................................................................................................ 19 2.5 THE MBR-OZONE/GAC TREATMENT SYSTEM ................................................................................ 19
2.5.1 Description of the MBR-Ozone/GAC System ......................................................................... 19 2.5.2 Experimental Methodology ..................................................................................................... 22
2.5.2.1 Ozonation .............................................................................................................. 22 2.5.2.2 Granular Activated Carbon filtration ...................................................................... 22
2.6 THE MBR-O3/GAC-NF/RO-UV TREATMENT SYSTEM ...................................................................... 23 2.6.1 Membrane Modules and Properties ........................................................................................ 23 2.6.2 Experimental Methodology ..................................................................................................... 25
2.6.2.1 Cross-Flow Experiments ....................................................................................... 25 2.6.2.2 Continuous Flow Experiments ............................................................................... 27
2.7 THE MBR-RO-UV/H2O2 TREATMENT SYSTEM ................................................................................. 28 2.7.1 Description of the UV/H2O2 Unit .............................................................................................. 28 2.7.2 Experimental Methodology ..................................................................................................... 29
2.8 SAMPLING AND SAMPLE PREPARATION ........................................................................................ 30 Sampling ............................................................................................................................................... 30 2.8.1 EDCs – Preparation of the Stock Standard ............................................................................ 30
2.8.1.1 EDC Stock Standard (20 mg/l) .............................................................................. 30 2.8.1.2 EDC Intermediate Standard (20,000 ng/l) ............................................................. 31 2.8.1.3 EDC Spiking Standard ........................................................................................... 31
2.8.2 Analytical Method for Assay: ELISA ....................................................................................... 31 2.8.3 Liquid Chromatography – Organic Carbon Detection (LC-OCD) ........................................... 31
CHAPTER 3: RESULTS AND DISCUSSION .............................................................................................. 32
3.1 INTRODUCTION .................................................................................................................................. 32 3.2 PERFORMANCE OF THE MBR-OZONE/GAC TREATMENT SYSTEM ............................................. 32
3.2.1 Water Quality Results ............................................................................................................. 32 3.2.2 Ammonia (NH3) and Nitrate (NO3) .......................................................................................... 35 3.2.3 Soluble Reactive Phosphate and Total Phosphate ................................................................ 36 3.2.4 Total Organic Carbon .............................................................................................................. 36 3.2.5 UV254 ....................................................................................................................................... 36 3.2.6 Conductivity ............................................................................................................................. 36 3.2.7 Microbial Content .................................................................................................................... 36 3.2.8 Turbidity .................................................................................................................................. 37 3.2.9 Summary ................................................................................................................................. 37
3.3 PERFORMANCE OF THE MBR-O3/GAC-NF1, 2, 3, 4, 5 & 6 FLAT SHEET SYSTEM ....................... 38 3.3.1 Water Quality Results ............................................................................................................. 38 3.3.2 Solute Rejection ...................................................................................................................... 42 3.3.3 Organic Matter Rejection ........................................................................................................ 44 3.3.4 Microbial Content .................................................................................................................... 45 3.3.5 Turbidity .................................................................................................................................. 45 3.3.6 Optimal Operating Pressure for ESNA-LF2 and NF 90 .......................................................... 45 3.3.7 Summary ................................................................................................................................. 47
3.4 PERFORMANCE OF THE MBR-O3/GAC-NF SPIRAL WOUND TREATMENT SYSTEM .................. 47 3.4.1 Water Quality Results ............................................................................................................. 47 3.4.2 Solute Rejection ...................................................................................................................... 47 3.4.3 Microbial Content .................................................................................................................... 48 3.4.4 Turbidity .................................................................................................................................. 48 3.4.5 Summary ................................................................................................................................. 49

viii
3.5 PERFORMANCE OF THE MBR-RO FLAT SHEET SYSTEM ............................................................. 49 3.5.1 Water Quality Results ............................................................................................................. 49 3.5.2 Solute Rejection ...................................................................................................................... 52 3.5.3 Organic Matter Rejection ........................................................................................................ 53 3.5.4 Microbial Content .................................................................................................................... 54 3.5.5 Turbidity .................................................................................................................................. 54 3.5.6 Summary ................................................................................................................................. 54
3.6 PERFORMANCE OF THE MBR–RO SPIRAL WOUND TREATMENT SYSTEM ............................... 55 3.6.1 Water Quality Results ............................................................................................................. 55 3.6.2 Solute Rejection ...................................................................................................................... 55 3.6.3 Microbial Content .................................................................................................................... 56 3.6.4 Turbidity .................................................................................................................................. 56 3.6.5 Summary ................................................................................................................................. 56
3.7 THE MBR-RO-UV SPIRAL WOUND WATER QUALITY RESULTS .................................................... 56 3.7.1 UV/H2O2 Test Trial 1 ............................................................................................................... 57 3.7.2 UV/H2O2 Test Trial 2 ............................................................................................................... 57 3.7.3 UV/H2O2 Test Trial 3 (After adding 0.3 mg/l H2O2) ................................................................. 57 3.7.4 UV/H2O2 Test Trial 4 (After adding 0.6 mg/l H2O2) .................................................................. 57 3.7.5 LC-OCD Analyses ................................................................................................................... 59
3.8 ALTERNATIVE PROCESS TRAIN ....................................................................................................... 59 3.8.1 Solute Rejection ...................................................................................................................... 60 3.8.2 Turbidity .................................................................................................................................. 61 3.8.3 UV254 ....................................................................................................................................... 61 3.8.4 Microbial Content .................................................................................................................... 61 3.8.5 Summary ................................................................................................................................. 61
3.9 EDC REMOVAL RESULTS .................................................................................................................. 62 3.9.1 Steroid Hormones ................................................................................................................... 62
3.10 ANTIBIOTICS ....................................................................................................................................... 64 3.11 EDC SPIKING ....................................................................................................................................... 65 3.12 REMOVAL OF TRACE ORGANICS BY ADVANCED OXIDATION ..................................................... 67 3.13 SUMMARY ............................................................................................................................................ 70
CHAPTER 4: CONSIDERATIONS FOR WATER RECLAMATION PLANT DESIGN ................................ 71
4.1 BASIS OF DESIGN ............................................................................................................................... 71 4.2 OTHER CONSIDERATIONS ................................................................................................................ 74 4.3 UNIT TREATMENT PROCESS SIZING ............................................................................................... 74
4.3.1 Process A: MBR-RO-AOP (H2O2/UV) ..................................................................................... 74 4.3.1.1 Membrane Bioreactor ............................................................................................ 74 4.3.1.2 Reverse Osmosis .................................................................................................. 75 4.3.1.3 Advanced Oxidation Process (UV/H2O2) ............................................................... 76
4.3.2 Process B: MBR-O3/GAC-NF-AOP (H2O2/UV) ....................................................................... 76 4.3.2.1 Ozonation .............................................................................................................. 76 4.3.2.2 Granular Activated Carbon .................................................................................... 76 4.3.2.3 Nanofiltration ......................................................................................................... 77
4.4 CAPITAL AND OPERATING COST ESTIMATE .................................................................................. 77 4.5 OPERATION AND MAINTENANCE COSTS ....................................................................................... 80 4.6 SUMMARY ............................................................................................................................................ 81
CHAPTER 5: CONCLUSION ....................................................................................................................... 82

ix
5.1 GENERAL CONCLUSIONS ................................................................................................................. 82 5.2 RECOMMENDATIONS FOR FUTURE RESEARCH ........................................................................... 83
REFERENCES ................................................................................................................................................. 84
ANNEXURES ................................................................................................................................................... 87
Annexure B-A .................................................................................................................................................. 87
Annexure B-B .................................................................................................................................................. 90
Annexure B-C .................................................................................................................................................. 93
Annexure B-D ................................................................................................................................................ 100
Annexure B-E ................................................................................................................................................ 101
Annexure B-F ................................................................................................................................................ 102
Annexure B-G ................................................................................................................................................ 105

x
LIST OF FIGURES
Figure 1.1: NEWater Pilot TOC comparison.................................................................................................... 14
Figure 1.2: Alternative Advanced Treatment Flow Diagram with Trace Organics Removal ........................... 15
Figure 2.1: Holding Tanks ............................................................................................................................... 20
Figure 2.2: Ozone Generator ........................................................................................................................... 20
Figure 2.3: Ozone Contact Column ................................................................................................................. 20
Figure 2.4: GAC Packed Columns .................................................................................................................. 21
Figure 2.5: Ozonation Schematic .................................................................................................................... 22
Figure 2.6: Granular Activated Carbon Filtration Schematic ........................................................................... 23
Figure 2.7: Schematic of Laboratory-scale Membrane Unit ............................................................................ 25
Figure 2.8: Membrane Test Unit ...................................................................................................................... 26
Figure 2.9: uPVC Membrane Module .............................................................................................................. 26
Figure 2.10: RO Membrane Test Rigs Operating in Parallel ........................................................................... 27
Figure 2.11: Schematic Depiction of the Pilot UV Unit .................................................................................... 29
Figure 2.12: UV Pilot Unit showing: Recirculation Feed Tank, UV Lamps (x10) and Pump ........................... 29
Figure 3.1: MBR Permeate (May–Nov 2012) .................................................................................................. 34
Figure 3.2: Ozonation Permeate (May–Nov 2012) .......................................................................................... 35
Figure 3.3: GAC Permeate (May–Nov 2012) .................................................................................................. 35
Figure 3.4: NF Flat Sheet Permeability (lmh/bar) ............................................................................................ 38
Figure 3.5: TDS v Time Plots for the NF Membranes ..................................................................................... 42
Figure 3.6: Nitrates Rejection by the NF Membranes ..................................................................................... 43
Figure 3.7: Average Conductivity Rejection by the NF Membranes ............................................................... 43
Figure 3.8: Alkalinity Levels in Product Water ................................................................................................. 44
Figure 3.9: UV Absorbance ............................................................................................................................. 44
Figure 3.10: Average TOC Levels ................................................................................................................... 45
Figure 3.11: Effect of Operating Pressure on ESNA1 LF2 Permeate Flux ..................................................... 46
Figure 3.12: Effect of Operating Pressure on NF 90 Permeate Flux .............................................................. 46
Figure 3.13: MBR-O3/GAC-NF (SR 90) Permeate Water Quality ................................................................... 48
Figure 3.14: MBR-O3/GAC-NF (Spiral Wound) Permeate Water Quality ........................................................ 48
Figure 3.15: Average Alkalinity Levels in Product Water ................................................................................ 52
Figure 3.16: Average Nitrate Levels in Product Water .................................................................................... 52
Figure 3.17: Average SRP and TP Levels in Product Water ........................................................................... 53
Figure 3.18: Average Conductivity Rejection by the RO Membranes ............................................................. 53
Figure 3.19: Average TOC Levels in the Product Water ................................................................................. 54

xi
Figure 3.20: MBR-O3/GAC-RO (Spiral Wound) Permeate Water Quality ....................................................... 55
Figure 3.21: MBR-O3/GAC-RO (Spiral Wound) Permeate Water Quality ....................................................... 56
Figure 3.22: UV Disinfection without H2O2 Addition (Trial 2) ........................................................................... 58
Figure 3.23: UV Disinfection with 0.6 mg/l H2O2 Added (Trial 4) .................................................................... 58
Figure 3.24: MBR-NF-O3/GAC Permeate Water Quality ................................................................................ 60
Figure 3.25: MBR-NF-O3/GAC Permeate Water Quality ................................................................................ 61
Figure 3.26: Advanced Treatment – EDC (Steroid Hormones) Removal Percentage .................................... 62
Figure 3.27: Advanced Treatment – EDC (Antibiotics) Removal Percentage................................................. 64
Figure 3.28: EDC (200 ng/l) Spiking – Removal Percentage .......................................................................... 65
Figure 3.29: EDC (1,000 ng/l) Spiking – Removal Percentage ....................................................................... 66
Figure 3.30: Removal of EDCs (10 µg/l) by Advanced Oxidation ................................................................... 68
Figure 3.31: Removal of EDCs (150 µg/l) by Advanced Oxidation ................................................................. 68
Figure 3.32: Removal of EDCs (2,000 µg/l) by Advanced Oxidation .............................................................. 69

xii
LIST OF TABLES
Table 1.1: Indicative Removal of Organic Chemicals ........................................................................................ 1
Table 1.2: Performance of NF and RO Membranes .......................................................................................... 6
Table 1.3: Medium Pressure UV AOP Pilot Removal Percentages .................................................................. 7
Table 1.4: Process Configuration for New Goreangab Reclamation Plant ....................................................... 8
Table 1.5: Monthly Average Water Quality Data of OWCD Product Water .................................................... 10
Table 1.6: Design & Actual Operating Parameters. Singapore NEWater Project. (Aug 2000) ....................... 10
Table 1.7: Chemical Compounds in Purified Recycled Water; Western Corridor Recycling Water Project. .. 11
Table 1.8: Summary of Beaufort West Reclamation Plant Final Water Quality Results ................................. 11
Table 1.9: Identified Treatment Barriers for Direct Reuse Treatment Technologies ....................................... 12
Table 1.10: Comparative Performance of Selected Reuse Schemes ............................................................. 12
Table 1.11: Comparison of Quality of NEWater MBR Product and MF Permeate .......................................... 13
Table 1.12: Product Water Quality Objectives ................................................................................................ 16
Table 1.13: Total Organic Carbon Removal Goals (USEPA) .......................................................................... 16
Table 1.14: Australian Drinking Water Guidelines ........................................................................................... 17
Table 2.1: NF Flat Sheet Membrane Characteristics ...................................................................................... 24
Table 2.2: RO Flat Sheet Membrane Characteristics ...................................................................................... 24
Table 2.3: Feed Water Quality from MBR-RO Treatment Train ...................................................................... 28
Table 2.4: Preparation of 20 mg/l EDC Stock Standard .................................................................................. 30
Table 2.5: Preparation of the EDC Spiking Standard ...................................................................................... 31
Table 3.1: Summary of MBR-Ozone /GAC Water Quality Results ................................................................. 33
Table 3.2: NF Flat Sheet Permeability ............................................................................................................. 39
Table 3.3: NF Flat Sheet Membrane Flux Rate Change ................................................................................. 39
Table 3.4: NF Summarised Permeate Water Quality Results ......................................................................... 40
Table 3.5: NF Summarised Permeate Water Quality Results ......................................................................... 41
Table 3.6: Summary of RO Permeate Water Quality Results ......................................................................... 50
Table 3.7: Summary of RO Permeate Water Quality Results ......................................................................... 51
Table 3.8: Advanced Treatment – EDC (Steroid Hormones) Removal Percentage ....................................... 63
Table 3.9: Advanced Oxidation – EDC (Steroid Hormone) Removal .............................................................. 67
Table 4.1: Treatment Barriers .......................................................................................................................... 73
Table 4.2: Capital Cost Estimate for Membrane Treatment (Process A) ........................................................ 78
Table 4.3: Capital Cost Estimate for Ozone /GAC Treatment (Process B) ..................................................... 79
Table 4.4: Operation and Maintenance Cost for MBR-RO-UV........................................................................ 80
Table 4.5: Operation and Maintenance Cost for MBR-O3/GAC-NF-UV .......................................................... 80

xiii
ACRONYMS, ABBREVIATIONS AND SYMBOLS
AOC
AOP
ASP
Assimilable Organic Carbon
Advanced Oxidation Process
Activated Sludge Process
ASTs Activated Sludge Tanks
BAC Biological Activated Carbon
BOD Biochemical Oxygen Demand
CAS Conventional Activated Sludge
CEC
CFC
Contaminants of Emerging Concern
Coagulation/Flocculation/Clarification
CFU Colony Forming Unit
CIP Cleaning in Place
COD Chemical Oxygen Demand
DAF Dissolved Air Flotation
DBP Disinfection By-products
DO Dissolved Oxygen
DOC Dissolved Organic Carbon
DPR Direct Potable Reuse
EBCT Empty Bed Contact Time
EDC Endocrine Disrupting Compound
ELISA Enzyme Linked Immunosorbent Assay
F:M Ratio Food to Mass Ratio
FS Flat Sheet
GAC Granular Activated Carbon
H2O2
HDPE
Hydrogen Peroxide
High Density Polyethylene
HF Hollow Fibre
HRT Hydraulic Retention Time
IPR Indirect Potable Reuse
LC-OCD
LMH
Liquid Chromatography–Organic Carbon Detection
Litres per square metre per hour
LRV Log Removal Value
MBR Membrane Bioreactor
MF Microfiltration
MLSS Mixed Liquor Suspended Solids
MWCO Molecular Weight Cut-off
NDMA Nitrosodimethylamine
NF Nanofiltration

xiv
NGRP New Goreangab Reclamation Plant
NH3
NH4-N
Ammonia
Ammonium-N
NO3
NOM
Nitrate
Natural Organic Matter
NTU Nephelometric Turbidity Units
O&M Operation and Maintenance
O3 Ozone
OCWD Orange County Water District
PFU Plaque Forming Unit
PLC Programmable Logic Control
PPCPs Pharmaceuticals and Personal Care Products
PVDF Polyvinylidene Fluoride
RAS Return Activated Sludge
RO Reverse Osmosis
SADm Specific aeration demand based on membrane area
SADp Specific aeration demand based on permeate volume
SCADA Supervisory Control and Data Acquisition
SDI
SRP
Silt Density Index
Soluble Reactive Phosphorous
SRT Solids Retention Time
TDS
THMs
Total Dissolved Solids
Trihalomethanes
TKN Total Kjeldahl Nitrogen
TMP Trans Membrane Pressure
TOC Total Organic Carbon
TP Total Phosphorous
TSS Total Suspended Solids
UF Ultrafiltration
USEPA United States Environmental Protection Agency
UV Ultra Violet
UWC
WHO
WRC
University of the Western Cape
World Health Organisation
Water Research Commission
WWW Wastewater Works

1
CHAPTER 1: BACKGROUND
1.1 INTRODUCTION
Direct potable reuse (DPR) normally requires a higher level of treatment than traditional surface or
groundwater sources because of the nature of the source water. By its very nature, wastewater, e.g.
domestic sewage, contains contaminants that occur at far higher concentrations than one would expect to
find in traditional water sources. Groundwater, for example, can be of such a good quality that it can be
consumed without treatment, as is the case in many places in the world. The diversity of contaminants in
wastewater is of concern to water service providers and public health authorities. A wide variety of potentially
harmful pollutants may be present in wastewater influent streams. More recently, awareness of the risks
associated with the drinking of wastewater has been magnified by ever increasing evidence of the presence
of potentially harmful organic contaminates. Public safety is of paramount importance in the design of
drinking water systems for the treatment of wastewater. To this end, advanced water treatment systems
have been developed to deal with the removal of harmful substances and ensure safe drinking water. The
literature review in this section focuses on some of the contaminants that must be removed when planning a
DPR system and also on the type of treatment technologies that can be effective in achieving the objective of
safe potable drinking water.
It is, however, important to consider that all water discharged to surface and groundwater, from point and
non-point sources, is basically a form of Indirect Potable Reuse (IPR). In recent surveys of surface and
groundwater quality by the US Geological Survey (Barnes et al., 2008), it was concluded that essentially all
surface and groundwater is contaminated with chemicals commonly associated with wastewater, such as
pharmaceuticals. In the future, it is anticipated that surface and groundwater discharges will need to comply
with much more stringent discharge requirements, to protect the environment. The level of treatment needed
to protect environmental species and ecosystems may, in some cases, be higher than that needed for DPR.
Thus, the implementation of DPR may make more sense environmentally than the discharge of purified
water to the aquatic environment (Leverenz et al., 2011).
The objective of this research project is to consistently produce acceptable, potable drinking water through
wastewater reclamation. The project is divided into two phases as follows:
- Phase 1: Bench-scale evaluation of advanced water treatment technologies for the production of potable
water using the following technologies: ozone (O3), granular activated carbon (GAC), nanofiltration
(NF)/reverse osmosis (RO) and advanced oxidation processes (AOP): hydrogen and ultra-violet (UV)
radiation.
- Phase 2: Recommend a wastewater reclamation treatment train for the design of a full scale reclamation
plant at Darvill wastewater works, and provide a capital and operating cost estimate.
Volume 1 of this research reports on an assessment of MBR technologies as a pre-treatment step in
wastewater reclamation. Three MBR pilot plants, from different manufacturers, were rented and set up onsite

2
at the Darvill WWW The performance of the Toray and Norit MBR systems was evaluated. The permeate
water quality produced by the pilot plant MBRs was of a high quality and met the target water quality
objectives, with a few exceptions; for example the target level of removing nitrate to below 6 mg/l could not
always be achieved. There were a number of reasons for this but over aeration of the anoxic zone was
considered to be a major contributor to poor denitrification. The treatment shortcomings of the MBR pilot
plants were not considered critical in terms of the desired effluent water quality. Those constituents such as
chemical oxygen demand (COD), total organic carbon (TOC) and turbidity that could potentially impact on
membrane fouling were removed to a sufficient extent. The MBR process shortcomings were also
considered to be related to scale and would be overcome on full scale plants. The performance of a range of
MBRs, by different manufacturers, used on pilot plants and full scale plants around the world confirmed the
quality of MBR permeates. The researchers were thus satisfied that the MBR permeate being produced from
the pilot MBR plants at Darvill would be suitable for Stage 2 of the study. It was decided to continue into the
second stage of the research maintaining the Toray pilot plant as the feed for the laboratory scale
experiments. Stage 2 laboratory scale pilot trials used the following advanced treatment technologies:
• Ozonation
• Granular activated carbon
• Nanofiltration
• Reverse osmosis
• Advanced oxidation processes.
1.2 APPROACH
Combinations of the above treatment technologies were tested in various treatment trains to ascertain if they
could consistently produce potable water and to determine if there was any difference in the quality of water
produced. A brief summary of the work undertaken in this project is as follows:
1. Proof of MBR concept: July 2010 through to June 2011 (reported in volume 1: report number
1894/1/14);
2. Laboratory scale trials of ozone/granular activated carbon (O3/GAC) and membranes as a batch
process: June 2011 through to June 2012 (High performance NF and RO membranes selected for
continuous trials); (current report);
3. Continuous flow spiral wound membrane (NF and RO) trials June 2012 through to September 2012;
(including studies of endocrine disrupting compounds (EDCs)); (current report);
4. Alternative treatment train (MBR-NF-O3/GAC-UV) trials: October 2012 through to March 2013; (current
report).
The performance of the selected treatment trains was assessed in terms of the target water quality
objectives. EDCs were sampled and analysed for each of the selected treatment trains and the individual
unit processes during this period.
3
1.3 CONTAMINANTS OF EMERGING CONCERN
Contaminants of Emerging Concern (CECs) are a broad classification for pharmaceuticals and EDCs, which
are subclasses of organic contaminants that have been detected in wastewater and surface waters
throughout the world (Benotti et al., 2009, Snyder & Benotti, 2010, Kumar & Xagoraraki, 2010). Their
occurrence is most often a result of municipal wastewater discharge, as these compounds are not
completely removed during treatment. Other sources of CECs in water include runoff from agricultural fields
and feedlots, landfill leachates, and urban runoff. Water authorities, scientists, public health organisations
and civil society are concerned about what level of risk may be associated with the presence of CECs in
drinking water, as many drinking water treatment plants use source water impacted by wastewater (US
Bureau of Reclamation, 2009). In fact CECs can occur in finished drinking water in greater numbers
(categories) than in the surface water sources (Kumar & Xagoraraki, 2010). While some researchers have
postulated that the long-term risk to humans from any single pharmaceutical at sub-μg/l levels is negligible, it
is not clear what toxicological implications chronic exposure to suites of trace contaminants may pose
(Snyder et al., 2003).
The ability of a particular treatment process to remove organic contaminants depends mostly on the
structure and concentration of the contaminant. Chemical oxidation (during drinking water applications),
biological removal/transformation (during wastewater applications), or NF/RO are the water treatment
technologies most responsible for CEC removal; the operational parameters of the process (e.g. oxidant
dose and contact time) will determine the degree of attenuation of a particular contaminant (Snyder &
Benotti, 2010). Table 1.1 shows the relative performance of water and wastewater treatment technologies in
removing various categories of CECs. RO membranes, for example, can remove more than 95% of most
organics compounds. Nitrosodimethylamine (NDMA), with a molecular weight of 74, is among the organic
chemicals with a low level of removal (25-50%) by RO. The technologies listed in table 1.1 are sometimes
known as tertiary treatment or advanced water treatment technologies, which sets them apart from
conventional treatment technologies such as coagulation/flocculation, sedimentation, sand filtration,
activated sludge and clarification. These advanced technologies are becoming more widely used, as more
sophisticated treatment options are required to deal with a degradation in source water quality. The
performance of these advanced water treatment technologies is especially relevant because of their ability to
remove CECs, as is illustrated by the high percentage removal rates recorded in table 1.1.

1
Table 1.1: Indicative Removal of Organic Chemicals
Treatment Percentage Removal
Pharmaceuticals Hormones
B(a)p Antibioticsa DZP CBZ DCF IBP PCT Steroid Anabolicc Fragrance DBPs
NDMA
Secondary
Activated
Sludge
nd 10-50 nd - 10-50 >90 nd >90 nd 50-90 -
Microfiltration nd <20 <20 <20 <20 <20 <20 <20 nd <20
UF/PAC nd >90 >90 >90 >90 >90 nd >90 nd >90 >90
Nanofiltration >80 50-80 50-80 50-80 50-80 50-80 50-
80 50-80 50-80 50-80
Reverse
Osmosis >80 >95 >95 >95 >95 >95 >95 >95 >95 >95 20-50
GAC >90 >90 >90 >90 >90 >90 >90 >90
Ozonation >80 >95 50-80 50-80 >95 50-80 >95 >95 >80 50-90 50-90
Advanced
Oxidation 50-80 50-80 >80 >80 >80 >80 >80 >80 50-80 >90
High-level UV 20-80 <20 20-50 >80 20-50 >80 >80 20-50 nd >90
Chlorination >80 >80 20-50 <20 >80 <20 >80 >80 <20 20-80
DZP-Diazepam, CBZ-Carbamezepine, DCF-Diclofenac, IBP-Ibuprofen, DBP-Disinfection By-products, NDMA-Nitrosodimethylamine

2
1.4 ADVANCED WATER TREATMENT TECHNOLOGIES
Improvements in technologies and analytical capabilities have made it possible to validate the concept that
water can be purified using several alternative process flow schemes. The basic system used to purify
wastewater consists of several processes collectively referred to as advanced treatment. The current
advanced treatment scheme has evolved over time, and now commonly includes microfiltration (MF),
reverse osmosis and advanced oxidation (Leverenz et al., 2011). The advanced wastewater treatment
processes pertinent to this study are discussed in in the following sections. A brief description of each
technology is given, with some references to the recorded performance of these technologies in
experimental, pilot or full scale situations. Special reference is given to the performance of these
technologies in removing CECs, such as EDCs and pharmaceutical and personal care products (PPCPs). It
should be noted that CECs are often referred to as trace organics or micro-organics in the literature. The
terms are thus used interchangeably in this report.
1.4.1 Membrane Bioreactors
Membrane bioreactors make use of a polymeric membrane to achieve the solids – liquid separation at the
end of the activated sludge process. The pores in the MBR are of such a size that they exclude all solids,
allowing only the passage of dissolved substances. As a result, bacteria, and protozoa such as giardia
lamblia and cryptosporidium parvum are excluded. The two protozoa are of particular significance as they
cause severe diarrhea which can result in death in 2tabil-compromised persons. The ability of MBRs to
remove hardly biodegradable trace organics such as steroids, pharmaceuticals or personal care products
has been investigated by many groups, and compared with the performance of conventional activated
sludge plants (Lesjean et al., 2004). This was motivated by the expectation that the complete retention of
microorganisms by the membrane would facilitate the enrichment of specialists which would be able to feed
on hardly biodegradable compounds present at concentration ranges of ng/l up to µg/l.
The nominal molecular weight cut-off (NMWCO) of ultrafiltration membranes has no influence on the
elimination of these substances with the possible exception of very tight membranes, e.g. MWCO < 100 kDa
When MF and UF membranes with various pore sizes were compared in anaerobic digester broth filtration,
there was no noticeable difference in permeate quality (Imasaka et al., 1989). A potential reason could be
the shift of NMWCO of the membranes due to the gel layer that forms during the operation. Due to the
physical properties of these substances it is expected that adsorption onto bio-solids and organics of
activated sludge may occur (Clara et al., 2005). For instance, MBR systems combined with post-treatment
steps like NF and activated carbon adsorption were shown to be more effective for removal of nonylphenol
and bisphenol-A (also EDCs) than RO alone (Wintgens et al., 2008). However, recent investigations (Clara
et al., 2005) showed that, for a given sludge age, the MBR processes perform similarly to conventional
activated sludge (CAS) systems.
1.4.2 Ozonation
Ozone is a strong oxidant and disinfectant that decays within minutes after addition to water. Ozonation is
commonly used to achieve:

3
• Primary degradation – a structural change in the parent molecule
• Acceptable degradation (defusing) – a structural change in the parent compound to reduce toxicity
• Ultimate degradation (mineralization) – conversion of organic carbon to inorganic carbon or CO2.
Aqueous ozone may react with various species in two manners: direct reaction by molecular ozone and
indirect reaction through radical species formed when ozone decomposes in water (Mandel, 2007). This
radical has a greater oxidizing capability than other, more conventional oxidants such as oxygen (atomic and
molecular) and chlorine. In most cases complete oxidation of the organic compound is not necessary –
partial oxidation of the molecule is sufficient to achieve subsequent biological treatment or to reduce the
toxicity. Ozone reacts with natural organics to increase their biodegradability, measured as assimilable
organic carbon (AOC). Ozone is effective at:
• inactivating pathogenic microorganisms such as giardia lamblia and viruses,
• inactivating cryptosporidium parvum (at high doses and with long contact times), and
• destroying several taste and odour causing compounds in water.
During ozonation tests by Snyder et al., most of the target compounds investigated showed over 80%
removal at typical ozone dosages (2.7 mg/l) and were removed within five minutes of contact time. Lower
ozone dosages (1.3 mg/l) were not nearly as effective (Snyder et al., 2003). As expected, electron-donating
groups enhance the reactivity of aromatic compounds toward ozone, while electron-withdrawing groups
inhibit the reactivity. As a result, all target compounds with phenolic structures, such as acetaminophen and
several hormones were removed to below analytical detection limits. Androstenedione, progesterone and
testosterone were stabilize less efficiently than any of the estrogen compounds due to ketone functional
groups on these hormones, which decreases the reactivity of ozone with the adjacent carbons. Similar
results were obtained during bench-scale drinking water treatment process experiments (Westerhoff et al.,
2005).
Three drinking water supplies were spiked with 10 to 250 ng/l of 60 different EDC/PPCPs. Ozone 3tabiliz
steroids containing phenolic moieties (estradiol, ethynylestradiol, or estrone) more efficiently than steroids
without aromatic or phenolic moieties (androstenedione, progesterone, and testosterone). EDC/PPCPs were
separated into three general groups based on their reactivity with oxidants:
1) Compounds easily 3tabiliz (> 80% reacted) by chlorine are always 3tabiliz at least as efficiently by ozone;
2) Compounds poorly 3tabiliz (< 20% reacted) by chlorine or ozone; 6 of the 60 compounds (TCEP, BHC,
chordane, dieldrin, heptachlor epoxide, musk ketone) were in this group;
3) Compounds reacting preferentially (higher removals) with ozone rather than chlorine; 24 of the 60 tested
(e.g., DEET, ibuprofen, gemfibrozil) were in this group.
Other compounds (atrazine, Iopromide, meprobamate, TCEP), had low removals by all processes
considered.

4
1.4.3 Granular Activated Carbon
GAC has an extremely high specific surface area and has an affinity for organic molecules. GAC is used to
absorb the organic molecules dissolved in water. When molecules are absorbed onto the activated carbon
surface they undergo migration throughout the pores of the carbon. Those contaminants with low aqueous
solubility, and a size conducive to fitting within the pore structure, are most readily adsorbed. In the presence
of oxygen, a biological mass develops on the carbon which biodegrades the absorbed organics. The
biodegradation of the absorbed molecules results in the biological regeneration of the activated sludge, thus
increasing its net absorption capacity. The porous structure of the activated carbon makes it an ideal host for
a biomass.
The effectiveness of GAC in adsorbing a particular chemical can generally be predicted based on how
hydrophilic (water loving) or hydrophobic (water repelling) a chemical is. GAC is effective for the removal of a
diverse range of hydrophobic organic compounds, as well as some relatively hydrophilic inorganic
compounds such as nitrogen, sulphides and heavy metals. More hydrophilic compounds, such as carboxylic
acids and alcohols, are relatively poorly removed by GAC (Metcalf and Eddy, 2004). GAC can be highly
effective for the removal of a wide range of pharmaceuticals, hormones and pesticides (table 1.1), but does
not greatly reduce concentrations of salts and nutrients. GAC is a US Environmental Protection Agency best
available technique (BAT) for the following contaminants:
• Disinfection by-products (DBPs)
• Mercury and cadmium
• Natural organic matter (NOM)
• Synthetic organic chemicals (specifically; benzo(a)pyrene, di(2-ethylhexyl)adipate, di(2-
ethylhexyl)phthalate, hexachlorobenzene, dioxin)
• Radionuclides.
Biological growth within the GAC results in what is known as biologically activated carbon (BAC). BAC can
be beneficial by removing AOC and other biodegradable compounds. If it is intended to have BAC, the GAC
filters are typically preceded by ozonation that breaks down the organic carbon into a more assimilable form.
This process can enhance the overall contaminant removal of the GAC process. The addition of ozone not
only increases the biodegradability of the dissolved organics, but also introduces large amounts of oxygen
into the water, thus creating an excellent environment for biological growth on the filter media (Techneau,
2006). A study in Australia (Reungoat et al., 2012) investigated the fate of CECs in three full scale
reclamation plants where ozonation followed by BAC filtration was used to treat wastewater treatment plant
effluents. Limited dissolved organic carbon (DOC) removal (<10%) was observed in the ozonation stages,
showing that oxidation leads to the formation of transformation products rather than mineralization. The
degree that the quantified CECs were removed was highly dependent on the compounds’ structures and the
specific ozone dose.
The subsequent BAC filtration removed between 20% and 50% of the DOC. Overall, the combination of
ozonation and BAC filtration can achieve removal of 50% for DOC and more than 90% for a wide range of

5
CECs. This is corroborated by work done by Snyder et al. (2007), in bench-scale experiments of the
adsorption of 29 CECs, which demonstrated that GAC was capable of providing greater than 90% removal of
nearly all compounds. Increasing the ozone dose and filtration empty bed contact time (EBCT) generally has
a positive influence on the removal of DOC and CECs, but there is no direct linear relationship. Therefore,
increasing the ozone dose and EBCT further will not necessarily lead to substantive gains in water quality.
1.4.4 Nanofiltration and Reverse Osmosis
NF membranes have nominal pore sizes in the range 0.001–0.01 microns. The fundamental basis for
removal of chemicals is size exclusion, although electrostatic repulsion and hydrophobic adsorption can also
contribute to removal (Ozaki, 2002). Molecular weight cut-offs are of the order of 600 atomic mass units. NF
can provide greater than 6-log reductions of bacterial, viral and protozoan pathogens. However, as with all
membrane filtration, there are limitations on the log reductions that can be demonstrated by operational
procedures. As shown in table 1.1, NF membranes can remove 50–80% of organic compounds. At present,
it is clear that small neutral organic compounds are not rejected by NF membranes as efficiently as
dissociated salts or charge-bearing organic molecules (Ben-David et al., 2010).
RO membranes remove dissolved organic compounds in a process driven by a pressure gradient that forces
molecules across semipermeable membranes. The fundamental basis of removal is size exclusion,
particularly for molecules such as surfactants, hormones and most pharmaceuticals with molecular weights
greater than 100–200 atomic mass units. Electrostatic repulsion, hydrophobic adsorption and chemical
shape also contribute to removal, particularly for low molecular weight compounds. As shown in table 1.1,
RO membranes can remove more than 95% of most organics compounds. Nitrosodimethylamine (NDMA),
with a molecular weight of 74, is among the organic chemicals with a low level of removal (25–50%). RO can
provide greater than 6-log reductions of bacterial, viral and protozoan pathogens. Typically, the operation of
RO membranes is monitored using electrical conductivity or total carbon concentrations.
Kimura et al. (2003) found negatively charged compounds to be significantly rejected by NF/RO membranes
due to electrostatic repulsion between the compounds and membranes. The high rejection (> 90%)
associated with negative charge was observed even when compounds with small molecular weights and
rather loose membranes were examined. Snyder et al. (2007) investigated the removal of 36 EDCs and
PPCPs during drinking and wastewater treatment processes at pilot and full scale and found that RO and NF
membranes were capable of rejecting most of the compounds studied to below detection levels (< 25 ng/l).
Wintgens et al. (2008) reported on the performance of NF and RO membranes in removing organic
contaminants included estrone, ethinylestradiol, estradiol and sulphamethoxazole. Selected results that allow
comparison with this study are listed in table 1.2.
Among the emerging technologies for indirect potable use, nanofiltration should be highlighted as a
treatment technology which can remove a wide range of microbiological as well as chemical contaminants
(Schafer et al., 2005). NF can be considered as an alternative to RO technology where a lower degree of
desalination is required. With a molecular weight cut-off above 200 g/mol it is a promising treatment option

6
for a variety of emerging trace contaminants. NF has been investigated in a number of purification
applications.
Table 1.2: Performance of NF and RO Membranes
Compounds Substance Type Membrane Type Retention (%)
Estrone EDC NF/RO 13 - >80
Estrone EDC NF 80 - >95
Estrone EDC NF 65 – 83
Estrone EDC NF 40 - >99
Estradiol EDC NF 20 - >80
Estradiol EDC NF 49 - >99
Estradiol EDC RO 29 – 83
Ethinylestradiol EDC NF 41 - >99
Sulphamethoxazole Pharmaceutical RO 70 – 82
1.4.5 Advanced Oxidation Processes
Advanced oxidation refers to the use of high level oxidative processes to degrade organic constituents of
wastewater that are biologically persistent and poorly retained by membranes or activated carbon. Typically,
advanced oxidation incorporates combinations of high doses of UV light or ozone with hydrogen peroxide to
produce highly reactive hydroxyl radicals. Each of these processes independently degrades organic
compounds, but the formation of hydroxyl radicals greatly improves degradation. The effectiveness of
advanced oxidation depends on the contact time and concentration of scavengers in the water (i.e. non-
target oxidisable species). Dissolved organic carbon and carbonate or bicarbonate are generally the most
important scavengers in drinking water. Pre-treatment processes such as GAC or RO significantly increase
oxidation efficiency. Advanced oxidation has been shown to be highly effective in degrading organic
chemicals, such as NDMA, that pass through RO membranes. For reclaimed water systems, the
recommended design UV doses are 100 mJ/cm2 for granular media filtration effluent, 80 mJ/cm2 for
membrane filtration effluent, and 50 mJ/cm2 for RO effluent. The different dose requirements reflect the
different virus density concentration expected within each type of process effluent. The dosages selected are
intended to provide 4 logs of poliovirus inactivation with a factor of safety of about 2. In addition to differing
dose recommendations as a function of effluent quality, there are differing design transmittance
recommendations. For GM, MF and RO effluents, the design transmittances are 55, 65, and 90 per cent,
respectively.
A UV dosage of 60 mJ/cm2 and 250 mJ/cm2 is applied at NEWater Singapore and Beaufort West
reclamation plants respectively. The World Health Organisation (WHO) drinking water quality guidelines
(2008) specifies a requirement of 59 mJ/cm2 for 99% inactivation of viruses, protozoa and bacteria. Snyder
et al. (2003) showed that UV is not able to provide significant removal of most target analytes under a
common disinfection dose of 40 mJ/cm2. Higher removal efficiencies (85%) can be achieved with UV when it
7
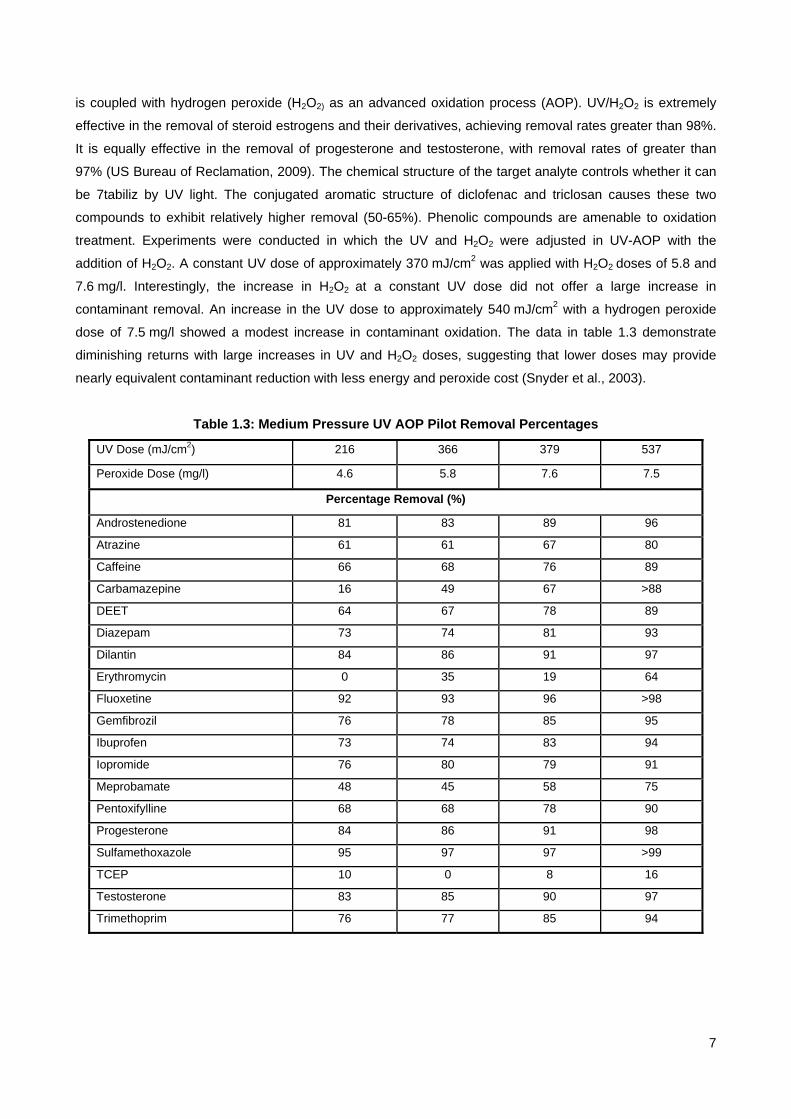
is coupled with hydrogen peroxide (H2O2) as an advanced oxidation process (AOP). UV/H2O2 is extremely
effective in the removal of steroid estrogens and their derivatives, achieving removal rates greater than 98%.
It is equally effective in the removal of progesterone and testosterone, with removal rates of greater than
97% (US Bureau of Reclamation, 2009). The chemical structure of the target analyte controls whether it can
be 7tabiliz by UV light. The conjugated aromatic structure of diclofenac and triclosan causes these two
compounds to exhibit relatively higher removal (50-65%). Phenolic compounds are amenable to oxidation
treatment. Experiments were conducted in which the UV and H2O2 were adjusted in UV-AOP with the
addition of H2O2. A constant UV dose of approximately 370 mJ/cm2 was applied with H2O2 doses of 5.8 and
7.6 mg/l. Interestingly, the increase in H2O2 at a constant UV dose did not offer a large increase in
contaminant removal. An increase in the UV dose to approximately 540 mJ/cm2 with a hydrogen peroxide
dose of 7.5 mg/l showed a modest increase in contaminant oxidation. The data in table 1.3 demonstrate
diminishing returns with large increases in UV and H2O2 doses, suggesting that lower doses may provide
nearly equivalent contaminant reduction with less energy and peroxide cost (Snyder et al., 2003).
Table 1.3: Medium Pressure UV AOP Pilot Removal Percentages
UV Dose (mJ/cm2) 216 366 379 537
Peroxide Dose (mg/l) 4.6 5.8 7.6 7.5
Percentage Removal (%)
Androstenedione 81 83 89 96
Atrazine 61 61 67 80
Caffeine 66 68 76 89
Carbamazepine 16 49 67 >88
DEET 64 67 78 89
Diazepam 73 74 81 93
Dilantin 84 86 91 97
Erythromycin 0 35 19 64
Fluoxetine 92 93 96 >98
Gemfibrozil 76 78 85 95
Ibuprofen 73 74 83 94
Iopromide 76 80 79 91
Meprobamate 48 45 58 75
Pentoxifylline 68 68 78 90
Progesterone 84 86 91 98
Sulfamethoxazole 95 97 97 >99
TCEP 10 0 8 16
Testosterone 83 85 90 97
Trimethoprim 76 77 85 94

8
1.4.6 Chlorination
Work done by Renew and Ching-Hua (2004) suggests that chlorine may eliminate antibiotics more efficiently
than UV treatment. These results are consistent with bench-scale experiments that illustrate high
susceptibility of fluoroquinolones, sulphonamides and trimethoprim to reactions with chlorine and low
susceptibility of fluoroquinolones and trimethoprim to photolysis at typical dosages of UV disinfection.
1.5 WATER RECLAMATION PROCESS CONFIGURATIONS: CASE STUDIES
There are a number of indirect and direct water reuse schemes in the world. The most famous direct reuse
project is the Goreangab reclamation plant, in Windhoek, Namibia, which has been operational since 1968.
Until recently, this scheme was the only direct reuse plant in the world, but it has now been joined by the
Beaufort West reclamation plant in South Africa. Of the indirect reuse projects, the NEWater project in
Singapore has received a lot of attention in recent times. The NEWater project releases reclaimed water into
a reservoir, which is then abstracted and treated at a conventional water treatment plant. An equally
successful indirect reuse scheme, which has been operating for a far longer period, is the Orange County
Water District (OCWD) reclamation project in California, which uses reclaimed water to supplement existing
supplies through artificial recharge of aquifers used for drinking water. Another indirect reuse project
completed recently is the Western Corridor Recycling Project in Queensland, Australia. These projects
provide a wealth of information regarding appropriate treatment technologies and the appropriate operational
protocols required to ensure the supply of safe drinking water through reclamation. They are looked at in
more detail in the following section as they provide a benchmark for this study and for the development of
future reuse projects in general.
1.5.1 New Goreangab Reclamation Plant
The New Goreangab wastewater reclamation plant in Windhoek is the most famous wastewater reclamation
plant in the world, as for decades Windhoek was the only city in the world directly reclaiming treated
wastewater effluent for drinking water. The New Goreangab Reclamation Plant (NGRP), as it is known today,
after many upgrades, has the process train shown in table 1.4 below.
Table 1.4: Process Configuration for New Goreangab Reclamation Plant
NGRP
Pre-ozonation and Dissolved Air Flotation
Rapid Sand Filtration and Ozonation
Biological Activated Carbon and Granular Activated Carbon
Ultrafiltration
Stabilization and Chlorine
The successful operation of the NGRP lies in the application of the multiple-barrier principle. Three types of
barriers can be distinguished: non-treatment, treatment and operational. It should be noted that barriers in

9
this sense mostly cannot imply absolute dead-stop barriers. Non-treatment barriers, to name but a few,
include:
• the diversion of industrial effluent to a different drainage area, and the policing of industrial
discharges;
• rigorous continuous quality monitoring of the raw and treated water to allow for corrective action to
protect the consumer;
• blending of reclaimed water with water from conventional sources, to limit reclaimed water to a
maximum of 35% of the blended water.
Treatment barriers are always against specific contaminants and are regarded as either partial or complete.
Different contaminants respond differently to different treatment methods. Operational barriers provide
backup capacity to an existing process. The NGRP process train provides for the following:
• Two complete barriers against turbidity (DAF/filtration and membrane filtration)
• Three complete barriers against microbiological contaminants (ozone, membrane filtration,
chlorination)
• Four complete barriers against giardia (DAF/filtration, ozonation, membrane filtration, chlorination)
• Two complete barriers and two partial barriers against cryptosporidium (DAF/filtration and membrane
filtration as complete barriers; ozonation and chlorination as partial barriers)
• Four partial barriers against organic contaminants (enhanced coagulation, ozonation, GAC
adsorption, and some DOC rejection by membrane filtration).
The NGRP water quality treatment objectives are provided in annexure B-A for comparison purposes.
1.5.2 Orange County Water District
The Orange County Water District groundwater replenishment system in California is one of the largest water
reclamation facilities in the world, with a current capacity of 114 Ml/day. The raw water source is secondary
effluent from a wastewater works. Two treatment processes are in operation for use in achieving drinking
water standards for the product water:
• Lime clarification, recarbonation, multimedia filtration, RO, and disinfection.
• MF, RO, disinfection.
The treated water is used for aquifer recharge to protect a groundwater resource from seawater intrusion.
From the above it can be seen that the longer, conventional process involving clarification, recarbonation
and filtration can be replaced by MF. MF followed by RO is all that is required to achieve a product water of
drinking water standard. Operationally, run times for RO between membrane cleanings were approximately
the same for the two pre-treatment systems. However, costs for microfiltration are about 45% lower than for
lime clarification, recarbonation, and filtration, at 0.22 and 0.42 US$/m3 respectively (Lazarova et al., 2003).
The higher capital costs of MF elements are more than offset by the lower operation and maintenance costs
of this advanced technology. Another important advantage of MF is the consistent filtrate quality despite wide
variations in feedstream wastewater composition: generally around 0.05 NTU, with a maximum of about 0.1

10
when high influent turbidity was observed over periods of several months. The conductivity and silt density
index (SDI) is consistently lower for MF pre-treatment effluent compared to conventional lime pre-treatment.
In addition, operator input is minimal, making remote, unattended operation possible (Lazarova et al., 1998).
The product water quality is presented in table 1.5 below. It is noteworthy that the trace organic compounds
that are detected in the final product water are, primarily, disinfection by-products, such as chloroform and
bromoform. The organics detected are, however, considerably below maximum allowable contaminant
levels.
Table 1.5: Monthly Average Water Quality Data of OWCD Product Water
Parameter Units Measured
Turbidity NTU 0.07-0.49
pH pH units 7.7-8.2
TOC mg/l 0.3-1.1
TSS mg/l ND-0.1
TDS mg/l 28-236
1.5.3 Singapore NEWater Project
A dual UF or MF–RO membrane process plus UV radiation has been successfully applied to produce high
grade water from secondary treated effluent in Singapore, since May 2000. Prior to implementation of the
project, a comprehensive study to evaluate the feasibility of using dual-membrane technology to reliably
produce reclaimed water from municipal effluent was conducted. The study was conducted at a purpose built
10 Ml/day demonstration facility at the Bedok Water Reclamation Plant. Source water to the plant is clarified
secondary effluent from an activated sludge treatment process that typically contains: 10 mg/l biochemical
oxygen demand (BOD), 6.4 mg/l ammonia, 15 mg/l total suspended solids (TSS) and 12 mg/l total organic
carbon (TOC) (Qin et al., 2009). The NEWater demonstration plant water quality results are provided in
annexure B-A. Table 1.6 below provides a comparison of design and actual operating parameters.
Table 1.6: Design & Actual Operating Parameters. Singapore NEWater Project. (Aug 2000)
Parameter Specified Design Actual
TOC Removal (%) >97 >99
Ammonia Removal (%) >90 96
TDS Removal (%) >97 96
MF Filtrate Turbidity (NTU) <0.1 <0.1
1.5.4 Western Corridor Recycling Water Project
The Western Corridor Recycling Water Project in Queensland, Australia, is reported to be the largest
recycled water scheme in the southern hemisphere. It aims to reduce demand on the region’s fresh water
supply while securing water supplies for industrial use and reducing the environmental impact on water
resources. The Bundamba Advanced Water Treatment Plant uses state-of-the-art technologies to improve

11
the quality of secondary-treated sewage water, for reuse as potable water and industrial cooling water. It
includes: flow 11tabilizatio, pre-treatment (coagulation and clarification for phosphate and turbidity removal),
microfiltration, reverse osmosis, advanced oxidation (hydrogen peroxide and UV dosing) and final
11tabilization of the water. Testing was undertaken for 400 pharmaceuticals, herbicides, pesticides and other
inorganic and organic compounds. Ninety-five per cent of these compounds were detected in the treated
wastewater prior to treatment at the advanced water treatment plant. The majority of these chemical
compounds were not detected in the purified recycled water.
Table 1.7 contains a list of chemical compounds that were detected in the purified recycled water. The levels
of these detected chemicals are within the limits of the Public Health Regulation 2005, and pose no acute or
long-term risk to public health. No hormones and no pathogenic microorganisms were detected in the
purified recycled water. Some of the salient final water quality results are at their median values: 140 mg/l
TDS, turbidity 0.4 NTU, zero colony forming units (CFU)/100ml of E.coli and zero plaque forming units
(PFU)/100ml of coliphages. Australian studies have shown that the wastewater treatment processes used in
South East Queensland remove 95-99% of endocrine disrupting compounds (EDCs). The advanced water
treatment processes are highly effective at removing the EDCs that remain.
Table 1.7: Chemical Compounds in Purified Recycled Water; Western Corridor Recycling Water
Project.
Inorganic Chemicals aluminium, boron, cadmium copper
fluoride, iron, manganese sulphate
Disinfection By-products bromate, bromodichloromethane chloroform
dibromochloromethane, dichloroacetic acid, NDMA
Other Organic Chemicals 4-tert-octulphenol, bisphenol-A cholesterol, nonylphenol Herbicides and Pesticides Dalapon Triclopyr Pharmaceuticals and Personal Care Products
caffeine, DEET Paracetamol, salicylic acid
1.5.5 Beaufort West Reclamation Plant
In response to severe water shortages, the Beaufort West Municipality made a decision to augment its
existing water resources by reusing secondary-treated domestic sewage. The design of the reclamation
plant was based on the multi-barrier concept, with the following barriers: Intermediate chlorination / rapid
sand filtration, UF, RO, UV- H2O2, and final chlorination. Table 1.8 provides a summary of selected water
quality determinands from the first year of operation. The final water complies with the SANS 241-1: 2011
(Edition 1) drinking water standard. Plans are in place to sample and analyse for EDCs in the near future and
compare with results obtained by Umgeni Water’s Darvill reclamation research project.
Table 1.8: Summary of Beaufort West Reclamation Plant Final Water Quality Results
Determinand Unit Sans 241-1:2011 Final Water (Mean)
Total Dissolved Solids mg/l <1200 34
Turbidity mg/l <1 0.2
Ammonia as N mg/l <1.5 <0.1

12
1.5.6 eThekwini Municipality Wastewater Reclamation
The eThekwini Municipality is investigating direct wastewater reclamation in order to maintain their
assurance of supply, following rising water demand. Two direct reclamation options are being considered,
based on the use of differing water treatment technologies. The two treatment technology trains are, in
essence:
• a membrane-based treatment train; and
• an ozone/activated carbon treatment train.
The qualitative performance of the two selected reclamation treatment trains is reflected in table 1.9. The
ozone/granular activated carbon treatment train does not require costly brine treatment and disposal. This
option therefore has advantages for use in inland-based reclamation schemes.
Table 1.9: Identified Treatment Barriers for Direct Reuse Treatment Technologies
Water quality variable category Number of treatment barriers
Membrane based process O3/GAC process
COD CFC, MF/UF, NF/RO CFC, BAC, GAC, UF
Particulate solids CFC, MF/UF, NF/RO CFC, GAC, UF
Nutrients: Nitrogen and Phosphorous MF/UF, NF/RO
CFC, MF/UF, NF/RO
UF
CFC, UF
Microbiological MF/UF, NF/RO, UV O3, UF, UV
Salinity, Inorganic NF/RO -
Metals CFC, MF/UF, NF/RO CFC, UF
Micro-organics CFC, NF/RO, H2O2/UV CFC,BAC,GAC, UV
Disinfection By-products Not an issue
Radionuclides Not an issue
Physical Quality Not an issue
1.5.7 Other Wastewater Reclamation Schemes
Wintgens et.al (2008) obtained data from three indirect reuse projects from around the world. Although the
data is limited, the performance of the schemes and the various technologies used can be broadly compared
in terms of their removal of certain organic contaminants (table 1.10).
Table 1.10: Comparative Performance of Selected Reuse Schemes
Sample Point Compound Concentration ng/l
North City Water Reclamation Plant, San Diego (CA) – Advanced Water Treatment Pilot
Tertiary effluent Sulphamethoxazole 892
Reverse osmosis permeate Sulphamethoxazole 2.9
Nitrate and Nitrite as N mg/l <11.9 1.4
Faecal Coliforms Count/100 ml Not detected 0
E.coli Count/100 ml Not detected 0
DOC mg/l <10 <1.0

13
UV & peroxide product Sulphamethoxazole <1.0
Bolivar Aquifer Storage and Recovery Scheme (South Australia)
Reclaimed water Estrone 32
Groundwater (5 month storage) Estrone 24
Groundwater (11 month storage) Estrone 11
Temporary Hanningfield reservoir augmentation by effluent from Chelmsford (UK)
Sewage plant effluent Estrone 833
UV-treated effluent Estrone 1-20
1.6 EMERGING WATER RECLAMATION PROCESS CONFIGURATIONS
As technologies improve and monitoring equipment becomes more sophisticated it is anticipated that
alternative process trains will be employed. Examples of some of the research being undertaken in this area
are given in this section.
1.6.1 MBR-RO Systems
1.6.1.1 Toronto MBR-RO
A membrane bioreactor and reverse osmosis (MBR-RO) system was developed by the University of Toronto
Department of Civil Engineering (Comerton, 2005) to assess potential reuse applications of municipal
wastewater. The reuse water produced by the MBR-RO system meets California Title 22 water reuse
regulations for non-potable applications and USEPA drinking water limits for trihalomethanes (THMs)
(80 µg/l), haloacetic acids (60 µg/l), chlorite (1 mg/l), total coliforms (not detectable), viruses (not detectable),
and nitrate (10 mg N/l). TOC, an indicator of DBP precursors, was effectively removed (93–100%) by the RO
membranes, resulting in low TOC concentrations (< 1mg/l) in the RO permeate.
1.6.1.2 NEWater MBR-RO
Pilot testing at the NEWater Project has shown the MBR-RO option to produce a slightly superior quality
product water than the conventional approach of secondary treatment followed by MF and RO, specifically
with respect to TOC, nitrate and ammonia (Qin et al., 2009), and also tends to be lower cost (Judd, 2011).
The MBR-RO option was explored with trials of three MBR plants operating simultaneously. Comparison of
the MBR-RO process to a conventional ASP-MF-RO process was also made. The MBR plants were fed with
primary settled sewage having mean COD, ammonia, TKN and total phosphorous (TP) levels of 265, 33, 33
and 9 mg/l, respectively. The mean product water quality from each of the MBRs tested and MF permeate is
given in table 1.11.
Table 1.11: Comparison of Quality of NEWater MBR Product and MF Permeate
Parameter MBR Product MF Permeate
NH4-N (mg/l) 0.05 – 0.62 0.97 – 2.57
NO3 (mg/l) 17.6 – 22.8 25.2 – 42.2
TOC (mg/l) 4.9 – 5.1 6.8 – 6.9

14
pH 6.2 – 6.4 6.7 – 6.8
The results show that levels of NH4-N, NO3- and TOC were lower in the MBR product than in the MF (0.1 µm
PVDF hollow fiber) permeate from polishing of secondary effluent. It should be pointed out the better quality
of the MBR product compared to the MF permeate was due to differences in the biological treatment
efficiency of the MBR process as opposed to the physical separation process. RO membranes in the MBR-
RO process could be operated at 22 lm-2h-1 without cleaning in place (CIP) during the whole five month study
period, which was 30% higher than the rate (17 lm-2h-1) in the ASP-MF-RO process for NEWater production.
With respect to the removal of organics in the RO permeates, the results showed that the TOC level of the
RO permeate from the MBR-RO process was not only lower but also fluctuated less than the TOC level from
the ASP-MF-RO process (figure 1.1). The TOC level of the RO permeate from the ASP-MF-RO process
fluctuated in the range of 33–53 ppb while the TOC level from the MBR-RO process was in the range of 24–
33 ppb (Qin et al., 2009).
Figure 1.1: NEWater Pilot TOC comparison
1.6.2 Nanofiltration
One of the major problems with common DPR treatment schemes employing RO is the management of
brine, especially in inland locations. To deal with this issue, a variety of advanced treatment processes are
currently under development for the oxidation of trace organics, without the removal of dissolved solids
(Leverenz et al., 2011). An example of such a system is shown in figure 1.2. Another issue with schemes
employing RO is the high energy usage required for treatment.

15
Figure 1.2: Alternative Advanced Treatment Flow Diagram with Trace Organics Removal
1.6.2.1 Nanofiltration and Ultra-Low Pressure Reverse Osmosis
Pilot testing has been undertaken to determine if low pressure membranes such as nanofiltration and ultra-
low pressure reverse osmosis membranes can meet water quality requirements for indirect potable reuse.
The results of the pilot suggest that ultra-low pressure RO and NF membranes can achieve similar removal
efficiencies for the selected trace organics, nitrogen and bulk parameters tested as for commonly employed
RO membranes (Drewes et al., 2005). While providing a similar water quality, these membranes can be
operated at significantly lower feed pressures. The two membranes selected for the laboratory-scale
assessment (TMG10, Toray; NF-90, Dow-Filmtec) were employed on the pilot-scale skid for approximately
2,800 hours and 1,400 hours , respectively. Both membranes were capable of achieving a TOC ejection
exceeding 98% with final permeate concentration of less than 0.3 mg/l.
The TMG10 (RO) membrane consistently achieved permeates with ammonia concentrations of less than 1.7
mg N/l, while the NF-90 permeate exhibited ammonia concentrations of less than 2.8 mg/l. While certain
trace organics were present in the feed water, none of the pharmaceutical residues, chlorinated flame
retardants and EDCs (hormones, bisphenol A) were quantifiable in the membrane permeates. Both
membranes were operated at a flux of 20 lmh and a recovery of 85%. The temperature corrected specific
flux of the TMG10 declined from 4.24 to 2.74 lmh/bar and the NF-90 declined from 6.49 to 2.74 lmh/bar after
four weeks of operation. Both specific fluxes remained stable during the remainder of the test and were
significantly higher than the specific flux of the Koch RO membrane employed at full scale which was
operated at 2 lmh/bar.
1.7 PRODUCT WATER QUALITY OBJECTIVES
1.7.1 SANS 241
The product water quality objective is to exceed the potable drinking water standards of SANS 241 (2011).
This is the standard that Umgeni Water uses for potable water production. However, because of the inherent
risks in treating wastewater to potable standards, the water quality objectives set for this study are far
stricter. An example of this would be TOC which has a standard of < 10 mg/l in SANS 241 (2011) but a
target of < 1 mg/l in this study. Similarly, the SANS 241 (2011) standard for total coliforms is < 10
(CFU/100 ml), but in this study it is ND (not detectable). Additional water quality parameters such as trace
organics were also measured. Concentrations of a number of human hormones and their derivatives were
analysed: estrone, 17α-ethinyl estradiol, estriol, 17β-estradiol, testosterone and progesterone. The
antibiotics, sulphamethoxazole and fluoroquinolones were also analysed.

16
Tests for these hormones and antibiotics have been carried out at wastewater reclamation schemes around
the world such as at NEWater in Singapore and the Western Corridor Recycling Water Project in Australia.
The concentration of these trace organics in the final reclaimed water from Darvill can thus be compared with
these other reclamation schemes. The final potable water quality, prior to disinfection, should meet the
following objectives, as laid out in table 1.12, as well as additional standards for DBP and trace organics
discussed below.
Table 1.12: Product Water Quality Objectives
Parameter Specified/Design
SS Removal (NTU) <0.5
Total Dissolved Solids (mg/l) <100
Ammonia (mg/l) <1
Total Nitrogen (mg/l) <10
TOC (mg/l) <1
UV254 (cm-1)* 0.065
Total Coliforms (CFU/100ml) ND
Faecal Coliforms (CFU/100ml) ND
Coliphages –Somatic (PFU/100ml) ND
Pathogens Removal (%) 5-log (99.999%)
Silt Density Index (SDI)15 <3
* New Goreangab
1.7.2 USEPA Regulations
USEPA has issued specific regulations regarding TOC in drinking water, i.e. the Disinfectants/Disinfection
By-products Rule, D/DBPR (1st stage). Under this rule, utilities are required to remove predetermined
amounts of TOC as a way to reduce DBP precursors and DBP formation. The required amount of TOC to be
removed, as defined by the B/DBP rule, is affected by the raw water TOC concentration and raw water
alkalinity (table 1.13).
Table 1.13: Total Organic Carbon Removal Goals (USEPA)
TOC in raw water
(mg/l)
TOC removal goals (%) for different raw water alkalinity levels (mg/l CaCO3)
0-60 mg/l CaCO3 60-120 mg/l CaCO3 >120 mg/l CaCO3
2.0-4.0 35 25 15
4.0-8.0 45 35 25
>8.0 50 40 30
The treatment goals and requirements are based on evaluations of DBP formation potentials, and on
economic and practical reasons. USEPA’s 2nd stage Disinfectants/Disinfection By-products Rule regulates
two groups of disinfection by-products which originate from organic matter: total THMs, and a group of five

17
haloacetic acids (HAA5). The maximum THM value of 80 μg/l is stricter than that in the EU Directive
98/83/EC, and the maximum value for HHA5 is 60 μg/l (Techneau, 2006). These standards are stricter than
those used by SANS 241: 2011 and should be applied to any future reclamation plant, because of the higher
risk of DBP potential formation as a result of the extensive use of advanced oxidation processes in
wastewater reclamation.
1.7.3 Australian Guidelines
Table 1.14 presents calculated drinking water guidelines for trace organics and compares them with the
highest concentrations measured in secondary-treated effluent in Australia. Given that this does not take into
account reductions achieved by advanced treatment processes, it is unlikely that trace organics will be
present at levels approaching the recommended drinking water guideline, or cause untoward effects in
people drinking water from recycled water. Testing of recycled water produced at the Orange County
Groundwater Replenishment Scheme and the Singapore NEWater scheme has not detected 17α-
ethynylestradiol, estrone or 17β-estradiol. Nevertheless the guidelines can be used in South Africa as a
safety benchmark for monitoring of trace organic concentrations in drinking water.
Table 1.14: Australian Drinking Water Guidelines
Pharmaceuticals Maximum concentrations detected in
wastewater (µg/l) Drinking Water Guideline (µg/l)
Estrogenic compounds
17α-estradiol 0.074 0.175
17β-estradiol 0.027 0.175
Progesterone 0.199 105
Estriol 0.051 0.05
Estrone 0.11 0.03
17α-ethinyl estradiol 0.270 0.0015
Androgenic compounds
Testosterone 0.214 7
Androsterone 0.214 14
1.8 SUMMARY
The effectiveness of a range of water reclamation technologies such as membrane coupled (MBR) activated
sludge treatment, membrane effluent filtration with porous and dense membrane processes, activated
carbon adsorption as well as different oxidation processes (ozone, UV & ozone, UV & peroxide) has been
investigated in a number of studies (Asano et al., 2006; Snyder et al., 2007). In reviewing the treatment
trains presented in the case studies, it is apparent that a number of different unit processes have been
employed for the removal of the constituents of concern in wastewater. What is evident is that each process
produces a consistent water quality that is compliant with the regulations and drinking water standards in
each country.

18
CHAPTER 2: WATER RECLAMATION PLANT PILOT TRIALS
2.1 INTRODUCTION
The successful schemes presented in Sections 1.5 and 1.6 provide a benchmark for the design of
future indirect and direct potable reclamation schemes. Although similar, different schemes combine
different technologies to achieve the same objective and it becomes difficult to justify a particular
process train as the most suitable. When choosing a process train a number of factors need to be
considered which include: feed water quality, capital and operating cost and final water quality. The
work carried out as part of this study focused on identifying a treatment train that meets the following
criteria:
• Achieves water of a quality that exceeds the national drinking water standard, SANS 241:1
2011;
• Adopts a multi-barrier approach and has two or more barriers per wastewater contaminant;
• Is the most economical process train that meets the water quality objectives.
2.2 TARGET TRACE ORGANIC CONTAMINANTS
Target compounds were selected from various classifications of trace organic contaminants. Classes
considered included hormones, personal care products, pharmaceuticals and any other compounds
that could be potential EDCs. Because of budget limitations only a small number of organic
contaminants could be selected for analysis. The selection process was based on the following
criteria:
• The likelihood of a chosen contaminant occurring in the in the environment should be great. A
literature review of peer-reviewed journals, government reports and books provided information
as to the prevalence of contaminants in the environment (Benotti et al., 2009; US Bureau of
Reclamation, 2009; Kumar and Xagoraraki, 2010). This was necessary so that the performance of
the advanced treatment processes in removing contaminants could be analysed.
• Availability of analytical standards.
• Indicator compounds that reflect the potential for contamination by other compounds, as well as
the efficacy of a given type of treatment.
Benotti et.al. (2009) analysed source water, finished drinking water and distribution system tap water
from 19 US water utilities for 51 CECs between 2006 and 2007. Both estrone and sulphamethoxazole
were part of the 11 most frequently occurring compounds. Estrone was also identified as an indicator
compound. Kumar and Xagoraraki, (2010) ranked CECs, in terms of priority, in four categories,
namely: overall score, occurrence, ecological effects and health effects. Estrone, 17β-estradiol, 17α-
ethinylestradiol, estriol and testosterone all ranked in the top twenty in varying categories.

19
The fluoroquinolone group of antibiotics (enrofloxacin and norfloxacin) and the antibiotic,
sulphamethoxazole, also ranked in the top twenty. Fluoroquinolones represent classes of synthetic
antibiotics that are widely used in human and veterinary medicine (Renew & Ching-Hua, 2004).
Earlier studies show that these antibiotics are rather resistant to microbial degradation.
Sulphamethoxazole has been among the top 200 drugs prescribed in the US from1995 to 2002.
Based on the criteria above, the steroid hormones, 17-α-ethinylestradiol, 17β-estradiol, testosterone
and progesterone, and two antibiotics, fluoroquinolones and sulphamethoxazole, were also chosen
for testing.
2.3 DESCRIPTION OF SELECTED WATER RECLAMATION UNIT PROCESSES
Ozonation, GAC, NF, RO and UV radiation were tested in this project, due to their effectiveness.
Three reclamation options were considered, based on the use of differing water treatment
technologies and combinations thereof. The three treatment technology trains being considered are:
• A membrane-based treatment train (MBR-RO-UV);
• An ozone/activated carbon treatment train (MBR-O3/GAC-NF-UV);
• An alternative treatment train (MBR-NF-O3/GAC-UV).
The RO-based treatment train can to a large degree be considered a replica of the NEWater process
i.e. MF/UF-RO-UV, while the ozone/activated carbon treatment train combines major components of
the Goreangab wastewater reclamation plant process. Work done by Qin et al. (2009) at NEWater
showed that the MBR-RO treatment combination produced high quality water. There are advantages
and disadvantages to both processes, which will be evaluated during the bench-scale testing. The
use of NF as an alternative to RO, particularly in combination with MBR, will also be evaluated as it
has potential advantages over RO as reported by Wintgens et al. (2008).
2.4 MEMBRANE BIOREACTOR SYSTEM
In all configurations, the Toray MBR demonstration plant was used as a pre-treatment step, after it
proved to be the most reliable and easy to operate of the pilot plants tested in the early part of the
study, as reported in volume 1.
2.5 THE MBR-OZONE/GAC TREATMENT SYSTEM
2.5.1 Description of the MBR-Ozone/GAC System
The MBR-ozone/GAC treatment step was set up first as this system could be operated before the
membrane units were installed. The MBR-ozone/GAC treatment process is also a continuous process
and therefore lends itself to a greater volume of (daily) records. The GAC was operated with the
understanding that with time a biofilm would form on the carbon and the unit would operate as a BAC.
In addition, the addition of ozone upstream of the GAC unit would enhance the conversion to a BAC
by breaking down organic matter in the feedwater into more readily biodegradable substances that

20
are a food source for the developing biofilm. The ozone/GAC system consists of the following
components (figures 2.5–2.8):
Three (1,000 l) holding tanks
Figure 2.1: Holding Tanks
Ozone generator
Figure 2.2: Ozone Generator
Ozone contact column
Figure 2.3: Ozone Contact Column

21
Five GAC packed columns
• Oxygen cylinder
• Two extraction fans: The
first has a destructor used
for residual ozone removal
(Carulite 200 Granular
Catalyst) and the second is
for sampling the gaseous
residual ozone.
Figure 2.4: GAC Packed Columns
Additional components of the ozone/GAC unit are listed below and are illustrated in the process flow
diagrams in annexure B-B:
• MBR permeate tank outlet valve
• Inlet and outlet ball valves for each GAC column
• Flow metres on the inlet of every GAC column
• Four positive displacement pumps (max. flow of 30 l/h)
• Backwash ball valves at the bottom of each column
• Two pressure gauges on the GAC section, one for the pressure across the
columns and the other for the backwash stream
• Sample points for each column excluding the fifth one
• Flow meter on the ozone contact tank inlet
• Contact tank inlet and outlet ball valves
• Non-return valve on the ozone contact tank
• Two pressure gauges on the ozonation section; one on the water feed line to the
contact tank, and the other mounted on the pipeline that transfers residual ozone
from the contact tank to the extraction fan
• A sample point on the ozone contact tank outlet
• Multiplug for pump and fan connections.
GAC Columns
Oxygen Cylinder

22
2.5.2 Experimental Methodology
2.5.2.1 Ozonation
The MBR permeate was fed to a 1,000 l holding tank. From the holding tank the water is pumped by
positive displacement pumps at 0.3 bar producing a flow of 24 l/h to the ozone contact tank, where it
comes into contact with ozone flowing at 0.216 g/h from the ozone generator. The ozone generator
uses oxygen to generate ozone. An oxygen cylinder is used to supply the ozone generator with
oxygen at a supply pressure of 0.5 bar. The contact tank has a volume of 10 l which allows for a
sufficient contact time of 25 minutes. The ozonated water from the contact tank is fed to the ozonated
water holding tank (figure 2.5). The required ozone dose was calculated as 9 mg/l (see annexure B-
C), for an ozone demand of 5 mg/l based on a residual ozone concentration of 0.23 mg/l.
Displayed Text Description
CT Contact Tank
PDP
Positive Displacement Pump
HT Holding Tank
Equipment List
Figure 2.5: Ozonation Schematic
2.5.2.2 Granular Activated Carbon filtration
The water from the ozonated water holding tank was pumped by a positive displacement pump at
0.3 bar to a series of five GAC columns. The feed water flow was 24 l/h and the hydraulic loading rate
was 6.24 m/hr. The EBCT is 2.9 min per column or approximately 15 min in total. The filtered water
from the GAC columns is fed to the Ozone/GAC treated water holding tank (GAC filtrate tank). During
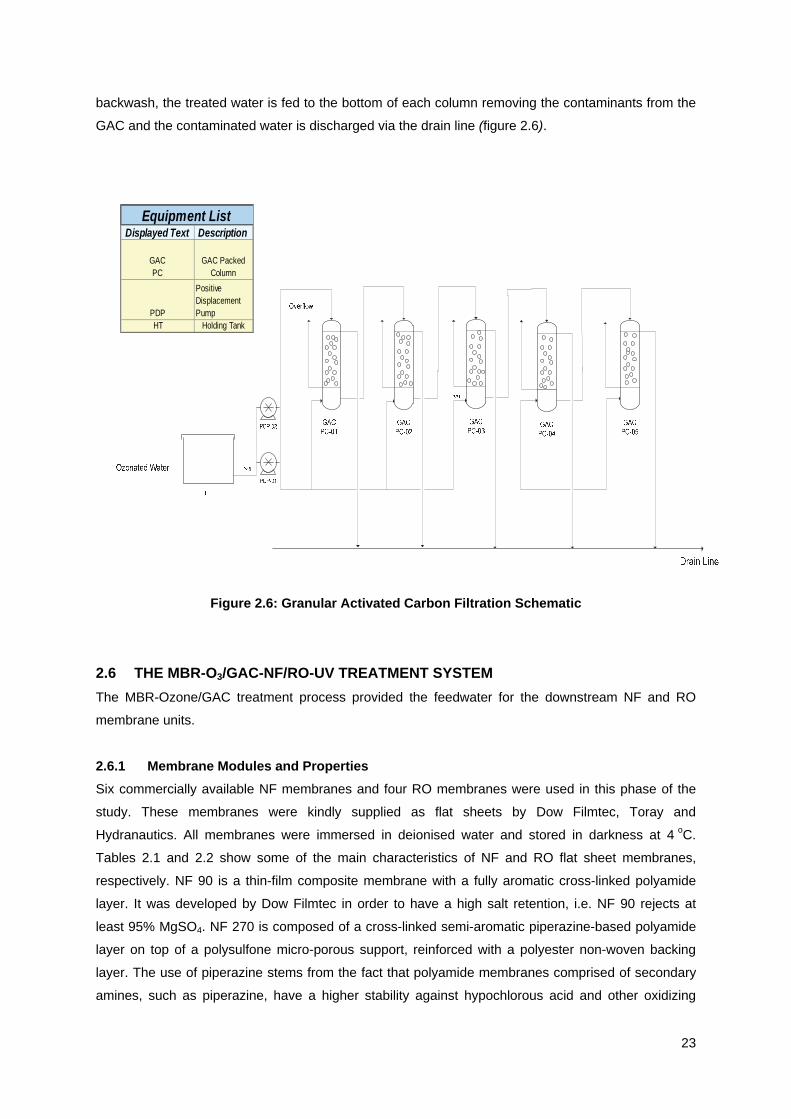
23
backwash, the treated water is fed to the bottom of each column removing the contaminants from the
GAC and the contaminated water is discharged via the drain line (figure 2.6).
Displayed Text Description
GACPC
GAC Packed Column
PDP
Positive Displacement Pump
HT Holding Tank
Equipment List
Figure 2.6: Granular Activated Carbon Filtration Schematic
2.6 THE MBR-O3/GAC-NF/RO-UV TREATMENT SYSTEM
The MBR-Ozone/GAC treatment process provided the feedwater for the downstream NF and RO
membrane units.
2.6.1 Membrane Modules and Properties
Six commercially available NF membranes and four RO membranes were used in this phase of the
study. These membranes were kindly supplied as flat sheets by Dow Filmtec, Toray and
Hydranautics. All membranes were immersed in deionised water and stored in darkness at 4 oC.
Tables 2.1 and 2.2 show some of the main characteristics of NF and RO flat sheet membranes,
respectively. NF 90 is a thin-film composite membrane with a fully aromatic cross-linked polyamide
layer. It was developed by Dow Filmtec in order to have a high salt retention, i.e. NF 90 rejects at
least 95% MgSO4. NF 270 is composed of a cross-linked semi-aromatic piperazine-based polyamide
layer on top of a polysulfone micro-porous support, reinforced with a polyester non-woven backing
layer. The use of piperazine stems from the fact that polyamide membranes comprised of secondary
amines, such as piperazine, have a higher stability against hypochlorous acid and other oxidizing

24
agents. The membrane is very hydrophilic (it has a low contact angle), and it has a high negative
surface charge at pH > 4, leading to a strong repulsion of negatively charged species.
Table 2.1: NF Flat Sheet Membrane Characteristics
Membrane NF-90 NF-270 ESNA1-LF2 UTC-60 Nano SW SR-90
Manufacturer Dow
Filmtec
Dow Filmtec Hydranautics Toray Hydranautics Dow
Filmtec
Composition
top layer
Cross-
linked, fully
aromatic
polyamide.
Cross-linked,
semi-aromatic,
piperazine-
based
polyamide,
Aromatic
polyamide
Polypiperazine
amide
Composite
polyamide
Negatively
charged
MWCO (g mol-
1)
100 155, 170, 200-
300
150
Pore size (nm) 0.38 0.48 0.30
Membrane
roughness
40.0 4.38 55.0 13.9
pH range 2-11 3-10 2-10 3-9
Water
permeability
(lmh/bar)
15.8 7.6 15.53
Contact angle
(o) (sessile
drop method)
54, 44.7 29, 27, 32.6 55 51.6
Table 2.2: RO Flat Sheet Membrane Characteristics
Membrane UTC70B UTC70UB LFC3 XLE
Manufacturer Toray Toray Hydranautics Dow Filmtec
Composition top layer Polysulfone-
polyamide
Polysulfone-
polyamide
Composite
Polyamide
Neutrally charged
Polyamide
Thin-film
Composite
pH range 2-11 2-10 2-11
Water permeability (lmh/bar) 7.2 9.32 7.8
Contact angle (0) (sessile drop
method) 54
40
Salt rejection (%) 97.2 99 99
Retention NaCl (%) 99.4 98

25
Permeate
Module
Feed Tank
Flowmeter
Bypass line
Pump
Cartridge Filter
Cooling water inlet
Cooling water outlet
Valve
Valve
Valve
2.6.2 Experimental Methodology
2.6.2.1 Cross-Flow Experiments
A laboratory-scale cross-flow NF and RO set-up was used in this study, as schematically shown in
figure 2.7 and pictured in Figure 2.8. The set-up comprised a PVC plate-and-frame membrane cell,
which had membrane channel dimensions of 80 mm in length and 30 mm in width, with an effective
surface area of 25 cm2, a 50 l HDPE feed tank, and a Hydra-Cell Model DG 10 high pressure feed
pump. The module was fed from a common pressurized feed solution obtained after the GAC filtration
step of the process train. The feed concentration was kept constant by recirculating both concentrate
and permeates into the feed tank. Permeate flow rate was captured by measuring volume collected
within two minutes, using a measuring cylinder, while the retentate flow rate was monitored by a
rotameter. Feed pressure and cross-flow velocity were controlled by means of a bypass needle valve
and a back pressure regulator.
Figure 2.7: Schematic of Laboratory-scale Membrane Unit

26
Figure 2.8: Membrane Test Unit
Figure 2.9: uPVC Membrane Module
All filtration experiments were run at a cross-flow rate of 30 l/h, which translates to a cross-flow
velocity of 0.08 m/s. The feed solution was kept at a constant temperature of 20 (±0.5) °C, controlled
by a circulating heater/chiller. Pressure was also held constant at 10 bars, except where it was the

27
variable to be examined. At the beginning of every experiment, the membrane pieces were pre-
compacted with pure water under a constant pressure of 10 bars until permeate flux 27tabilizat.
Permeate quality in terms of key pollutants composition, and flux decline caused by fouling, were
selected as response parameters. Turbidity, conductivity, microbial content (coliphages, coliforms and
E.coli), TOC, alkalinity and nitrates were measured in the feed and permeate side of each membrane.
2.6.2.2 Continuous Flow Experiments
A two stage membrane test rig was employed for the continuous flow experiments. The membrane
unit employed two single element (2540 spiral wound) vessels arranged in a two stage array. The rigs
were fully contained and portable, each consisting of a feed vane pump (max 15 bar pressure) and
two cartridge filters (5 µm) in series for the pre-treatment system (see figure 2.10). The rigs can be
plugged into any standard 220 V power supply. Spiral wound RO membranes were then requested
from membrane suppliers for comparative testing. Spiral wound RO membranes were generously
donated by Toray (TR702540HF and FR702540) and Dow Filmtec (XLE2521). The RO test rigs were
run in parallel to ensure a representative feed to each membrane. The feed to the test rigs was either
from the MBR permeate tank or from the O3/GAC permeate tank. The RO permeate from individual
test rigs was then captured and fed as a batch process to the UV radiation unit. The UV unit process
could not be run continuously with the RO test rigs because of a mismatch in the flow rates. The UV
unit has a far greater flow rate (4 m3/h) than the RO test rig (1 m3/h).
Figure 2.10: RO Membrane Test Rigs Operating in Parallel
No chemicals were used upstream of the NF and RO membranes to adjust pH or as an antiscalant.
For the continuous flow NF and RO spiral wound experiments, the Silt Density Index (SDI) was

28
measured after the MBR and GAC units and before the NF and RO membranes. The SDI was
consistently at an SDI < 3, which was within the manufacturer’s specification.
2.7 THE MBR-RO-UV/H2O2 TREATMENT SYSTEM
UV pilot tests were conducted on pre-treated (MBR-RO) waste water. The feed water quality during
the different tests is shown in table 2.3.
Table 2.3: Feed Water Quality from MBR-RO Treatment Train
Date pH TOC TDS Turbidity
25-10-12 7.05 0.82 197 0.49
26-10-12 7.81 0.81 174 0.39
2.7.1 Description of the UV/H2O2 Unit
The stainless steel pilot UV unit (200–4000 l/h) was equipped with between three and ten Hg lamps
(figures 2.11 and 2.12). The power of each lamp is 100 W and the UV intensity is 26 mJcm-2.

29
Figure 2.11: Schematic Depiction of the Pilot UV Unit
Figure 2.12: UV Pilot Unit showing: Recirculation Feed Tank, UV Lamps (x10) and Pump
2.7.2 Experimental Methodology
Testing for the effect of UV/H2O2 was carried out by testing the UV absorbance of the water after each
process, using a UV spectrophotometer. The UV tests were done at different wavelengths for analysis
of different organic content.
• Absorption at the following wavelengths was performed:
- UV210 – enables detection of most of the organic compounds such as aldehydes, carboxylic
acids, esters and nitrites.
- UV254 – is characteristic of aromatic molecules.
- UV280 – is mainly used to detect proteins.
• Reagents
- Laboratory grade reagents were used: H2O2 (50%).
• Flow through experiments – UV radiation unit.
H2O2 was dosed to water in the recirculation tank to the UV/H2O2-pilot unit (as shown in figures 2.11
and 2.12). For the first set of tests the water was passed through the UV unit without addition of H2O2
and then different concentrations of H2O2 were added for optimisation purposes. Samples were
collected at 30 minute intervals for both experiments, for studying the behaviour of the processes with
time.

30
2.8 SAMPLING AND SAMPLE PREPARATION
Sampling
Three sets of grab samples were collected from sampling points. Grab samples were collected, as
opposed to composite samples, since the study focuses on treatment process efficiency and not on
pollutant loads. Moreover, the balancing tanks allow a steady flow rate along the advanced treatment
train and variations in water quality were not expected to occur while sampling. For TOC analysis,
samples were collected into 2 litre plastic bottles, as well as 500 ml bacto bottles (containing 1%
sodium thiosulphate to prevent reactions occurring) for microbial analysis. All bottles were rinsed
three times with the water to be sampled before filling.
The EDC sample collection was as per the recommended procedure (Swart and Pool, 2007). Glass
bottles (250 ml) were sequentially: washed with detergent, rinsed with running tap water, rinsed four
times with distilled water and finally rinsed with 25 ml HPLC grade ethanol (99.5% purity, from Merck).
The inverted bottles and caps were allowed to dry on a drying rack. The head of the bottle was
covered with foil before the cap was screwed on. In the absence of amber bottles, the clear glass was
covered with foil. Collected water can be stored for 3 days at 4 oC. No additions to the sample were
required. The samples, packed with ice packs in a cooler box and protected from light, were couriered
the same day to the testing laboratory. On arrival, they were stored at 4 oC prior to analysis (which
occurred within a week).
A list of the analytical instrumentation used by Umgeni Water in their Burger Street head office
laboratory is provided in annexure B-D.
2.8.1 EDCs – Preparation of the Stock Standard
17-α-ethinylestradiol, estrone and testosterone were purchased from Sigma-Aldrich (via local agents,
Capital Lab Supplies). The purity of the EDCs was ≥ 98% for 17-α-ethinylestradiol, ≥ 99% for estrone
and ≥ 99% for testosterone. The solvent dimethyl sulfoxide (DMSO) was purchased from Radchem
Laboratory Suppliers with ≥ 99.5 % purity.
2.8.1.1 EDC Stock Standard (20 mg/l)
Table 2.4: Preparation of 20 mg/l EDC Stock Standard
Reagent Mass
17-α-Ethinylestradiol 0.0058g
Estrone 0.0056g
Testosterone 0.0051g
Each of these reagents was dissolved in a 250 ml volumetric flask using DMSO by sonication and
stored in a cold room at ± 4 ºC. Each standard was prepared fresh at least every month.
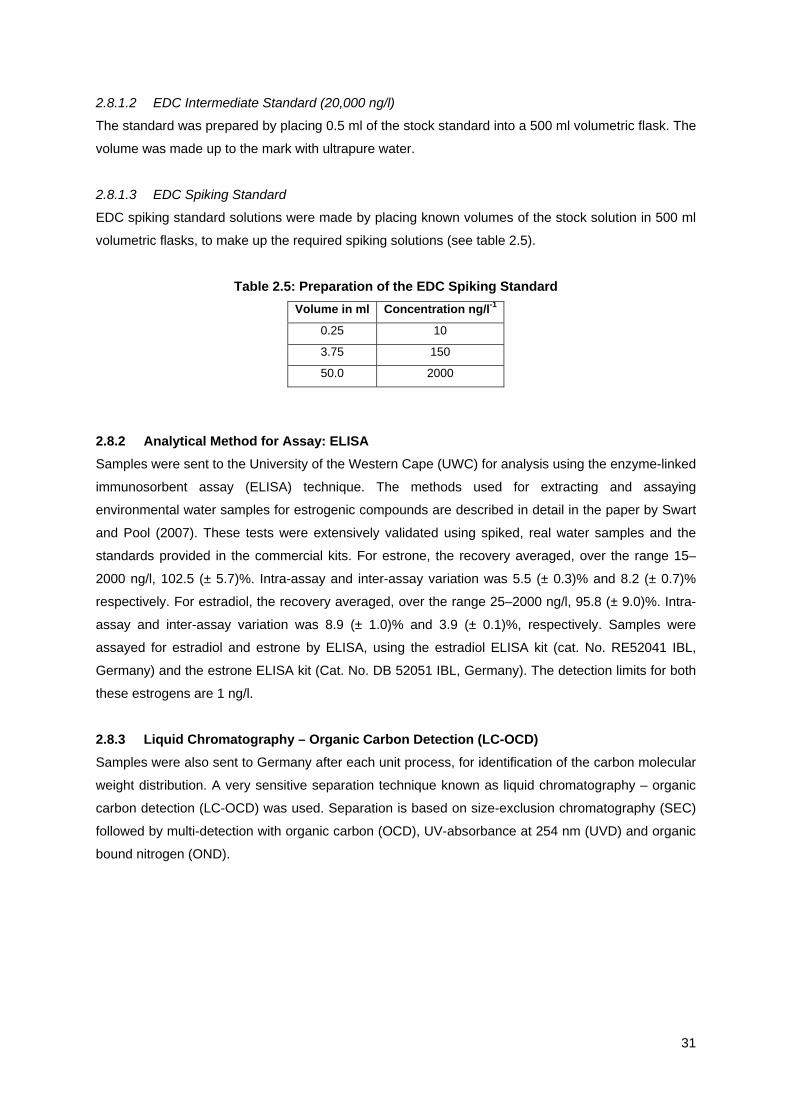
31
2.8.1.2 EDC Intermediate Standard (20,000 ng/l)
The standard was prepared by placing 0.5 ml of the stock standard into a 500 ml volumetric flask. The
volume was made up to the mark with ultrapure water.
2.8.1.3 EDC Spiking Standard
EDC spiking standard solutions were made by placing known volumes of the stock solution in 500 ml
volumetric flasks, to make up the required spiking solutions (see table 2.5).
Table 2.5: Preparation of the EDC Spiking Standard
Volume in ml Concentration ng/l-1
0.25 10
3.75 150
50.0 2000
2.8.2 Analytical Method for Assay: ELISA
Samples were sent to the University of the Western Cape (UWC) for analysis using the enzyme-linked
immunosorbent assay (ELISA) technique. The methods used for extracting and assaying
environmental water samples for estrogenic compounds are described in detail in the paper by Swart
and Pool (2007). These tests were extensively validated using spiked, real water samples and the
standards provided in the commercial kits. For estrone, the recovery averaged, over the range 15–
2000 ng/l, 102.5 (± 5.7)%. Intra-assay and inter-assay variation was 5.5 (± 0.3)% and 8.2 (± 0.7)%
respectively. For estradiol, the recovery averaged, over the range 25–2000 ng/l, 95.8 (± 9.0)%. Intra-
assay and inter-assay variation was 8.9 (± 1.0)% and 3.9 (± 0.1)%, respectively. Samples were
assayed for estradiol and estrone by ELISA, using the estradiol ELISA kit (cat. No. RE52041 IBL,
Germany) and the estrone ELISA kit (Cat. No. DB 52051 IBL, Germany). The detection limits for both
these estrogens are 1 ng/l.
2.8.3 Liquid Chromatography – Organic Carbon Detection (LC-OCD)
Samples were also sent to Germany after each unit process, for identification of the carbon molecular
weight distribution. A very sensitive separation technique known as liquid chromatography – organic
carbon detection (LC-OCD) was used. Separation is based on size-exclusion chromatography (SEC)
followed by multi-detection with organic carbon (OCD), UV-absorbance at 254 nm (UVD) and organic
bound nitrogen (OND).

32
CHAPTER 3: RESULTS AND DISCUSSION
3.1 INTRODUCTION
The MBR-Ozone/GAC treatment process provided the feedwater for the downstream NF and RO
membrane cells. The MBR-Ozone/GAC treatment step was analysed separately at first as this system
was operational before the membrane units were installed. The MBR-ozone/GAC treatment process is
also a continuous process and therefore lends itself to a greater volume of (daily) records.
The membrane test units were operated as a batch process which requires regular supervision and the
extraction of permeate is slow and time consuming. Results from the membrane units are therefore not
as readily available. Twelve months (April 2012 to April 2013) of almost continuous data is available for
the MBR-Ozone/GAC treatment process. The GAC was operated with the understanding that with time a
biofilm would form on the carbon and the unit would operate as a BAC. The addition of ozone upstream
of the GAC unit would enhance the conversion to a BAC by breaking down organic matter in the
feedwater into more readily biodegradable substances that are a food source for the developing biofilm.
It has been reported (Wang et al., 1995 & Liu et al., 2001) that achieving steady-state biological removal
of organic matter does not take as long as steady-state biofilm formation. The amount of biofilm and the
removal of organic matter do not necessarily correlate. Servais et al. (1994) observed that pilot-scale
GAC filters require 100 days before steady-state removal has been achieved, but Liu et al. (2001)
reported time periods of 20 to 40 days for GAC-sand bio-filters to reach (pseudo) steady-state removal at
20 °C.
3.2 PERFORMANCE OF THE MBR-OZONE/GAC TREATMENT SYSTEM
3.2.1 Water Quality Results
The water quality results for samples taken after MBR, ozonation and GAC unit treatment are 32tabilizat
in table 3.1. The experimental results obtained confirm the efficiency of ozone for wastewater disinfection.
A 93% reduction in average coliform concentration from the MBR feed was achieved. Faecal coliforms
where reduced to zero after ozonation. The performance of ozone disinfection was enhanced by the
quality of the feed water from the MBR, which has very low suspended solids, less than 4 mg/l.
Lazarova et al. (2013) showed that the quality of the effluent impacts on the effectiveness of ozonation
and the dosage requirements. To achieve a 2-log reduction of faecal coliforms the required ozone
dosage varies between 2 and 3 mg/l for tertiary effluents, 6 and 17 mg/l for secondary effluents, and up to
between 25 and 30 mg/l for primary effluents. It was observed that with the decrease of effluent quality
(increase of TSS, COD); the dispersion of experimental results strongly increases.

33
Tab
le 3
.1:
Su
mm
ary
of
MB
R-O
zon
e /G
AC
Wat
er Q
ual
ity
Res
ult
s
MB
R-O
3-
GA
C
M
BR
Ou
t
O3
Ou
t
GA
C O
ut
U
nit
s
Mea
n
Med
ian
S
TD
95
%
Mea
n
Med
ian
S
TD
95
%
Mea
n
Med
ian
S
TD
95
%
Alk
alin
ity
mE
/l 12
2.89
12
5.50
36
.23
17
8.75
12
7.44
12
5.00
41
.39
19
7.40
11
5.59
12
1.00
47
.88
19
0.20
Col
iform
s C
FU
/10
0ml
44.4
8
5.00
11
4.29
18
1.55
2.
81
0.00
8.
18
25.9
5
123.
08
2.00
43
1.83
47
7.40
Col
ipha
ges
PF
U/1
00m
l 5.
60
0.00
25
.77
13
.35
0.
08
0.00
0.
44
0.00
0.
02
0.00
0.
14
0.00
EC
m
S/m
67
.31
66
.00
8.
15
82.3
6
68.7
3
67.3
5
9.64
86
.88
69
.45
66
.85
9.
51
86.2
6
E. C
oli
CF
U/1
00m
l 9.
59
0.00
40
.26
17
.50
0.
04
0.00
0.
19
0.00
0.
04
0.00
0.
19
0.00
NH
3
mg/
l 0.
50
0.50
0.
01
0.50
1.
73
0.50
3.
89
12.2
8
1.32
0.
50
2.96
9.
49
NO
3
mg/
l 9.
51
8.28
5.
27
19.5
2
9.21
8.
03
5.21
18
.93
9.
66
8.32
5.
04
19.0
2
TK
N
mg/
l 3.
03
3.00
0.
28
3.00
3.
02
3.00
0.
13
3.00
3.
00
3.00
0.
00
3.00
SR
P
µg
P/l
1.80
0.
66
2.16
6.
12
1.64
0.
59
1.97
5.
89
1.42
0.
23
1.95
5.
84
TP
µ
g P
/l 2.
03
0.60
2.
31
5.99
1.
61
0.50
1.
86
5.48
1.
49
0.50
1.
81
5.50
TO
C
mg/
l 8.
61
8.56
1.
61
10.8
1
7.39
7.
30
1.60
9.
85
5.15
5.
04
1.68
7.
81
Tur
bidi
ty
mg/
l 0.
32
0.27
0.
18
0.77
0.
39
0.21
1.
26
0.69
0.
25
0.21
0.
12
0.50
pH
mg/
l 7.
45
7.44
0.
24
7.80
7.
58
7.58
0.
39
7.88
7.
50
7.48
0.
20
7.78
TD
S
mg/
l 27
5.77
24
5.00
16
2.94
55
4.40
21
0.65
14
8.50
12
9.30
45
1.25
20
4.73
15
2.50
14
0.86
49
4.00

34
These results from Lazarova et al. clearly demonstrate the need for tertiary filtration, not only in order to
decrease ozone dosage requirements, but also to consistently meet stringent regulations, avoiding the
shielding impact of suspended solids, which can greatly influence the residual coliform concentration.
The water quality results were good, with some exceptions. The median results after the GAC process
were 0.21 NTU for turbidity, 0.5 mg/l for total phosphorous (TP) and 5.0 mg/l for total organic carbon
(TOC). Pathogen removal was excellent with median E.coli results of zero CFU/100ml and median
coliphage results of zero PFU/100ml.
Graphical representations of some of the monitored determinands are given in figures 3.1 to 3.3, and are
discussed in the sections which follow. The coliform results were unexpectedly high (477 CFU/100ml at
the 95th percentile), which may be a result of breakthrough of microbiological growth associated with GAC
fines released from the filter medium. A major concern with the use of GAC filters optimised for
microbiological growth is the potential introduction of microorganisms to the distribution system in this
way (Morin et al., 1996). Carbon fines with large surface areas would be able to carry bacteria and to
optimise the colonisation of the biofilms by the coliforms they transport. The protection conveyed to
bacterial cells by their attached state may allow them to pass through the disinfection barrier
(LeChevallier, 1990) without being severely injured and therefore to reach the biofilm under conditions
that may increase their capacity for colonisation (Morin et al., 1996). Nitrate levels are high with average
values of 9.5 mg/l and 19.5 mg/l at the 95th percentile in the MBR permeate. As ozonation and GAC are
not expected to remove nitrate these values stay relatively constant throughout the process. These high
nitrate values are indicative of a poor denitrification process in the anoxic zone of the Toray pilot plant.
The biological process suffers from the lack of an effective anoxic zone.
Figure 3.1: MBR Permeate (May–Nov 2012)
0.0
5.0
10.0
15.0
20.0
25.0
NH3 NO3 SRP TP TOC
mg
/l

35
Figure 3.2: Ozonation Permeate (May–Nov 2012)
Figure 3.3: GAC Permeate (May–Nov 2012)
3.2.2 Ammonia (NH3) and Nitrate (NO3)
Figure 3.1 illustrates that ammonia is being effectively removed by the activated sludge process and in
the MBR process, through nitrification. It also illustrates that the denitrification process is not operating
that well with average nitrate values of almost 10 mg/l. As ozonation and GAC are not expected to
remove nitrate these values stay relatively constant throughout the process (figures 3.2 and 3.3). The
poor performance of the denitrification process was attributed to over oxygenation of the anoxic zone as
the recycle from the membrane tank is highly aerated. At levels > 6 mg/l the nitrate concentrations would
not meet the target water quality objectives. This is, however, not of immediate concern as on a full scale
plant the inclusion of an anaerobic zone before the anoxic zone would provide better conditions for
denitrification.
0.0
5.0
10.0
15.0
20.0
25.0
NH3 NO3 SRP TP TOC
mg
/l
0.0
5.0
10.0
15.0
20.0
25.0
NH3 NO3 SRP TP TOC
mg
/l

36
3.2.3 Soluble Reactive Phosphate and Total Phosphate
There is no SANS 241: 2011 drinking water standard for TP; therefore, the Darvill Wastewater Works
discharge standard of 1.5 mg/l was used for operational comparison. From figures 3.1 to 3.3, it can be
seen that TP decreases through the process from MBR to GAC. Final average TP results are 1.49 mg/l in
the GAC permeate. SRP, which is a more important determinand environmentally because of its impact
on eutrophication, is much lower with an average SRP value of 0.9 mg/l (figure 3.1).
3.2.4 Total Organic Carbon
The average TOC in the MBR permeate is 8.6 mg/l, and in the O3/GAC permeate it is 5.1 mg/l. This
represents a TOC percentage removal of 41%. This removal percentage is similar to that achieved at the
New Goreangab Reclamation Plant, as reported by Menge et al. (2009), for the GAC unit (45%).
Ozonation had far less impact on TOC (figure 3.2), which may indicate that the organics are being broken
down but not mineralized. No quantifiable difference in performance over time was identified in terms of
TOC removal. Therefore the transformation of the GAC to a BAC once a biofilm has formed appears to
have no impact on TOC removal (figure 3.3). This has been confirmed by research by Najm et al. (2005),
which showed that DOC and AOC removal three months after replacing a GAC-sand media was the
same as was achieved after one year of operation.
3.2.5 UV254
The absorption of ultraviolet light at wavelength 254 nm is used as an indicator of the presence of double
bonds, aromaticity and molecules with high molecular weight (Theron-Beukes et al., 2008). The results
for UV254 are excellent and are below the limit for final water at the NGRP of 0.065 UV254 /cm. (The UV254
results are not presented graphically).
3.2.6 Conductivity
The conductivity measured in mS/m is consistently below the SANS 241: 2011 drinking water standard of
170 mS/m. (The conductivity results are not presented graphically).
3.2.7 Microbial Content
Average coliphage and E.coli values were 5.6 CFU/100ml and 9.6 PFU/100 ml in the MBR permeate,
compared to zero median values in both cases. These high values were unexpected and do not mirror
the performance of the pilot plant in the past. The relatively poor performance in removing micro-
organisms did, however, provide an opportunity for other downstream processes to be tested more
thoroughly. Both ozonation and GAC proved extremely effective at removing coliphages and E.coli with
zero CFU/100 ml at the 95th percentile. Coliform values in the MBR permeate (181 CFU/100 ml at the
95th percentile) were usually relatively high, but these were reduced markedly by ozonation to 26
CFU/100 ml at the 95th percentile. The count increased substantially in the GAC permeate to 477
CFU/100 ml at the 95th percentile, possibly due to breakthrough of bacteria from the GAC columns.

37
3.2.8 Turbidity
The median turbidity value of the MBR permeate is 0.27 NTU and this dropped to 0.21 NTU in the GAC
permeate.
3.2.9 Summary
The ozone/GAC unit processes performed well in terms of reducing those determinands which these
processes are expected to reduce, as can be seen by the fact that TOC is reduced on average by 42%
and UV254 by 73%. Limited DOC removal (<14%) was observed in the ozonation stages showing that
oxidation leads to the formation of transformation products rather than mineralization. This result is
supported elsewhere in work undertaken by Reungoat et al. (2012), who showed similar limited
reductions (<10%) in DOC, following ozonation. Menge et al. (2009) reported that DOC was reduced by
only 5% following ozonation, at the Goreangab reclamation plant. Both studies reported that subsequent
BAC filtration removed between 20 and 50% of the DOC. Results at Darvill show that 42% of TOC was
removed after the ozone/GAC process step. The assumption is that the Darvill GAC has been operating
as a BAC as it takes between 60–100 days for biofilm to form on the carbon.
Ozonation causes structural changes to natural organic matter (NOM) and particularly to the humic
fractions. The changes include a strong and rapid decrease in colour and UV absorbance due to a loss of
aromaticity and depolymerisation, a small reduction of TOC (e.g. 10% at 3 mgO3 mgC-1), a slight
decrease in the high apparent molecular weight fractions, and a slight increase in the smaller fractions.
This was confirmed by Liquid Chromatography–Organic Carbon Detection (LC-OCD) analyses where the
high apparent molecular weight fraction decreased from the MBR (409 g/mol) to 375 g/mol after
ozonation.
In terms of the USEPA Disinfectants/Disinfection By-products Rule, D/DBPR (1st stage), the ozonation
and GAC treatment steps worked effectively. The O3/GAC treatment removes, on average, 40% of the
TOC, which is as expected for feed water with an alkalinity of approximately 120 mEq/l and a TOC of
approximately 8 mg/l (Table 1.13, Techneau, 2006). The feed water alkalinity from the MBR plant to the
Ozone /GAC unit is on average 123 mg/l CaCO3 and the TOC is 8.6 mg/l and therefore the 42%
reduction in TOC is as expected.
Micro-biological contaminants such as E.coli and coliphages were generally entirely removed and both
recorded zero median values. The median turbidity was also low at < 0.21 mg/l.

38
3.3 PERFORMANCE OF THE MBR-O3/GAC-NF1, 2, 3, 4, 5 & 6 FLAT SHEET SYSTEM
3.3.1 Water Quality Results
In this section, results from the MBR-O3/GAC-NF treatment train are presented. A UV radiation treatment
step was not included. Six nanofiltration membranes (ESNA LF2, SR 90, Nano SW, NF 90, UTC 60A and
NF 270) were compared in the MBR-O3/GAC-NF process train. Comparison was made in terms of crucial
contaminant removal with reference to drinking water standards and UV absorbance at 210, 254 and 280
nm. Preliminary results showed that contaminant removal efficiency depended on the membrane pore
size with tighter NF 90 and ESNA1 LF 2 membranes having the highest rejection. The average TOC
removal for all the investigated membranes was below 1 mg/l. However, removal of nitrates and total
dissolved solids varied with pore size, with removal efficiency decreasing in the order: ESNA LF2, NF 90,
Nano SW, SR 90, NF 270 and UTC 60A. UV210 absorbance removal was low in all the membrane
permeates, indicating a pass though of smaller organics such as aldehydes, carboxylic acids and esters
among others.
In general, product water from tighter NF membranes (NF 90 and ELSNA LF2) met drinking water
standards, making MBR-O3/GAC-NF a viable process choice for water reclamation. The permeate water
quality results from the NF membrane tests are presented in the following sections. All filtration
experiments were run at a cross-flow rate of 30 l/h, which translates to a cross-flow velocity of 0.08 m/s,
and a constant temperature of the feed solution of 20 (±0.5) °C, controlled by a circulating heater/chiller.
Pressure was also held constant at 10 bars except where it was the variable to be examined. The
average flux rate for new membranes, at the above mentioned operating conditions, was 113 lmh.
Permeability and flux rate decreased with time as fouling occurred, but was restored after cleaning as
illustrated in figure 3.4, and tables 3.2–3.5.
Figure 3.4: NF Flat Sheet Permeability (lmh/bar)
0.00
4.00
8.00
12.00
16.00
20.00
NF 90 UTC 60 A NF 270 SR 90 ESNA 1 LF 2 Nano sw
Perm
eabi
lity
(lmh/
bar)
Membrane
New
Fouled
Cleaned

39
Table 3.2: NF Flat Sheet Permeability
Permeability (lmh/bar)
Membrane New Fouled Cleaned
NF 90 9.03 5.33 7.82
UTC 60A 9.65 8.57 10.87
NF 270 12.89 10.66 15.63
SR 90 10.32 9.75 11.35
ESNA 1 LF 2 8.21 5.93 9.33
Nano SW 6.24 6.58 8.38
Table 3.3: NF Flat Sheet Membrane Flux Rate Change
Virgin membrane Fouled membrane Cleaned membrane
Pressure (bars) Vol (ml) Flux(lmh) Vol (ml) Flux (lmh) Vol (ml) Flux (lmh)
NF 90
5 3.9 46.8 2.5 30 3.5 42
10 7.6 91.2 4.1 49.2 6.5 78
15 11.2 134.4 6.8 81.6 9.7 116.4
UTC 60A
5 2.15 51.6 1.8 43.2 2.1 50.4
10 4 96 3.5 84 4.6 110.4
15 6 144 5.4 129.6 6.8 163.2
NF 270
5 2.8 67.2 2.5 60 3.5 84
10 5.4 129.6 4.1 98.4 6.5 156
15 8 192 6.8 163.2 9.7 232.8
SR 90
5 4 48 4.1 49.2 5 60
10 8.9 106.8 7.8 93.6 9.6 115.2
15 12.8 153.6 12.4 148.8 14 168
ESNA
5 3.8 45.6 3.1 37.2 4.8 57.6
10 6.9 82.8 5.1 61.2 8 96
15 10.1 121.2 7.1 85.2 11.2 134.4
Nano SW
5 2.8 33.6 3 36 3.1 37.2
10 5.1 61.2 5.7 68.4 7 84
15 7.8 93.6 8 96 10.6 127.2

40
Tab
le 3
.4:
NF
Su
mm
aris
ed P
erm
eate
Wat
er Q
ual
ity
Res
ult
s
MB
R-G
AC
-NF
1, 2
& 3
NF
SR
90 (
NF
1) D
ow
Film
tec
NF
ES
NA
1-L
F2
(NF
2)
Hyd
ran
auti
cs
NF
NA
NO
SW
(N
F3)
Hyd
ran
auti
cs
U
nit
s M
ean
M
edia
n
ST
D
95%
Mea
n
Med
ian
S
TD
95
%M
ean
M
edia
n
ST
D
95%
Alk
alin
ity
mE
/l 27
.75
26
.90
15
.51
58
.85
12.4
1
10.0
0
4.36
20
.42
20.9
0
19.2
0
11.4
2
41.7
0
Col
iform
s C
FU
/100
ml
129.
91
28
.00
26
4.3
7
699.
30
181.
39
12
.00
86
5.3
4
178.
50
84.4
1
15.0
0
289.
77
25
2.6
0
Col
iph
ages
P
FU
/100
ml
0.00
0.
00
0.00
0.
000.
00
0.00
0.
00
0.00
0.00
0.
00
0.00
0.
00
EC
m
S/m
25
.77
24
.20
5.
79
36.3
75.
24
3.73
3.
66
13.1
620
.26
19
.15
6.
32
33.3
2
E. C
oli
CF
U/1
00m
l 0.
00
0.00
0.
00
0.00
0.23
3.
73
1.10
0.
550.
07
0.00
0.
37
0.00
NH
3
mg/
l 1.
05
0.50
1.
47
5.07
0.66
0.
50
0.42
1.
560.
98
0.50
1.
20
3.48
NO
3
mg/
l 8.
55
7.49
4.
91
17.6
21.
71
1.12
1.
39
4.35
8.51
7.
76
5.01
16
.93
TK
N
mg/
l 3.
11
3.00
0.
51
3.71
3.00
3.
00
0.00
3.
003.
00
3.00
0.
00
3.00
SR
P
µg
P/l
0.10
0.
10
0.00
0.
100.
10
0.10
0.
00
0.10
0.10
0.
10
0.00
0.
10
TP
µ
g P
/l 0.
50
0.50
0.
00
0.50
0.88
0.
50
2.12
0.
500.
50
0.50
0.
00
0.50
TO
C
mg/
l 0.
75
0.70
0.
16
1.08
0.72
0.
70
0.10
0.
840.
80
0.70
0.
63
0.81
Tur
bidi
ty
mg/
l 0.
22
0.18
0.
16
0.38
0.22
0.
19
0.10
0.
390.
25
0.25
0.
12
0.45
pH
mg/
l 7.
70
7.70
0.
38
8.32
7.40
7.
53
1.06
8.
057.
44
7.42
0.
45
8.13
TD
S
mg/
l 89
.00
89
.00
0.
00
89.0
0

41
Tab
le 3
.5:
NF
Su
mm
aris
ed P
erm
eate
Wat
er Q
ual
ity
Res
ult
s
MB
R-G
AC
-NF
4,
5& 6
NF
90
(NF
4) D
ow
Film
tec
NF
270
(N
F5)
Do
w F
ilmte
c
NF
UT
C60
A (
NF
6)
To
ray
U
nit
s M
ean
M
edia
n
ST
D
95%
M
ean
M
edia
n
ST
D
95%
M
ean
M
edia
n
ST
D
95%
Alk
alin
ity
mE
/l 10
.00
10
.00
0.
00
10.0
0
38.4
5
38.4
5
4.74
41
.47
18
.68
18
.80
5.
00
24.1
0
Col
iform
s C
FU
/100
ml
9.56
5.
00
14.9
1
33.6
0
24.0
0
28.0
0
16.5
4
40.8
0
33.6
7
34.0
0
27.7
6
63.0
0
Col
iph
ages
P
FU
/100
ml
0.00
0.
00
0.00
0.
00
0.00
0.
00
0.00
0.
00
0.00
0.
00
0.00
0.
00
EC
m
S/m
4.
84
3.70
4.
70
9.54
21
.22
24
.40
9.
45
29.6
1
20.3
2
21.2
0
5.04
25
.11
E. c
oli
CF
U/1
00m
l 0.
00
0.00
0.
00
0.00
0.
40
0.00
0.
89
1.60
0.
00
0.00
0.
00
0.00
NH
3
mg/
l 0.
50
0.50
0.
00
0.50
0.
50
0.50
0.
00
0.50
0.
50
0.50
0.
00
0.50
NO
3 m
g/l
2.58
1.
69
2.55
6.
06
9.72
8.
41
2.60
12
.96
9.
37
8.89
2.
72
12.9
6
TK
N
mg/
l 3.
00
3.00
0.
00
3.00
3.
00
3.00
0.
00
3.00
3.
00
3.00
3.
00
SR
P
µg
P/l
0.10
0.
10
0.00
0.
10
0.10
0.
10
0.00
0.
10
0.10
0.
10
0.00
0.
10
TP
µ
g P
/l 0.
50
0.50
0.
00
0.50
0.
50
0.50
0.
00
0.50
0.
50
0.50
0.
00
0.50
TO
C
mg/
l 0.
73
0.70
0.
06
0.88
0.
72
0.70
0.
04
0.79
0.
72
0.70
0.
07
0.82
Tur
bidi
ty
mg/
l 0.
26
0.22
0.
15
0.48
0.
24
0.21
0.
18
0.51
0.
23
0.18
0.
11
0.43
pH
mg/
l 7.
22
7.19
0.
36
7.81
7.
56
7.62
0.
27
7.86
7.
50
7.45
0.
18
7.78

42
These tests were conducted to compare the fouling propensity and ease of cleaning of the flat sheets at
bench scale, hence the operating conditions do not relate to the spiral operating conditions in full scale
applications. This is why the flux rate is far higher than the standard operating flux of about 20 lmh in full
scale plants. The cleaning chemical used was a 0.1 % NaOH solution, and cleaning was done at 1 bar for
15 minutes using a peristaltic pump
3.3.2 Solute Rejection
Solute rejection remains one of the priority reasons for the employment of membrane filtration steps in
reclamation process trains. In this study, the ability of the membranes to reject solutes was evaluated in
relation to TDS, conductivity, alkalinity and nitrates rejection. All the solute rejection experiments, except
for TDS, were conducted over a six month period and the graphed results are the averages over the
period. The NF membranes under consideration were subjected to a feed with total dissolved solids
concentration of 494 mg/l at the 95th percentile. Figure 3.5 shows the variation of the permeate TDS in
the time domain. NF 90 and ESNA1 LF2 had the highest rejection of the dissolved solutes which may be
attributed to their smaller pore sizes (see table 2.1).
Figure 3.5: TDS v Time Plots for the NF Membranes
Though the permeate TDS remained fairly constant with time for most of the membranes, there was a
gradual decrease in the ESNA1 LF2 permeate for the first three hours before leveling off. This could be
due to the combined effect of this membrane’s small pore size and high surface roughness (see table
2.1) which sets in fouling and hence pore restriction at the present operating conditions, which gradually
enhances its TDS rejection.
0
40
80
120
160
200
240
0 60 120 180 240 300 360 420 480
TDS
(mg/ℓ)
Time, mins
NF 270 UTC 60 A Nano sw SR 90 NF 90 ESNA1 LF2
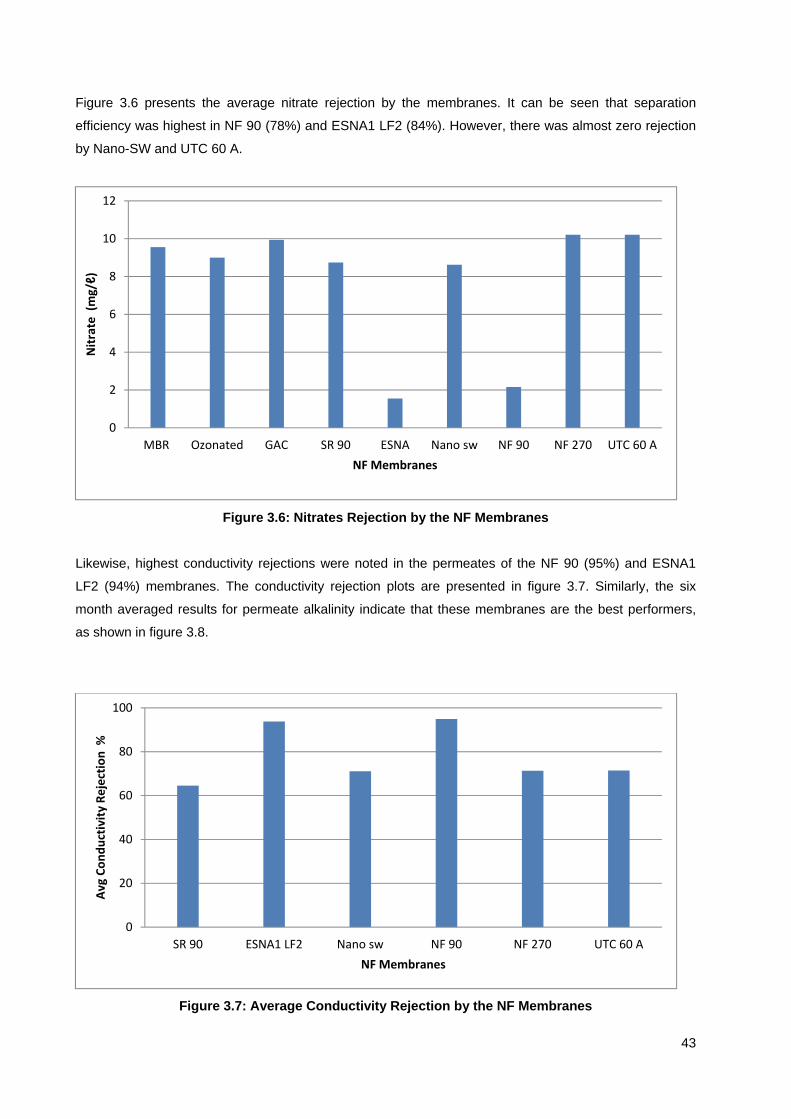
43
Figure 3.6 presents the average nitrate rejection by the membranes. It can be seen that separation
efficiency was highest in NF 90 (78%) and ESNA1 LF2 (84%). However, there was almost zero rejection
by Nano-SW and UTC 60 A.
Figure 3.6: Nitrates Rejection by the NF Membranes
Likewise, highest conductivity rejections were noted in the permeates of the NF 90 (95%) and ESNA1
LF2 (94%) membranes. The conductivity rejection plots are presented in figure 3.7. Similarly, the six
month averaged results for permeate alkalinity indicate that these membranes are the best performers,
as shown in figure 3.8.
Figure 3.7: Average Conductivity Rejection by the NF Membranes
0
2
4
6
8
10
12
MBR Ozonated GAC SR 90 ESNA Nano sw NF 90 NF 270 UTC 60 A
Nitr
ate
(mg/ℓ)
NF Membranes
0
20
40
60
80
100
SR 90 ESNA1 LF2 Nano sw NF 90 NF 270 UTC 60 A
Avg
Cond
uctiv
ity R
ejec
tion
%
NF Membranes
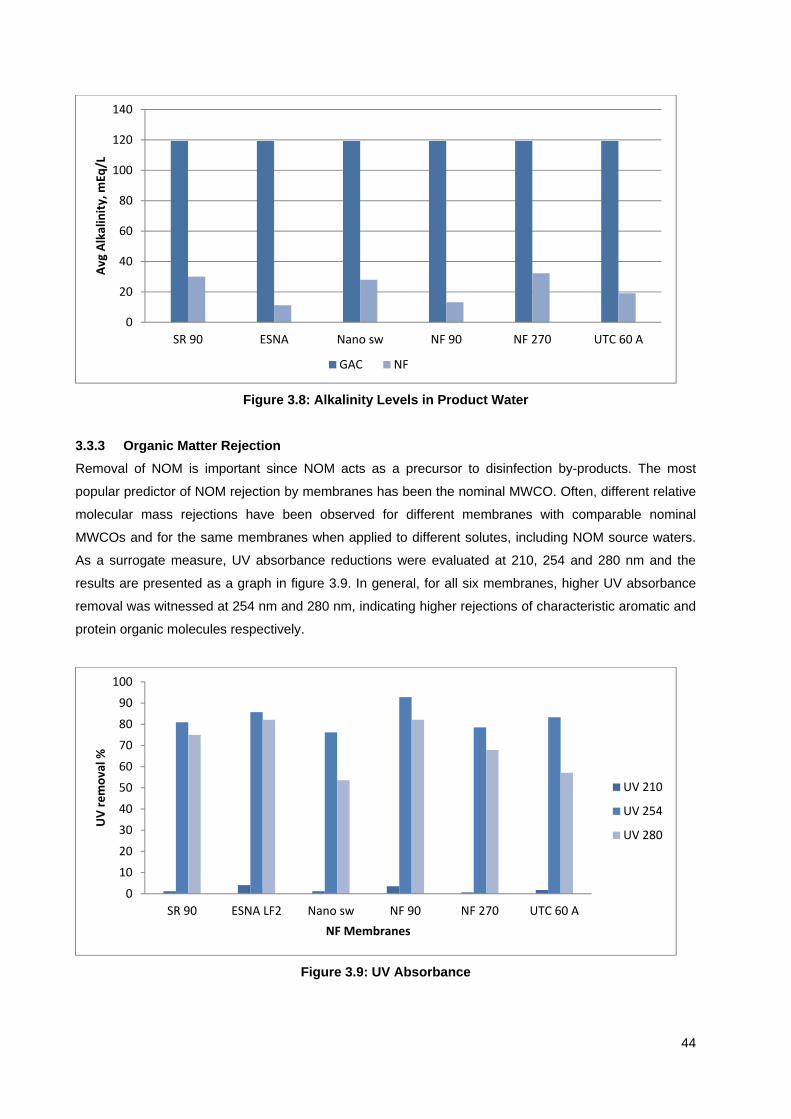
44
Figure 3.8: Alkalinity Levels in Product Water
3.3.3 Organic Matter Rejection
Removal of NOM is important since NOM acts as a precursor to disinfection by-products. The most
popular predictor of NOM rejection by membranes has been the nominal MWCO. Often, different relative
molecular mass rejections have been observed for different membranes with comparable nominal
MWCOs and for the same membranes when applied to different solutes, including NOM source waters.
As a surrogate measure, UV absorbance reductions were evaluated at 210, 254 and 280 nm and the
results are presented as a graph in figure 3.9. In general, for all six membranes, higher UV absorbance
removal was witnessed at 254 nm and 280 nm, indicating higher rejections of characteristic aromatic and
protein organic molecules respectively.
Figure 3.9: UV Absorbance
0
20
40
60
80
100
120
140
SR 90 ESNA Nano sw NF 90 NF 270 UTC 60 A
Avg
Alka
linity
, mEq
/L
GAC NF
0
1020
3040
5060
7080
90100
SR 90 ESNA LF2 Nano sw NF 90 NF 270 UTC 60 A
UV
rem
oval
%
NF Membranes
UV 210
UV 254
UV 280

45
In terms of overall organics rejection, there was insignificant difference between the membranes, as
shown in figure 3.10. From these results, it can be said that organic carbon rejection is not only attributed
to a sieving mechanism but also to other mechanisms such as a charge effect which can intervene in its
rejection.
Figure 3.10: Average TOC Levels
3.3.4 Microbial Content
One of the most critical wastewater contaminants targeted in any reclamation scheme is the microbial
content. Three groups of microorganisms, E. coli, coliphages and coliforms, were analysed in the product
streams of the reclamation units. From the preliminary results, the E. coli and coliphage counts were
consistently zero after the ozonation and GAC processes. However, after the NF process, the coliform
and E. coli counts followed a different trend. There was a noticeable increase in coliforms after
membrane filtration. This was attributed to permeate recontamination after the membranes probably due
to the porous stainless steel membrane support. There were also one or two counts where E. coli was
recorded, though at very low levels (2 CFU/100 ml). These results are suspected as being a result of
contamination during sampling.
3.3.5 Turbidity
Following MBR, turbidity is reduced to < 1 NTU. This value is halved to < 0.5 NTU at the 95th percentile
by all the NF membranes and thus meets the target water quality objective.
3.3.6 Optimal Operating Pressure for ESNA-LF2 and NF 90
A major limitation of membrane application processes is membrane fouling. With cross-flow velocity held
constant at 0.08 ms-1, operating pressures for NF 90 and ESNA1 LF2 were sought at which flux decline
0
2
4
6
8
10
SR 90 ESNA1 LF2 Nano sw NF 90 NF 270 UTC 60 A
Avg
TOC,
mgl
-1
MBR Ozonation GAC NF

46
with time does not occur. At these optimal pressures, dynamic equilibrium is attained where the rate of
solute/foulant deposition on the membrane surface is equivalent to back diffusion/transport. From figure
3.11, it is evident that the optimal pressure for ESNA1 LF2 is about 4 bars. At this pressure, the flux
remained fairly constant with time. NF 90 had a higher optimal pressure of about 7 bars (figure 3.12).
This high pressure is attributed to its lower surface roughness as compared to ESNA1 LF2, hence less
fouling propensity.
Figure 3.11: Effect of Operating Pressure on ESNA1 LF2 Permeate Flux
Figure 3.12: Effect of Operating Pressure on NF 90 Permeate Flux
0
10
20
30
40
50
60
70
0 50 100 150 200
Flu
x, lm
h
Time, mins
15 bars 10 bars 5 bars 4 bars
0
20
40
60
80
100
120
140
5 55 105 155 205 255
Flu
x, lm
h
Time, mins
5 bars
7 bars
8.5 bars
10 bars
15 bars

47
3.3.7 Summary
The effectiveness of nanofiltration in the removal of undesirable components from wastewater in the
MBR, ozonation, GAC and NF process train has been investigated. Among the considered NF
membranes, NF 90 from Dow Filmtec and ESNA1 LF2 from Hydranautics displayed the highest rejection
efficiencies in rejection of inorganic solutes. This was attributed to their smaller pore sizes. However, the
membranes performed very similarly in terms of organics rejection levels and in relation to the other
determinands reported on. From these preliminary investigations, NF 90 and ESNA1 LF2 were found to
be the best performers and hence are proposed for further testing (continuous flow) and use at pilot-
scale.
A benchmark for the performance of the NF-90 membrane as a spiral wound membrane tested under
continuous feed flow conditions was reported on in (Drewes et al., 2005). A two stage membrane
laboratory-scale unit employed two single element (4040 spiral wound) vessels arranged in a two stage
array. The NF-90 membrane achieved similar removal to RO membranes. While providing similar water
quality, the NF-90 membrane can be operated at significantly lower feed pressures. The results suggest
that NF membranes are viable for water reuse projects where a high permeate quality is required
(Drewes et al., 2005).
3.4 PERFORMANCE OF THE MBR-O3/GAC-NF SPIRAL WOUND TREATMENT SYSTEM
3.4.1 Water Quality Results
The flat sheet NF membranes were previously compared (section 3.3) in terms of their product water
quality. The NF90 and ESNA-LF2 membranes were the best performing and therefore these membranes
were targeted for continuous flow testing using spiral wound membranes. Unfortunately, no spiral wound
membranes for these two makes were available from the manufacturers at the time. The only spiral
wound NF membrane that could be obtained was the SR90 Dow Filmtec. The SR90 NF membrane
performed relatively well in the earlier trials so there was no reason why this membrane could not be
used. The spiral wound trials are undertaken to replicate full scale operational conditions to a greater
extent. The flow rate and operating pressure is far higher and the flow rate is continuous. Membrane
performance over time can be tested, specifically in relation to fouling. The permeate water quality from
the MBR-O3/GAC-NF spiral wound treatment train is presented in figures 3.13 and 3.14.
3.4.2 Solute Rejection
The average concentration of NH3, SRP, TP and TOC in the permeate is less than 1 mg/l. The exception
is NO3 which is not removed by NF. The nitrate level exceeds the targeted water quality objective and the
SANS 241 (2011) drinking water limit of 6 mg/l. The high nitrate concentrations are a symptom of the
poor denitrification process in the MBR pilot plant process. In figure 3.14, a sharp reduction in alkalinity of
the GAC effluent from 123 mg/l to average concentrations of 57 mg/l is noticeable due to the ability of NF
to remove divalent ions. Salinity levels are, however, relatively unchanged with the average TDS
concentration in the NF permeate being 206 mg/l. The reduction in alkalinity may make the product water

48
slightly aggressive, but this will be affected by other factors such as hardness, pH, carbon dioxide,
oxidizing agents (e.g. DO) and TDS.
Figure 3.13: MBR-O3/GAC-NF (SR 90) Permeate Water Quality
Figure 3.14: MBR-O3/GAC-NF (Spiral Wound) Permeate Water Quality
3.4.3 Microbial Content
Coliforms, coliphages and E.coli recorded zero after the NF membrane. This proves that the high levels
(699 CFU/100 mg/L) recorded at the 95th percentile in the NF flat sheet membranes were due to
contamination.
3.4.4 Turbidity
Average turbidity is 0.28 NTU and 0.51 NTU at the 95th percentile.
0.01.02.03.04.05.06.07.08.09.0
10.011.0
NH3 NO3 SRP TP TOC
mg/l
0
50
100
150
200
250
300
350
400
450
Alkalinity TDS
mg/
l

49
3.4.5 Summary
The MBR-O3/GAC-NF process produces water of potable quality that meets SANS 241 (2011) drinking
water standards, with the exception of nitrate concentration. It is, however, assumed that with a better
performing biological system, the nitrate concentration can be reduced sufficiently to meet requirements.
This assumption is based on the fact that a full scale plant with a correctly designed anaerobic zone will
provide the necessary conditions for denitrification.
These results should, however, be qualified as follows:
• The duration of the NF/RO spiral wound membrane testing was short (1 week) compared to the
typical operating life of a membrane system and therefore will only provide an indication of
performance. Such short-term experimental work cannot be extrapolated over the life of a full scale
industrial facility.
• The experimental results also reflect membrane performance at the upstream end of a membrane
pressure vessel. The performance may be different at the downstream end of the membrane vessel if
it is affected by the concentration gradient.
• The NF/RO spiral wound membranes were being operated at 30% recovery, which also does not
reflect membrane operation on a full scale plant. In order to test the membranes at much higher
recoveries (70–85%) experiments were run in which the concentrate was recirculated. In this way the
experiments simulated the concentrations that would be experienced by six to eight membranes in
series in a membrane vessel. These recovery experiments are, unfortunately, not yet available.
3.5 PERFORMANCE OF THE MBR-RO FLAT SHEET SYSTEM
3.5.1 Water Quality Results
The MBR-RO-UV process train is intended to mimic the NEWater process train (MF/UF-RO-UV) to a
large extent. The UV radiation unit was not installed for this particular set of results, because the flow rate
obtained from the flat sheet membrane cell is not enough to be used by the high flow rate UV radiation
unit. The MBR-RO final water quality results (tables 3.6 and 3.7) are similar to those that were achieved
with the full MBR-O3/GAC-NF (flat sheet) process train reported on in section 3.3. The degree of efficacy
of this treatment train will become more apparent later in the study when the results from the EDC
sampling and analyses are available. The product water results are presented graphically in figures 3.15–
3.19.

50
Tab
le 3
.6:
Su
mm
ary
of
RO
Per
mea
te W
ater
Qu
alit
y R
esu
lts
MB
R-R
O
M
BR
Per
mea
te
UT
C70
B (
RO
1) T
ora
y
UT
C70
UB
(R
O2
) T
ora
y
U
nit
s M
ean
M
edia
n
ST
D
95%
M
ean
M
edia
n
ST
D
95%
M
ean
M
edia
n
ST
D
95%
Alk
alin
ity
mE
/l 12
6.38
12
5.00
37
.42
195.
00
10.5
6 10
.00
2.40
11
.17
17.6
7 10
.00
32.7
0 21
.10
Col
iform
s C
FU
/100
ml
37.5
3 10
.00
52.3
2 14
8.40
46
.82
10.0
0 15
.69
209.
10
32.3
5 13
.50
43.3
0 12
8.50
Col
ipha
ges
PF
U/1
00m
l 2.
58
0.00
4.
72
11.6
5 0.
00
0.00
0.
00
0.00
0.
00
0.00
0.
00
0.00
EC
m
S/m
68
.35
66.0
0 9.
29
88.1
3 1.
36
0.96
0.
96
3.37
1.
63
1.08
2.
86
3.08
E. c
oli
CF
U/1
00m
l 2.
11
0.00
4.
45
13.2
5 0.
00
0.00
0.
00
0.00
1.
00
0.00
3.
44
6.25
NH
3 m
g/l
1.37
0.
50
3.26
7.
05
0.50
0.
50
0.00
0.
50
0.50
0.
50
0.00
0.
50
NO
3 m
g/l
8.89
8.
26
5.35
19
.22
0.54
0.
50
0.13
0.
83
0.53
0.
50
0.06
0.
66
TK
N
mg/
l 3.
71
3.00
2.
95
7.48
3.
11
3.00
0.
64
3.49
3.
01
3.00
0.
05
3.00
SR
P
µg
P/l
1.68
0.
20
2.13
6.
08
0.10
0.
10
0.00
0.
10
0.10
0.
10
0.00
0.
10
TP
µ
g P
/l 2.
03
0.50
2.
34
6.03
0.
50
0.50
0.
00
0.50
0.
50
0.50
0.
00
0.50
TO
C
mg/
l 8.
40
8.44
1.
84
10.7
4 0.
98
0.70
1.
64
1.00
0.
72
0.70
0.
07
0.78
Tur
bidi
ty
mg/
l 0.
31
0.29
0.
17
0.63
0.
23
0.17
0.
26
0.44
0.
20
0.18
0.
10
0.38
pH
mg/
l 7.
47
7.47
0.
22
7.80
7.
31
7.34
0.
54
7.92
7.
02
7.01
0.
60
7.63
TD
S
mE
/l 14
3.80
13
4.00
39
.74
201.
65

51
Tab
le 3
.7:
Su
mm
ary
of
RO
Per
mea
te W
ater
Qu
alit
y R
esu
lts
MB
R-R
O
M
BR
Per
mea
te
LF
C3
(RO
3) H
ydra
nau
tics
XL
E (
RO
4) D
ow
Film
tec
U
nit
s M
ean
M
edia
n
ST
D
95%
M
ean
M
edia
n
ST
D
95%
M
ean
M
edia
n
ST
D
95%
Alk
alin
ity
mE
/l 12
6.38
12
5.00
37
.42
195.
00
10.0
0 10
.00
0.00
10
.00
10.0
0 10
.00
0.00
10
.00
Col
iform
s C
FU
/100
ml
37.5
3 10
.00
52.3
2 14
8.40
44
.67
24.5
0 40
.70
103.
50
2.60
1.
00
4.22
8.
40
Col
ipha
ges
PF
U/1
00m
l 2.
58
0.00
4.
72
11.6
5 0.
00
0.00
0.
00
0.00
0.
00
0.00
0.
00
0.00
EC
m
S/m
68
.35
66.0
0 9.
29
88.1
3 1.
09
0.95
0.
47
1.92
0.
98
0.83
0.
45
1.73
E. C
oli
CF
U/1
00m
l 2.
11
0.00
4.
45
13.2
5 0.
00
0.00
0.
00
0.00
0.
00
0.00
0.
00
0.00
NH
3 m
g/l
1.37
0.
50
3.26
7.
05
0.50
0.
50
0.00
0.
50
0.50
0.
50
0.00
0.
50
NO
3 m
g/l
8.89
8.
26
5.35
19
.22
0.54
10
.00
0.00
10
.00
0.99
0.
55
1.41
3.
03
TK
N
mg/
l 3.
71
3.00
2.
95
7.48
3.
00
3.00
0.
00
3.00
3.
00
3.00
0.
00
3.00
SR
P
µg
P/l
1.68
0.
20
2.13
6.
08
0.10
0.
10
0.00
0.
10
0.10
0.
10
0.00
0.
10
TP
µ
g P
/l 2.
03
0.50
2.
34
6.03
0.
50
0.50
0.
00
0.50
1.
06
0.50
1.
59
3.43
TO
C
mg/
l 8.
40
8.44
1.
84
10.7
4 0.
72
0.70
0.
06
0.83
0.
70
0.70
0.
00
0.70
Tur
bidi
ty
mg/
l 0.
31
0.29
0.
17
0.63
0.
26
0.24
0.
14
0.50
0.
18
0.17
0.
08
0.31
pH
mg/
l 7.
47
7.47
0.
22
7.80
6.
86
6.70
0.
63
8.04
6.
34
6.27
0.
22
6.65
TD
S
mE
/l 14
3.80
13
4.00
39
.74
201.
65

52
3.5.2 Solute Rejection
Figure 3.15 presents the reduction in alkalinity. Alkalinity is reduced to below the detection limit of 10 mE/l
CaCO3, by all but one of the RO membranes. Ammonia and nitrate (figure 3.16) are reduced to below
1 mg/l by the RO membranes. SRP and TP (figure 3.17) are reduced to below 0.5 mg/l with the exception
of the XLE (Dow Filmtec) membrane. Generally, the RO membranes are shown to be capable of
removing inorganic nutrients to well below the target water quality objectives. The performance of the RO
membranes in terms of salt rejection is illustrated in figure 3.18, with all the membranes achieving greater
than 97% rejection.
Figure 3.15: Average Alkalinity Levels in Product Water
Figure 3.16: Average Nitrate Levels in Product Water
0102030405060708090
100110120
MBR Permeate UTC70B UTC70UB LFC3 XLE
Alka
linity
(m
E/L C
aCO
3)
0.0
1.0
2.0
3.0
4.0
5.0
6.0
7.0
8.0
9.0
MBR Permeate UTC70B UTC70UB LFC3 XLE
Nitr
ate
(mg/
l)
NH3
NO3

53
Figure 3.17: Average SRP and TP Levels in Product Water
Figure 3.18: Average Conductivity Rejection by the RO Membranes
3.5.3 Organic Matter Rejection
The final water TOC (figure 3.19) is lower than the detection limit of 0.7 mg/l as was the case in the MBR-
O3/GAC-NF process train.
0.00
0.50
1.00
1.50
2.00
2.50
MBR Permeate UTC70B UTC70UB LFC3 XLE
SRP
& T
P (m
g/l)
SRP
TP
97.0
97.2
97.4
97.6
97.8
98.0
98.2
98.4
98.6
UTC70B UTC70UB LFC3 XLE
Aver
age
Cond
uctiv
ity R
ejec
tion
(%)

54
Figure 3.19: Average TOC Levels in the Product Water
3.5.4 Microbial Content
Both coliphages and E.coli were removed completed by the RO membranes, with one exception. The
Toray (UTC70UB) membrane returned positive E.coli results in the last four samples taken. The turbidity
(<0.4 NTU) and TOC (<0.7 mg/l) values recorded on these days suggests there was no breakthrough
and that the membrane was intact. This may therefore suggest contamination of some form, of the unit or
in the sampling procedure.
3.5.5 Turbidity
Following MBR, the turbidity is reduced to less than 1 NTU. This value is halved to less than 0.5 NTU at
the 95th percentile by all the RO membranes, and thus meets the target water quality objective.
3.5.6 Summary
The effectiveness of RO in the removal of undesirable components from wastewater, in the MBR, RO
process train has been investigated. Among the considered RO membranes, the XLE from Dow Filmtec
displayed the highest rejection efficiencies (99%) in rejection of inorganic solutes, in line with its
specification (table 2.2). Rejection levels were almost equal for organics and the other determinands
reported on, for all the considered membranes, with the exception of the XLE membrane from Dow
Filmtec, which recorded slightly higher values. From these preliminary investigations, all the RO
membranes would appear to perform equally well for the intended purpose of wastewater reclamation.
0.00
1.00
2.00
3.00
4.00
5.00
6.00
7.00
8.00
9.00
MBR Permeate UTC70B UTC70UB LFC3 XLE
TOC
(mg/
l)

55
3.6 PERFORMANCE OF THE MBR–RO SPIRAL WOUND TREATMENT SYSTEM
3.6.1 Water Quality Results
Three spiral wound RO membranes were used in the continuous process trials. Two membranes
(TR702540HF and FR702540) were provided by Toray, and one by Dow Filmtec (XLE2521). The XLE
membrane was obtained later than the others and, at the time of writing this report, insufficient results
were available to report on. The permeate water quality from the MBR-RO spiral wound treatment train is
presented in figures 3.20 and 3.21.
3.6.2 Solute Rejection
The TR702540HF (SR1) and FR702540 (SR2) permeate water quality data is plotted in figure 3.20. It is
clear that performance is very similar in terms of the removal of solutes. All determinands measured were
removed to within drinking water limits.
Figure 3.20: MBR-O3/GAC-RO (Spiral Wound) Permeate Water Quality
Removal of alkalinity and TDS is almost identical (figure 3.21). High TDS values, above 175 mg/l, are
possibly outliers which occurred in the first week of operation while the process was stabilizing. Results
obtained from the LC-OCD analyses show that MBR-RO results in a 93% removal of DOC which
confirms the TOC results obtained by the Umgeni Water laboratory. The RO membrane reduces DOC
concentration to less than 400 ppb (0.4 mg/l).
0.00
0.50
1.00
1.50
2.00
2.50
SR1N
H3
SR2N
H3
SR1N
O3
SR2N
O3
SR1S
RP
SR2S
RP
SR1T
P
SR2T
P
SR1T
OC
SR2T
OC
SR1N
TU
SR2N
TU

56
Figure 3.21: MBR-O3/GAC-RO (Spiral Wound) Permeate Water Quality
3.6.3 Microbial Content
Coliphages and E.coli median and mean values were zero in the permeate. Coliforms were recorded in
the permeate at 14 and 10 CFU/100 ml at the 95th percentile for SR1 and SR2 respectively. This may
indicate some form of contamination during sampling or some contamination in the unit e.g. in the
permeate line.
3.6.4 Turbidity
Turbidity at the 95th percentile for SR1 and SR2 is 0.5 NTU and 0.4 NTU respectively.
3.6.5 Summary
The MBR-RO process produces water of potable quality that meets the SANS 241 (2011) drinking water
standard.
3.7 THE MBR-RO-UV SPIRAL WOUND WATER QUALITY RESULTS
Trials were initially run without H2O2 to ascertain the impact of UV radiation on organic removal. Trials
were run at increasing strengths of radiation: 14, 27 and 45 mJ/cm2. Hydrogen peroxide was then dosed
at concentrations of 0.3 and 0.6 mg/l respectively.
0
25
50
75
100
125
150
175
200
225
SR1CaCO3 SR2CaCO3 SR1TDS SR2TDS
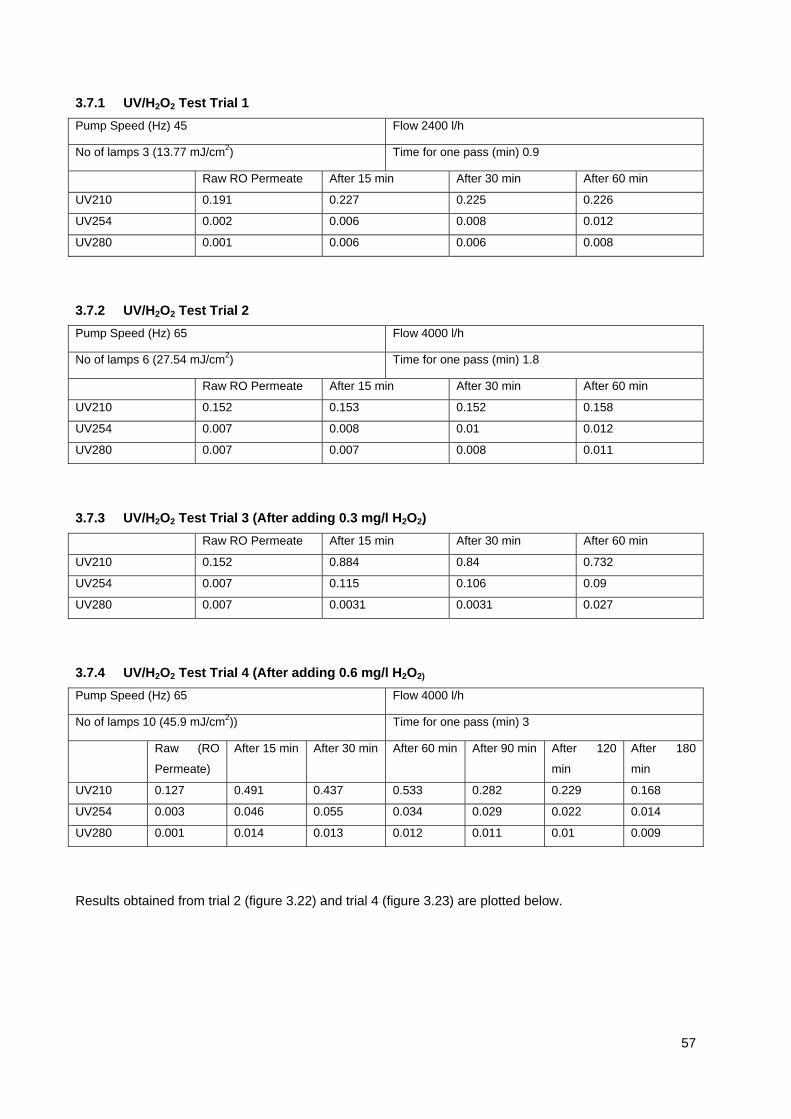
57
3.7.1 UV/H2O2 Test Trial 1
Pump Speed (Hz) 45 Flow 2400 l/h
No of lamps 3 (13.77 mJ/cm2) Time for one pass (min) 0.9
Raw RO Permeate After 15 min After 30 min After 60 min
UV210 0.191 0.227 0.225 0.226
UV254 0.002 0.006 0.008 0.012
UV280 0.001 0.006 0.006 0.008
3.7.2 UV/H2O2 Test Trial 2
Pump Speed (Hz) 65 Flow 4000 l/h
No of lamps 6 (27.54 mJ/cm2) Time for one pass (min) 1.8
Raw RO Permeate After 15 min After 30 min After 60 min
UV210 0.152 0.153 0.152 0.158
UV254 0.007 0.008 0.01 0.012
UV280 0.007 0.007 0.008 0.011
3.7.3 UV/H2O2 Test Trial 3 (After adding 0.3 mg/l H2O2)
Raw RO Permeate After 15 min After 30 min After 60 min
UV210 0.152 0.884 0.84 0.732
UV254 0.007 0.115 0.106 0.09
UV280 0.007 0.0031 0.0031 0.027
3.7.4 UV/H2O2 Test Trial 4 (After adding 0.6 mg/l H2O2)
Pump Speed (Hz) 65 Flow 4000 l/h
No of lamps 10 (45.9 mJ/cm2)) Time for one pass (min) 3
Raw (RO
Permeate)
After 15 min After 30 min After 60 min After 90 min After 120
min
After 180
min
UV210 0.127 0.491 0.437 0.533 0.282 0.229 0.168
UV254 0.003 0.046 0.055 0.034 0.029 0.022 0.014
UV280 0.001 0.014 0.013 0.012 0.011 0.01 0.009
Results obtained from trial 2 (figure 3.22) and trial 4 (figure 3.23) are plotted below.

58
Figure 3.22: UV Disinfection without H2O2 Addition (Trial 2)
Figure 3.23: UV Disinfection with 0.6 mg/l H2O2 Added (Trial 4)
Comparing the graphs above, it can be seen that the UV absorbance is almost constant during UV
disinfection alone (figure 3.22), but with the addition of H2O2, UV absorbance increases then decreases
with time (figure 3.23). Sodium thiosulphate was used in an attempt to stop the reaction of the residual
H2O2, but the attempt failed as the UV readings shot up drastically after the dosing of sodium
thiosulphate.

59
The increase in UV absorbance is influenced by two factors:
1. The breaking down of large organics to smaller ones (oxidation by H2O2)
2. The absorbance of UV rays by H2O2.
It can be seen from trials 1 through to 4 that the UV254 is well below the water quality objective UV254 of
0.065 cm-1. This is because the majority of organics have been removed by the upstream processes and
the water is very clean. The effectiveness of the UV/H2O2 process in improving water quality was
therefore very difficult to measure. The UV/H2O2 water quality, after MBR-RO-UV/H2O2, was sampled and
the water quality results showed no discernible differences with the RO permeate. A decision was
therefore made that no further sampling of the UV/H2O2 permeate would be undertaken. The UV/H2O2
can in the assessment of this study be considered as a precautionary disinfection step (additional barrier)
to protect against possible breakthrough of harmful viruses.
3.7.5 LC-OCD Analyses
UV/H2O2 samples were also sent to Germany for identification of the carbon molecular weight
distribution. A very sensitive separation technique known as Liquid Chromatography–Organic Carbon
Detection (LC-OCD) was used. Separation is based on size-exclusion chromatography followed by multi-
detection with organic carbon (OCD), UV-absorbance at 254 nm (UVD) and organic bound nitrogen
(OND). The additional LC-OCD analyses were necessitated as the RO permeate used as a feed to the
UV/H2O2 is very clean water. There was therefore no meaningful distinction between the RO permeate
water quality results and the UV/H2O2 permeate water quality results, because measurement was beyond
the Umgeni Water laboratory analysis detection limits. The benefits of contaminant removal using
UV/H2O2 could therefore not be assessed.
Results obtained from the LC-OCD analyses show that MBR-RO-UV results in a 93% removal of DOC,
which confirms the TOC permeate results obtained by the Umgeni Water laboratory (<0.7 mg/l). The RO
membrane reduces DOC concentration to less than 400 ppb (0.4 mg/l). This is reduced further by the UV
radiation unit process to less than 250 ppb (0.25 mg/l).The UV radiation achieves this by reducing the low
molecular weight neutrals. This fraction includes alcohols, aldehydes, ketones and amino acids. UV/H2O2
reduces the concentration of organics by approximately 38%.
3.8 ALTERNATIVE PROCESS TRAIN
At the request of the WRC reference group, an alternative treatment train was proposed (MBR-NF-
O3/GAC-UV) and laboratory trials were undertaken to compare the performance in terms of the water
quality produced. The treatment train proposed that the nanofiltration step precede the O3/GAC process
unit, instead of following it, as was the case in previous tests. In a full scale plant there may be a number
of operational advantages to this particular process train. At a laboratory scale these advantages may not
always be apparent or calculable. A comparison of the permeate water quality from this train with the
other process trains can, however, provide some indication of the relative performance.

60
The theoretical advantage of this treatment train is that the NF membranes will reduce the organic load
onto the O3/GAC unit. This has the advantage of reducing the amount of ozone required to break down
complex organic molecules and hence the ozone operating cost should be reduced. Similarly, by
reducing the organic load, the life span of the GAC beds should be increased and operating cost reduced
through extending the carbon regeneration period.
3.8.1 Solute Rejection
The results obtained (figures 3.24 and 3.25) are comparable to the results achieved by the MBR-
O3/GAC-NF-UV process. Nanofiltration does not remove nitrate and therefore the process is dependent
on the activated sludge process in the MBR. As was experienced during the previous operating period,
the denitrification process in the MBR was not operating well and nitrate concentrations in the permeate
do not meet the water quality objective of below 6 mg/l. There was very little difference in the alkalinity
and TDS concentration between the two process trains; average alkalinity (72 mE/l CaCO3) being slightly
higher in the MBR-NF-O3/GAC-UV process than the 57 mE/l CaCO3 concentration obtained in the MBR-
O3/GAC-NF-UV process train. TDS permeate concentrations for the MBR-NF-O3/GAC-UV and MBR-
O3/GAC-NF-UV are 219 and 206 mg/l respectively.
Figure 3.24: MBR-NF-O3/GAC Permeate Water Quality
0123456789
10111213
NH3 NO3 SRP TP TOC
mg/ℓ

61
Figure 3.25: MBR-NF-O3/GAC Permeate Water Quality
3.8.2 Turbidity
Average turbidity of 0.25 NTU and 0.41 NTU at the 95th percentile were recorded.
3.8.3 UV254
Average UV254 is 0.0048 cm-1 and UV254 is 0.0060 cm-1 at the 95th percentile in the permeate. This is
below the water quality objective of 0.065 cm-1.
3.8.4 Microbial Content
Coliphages and E.coli median and mean values were zero in the permeate. Coliforms were recorded in
the permeate at an average of 78 CFU/100 ml, and at 384 CFU/100 ml at the 95th percentile. UV
radiation as the final step in the process will remove excess coliforms but was not run in this trial. The
permeate turbidity was < 0.5 NTU and the UV254 was < 0.065 cm-1. Both of these measurements indicate
clear water with low levels of organic matter present. There should be thus no impediment for the UV
radiation to function as designed and remove microbiological content.
3.8.5 Summary
The MBR-NF-O3/GAC-UV process produces water of a potable quality that meets the SANS 241 (2011)
drinking water standard, with the exception of nitrate. The permeate quality is very similar to the
previously tested MBR-O3/GAC-NF-UV process. As there is no filtration process after the GAC, the
coliform count is relatively high and this is a potential water quality concern. It is, however, expected that
the final UV radiation unit process proposed would achieve a zero coliform count. Operationally, by
placing the NF upstream of the O3/GAC unit, the TOC entering the O3/GAC was reduced from an
average 5.8 mg/l to < 1 mg/l. This allowed the ozone dosage to be reduced from 9 mg/l to 6 mg/l. A
further reduction in the dosage was not possible due to the difficulty of measuring the required ozone
0
50
100
150
200
250
300
350
400
450
Alkalinity TDS
mg/ℓ

62
dosage at lower levels (ozone demand). This reduction in ozone consumption would obviously have a
major financial benefit at full scale. Similar operational benefits may accrue in increasing the time
between carbon regeneration periods, as the substantial reduction in TOC would apply less organic load
onto the carbon.
No calculation was made of the potential economic benefit derived from placing the NF upstream of the
O3/GAC. This analysis is recommended as part of future research, as it was beyond the scope and time
available under the current project.
3.9 EDC REMOVAL RESULTS
3.9.1 Steroid Hormones
The Darvill final effluent and permeate from the advanced water treatment unit processes were analysed
for a selection of commonly occurring steroid hormones and antibiotics. The steroid hormones included
estrone (E1), 17β-estradiol (E2), estriol (E3), 17α-ethinyl-estradiol (EE2), testosterone and progesterone.
Analyses were also carried out for the antibiotics, fluoroquinolones and sulphamethoxazole. Results were
obtained for each of the proposed treatment trains and their efficiency in removing these potentially
harmful compounds was compared. The removal efficiency of the selected treatment trains for each of
these trace organics is illustrated in figure 3.26. Where possible, given constraints on time and cost,
different membranes were used. Hence RO1 and RO2 represent the Toray membranes UTC70B and
UTC70UB respectively. The NF membrane used is the SR 90 from Dow Filmtec.
Figure 3.26: Advanced Treatment – EDC (Steroid Hormones) Removal Percentage
85 86 87 88 89 90 91 92 93 94 95 96 97 98 99 100
Darvill Final Effluent
MBR Permeate
NF Permeate (MBR-NF)
RO Permeate (MBR-RO1)
RO Permeate (MBR-RO2)
NF Permeate (MBR-O3/GAC-NF)
RO Permeate (MBR-O3/GAC-RO1)
RO Permeate (MBR-O3/GAC-RO2)
Estrone 17β-Estradiol Estriol 17α-Ethinyl Estradiol Testosterone Progesterone
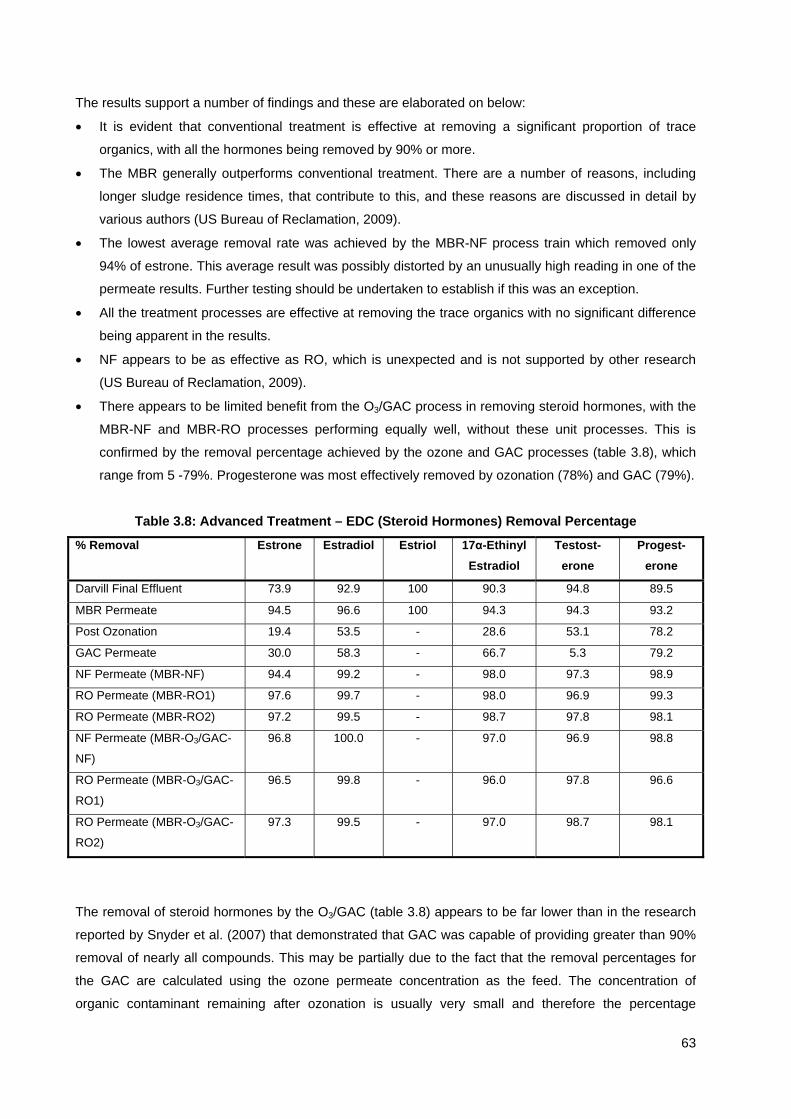
63
The results support a number of findings and these are elaborated on below:
• It is evident that conventional treatment is effective at removing a significant proportion of trace
organics, with all the hormones being removed by 90% or more.
• The MBR generally outperforms conventional treatment. There are a number of reasons, including
longer sludge residence times, that contribute to this, and these reasons are discussed in detail by
various authors (US Bureau of Reclamation, 2009).
• The lowest average removal rate was achieved by the MBR-NF process train which removed only
94% of estrone. This average result was possibly distorted by an unusually high reading in one of the
permeate results. Further testing should be undertaken to establish if this was an exception.
• All the treatment processes are effective at removing the trace organics with no significant difference
being apparent in the results.
• NF appears to be as effective as RO, which is unexpected and is not supported by other research
(US Bureau of Reclamation, 2009).
• There appears to be limited benefit from the O3/GAC process in removing steroid hormones, with the
MBR-NF and MBR-RO processes performing equally well, without these unit processes. This is
confirmed by the removal percentage achieved by the ozone and GAC processes (table 3.8), which
range from 5 -79%. Progesterone was most effectively removed by ozonation (78%) and GAC (79%).
Table 3.8: Advanced Treatment – EDC (Steroid Hormones) Removal Percentage
% Removal Estrone Estradiol Estriol 17α-Ethinyl
Estradiol
Testost-
erone
Progest-
erone
Darvill Final Effluent 73.9 92.9 100 90.3 94.8 89.5
MBR Permeate 94.5 96.6 100 94.3 94.3 93.2
Post Ozonation 19.4 53.5 - 28.6 53.1 78.2
GAC Permeate 30.0 58.3 - 66.7 5.3 79.2
NF Permeate (MBR-NF) 94.4 99.2 - 98.0 97.3 98.9
RO Permeate (MBR-RO1) 97.6 99.7 - 98.0 96.9 99.3
RO Permeate (MBR-RO2) 97.2 99.5 - 98.7 97.8 98.1
NF Permeate (MBR-O3/GAC-
NF)
96.8 100.0 - 97.0 96.9 98.8
RO Permeate (MBR-O3/GAC-
RO1)
96.5 99.8 - 96.0 97.8 96.6
RO Permeate (MBR-O3/GAC-
RO2)
97.3 99.5 - 97.0 98.7 98.1
The removal of steroid hormones by the O3/GAC (table 3.8) appears to be far lower than in the research
reported by Snyder et al. (2007) that demonstrated that GAC was capable of providing greater than 90%
removal of nearly all compounds. This may be partially due to the fact that the removal percentages for
the GAC are calculated using the ozone permeate concentration as the feed. The concentration of
organic contaminant remaining after ozonation is usually very small and therefore the percentage

64
removal by the GAC is small. For example, if percentage removal by the O3/GAC was calculated using
the MBR permeate concentration, the removal for steroid hormones is 43–96% and for antibiotics 94–
95%. These results more accurately reflect those obtained by Snyder et.al. (2007).
3.10 ANTIBIOTICS
Further testing was undertaken to determine the efficiency of the processes in removing other
compounds such as antibiotics. The use of antibiotics is ubiquitous in society today and thus the
likelihood of these substances occurring in wastewater is considered high. Fluoroquinolones represent a
group of substances that are known to be found on a regular basis in wastewater. Similarly,
sulfamethoxazole is also a commonly used antibiotic. Results of testing for their occurrence in Darvill
wastewater, and the efficiency of their removal by the selected treatment processes, are presented in
figure 3.27.
Figure 3.27: Advanced Treatment – EDC (Antibiotics) Removal Percentage
The results support a number of findings and these are elaborated on below:
• It is apparent that activated sludge, whether conventional or in an MBR, is ineffective at removing
these particular antibiotics (<35% removal).
• Ozonation appears to be very effective at removing both compounds (>87% removal).
• Absorption by GAC removes 47% sulphamethoxazole and 66% fluoroquinolones.
• The relative performance of the selected treatment trains appears very similar. All remove the
antibiotic compounds to > 95%.
• There appear to be only small differences in performance between the various membranes, both RO
and NF.
0 10 20 30 40 50 60 70 80 90 100
Darvill Final Effluent
MBR Permeate
Post Ozonation
GAC permeate
RO Permeate (MBR-RO3)
RO Permeate (MBR-RO1)
RO Permeate (MBR-RO2)
NF Permeate (MBR-O3/GAC-NF1)
NF Permeate (MBR-O3/GAC-NF2)
NF Permeate (MBR-O3/GAC-NF3)
Fluoroquinolone (ng/ml) Sulfamethoxazole (ng/ml)

65
3.11 EDC SPIKING
Two solutions, of 200 ng/l and 1,000 ng/l, of three steroid hormones (estrone, 17α-ethinylestradiol,
testosterone) were made up in the Umgeni Water laboratory. The trace organic concentrate was ordered
from a commercial laboratory. The EDC standards made up were decanted into the MBR permeate 1,000
litre jojo tank from where it was automatically pumped to downstream processes. The process trains were
spiked to determine the impact of high concentrations of contaminants that may occur on full-scale plants
as a result of pollution. The results are plotted in figure 3.28. The level of spiking was based on the
average concentrations found in Darvill settled sewage multiplied by five times to mimic possible worst
case scenarios.
The 200 ng/l spiking results illustrated the following:
• Oxidation by ozone removed estrone and ethinylestradiol (98–99%) and testosterone (78%). These
results are supported by those reported by Westerhoff et.al. (2005), where ozone 65tabiliz steroids
containing phenolic moieties (estradiol, ethynylestradiol, or estrone) more efficiently than steroids
without aromatic or phenolic moieties (androstenedione, progesterone, and testosterone).
• The GAC was poor at removing estrone and ethinylestradiol, but was very effective at removing
testosterone.
• The specified process trains were all very successful in removing the trace organic contaminants,
with most achieving removals above 99%.
• There appeared to be no discernible difference in water quality based on the type of membrane used;
the NF membranes performed as well as the RO membranes.
Figure 3.28: EDC (200 ng/l) Spiking – Removal Percentage
0 10 20 30 40 50 60 70 80 90 100
Post Ozonation
GAC permeate
NF Permeate (MBR-NF2)
RO Permeate (MBR-RO3)
RO Permeate (MBR-RO4)
NF Permeate (MBR-O3/GAC-NF4)
Estrone (ng/l) Ethinylestradiol (ng/l) Testosteone (ng/l)

66
The number of samples taken was increased for the 1,000 ng/l spiking trials so that the removal
efficiencies of each of the individual unit processes could also be assessed. For this trial, the GAC
permeate was spiked as well as the MBR permeate, to mimic the situation of contaminant breakthrough.
The results obtained are shown in figure 3.29.
Figure 3.29: EDC (1,000 ng/l) Spiking – Removal Percentage
The 1,000 ng/l spiking results illustrated the following:
• Oxidation by ozone removed estrone and ethinylestradiol (99%) and testosterone (80%). As stated
previously, these results are supported by those reported by Westerhoff et.al. (2005) where ozone
66tabiliz steroids containing phenolic moieties (estradiol, ethynylestradiol, or estrone) more efficiently
than steroids without aromatic or phenolic moieties (androstenedione, progesterone, and
testosterone).
• The GAC was effective in removing both estrone and testosterone. It was less effective in removing
ethinylestradiol, which was the case in the 200 ng/l spiking test.
• All the NF and RO membranes were very effective (>97%) at removing estrone and ethinylestradiol.
All the membrane types removed testosterone less effectively, however; only the NF2 and RO2
membranes achieved a testosterone removal rate greater than 95%. The average removal efficiency
achieved was lower than for the 200 ng/l EDC spike which recorded an average 99%, compared to
97% for the 1,000 ng/l EDC spike.
• The average removal efficiencies for estrone (99%) and ethinylestradiol (99.7%) were the same for
both spiking experiments, indicating that the NF and RO membranes can cope with potential pollution
spikes or breakthroughs from upstream processes.
The spiking trials confirmed that the tested treatment processes were equally effective at removing
EDCs, even when their concentrations were five times the normal concentrations recorded in the Darvill
raw wastewater influent.
70 75 80 85 90 95 100
RO4 Permeate
RO3 Permeate
NF2 Permeate
NF4 Permeate
RO1 Permeate
RO2 Permeate
Ozonated Water
GAC Permeate
NF Permeate (MBR-O3/GAC-NF2)
NF Permeate (MBR-O3/GAC-NF4)
Estrone (ng/l) Ethinylestradiol (ng/l) Testosteone (ng/l)

67
3.12 REMOVAL OF TRACE ORGANICS BY ADVANCED OXIDATION
The advanced oxidation pilot tests were conducted with pre-treated (MBR-RO) wastewater. Hydrogen
peroxide was dosed into the feed water (MBR-RO permeate) upstream of the UV radiation unit. An H2O2
concentration of 5 mg/l was dosed, with varying intensities of UV radiation, in a number of trials, to
determine the impact of these changes on trace organic removal. The feedwater was spiked with two
EDCs (estrone and testosterone) at concentrations as high as 2,000 ng/l. The results of these trials are
detailed in table 3.9 and the percentage removals are given as log removal values (LRV).
Table 3.9: Advanced Oxidation – EDC (Steroid Hormone) Removal
UV Dose (mJ/cm2) H2O2 Dose (mg/l) EDC Spike (µg/l) Estrone (µg/l) LRV Testosterone (µg/l) LRV
50 0 10 0.0098368 3.01 0.017 2.8
100 0 10 0.0028268 3.55 0.006 3.2
200 0 10 0.0017462 3.76 0.005 3.3
50 0 150 0.0439114 3.53 0.133 3.1
100 0 150 0.0376283 3.60 0.128 3.1
200 0 150 0.0296177 3.70 0.093 3.2
50 0 2,000 0.0562038 4.55 0.154 4.1
100 0 2,000 0.076898 4.42 0.144 4.1
200 0 2,000 0.0525207 4.58 0.070 4.5
50 5 10 0.0017363 3.76 0.015 2.8
100 5 10 0.001718 3.76 0.010 3.0
200 5 10 0.0011839 3.93 0.008 3.1
50 5 150 0.0384895 3.59 0.140 3.0
100 5 150 0.0336729 3.65 0.129 3.1
200 5 150 0.033341 3.65 0.107 3.1
50 5 2,000 0.0621717 4.51 0.143 4.1
100 5 2,000 0.0437341 4.66 0.170 4.1
200 5 2,000 0.0361066 4.74 0.139 4.2
The LRVs achieved for both estrone and testosterone at all spiked concentrations were > 3.0. Figures
3.30–3.32 illustrate the impact of dosing H2O2 and increasing the UV intensity from 50 to 200 mJ/cm2.
The figures presented illustrate the following:
• At a trace organic spiked concentration of 10 µg/l (figure 3.30) the log removal efficiency for both
estrone and testosterone increases with increased UV dose, without the addition of H2O2. Similarly,
the removal efficiency increases with increased UV dose with the addition of 5 mg/l of H2O2.
• There is a marked improvement in the removal efficiency of estrone with the addition of 5 mg/l of
H2O2 at a UV dose of 50 mJ/cm2. This is probably due to the creation of a greater concentration of
hydroxyl radicals to assist in the oxidation process. The improvement in performance with the
addition of H2O2 is not as evident at higher UV doses.

68
• Unexpectedly, the opposite trend is evidenced in the removal efficiency of testosterone with the
addition of 5 mg/l of H2O2. The trend is reversed and the removal efficiency decreases with increased
UV dose.
• At trace organic spiked concentrations of 150 µg/l (figure 3.31) and 2,000 µg/l (figure 3.32) the same
result is evident. There is a decrease in removal efficiency with the addition of 5 mg/l of H2O2. This
may suggest that the addition of H2O2 is negatively impacting on the UV radiation performance and
that the H2O2 is absorbing or scattering UV radiation.
Figure 3.30: Removal of EDCs (10 µg/l) by Advanced Oxidation
Figure 3.31: Removal of EDCs (150 µg/l) by Advanced Oxidation
2.002.202.402.602.803.003.203.403.603.804.00
50 100 200
LRV
UV Dose (mJ/cm2)
Estrone & Testosterone Spike (10 µg/ℓ)
Estrone 0 mg/ℓ H2O2 Estrone 5 mg/ℓ H2O2 Testosterone 0 mg/ℓ H2O2 Testosterone 5 mg/ℓ H2O2
2.002.202.402.602.803.003.203.403.603.804.00
50 100 200
LRV
UV Dose (mJ/cm2)
Estrone & Testosterone Spike (150 µg/ℓ)
Estrone 0 mg/ℓ H2O2 Estrone 5 mg/ℓ H2O2 Testosterone 0 mg/ℓ H2O2 Testosterone 5 mg/ℓ H2O2

69
Figure 3.32: Removal of EDCs (2,000 µg/l) by Advanced Oxidation
For reclaimed water systems, the recommended design UV dose is 50 mJ/cm2 for reverse osmosis
effluent. The dosage is intended to provide 4 logs of polio virus inactivation with a factor of safety of about
2. In addition, for RO effluents, the design transmittance is 90 per cent.
From the results presented here it is noticeable that only a marginal improvement is obtained in LRV at
the higher UV dosages of 100 and 200 mJ/cm2. The extra capital and operating expense of UV
equipment capable of dosing at these higher radiation levels may therefore not be justified. Similar
observations are reported by Snyder et al. (2003), who demonstrated diminishing returns with large
increases in UV and H2O2 doses, suggesting that lower doses may provide nearly equivalent contaminant
reduction with less energy and peroxide cost.
When EDCs were spiked at 2,000 µg/l the dose of 50 mJ/cm2 proved to be extremely effective in
achieving LRV > 4 or 99.99% removal. This confirms indicative per cent removals reported in table 1.1,
where advanced oxidation removes > 80 % of steroid hormones. The addition of H2O2 proved not to be
as effective as reported in other research (US Bureau of Reclamation, 2009) and unexpectedly had the
opposite effect, decreasing the removal efficiency.
Advanced oxidation as evidenced by these results is highly effective at removing the steroid hormones
estrone and testosterone, confirming research undertaken previously (US Bureau of Reclamation, 2009).
Advanced oxidation therefore represents an effective final treatment barrier in the proposed reclamation
process treatment train.
3.60
3.80
4.00
4.20
4.40
4.60
4.80
50 100 200
LRV
UV Dose (mJ/cm2)
Estrone & Testosterone Spike (2000 µg/ℓ)
Estrone 0 H2O2 Estrone 5 mg/l H2O2 Testosterone 0 mg/ℓ H2O2 Testosterone 5 mg/ℓ H2O2

70
3.13 SUMMARY
The results show that advanced treatment technologies are very effective at removing contaminants such
as trace organics, to very low levels. Contaminants are removed at > 95% in each of the selected
treatment trains. Contaminants often occur at greater levels in treated potable drinking water despite
rather stringent regulations regarding disinfection and residual disinfectant in distribution systems (Snyder
and Benotti, 2010), because the level of treatment is not as rigorous. Consumers are also more likely to
receive far higher dosages of certain contaminants through the external environment and from their food
sources than from drinking reclaimed water (Stanford et al., 2010).
The organic contaminant levels recorded in this research are so low that only the most sophisticated of
analytical laboratory techniques can detect them. The contaminants are, however, still detectable in some
cases, in extremely small concentrations e.g. ng/l. The WHO does not consider contaminants at this
concentration to be harmful if consumed in drinking water (2008). Concerns still remain, however, over
the possible cumulative or synergistic impact of these contaminants (US Bureau of Reclamation, 2009;
Kumar & Xagoraraki, 2010). For this reason, many experts are proponents of the multiple-barrier
approach which ensures that more than one unit process exists in the treatment train for each set of
contaminants.
The experimental results suggest that streamlined process trains such as MBR-RO (replicating the
Singapore process) or MBR-NF-UV, are equally effective as treatment trains with additional processes,
such as ozonation and GAC (MBR-O3/GAC-NF). Ozonation and GAC have proven to be effective barriers
to CECs from the results achieved in this study and other research, and therefore they do offer added
security and an additional barrier if the engineer wishes to include them.
Although the advanced oxidation unit process was only batch tested during these trials, at full scale this
process will be added to each of the selected process trains. This will have the advantage of adding
another barrier and additional protection against the passage of contaminants. As previously described
and demonstrated by batch experiments undertaken, advanced oxidation is effective at removing a host
of organic contaminants as well as providing disinfection for bacteria and viruses. Hydrogen peroxide /
UV radiation is the most common advanced oxidation process used in reclamation and has the benefit of
reducing the use of chlorine which is known to increase the possibility of disinfection by-products.

71
CHAPTER 4: CONSIDERATIONS FOR WATER
RECLAMATION PLANT DESIGN
4.1 BASIS OF DESIGN
The successful schemes presented in the literature review provide a benchmark for the design of future
indirect and direct potable reclamation schemes. Although similar in many respects, the schemes use
different technologies or combinations of technologies to achieve the same objective and it becomes
difficult to justify which process train is the most suitable. When choosing a process train a number of
factors need to be considered, including: feed water quality, treatment objectives, capital and operating
cost and final water quality.
Four DPR treatment trains have been tested in this project, namely:
• Process A: MBR-RO-UV
• Process B: MBR-O3/GAC-NF-UV
• Process C: MBR-NF-O3/GAC-UV
• Process D: MBR-NF-UV
• Process E: MBR-O3/GAC-UF-UV
Process E was not initially included in the study, but has been subsequently included based on the
research findings. All four trains performed equally well in terms of the final potable water quality
produced. Although there were minor differences in product water quality between the processes, all four
are compliant with the SANS 241 (2011) drinking water standard. The inclusion of two oxidation
processes (ozonation and AOP (UV/H2O2) in processes B & C is for synergistic purposes and not merely
a conservative design approach. While both unit processes have a number of treatment benefits, ozone
is principally applied for oxidation of trace organics and UV is applied for disinfection. The synergistic
benefit is that the ozone provides additional disinfection and increases the water’s ultra-violet
transmittance, both of which will reduce the required UV dosage and thus reduce power requirements
(Schimmoller et al., 2010).
A major project objective is to determine the most economical DPR process train that can produce
drinking water of potable quality. High level pre-feasibility cost estimates have therefore been calculated
for processes A & B. A capital cost estimate was not calculated for process C as the cost was considered
to be approximately the same as that for process B at this level of detail. There may be operating cost
advantages of process C compared to process B but determining these was beyond the scope of this
project.
The capital cost for process D (using NF) was not calculated, as process A (using RO) was considered a
more appropriate design for the following reasons:

72
• NF membranes are more expensive than RO membranes.
• New ultra-low pressure RO membranes are now available and therefore the difference in operating
pressure has narrowed and the electricity cost saving of using NF has reduced.
• Higher salt rejection is achievable with RO membranes making the brine more concentrated and thus
more economical to treat if oceanic disposal in not an option.
• Due to the higher rejection, RO tends to require less membrane area than NF, which in turn lowers
initial capital cost and the membrane replacement budget. This may offset the lower operating
pressure of NF.
• RO membranes have a proven track record in wastewater reclamation giving them an advantage in
terms of their perceived reliability and safety compared to NF membranes.
• RO membranes provide a more complete barrier to organic contaminants e.g. trace organics than NF
membranes. RO membranes also remove nitrate, which NF membranes do not, making the
reclamation plant less reliant on the performance of the secondary biological treatment process to
remove nitrate.
Process Options A and B can be broadly described as:
• A membrane-based process treatment train (process A)
• An ozone/granular activated carbon treatment train (process B)
The membrane-based treatment train can to a large degree be considered a replica of two well-known
wastewater reclamation plants, namely NEWater in Singapore and OCWD in California. Both these
processes use a combination of MF/UF-RO-UV. The MF/UF component of these processes is replaced
by an MBR in process option A for the Darvill design. Process option B is modeled on the ozone/granular
activated carbon treatment train of the Goreangab treatment process in Windhoek.
In setting the treatment objectives for a DPR treatment train the following need to be considered:
• feed water quality
• contaminant removal e.g. CECs
• final water quality.
To ensure the quality of the final product water and the safety of consumers it is advisable to have
multiple treatment barriers. Two or more barriers should be defined for each water quality parameter or
contaminant, so that a high level of safety is built into in the process. Table 4.1 lists water quality
parameters and identifies the associated treatment barriers. The MBR process functions as two treatment
processes combined, namely; activated sludge and ultrafiltration. The activated sludge component of the
MBR process is responsible for nutrient removal and the ultrafiltration for phase separation.

73
Table 4.1: Treatment Barriers
Water Quality Parameter Treatment Barrier
Process A Process B
Suspended Solids 3 = MBR, RO 4 = MBR, GAC, NF
BOD / COD 3 = MBR, RO 4 = MBR, GAC, NF
Nutrients (N,P) 2 = MBR, RO* 2 = MBR, NF*
Microbiological 4 = MBR, RO, UV 5 = MBR, O3, NF, UV
Salinity/Inorganic 1 = RO 1 = NF
Metals 3 = MBR, RO 3 = MBR, NF
Micro-organics 4 = MBR, RO, UV 4 = MBR, O3, GAC, NF, UV
NF/RO* partial barrier
It is noteworthy that with the exception of salinity all the other water quality parameters have two or more
treatment barriers. The removal of salinity by RO is in fact unnecessary in water with a low TDS such as
that encountered at Darvill. NF and RO provide a partial barrier to nitrogen. Integrating MBR, RO and
AOP technologies within a multiple-barrier approach for potable reclamation schemes, provides a robust
treatment train with numerous advantages over other conventional treatments that treat water from
secondary effluents. MBRs provide enhanced removal capabilities for organic matter, nutrients and also
CECs. MBRs also deliver high quality feed to a more restrictive RO barrier. The RO step ensures ultimate
pathogen removal and almost complete organics removal The AOP provides the additional barrier of
CECs’ mineralization as a final polishing step. AOP applications benefit from the lower organic content
and turbidity from an MBR permeate, as well as from the extremely high liquid transmittance and almost
absence of salts after the RO step (Gasull et al., 2014)
Trials using process E (MBR-O3/GAC-UF-UV) are currently being undertaken and it is hoped that these
will continue after the completion of this project. The AOP (UV/H2O2) unit process has been
decommissioned and is not part of the tests. Preliminary water quality results taken after the UF
membrane are good, as would be expected, as the treatment train is the same as for process B (MBR-
O3/GAC-NF-UV). Of particular interest is the final TOC concentration which is < 3 mg/l. This result is
significant as a TOC of < 3 mg/l is the set water quality objective for the New Goreangab Reclamation
Plant.
If the Goreangab TOC standard can be met by process E (MBR-O3/GAC-UF-UV) then this process train
has great potential to be used for the reclamation plant at Darvill WWW. On a full scale plant, the
inclusion of AOP and final chlorination will add additional barriers and factors of safety to the process.

74
4.2 OTHER CONSIDERATIONS
The design and operation of any reclamation scheme should not be planned and managed in isolation
and must take into account a host of other factors. Some of these include:
• environmental factors
• the operating philosophy of the existing wastewater (2nd) treatment works
• buffer storage
• monitoring.
As far as possible the quality of influent (wastewater) entering the wastewater treatment works should be
controlled. Thus discharges to sewers must be regulated and the regulations enforced, to ensure that
there are no unnecessary disruptions to the secondary treatment process. Industrial effluents must be
treated onsite as far as possible or be disposed of within the by-laws of the municipality.
The operating philosophy of the secondary treatment works needs to be geared to providing an
appropriate quality effluent to the reclamation plant. The works needs to be operated as an integrated
system as any disruptions or negative impacts on the secondary treatment works will affect the
reclamation process.
It is advisable to include additional buffer storage after the secondary treatment works to ensure
disruptions in effluent quality can be identified and appropriate action taken. Similarly, a buffer on the
potable side of the reclamation plant enables additional retention time to enable quality control before
release into the distribution system.
Finally, monitoring provides additional protection against failure. Source water, process and treated water
should all be monitored hourly, daily and weekly depending on the objectives. The use of online process
monitoring is standard practice and should be used as a first barrier to potential changes in water quality.
It must, however, not be totally relied upon because of the risk from instrument failure.
4.3 UNIT TREATMENT PROCESS SIZING
4.3.1 Process A: MBR-RO-AOP (H2O2/UV)
4.3.1.1 Membrane Bioreactor
The MBR process sizing was calculated by Koch Puron (annexure B-E) based on the information
provided by Umgeni Water. This included feed water quality, average and peak wastewater work flows
and product water quality requirements. The Koch Puron design is based on their patented UF Puron
membranes which are immersed hollow fibre (out to in) single header membranes. The average or
sustainable flux had previously been calculated during the pilot plant testing at 17 lmh for an immersed
Toray (outside-in) flat sheet membrane. The flux rates achievable with immersed hollow fibre Puron
membranes are much higher and a gross flux rate of 25 lmh and a net flux of 21 lmh were selected.
A membrane surface area of approximately 238 000 m2 will be required to achieve a peak output of 120
Ml/day at a net flux of 21 lmh. The design allows for an N-1 configuration with 12 trains, with 1 train offline

75
for routine maintenance or cleaning. The key design parameters include the net flux, membrane area per
module and number of modules.
• Total installed membranes surface: 237,600 m²
• Number of filtration lines: 12 (N-1)
• Modules per filtration line: 11
• Number of modules: 132 (12 trains x 11 modules per train)
• Module area: 1,800 m² per unit (PSH 1800-44 from Koch Membranes)
• Design continuous operational net flux : 21 lmh
• Water depth : 3.0 meters
• Design MLSS concentration: 8.5 g/l
• Blower design flow : 9680 Nm³/h.
Submerged membranes operate at a suction pressure of between 0.3–0.5 bar. For the purposes of
estimating power consumption, the upper end of power consumption operating at 0.5 bar was used.
Puron operate an RAS recycle of 4:1. In normal operational mode, aeration is applied for between 25–
50% of the operational time at a rate of 0.133–0.3 Nm3/ (m2h).
4.3.1.2 Reverse Osmosis
The RO process sizing was calculated using the Toray DS2 reverse osmosis design software, the results
of which are provided in annexure B-F. The key design parameters include the maximum flux, number of
membranes per module and number of modules.
• Total installed membranes surface: 199,800 m²
• Membrane area: 37 m2
• Number of membranes elements: 5,640
• Number of vessels: 940 (6 elements per vessel)
• Module area: 1,500 m² per unit (TML20D-400 from Toray Membranes)
• Design continuous operational net flux : 16 l/m²h
• Recovery: 88%
• Salt rejection: 99.7%.
A multi-stage RO system, comprising three stages, proved to be the required configuration to achieve the
desired process efficiencies and product water quality. A low fouling brackish water RO element
(TML20N-400) from Toray was used. Mechanical and electrical capital costs are based on the equipment
suppliers’ recommendations from available raw water data. The cost estimate covers core membrane
equipment; intermediate, chemical and CIP tanks; extra piping and valves; 75tabiliza equipment and
pumps; additional electrical and instrumentation required to operate the system. At 88% recovery,
approximately 12 Ml/day of brine with a TDS concentration of 3,776 mg/l will be produced.

76
4.3.1.3 Advanced Oxidation Process (UV/H2O2)
When using RO as part of the treatment process train upstream of UV disinfection, the following
performance criteria apply (NWRI, 2012):
• The design UV dose shall be at least 50 mJ/cm2 under maximum day flow.
• The effluent turbidity shall be equal to or less than 0.2 NTU 95 per cent of the time, not to exceed 0.5
NTU.
• The permeate UV transmittance shall be 90 per cent or greater, at 254 nm.
When using RO for filtration, at least 2 log10 of viruses will be removed through the RO process. 3 log 10
inactivation of polio virus can be achieved with a UV dose of about 30 mJ/cm2; therefore, a design UV
dose of 50 mJ/cm2 is suggested to account for variability in the effluent quality. Using AOP can reduce
the chlorine dose applied for final disinfection, thereby decreasing the levels of DBPs formed. The capital
cost information from existing UV plants was used to calculate a cost estimate.
4.3.2 Process B: MBR-O3/GAC-NF-AOP (H2O2/UV)
4.3.2.1 Ozonation
Ozone addition will precede the GAC filtration process and will be introduced as a gas into contact tanks.
Specialized ozone generating equipment is used to generate ozone from air. Any remaining ozone
requires an off-gas treatment to comply with safety regulations.
The key design parameters include:
• Ozone dosing rate: 6 mg/l
• Contact time: 10 minutes
• Flow rate: 1.16 m3/s
• Contact tank volume: 1,000 m3
• No. of contact tanks: 2.
Ozone at 6 mg/l is dosed into the MBR effluent. The design assumes that ozone has a transfer efficiency
of 85% and therefore 690 kg/day is required.
4.3.2.2 Granular Activated Carbon
Gravity-fed downflow fixed bed GAC filters operating in parallel are proposed. GAC filters require daily
backwash routines to maintain the filtration rate. The final product water can be used for backwashing
that is accompanied by air scouring. The number of GAC filters required is dictated by the EBCT. Filters
will not be available during backwashing or when they are out of service due to carbon regeneration.
The GAC filter key design parameters are listed below:
• No of filters: 20
• Filter size: 4 m x 6 m
• Empty bed contact time : 12 min

77
• GAC media depth: 1.7 m
• GAC media size: D10 = 1.18 mm
• Backwash rate : 30 m/h
• GAC bed expansion: 23%
• Air scour rate : 30 m/h.
4.3.2.3 Nanofiltration
An NF unit operates under pressure. NF prevents material between 1 and 10 nm from passing through
the membrane. The main difference between NF and RO is that NF allows the passage of monovalent
ions such as Na+ and Cl-. The NF process sizing was calculated by Dow Filmtec. The key design
parameters include the net flux, number of membranes per module and number of modules.
• Total installed membranes surface: 237,526 m²
• Number of membranes elements: 6,392
• Number of vessels: 799 (8 elements per vessel)
• Membrane type: NF90-40034i from Dow Filmtec
• Design continuous operational net flux : 21.61 lmh
• Recovery: 70%
• Salt rejection: 85–95%
• Power: 681.17 kW
• Specific energy: 0.16 kWh/m3
A multi-stage NF system comprising two stages proved to be the required configuration to achieve the
desired process efficiencies and product water quality. With a 70% recovery and 95% salt rejection the
TDS concentration is reduced from 458 to 60 mg/l. Mechanical and electrical capital costs are based on
the equipment suppliers’ recommendations from available raw water data. The cost estimate covers core
membrane equipment; intermediate, chemical and CIP tanks; extra piping and valves; 77tabiliza
equipment and pumps; additional electrical and instrumentation required to operate the system.
4.4 CAPITAL AND OPERATING COST ESTIMATE
The basis for the capital cost estimation was as follows:
• Rates for water reclamation plant construction were obtained from recent similar projects and were
adjusted for inflation.
• Material costs for water reclamation plants were obtained from reputable suppliers. Installation costs
were assumed to be a percentage of material costs.
• Unit treatment processes include all civil works, buildings, structures, mechanical equipment and
piping.
• Electricity and instrumentation at a percentage (15 %) of mechanical.
• Provisional and general (P&G) costs are expressed as a percentage (25%) of the base construction
and installation cost.

78
• Contingency was calculated at 10% of total cost.
• The rand/US dollar exchange rate was set at R10.32 and the rand/euro at R13.69, as at August
2013.
Civil, building, structural, mechanical and electrical costs were calculated using costs from previous
similar projects. The costs were then adjusted for inflation. The rand/US dollar exchange rate was used
for the calculation of membrane and component costs.
The following should be noted in terms of the assumptions made in the capital cost estimate:
• The MBR capital cost includes the cost of increasing the capacity of the existing anoxic, anaerobic
and aerobic zones to cater for an ultimate capacity at Darvill WWW of 120 Ml/day. Cost savings will
be achieved by retro-fitting the existing biological reactor with the submerged membrane modules.
• The required upgrades to the bulk electrical power supply at Darvill WWW are common to both
treatment processes and have not been included.
A breakdown of the capital costs for Membrane Treatment Process A and Ozone/GAC Treatment
Process B is given in tables 4.2 and 4.3.
Table 4.2: Capital Cost Estimate for Membrane Treatment (Process A)
Membrane Treatment Process
Plant Size (m3/day) 100 000
CAPEX MBR RO UV
Total Civils R31 528 875 R35 622 103 R553 842
Total Mechanical R222 459 780 R237 480 688 R13 345 601
Ancillary Equipment R27 599 040 R49 870 944 R2 802 576
Electrical & Instrumentation R10 650 000 R35 622 103 R2 001 840
Subtotal R292 237 695 R358 595 839 R18 703 860
P&Gs (25%) R73 059 424 R89 648 960 R4 675 965
Subtotal R365 297 119 R448 244 799 R23 379 825
Contingencies (10%) R36 529 712 R44 824 480 R2 337 982
Subtotal (excl. VAT) R401 826 831 R493 069 278 R25 717 807
Grand Total (excl. VAT) R920 613 916

79
Table 4.3: Capital Cost Estimate for Ozone /GAC Treatment (Process B)
Ozone / GAC Treatment Process
Plant Size (m3/day) 100 000
CAPEX MBR Ozone GAC NF UV
Total Civils R31 528 875 R2 134 692 R6 493 788 R35 622 103 R553 842
Total Mechanical R222 459 780 R10 947 138 R17 053 015 R233 481 664 R13 345 601
Ancillary Equipment R27 599 040 R2 298 899 R3 581 133 R49 031 149 R2 802 576
Electrical & Instrumentation R10 650 000 R1 642 071 R2 557 952 R35 622 103 R2 001 840
Subtotal R292 237 695 R17 022 800 R29 685 888 R353 757 020 R18 703 860
P&Gs (25%) R73 059 424 R4 255 700 R7 421 472 R88 439 255 R4 675 965
Subtotal R365 297 119 R21 278 499 R37 107 361 R442 196 275 R23 379 825
Contingencies (10%) R36 529 712 R2 127 850 R3 710 736 R44 219 627 R2 337 982
Subtotal (excl. VAT) R401 826 831 R23 406 349 R40 818 097 R486 415 902 R25 717 807
Grand Total (excl. VAT) R978 184 986
Costs for stabilization of the product water have not been included as the water will be blended at Umlaas
Road Reservoir with treated water from Midmar waterworks. Therefore the cost of stabilization e.g.
addition of CO2 may be less. The calculation of the impacts on the final water chemistry of blending ratios
is beyond the scope of this project.
The RO membranes reject 99.8% of salts and therefore the RO concentrate will be brackish and contain
salts in the order of 3,700 mg/l. At 88% recovery from 100 Ml/day, the volume of brine produced will be
12 Ml/day. The size of the evaporation ponds required for this volume of waste was calculated as follows:
Total pond area = (Volume to evaporate) / (net evaporation rate)
= 12,000 / 0.0028
= 4,285,714, or 4,300,000 m2 (rounded off)
This pond area could, for example, be divided into 100 ponds of 43,000 m2 each. Provision is made for a
1 meter deep pond, or a year’s storage buffer capacity, in the evaporation ponds to compensate for peak
rainy seasons. Brine from RO systems is classified as “hazardous waste” according to the National
Environmental Management Act (NEMA) of 1998, as mentioned in Regulation 625 of August 2012.
Therefore, an evaporation pond conforming to a Class A waste disposal site (h:H) needs to be
constructed for the evaporation of the brine. A budget estimate for the construction of such an
evaporation pond system for Umgeni Water was obtained from Aquatan by Bigen Africa. The total
construction cost of the brine evaporation ponds amounts to about R450 million.
The RO membrane process treatment train requires less capital expenditure, as would be expected
because it has fewer unit processes; however, the difference in cost is not great. Given that the cost
estimate accuracy is 25%, a refinement of the costs will have to be made to more accurately assess the

80
capital cost of both projects. The operating costs should also be considered when making this
assessment. An alternative treatment option would be to replace the NF membrane with a UF membrane
in the ozone/GAC treatment train. This would reduce the total cost significantly while still meeting the
water quality objectives, as using UF would not produce a hazardous concentrate that requires disposal.
The estimated cost of a treatment train in which the NF is replaced with UF (MBR-O3/GAC-UF-UV) is
R752 million, which is approximately a R196 million saving. This process is very similar to that of the
existing Goreangab Reclamation plant in Windhoek and thus has potential.to meet the design objective of
producing safe potable water. It also replicates the DPR treatment train proposed by Golder & Associates
(2010) for some of the eThekwini reuse projects (see annexure B-G). The only difference in the two
process trains is that in the eThekwini treatment train, MBR is replaced by flocculation and clarification.
The cost per megalitre for the eThekwini reuse plant is estimated as R7.6 million. The total capital cost
for the 100 Ml/day Darvill reclamation plant would therefore be in the order of R761 million, which is very
similar to the previous estimate.
4.5 OPERATION AND MAINTENANCE COSTS
The operation and maintenance cost estimation is derived as follows:-
• The cost of power in 2013 is 73c / kWhr
The annual operation and maintenance cost for the different processes is provided in table 4.4 and table
4.5.
Table 4.4: Operation and Maintenance Cost for MBR-RO-UV
Plant Size OPEX (m3/day) Total OPEX
m3/day Fixed Variable Per day Per m3
MBR-RO-UV 100,000 R0.63 R1.86 R249,755 R2.49
The annual operating cost for 100 Ml/day production is therefore R91,160,611.
Principles
Table 4.5: Operation and Maintenance Cost for MBR-O3/GAC-NF-UV
Plant Size OPEX (m3/day) Total OPEX
m3/day Fixed Variable Per day Per m3
MBR-O3/GAC-NF-
UV
100,000 R0.63 R2.30 R292,790 R2.93
The annual operating cost for 100 Ml/day production is therefore R106,868,476.
The operating cost for the alternative MBR-O3/GAC-UF-UV (Process E) would be less as the pressure to
run UF membranes is less than to run NF membranes.

81
4.6 SUMMARY
The membrane-based process (MBR-RO-UV) would require less capital investment than the ozone /GAC
(MBR-O3/GAC-NF-UV) treatment process, based on the calculations presented. The difference in capital
cost is, however, marginal at this level of accuracy. The operating cost for the membrane-based process
is also marginally lower.
The cost of disposal of the brine reject from the RO and NF unit processes was not originally included in
the cost calculations. This was seen as an omission by the WRC reference group and a cost estimate for
brine disposal was requested.
The cost of treating the brine reject in brine evaporation ponds has been estimated at R450 million. This
assumes a reject volume of 12 Ml/day based on 88% recovery and a concentrate TDS of approximately
3,700 mg/l. This cost is almost half the total project cost for each of the proposed reclamation trains. It is
therefore concluded that a treatment process that avoids the inherent disposal problems and costs
associated with NF and RO reject is required. A treatment train that comprises MBR-O3/GAC-UF-UV
should produce water of potable quality as this train has some similarity to the Goreangab Reclamation
Plant. The Goreangab plant does not have an advanced oxidation process (UV/H2O2) and thus this
proposed treatment train has an additional barrier. The substitution of a UF membrane for the RO and NF
membrane will reduce the cost significantly. Although UF does not remove micro-organic substances
there are three barriers, namely ozonation, GAC and AOP unit processes, that provide this protection.
It is thus proposed that further trials be conducted to test the performance of this proposed treatment
train. These trials would provide process results for the eThekwini reuse project, which has proposed a
similar treatment train.

82
CHAPTER 5: CONCLUSION
5.1 GENERAL CONCLUSIONS
The primary objective of this investigation was to determine the efficacy of various treatment trains and
individual unit processes in meeting set water quality objectives and for the removal of CECs (endocrine
disruptors, pharmaceuticals, and personal care products). A group of structurally diverse target
compounds was selected for evaluation based largely upon occurrences and a prioritized ranking.
Several membrane types and applications were evaluated at pilot and laboratory/bench scale, including:
membrane bioreactors, nanofiltration, reverse osmosis, and combinations of membranes in series.
Ozonation in combination with granular activated carbon, and ultra violet radiation in combination with
hydrogen peroxide (AOP) were also evaluated at bench scale. Nanofiltration and reverse osmosis were
capable of significant rejection of nearly all target compounds, though compounds were detectable at
trace levels in permeates. Granular activated carbon was not as effective at removing all the target
compounds on its own, but in combination with ozonation it was very effective. AOP was very effective at
removing steroid hormones as well as providing an additional barrier to pathogens. Findings confirm that
membrane and carbon processes combined with ozonation are capable of greatly reducing the
concentrations of emerging contaminants; however, some compounds are detectable in membrane
permeate and carbon effluent.
All the selected treatment trains have proven to be capable of producing drinking water compliant with
and exceeding local and international drinking water regulations. The decision on which is the most
appropriate treatment train to be used for the Darvill reclamation design may have to be based on other
factors. These will include, but not be limited to, two very important factors: namely, public health and
economic cost.
The streamlined MBR-RO-UV process is more economical than the MBR-O3/GAC-NF-UV process train
and would thus be recommended of the two options. However, a serious flaw in the two processes is the
cost of brine disposal using evaporation ponds; the alternative of disposing of the brine to sea is not an
option inland where Darvill WWW is situated.
If reclamation is to be considered feasible at Darvill and other wastewater works in the interior, an
alternative treatment train such as MBR-O3/GAC-UF-UV will have to be considered.
83
5.2 RECOMMENDATIONS FOR FUTURE RESEARCH
Operationally, by placing the NF upstream of the O3/GAC unit, the TOC entering the O3/GAC was
reduced from an average 5.8 mg/l to less than 1 mg/l. This allowed the ozone dosage to be reduced from
9 mg/l to 6 mg/l. A further reduction in the dosage was not possible due to the difficulty of measuring the
ozone dosage at lower levels. This reduction in ozone consumption would obviously have a major
financial benefit at full scale. Similar operational benefits may accrue in increasing the time between
carbon regeneration periods, as the substantial reduction in TOC would apply less organic load onto the
carbon.
No calculation was made on the potential economic benefit derived from placing the NF upstream of the
O3/GAC. This analysis is recommended as part of future research as it was beyond the scope and time
available under the current project.

84
REFERENCES
1. Asano, T., Burton, F.L., Leverenz, H.L., Tsuchihashi, R. and Tchobanoglous, G. (2006) Water
Reuse – Issues, Technologies, and Applications. McGraw Hill. ISBN 978-0-07-145927-3.
2. Barnes, K., Kolpin, D.W, Furlong, E.T., Zaugg, S.D., Meyer, M.T. and Barber, L.B. (2008) A
national reconnaissance of pharmaceuticals and other organic wastewater contaminants in the
United States – 1. Groundwater. Science of the Total Environment 402, p192-200.
3. Ben-David, A., Bernstein, R., Oren, Y., Belfer, S., Dosoretz, C. and Freger, V. (2010) Facile
Surface Modification of Nanofiltation Membranes to Target the Removal of Endocrine Disrupting
Compounds. Journal of Membrane Science Volume 357. P152-159.
4. Benotti, M.J., Trenholm, R.A., Vanderford, B.J., Holiday, J.C., Stanford, B.D and Snyder, S.A.
(2009) Pharmaceuticals and Endocrine Disrupting Compounds in US Drinking Water.
Environmental Science & Technology Volume 43, p597–603.
5. Clara, M., Kreuzinger, N., Strenn, B., Gans, O., and Kroiss, H. (2005) The Solids Retention Time
– a Suitable Design Parameter to Evaluate the Capacity of Wastewater Treatment Plants to
Remove Micropollutants. Water Research Volume 39, p97–106.
6. Comerton, A. (2005) Evaluation of a Membrane System to Produce High Quality Reuse Water.
Department of Civil Engineering, University of Toronto.
7. Drewes, J.E., Bellona, C., Luna, J., Hoppe, C., Amy, G., Filteau, G., Oelker, G., Lee, N., Bender,
J. and Nagel, R. (2005) Can Nanofiltration and Ultra-Low Pressure Reverse Osmosis
Membranes Replace RO for the Removal of Organic Micropollutants, Nutrients and Bulk Organic
Carbon? – A Pilot-scale Investigation.
8. Gasull, R., Bernal, R. and Montero, C. (2014) Multiple-barrier Approach Results in Sustainable
Reclamation. World Water: Water Reuse and Desalination.
9. Golder & Associates (2010) Feasibility Study of Project Options for Reclamation and Reuse of
Treated Sewage Effluents.
10. Imasaka, T., Kanekuni, N., So, H. and Yoshino, S. (1989) Cross flow filtration of methane
fermentation broth by ceramic membranes. Journal of Fermentation and Bioengineering Volume
69 Issue 3, p200-206
11. Judd, S. (2011) Principles and Applications of Membrane Bioreactors for Water and Wastewater
Treatment. 2nd Edition 2011. Elsevier Ltd.
12. Kimura, K., Amy, G., Drewes, J., Heberer, T., Kim, T. and Watanabe, Y. (2003) Rejection of
Organic Micropollutants (Disinfection By-products, Endocrine Disrupting Compounds, and
Pharmaceutically Active Compounds) by NF/RO membranes. Journal of Membrane Science
Volume 227, p113
13. Kumar, A. and Xagoraraki, I. (2010) Pharmaceuticals, Personal Care Products And Endocrine
Disrupting Chemicals in the US Surface and Finished Drinking Waters: A Proposed Ranking
System. Science of the Total Environment Volume 408, p5972–5989.Elsevier.

85
14. Lazarova, V., Sheilds, P., Levine, B., Savoye, P., Hranisavljevic, D. and Renaud, P. (2003)
Production of high quality water for reuse purposes: the West Basin experience. Water Supply
Volume 3, No 3, p167-175. IWA Publishing.
15. Lazarova, V., Liechti, P.A., Savoye, P. and Hausler, R. (2013) Ozone Disinfection: Main
Parameters for Process Design in Wastewater Treatment and Reuse. Journal of Water Reuse
and Desalination Volume 3, No. 4, Dec 2013. IWA Publishing.
16. LeChevallier, M. W. 1990 Coliform Regrowth in Drinking Water: A Review. Journal American
Water Works Association Volume 82, p74–86.
17. Lesjean, B., Huisjes, E.H. and Buisson, H. (2004) Elimination of Steroids and Pharmaceutical
Compounds in Long Term Operation of Conventional And Membrane Activated Sludge
Processes. IWA Leading-Edge Technology Conference. Prague, Czech Republic. 1-4 June 2004.
18. Leverenz, H.L., Tchobanoglous, G. and Asano, T. (2011) Direct Potable Reuse: A Future
Imperative. Journal of Water Reuse and Desalination.
19. Liu, X., Huck, P.M. and Slawson, R.M. (2001) Factors Affecting Drinking Water Biofiltration.
Journal AWWA Volume 93, No.12, p90-101.
20. Mandel, P. (2007) Modelling of Micro-Pollutant Removal by Ozonation and Chlorination in
Potable Water Treatment. Techneau D.42.6.
21. Menge, J.G., du Pisani, P.L., Konig, E. and Theron-Beukes,T. (2009) Drinking Water Safety in
Windhoek, Namibia: Routine Monitoring, Trace Organics, Pathogenic Indicators And Salinity –
Comparing Different Water Sources. Techneau Conference, 17-19 June 2009.
22. Morin, P., Camper, A., Jones, W., Gatel, D. and Goldman, J.C. (1996) Colonization and
Disinfection of Biofilms Hosting Coliform-Colonized Carbon Fines. Applied & Environmental
Microbiology Volume 62, No. 12, p4428–4432.
23. Najm, I., Kennedy, M. and Naylor, W. (2005) Lignite Versus Bituminous GAC for Biofiltration – A
Case Study. Journal AWWA Volume 97, No.1, p 94-101.
24. Ozaki, H.L. (2002) Rejection of Organic Compounds By Ultra-Low Pressure Reverse Osmosis
Membrane. Water Research Volume 36, p123-130
25. Qin, J.J., Maung Htun, O., Tao, G., Kekre, K. and Hashimoto, T. (2009) Pilot Study Of
Submerged Membrane Bioreactor For Water Reclamation. Water Science & Technology IWA
Publishing. Volume 60, No.12
26. Renew, J.E. and Ching-Hua, H. (2004) Simultaneous Determination Of Fluoroquinolone,
Sulfonamide, and Trimethoprim Antibiotics in Wastewater using Tandem Solid Phase Extraction
and Liquid Chromatography – Electrospray Mass Spectrometry. Journal of Chromatography A,
Volume 1042, p113–121.
27. Reungoat, J., Escher, B.I., Macova, M., Argaud, F.X., Gernjak, W. and Keller, J. (2012)
Ozonation and Biological Activated Carbon Filtration of Wastewater Treatment Plant Effluents.
Water Research Volume 46, p863–872.
28. Schafer, A. I., Fane, A. G. and Waite, T. D. (2005) Nanofiltration – Principles and Applications.
Elsevier. ISBN 1-85617-405-0.
86
29. Schimmoller, L., Peterson, J. and Swaim, P. (2010) Cost-effective Treatment Removes
Pathogens and Micro-Constituents. Water Reuse & Desalination
30. Servais, P., Billen, G. and Bouillot, P. (1994) Biological Colonization Of Granular Activated
Carbon Filters In Drinking Water Treatment. Journal of Environmental Engineering Volume 120,
No.4, p888–899.
31. Stanford, B.D., Snyder, S., Trenholm, R.A., Holady, J.C. and Vanderford, B.J. (2010) Estrogenic
Activity of US Drinking Waters: A Relative Exposure Comparison. Journal AWWA Volume102,
No.11, p55–65.
32. Swart, N. and Pool, E. (2007) Rapid Detection of Selected Steroid Hormones from Sewage
Effluents using an ELISA in the Kuils River Water Catchment Area, South Africa. Journal of
Immunoassay Immunochem Volume 28, p395-408.
33. Synder, S.A., Adham, S., Redding, A.M. and Cannon, F.S. (2007) Role of Membranes and
Activated Carbon in the Removal of Endocrine Disruptors and Pharmaceuticals. Desalination
Volume 202, p156–181.
34. Synder, S.A. and Benotti, M.J. (2010) Endocrine Disruptors and Pharmaceuticals: Implications for
Water Sustainability. Water Science & Technology Volume 61, No.1, p145. IWA Publishing.
35. Synder, S.A., Westerhoff, P., Yoon, Y. and Sedlak, D.L. (2003) Pharmaceuticals, Personal Care
Products, and Endocrine Disruptors in Water: Implications for the Water Industry. Environmental
Engineering Science Volume 20, No. 5, p449–469.
36. Techneau (2006). Ozonation and Biofiltration in Water Treatment: Operational Status and
Optimization Issues. Techneau D.5.3.1.B
37. Theron-Beukes, T., Konig, E., Jacquemet, V. and Gherman, E.C. (2008) Organic Matter
Characterisation and Removal by the Treatment Process of the New Goreangab Water
Reclamation Plant in Windhoek. WISA paper.
38. US Bureau of Reclamation (2009) Reclamation: Managing Water in the West. Southern
California Regional Brine-Concentrate Management Study – Phase 1.
39. Wang, J.Z., Summers, R.S. and Miltner, R.J. (1995) Biofiltration Performance: part 1,
Relationship to Biomass. Journal AWWA Volume 87, No.12, p55-63.
40. Wastewater Engineering (2004) Wastewater Engineering, Treatment and Reuse. 4th Edition
McGraw Hill. P845.
41. Westerhoff, P., Yoon, Y., Snyder, S. and Wert, E. (2005) Fate of Endocrine Disruptor,
Pharmaceutical and Personal Care Product Chemicals During Simulated Drinking Water
Treatment Processes. Environmental Science Technology Volume 39, No.17, p6649–63.
42. Wintgens, T., Salehi, F., Hochstrat, R. and Melin, T. (2008) Emerging Contaminants And
Treatment Options In Water Recycling For Indirect Potable Use. Water Science & Technology
Volume 57, No.1, p99-107. IWA.
43. World Health Organization Drinking Water Guidelines. 2008.

87
ANNEXURES
Annexure B-A
Reclamation Plant Product Water Quality Standards
New Goreangab Reclamation Plant Water Quality Standards
Physical and Organoleptic Units 95th Percentile Limit
Calcium Carbonate Precipitation
Potential
CaCO3
mg/l
4
Chemical Oxygen Demand mg/l Max 15; Aim for 10
Colour mg/l Pt 10
Dissolved Organic Carbon mg/l Max 5; Aim for 3
Total Dissolved Solids mg/l 1,000 max or 200 above incoming
Turbidity NTU Max 0.2; Aim for 0.1
UV254 abs/cm 0.065
Macro Elements
Aluminium Al mg/l 0.15
Ammonia N mg/l 0.1
Chloride Cl mg/l 250
Iron Fe mg/l 0.05
Manganese Mn mg/l 0.025
Nitrate and Nitrite N mg/l 10
Nitrite N mg/l 0.05
Sulphate SO4
mg/l
200
Microbiological
Heterotrophic Plate Counts per 1 ml 100
Total Coliforms per 100
ml
0
Faecal Coliforms per 100
ml
0
E.Coli per 100 0

88
ml
Coliphage per 100
ml
0
Enteric Viruses per 10 l 0 counts per 10 l or 4 log removal
Faecal Streptococci per 100
ml
0
Clostridium Spores per 100
ml
0
Clostridium Viable cells per 100
ml
0
Disinfection By-products
Trihalomethanes ug/l Max 40; Aim for 20
Biological
Chlorophyll a ug/l 1
Giardia per 100 l Not more than 0 or 5 log removal
Cryptosporidium per 100 l Not more than 0 or 5 log removal
Note Other parameters will be adhered to, to comply with Rand Water standards
* Possible stricter operational requirements for management levels
NEWater Factory Water Quality Standards
Physical and
Organoleptic
Units USEPA/WHO2
NEWater Factory1
Colour mg/l Pt 10 <5
pH 6.5-8.5 5.2–6.2
Total Dissolved
Solids
mg/l 500 22–41
Total Organic
Carbon
ug/l - 60–90
Turbidity NTU 5 <0.1
Alkalinity as CaCO3 - 8
Conductivity (uS/m) - 40–71
Macro Elements
Aluminium Al mg/l 0.2 0.09
Ammonia N mg/l 1.5 0.3–0.57
Chloride Cl mg/l 250 7–11
Iron Fe mg/l 0.3 <0.003

89
Manganese Mn mg/l 0.05 <0.003
Nitrate N mg/l 10 0.5–1.65
Nitrite N mg/l 0.38 0.91
Sulphate SO4 mg/l 250 0.2–0.5
Fluoride F mg/l 1.5 0.18–0.22
Zinc Zn mg/l 3 <0.004
Silica As SiO2 mg/l - 0.2–0.3
Phosphate As P mg/l - 0.01–0.05
Sodium Na mg/l 200 5–10
Microbiological
Total Coliforms per 100 ml NC <1
Faecal Coliforms per 100 ml ND <1
E.Coli per 100 ml 0
Coliphage per 100 ml 0
Clostridium
Perfringens
CFU per 100 ml - <1
Disinfection By-
products
Trihalomethanes ug/l Max 40; aim
for 20
Biological
Chlorophyll a ug/l 1
Giardia per 100 l Not more
than 0 or 5
log removal
Cryptosporidium per 100 l Not more
than 0 or 5
log removal
Note:
1. Taken from analytical results for the months of June and July 2000.
2. Lowest limit of either the US-EPA 1998 Surface Water Regulations or WHO
1993 Guidelines for Drinking Water.

90
An
nex
ure
B-B
Pre
limin
ary
Pro
cess
Flo
w D
iag
ram
fo
r D
arvi
ll P
ota
ble
Wat
er R
euse

91
Draw
ing
Title
Proc
ess &
Inst
rum
enta
tion
Diag
ram
Draw
ing
Num
ber
1De
signe
d By
Thul
ani D
lam
ini
Disp
laye
d Te
xtDe
scrip
tion
PDP
Posi
tive
Disp
lace
men
t Pum
p, G
rund
fos A
lldos
eTK
Ope
n Ta
nkEF
Extr
actio
n Fa
n
BVBa
ll Va
lve
DVDi
aphr
agm
Val
veN
RVN
on R
etur
n Va
lve
3 W
V3
Way
Val
ve
FIFl
ow In
dica
tor
PIPr
essu
re In
dica
tor
Inst
rum
ents
List
Proj
ect T
itle
Wat
er R
ecla
mat
ion
Equi
pmen
t List
Ozo
ne G
ener
atio
n Pl
ant C
onst
ruct
ion
Valv
e Li
st
‘Wat
er fo
r Gro
wth
and
Sust
aina
ble D
evel
opm
ent’
Ozo
ne
Gen
erat
ion
Pro
cess
Flo
w D
iag
ram

92
Drawin
g Title
Proces
s & Ins
trument
ation D
iagram
Drawin
g Num
ber2
Design
ed By
Thulan
i Dlam
ini
Displa
yed Te
xtDes
cription
PDPPos
itive D
isplace
ment P
ump
TKSto
rage Ta
nk
BVBal
l Valve
DVDia
phragm
Valve
NRVNon
Return
Valve
FIFlo
w Indica
torPI
Pressu
re Indi
cator
LILev
el Indi
cator
Instrum
ents Li
st
Project
Title
Water
Reclam
ation
Equipm
ent Lis
t
Biolog
ical Act
ivated
Carbon
Pilot P
lant Co
nstruc
tion
Valve
List
‘Water
for Gro
wth and
Sustain
able De
velopm
ent’
Gra
nu
lar
Act
ivat
ed C
arb
on
Pro
cess
Flo
w D
iag
ram

93
Annexure B-C
Ozone and GAC Operating Procedures
1 Ozone Generator Calibration and Ozone Dosage Calculation
Purpose
The purpose was to find out the ozone concentration produced by the ozone generator.
Apparatus
• Burette
• 500 ml glass conical flask
• 250 ml volumetric cylinder
• A-grade glass ware
• Spatula
• Pipette
Reagents
• Sulphuric acid conc.
• Potassium dichromate
• Potassium iodide
• Sodium thiosulphate
• Starch indicator (soluble)
• Acetic acid
Procedure
Standardisation of 0.01 N Sodium Thiosulphate
10 ml 0.01N k2Cr2o7 was pipetted into a 250 ml conical flask. 1 ml of concentrated sulphuric acid was
added. Then a spatula full of potassium iodide (KI) crystals was added and it was placed in a dark
cupboard for 6 minutes. 0.01N sodium thiosulphate was titrated against the solution until a pale straw
colour was visible. 2 ml of starch solution was added and the colour went blue-black. Then the sample
was titrated until it was colourless. Then the volume of sodium thiosulphate used for titration was
recorded.
Standardisation of Ozone Sample
3. ml of acetic acid was pipetted into a 500 ml glass conical flask, 250 ml of the ozone sample
was added and immediately titrated against 0.01 N sodium thiosulphate until a pale straw
colour appeared. 2 ml of starch indicator was added. The solution turned blue-black and it
was titrated until it went colourless. Then the volume of sodium thiosulphate used for titration
was recorded.

94
Ozone Demand
Power
level
Flow (cc) Time(min) V1(ml) V2(ml) Vave(ml) Concentration Residual
(Ozonated water)
4 600 1 1.3 1.5 1.4 2.02 0
4 600 1 1.8 1.7 1.7 2.45
4.5 600 1 3 3.1 3.05 4.4 0
4.5 600 1 3.3 3.3 3.3 4.7
5 600 1 6.8 7 6.9 9.96 0.2
5 600 1 6.7 6.5 6.6 9.5
mg O3/l = (9.96 + 9.5)/2 = 9.73 mg/l
Ozone Dose
/ = ( ) × 24000 × ( ) ( )
/ = 6.8 × 24000 × 0.00962100
=14.44 mg/l
= ( ) × ( )(ℎ)
= 14.44 × 0.25160
= 216.6 /ℎ ( ) = 216.16ℎ × ℎ24 ( ) = 9.025

95
Mass Balance
M2 Off Gas
C2
M3
C3 Ozonated Water
M1
C1
M1
C1
Ozone + MBR Permeate
= ℎ = = = = + + = , = = ℎ = + +
/ = ( ) × 24000 × ( ) ( )
/ = 6.8 × 24000 × 0.00883100
= 14.44 mg/l

96
= ( ) × ( )(ℎ)
= 14.44 × 0.25160
= 216.6 ℎ = Ozone Residual Concentration = 100 × ∆ × ×
∆A = Difference in absorbance between sample and blank
b = Path length of sell (cm)
V = Volume of sample (ml) (normally 90ml)
= 0.42 (proportionality constant of indigo reagent at 600 nm compared to UV absorption of pure
ozone at 258 nm)
At a flow of 36 l/h and power level 5.5, the ozone residual is as follows:
= 100 × ∆ × × = 100 × (0.153)0.42 × 5 × 30 = 0.23 = = = 24 /ℎ
Off gas (Ozone Residual)
/ = ( ) × 24000 × ( ) ( )
/ = 4 × 24000 × 0.00962100
= 9.2 mg/l
= ( ) × ( )(ℎ)
= 9.2 × 0.251.560
= 92.4 = = + + ∴ = 216.6 − 92.35 − (0.23 × 24) = 118.73 /ℎ

97
= 118.73 /ℎ24 /ℎ = 5 /
4. Operational Procedure
2.1 Startup procedure
2.1.1 Ozonation Section
a) Fill MBR Permeate feed water tank.
b) Open MBR Permeate tank outlet valve (BV-03).
c) Open ozonation plant feed pump inlet and outlet valves (BV-04 and BV-05).
d) Open ozonated water outlet valve from contact tank to ozonated water tank.
e) Connect power supply for pumps and extractor fan to plug points and switch on.
f) Connect ozone generator to plug point and switch on.
g) Start the extractor fan by switching it on at the multiplug.
h) Slowly open the gas cylinder valve and use regulation valve to set outlet pressure at 50 kpa.
i) Switch on ozonation plant feed pump (PDP-01) and set flow rate to desired value.
j) Switch on ozone generator by pressing the blue button on the right hand side of the
generator.
k) Open air flow by turning the black knob on the flow meter set to desired flow rate.
l) Start ozone generation by setting current on ozone generator to give desired amount of
ozone.
m) Run the ozonation plant for 48 hours to fill the ozonated water tank to have enough ozonated
water to run the BAC column.
2.1.1.1 GAC Section
a) Open ozonated water outlet valve (BV-11).
b) Open GAC column feed pump inlet and outlet valves (BV-15 and BV-16).
c) Open feed and product valve for each column (BV-20, BV-25, BV-30, BV35, BV40 and BV-
44).
d) Start the GAC feed pump (PDP-03) to run ozonated water through GAC columns and set flow
rate to 24 l/hr.
e) Monitor the feed pressure. It must not continuously increase to maximum. If that happens
stop the feed pump. Check if all the columns inlet and outlet valves are opened. If there is a
closed valve, first open column 1 feed sample point to release the pressure and open the
closed valve.
f) Ensure that water levels in the columns are the same. Do this by opening the backwash outlet
valve until the level reach the desired value. Then close the valve.
g) Ensure levels in tanks are maintained high to ensure undisturbed operation of the GAC
columns.

98
h) Monitor the feed pressure (PI-04) and feed flow rate (FI-02, FI-04, FI-06, FI-08, and FI-10).
Any reduction in flow rate to less than 20 l/h from a normal operation of 24 l/h and
corresponding increase in pressure will be an indication that the filters are clogged and
require backwashing.
2.1.2 Sampling procedure
Take samples for water quality monitoring. Take samples for the MBR Permeate from the MBR,
Ozonated Water from the sample point on O3 contact tank outlet (close outlet valve and open sample
valve and take samples) and the O3/GAC permeate from the GAC outlet. Take column outlet samples
from sample points located at column outlets to measure quality from each GAC column. These
valves must be slowly opened to take the sample without disturbing the system. Take enough
samples and then close the valve. The table below shows sample to be taken, frequency of sampling
and determinands.
Sample Frequency Determinands
MBR Permeate
Ozonated Water
O3/GAC Permeate
Monday – Friday
Monday, Wednesday and
Friday
COD, Conductivity, Ammonia, Nitrates, Nitrites,
Total Kjeldahl Nitrogen (TKN), Suspended Solids,
Soluble reactive Phosphates (SRP), Turbidity, pH,
UV254 absorbance
Total Organic Carbon (TOC), Alkalinity, E-coli,
Coliphages, Coliforms, Oil and Grease (OG), Total
Dissolved solids, UV254 absorbance
GAC columns outlets When required Total Organic Carbon, UV254 absorbance,
2.1.3 Backwashing
Once the filters are clogged they need to be backwashed. One filter will be backwashed at a time.
The backwash sequence will be as follows:
a) Close ozonated water tank outlet valve (BV-11). Disconnect the outlet pipe from the ozonated
water tank and connect it to the O3/GAC permeate tank.
b) Open O3/GAC permeate tank outlet valve (BV-14).
c) Open GAC column feed pump inlet and outlet valves (BV-15 and BV-16).
d) Close feed inlet and outlet valves for all the columns, column BV-20, BV-25, BV-30, BV35,
BV40 and BV-44.
e) Open backwash water inlet and outlet valve for the column that is backwashed. Backwash
valves for the other columns must remain closed.
f) Complete GAC column backwash
g) Start backwash water pump and set flow rate to 30 l/hr.

99
h) Once all the columns have been backwashed disconnect the feed pipe from the GAC treated
water tank, connect it back to the ozonated water tank and switch the plant back to filtration
mode.
Note: the same pump will be used for feeding the columns as well as for backwash.
2.1.4 Shut down procedure
a) Turn down current on the ozone generator to zero.
b) Switch off ozone generator by pressing the blue button on the right hand side of the
generator.
c) Close gas valve at the top of the gas cylinder.
d) Switch off ozonation feed pump (PDP-01).
e) Switch off GAC column feed pump (PDP-03).
f) Wait for 3 minutes before switching off the extraction fan.
g) Switch off power supply to ozone generator on the wall plug point.
h) Switch off power supply to multiplug adapter.

100
Annexure B-D
List of Analytical Laboratory Instrumentation
DETERMINAND INSTRUMENT TYPE MODEL NAME
NO3 / NO2 THERMO AQUAKEM 600
NH3 THERMO AQUAKEM 600
TKN SEAL AUOT-ANALYSER 3
TDS No instrument Gravimetric Analysis
Alkalinity METTLER AUTOTITRATOR
SS No instrument Gravimetric Analysis
OG No instrument Gravimetric Analysis
SRP THERMO AQUAKEM 600
TP THERMO AQUAKEM 600
Turbidity HACH 2100 AN TURBIDITIMETER
COD NANOCOLOUR VARIO 3PLUS 500D SPECTROPHOTOMETER
BOD YSI 5000
TOC / DOC TEKMAR APOLLO 9000

101
Annexure B-E
Koch Puron simulation for 120 Ml/day MBR Plant

Wastewater Reclamation for Potable Reuse: Application of MBR Technology ¯¯¯¯¯¯¯¯¯¯¯¯¯¯¯¯¯¯¯¯¯¯¯¯¯¯¯¯¯¯¯¯¯¯¯¯¯¯¯¯¯¯¯¯¯¯¯¯¯¯¯¯¯¯¯¯¯¯¯¯¯¯¯¯¯¯¯¯¯¯¯¯¯¯¯¯¯¯¯¯¯¯¯¯¯¯¯
102
Annexure B-F
Toray DS2 System Overview Report for 100 Ml/day Reverse Osmosis Plant
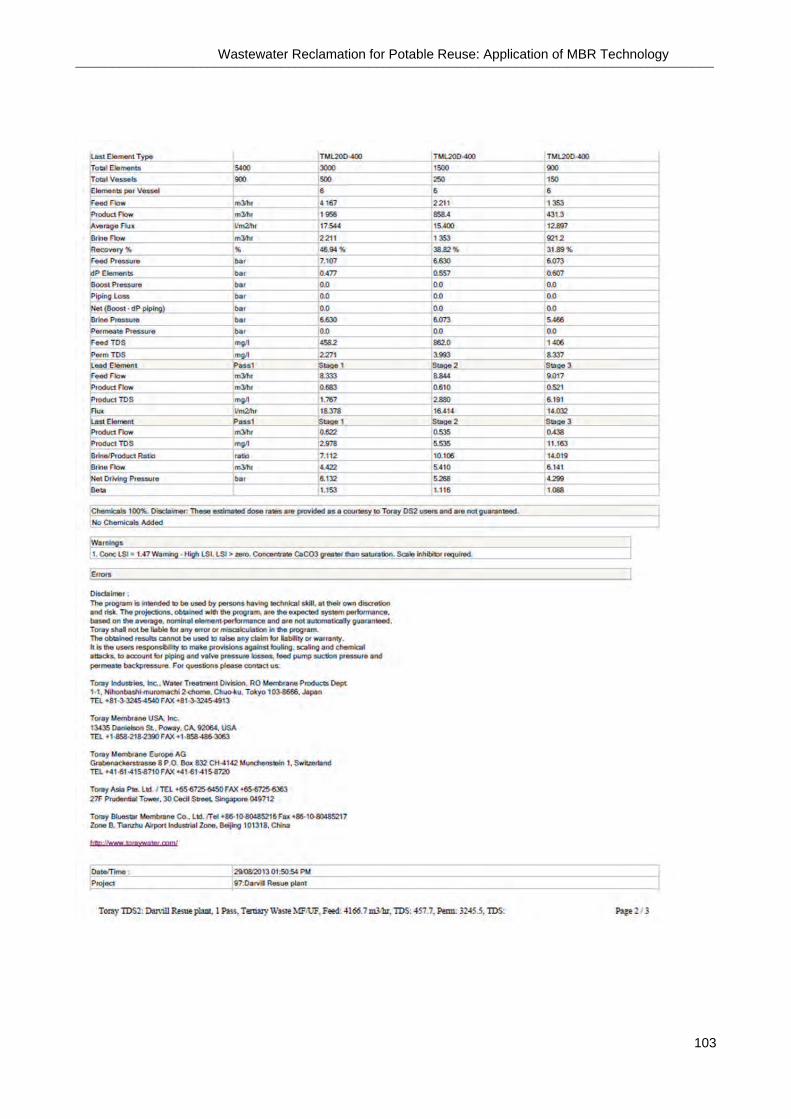
Wastewater Reclamation for Potable Reuse: Application of MBR Technology ¯¯¯¯¯¯¯¯¯¯¯¯¯¯¯¯¯¯¯¯¯¯¯¯¯¯¯¯¯¯¯¯¯¯¯¯¯¯¯¯¯¯¯¯¯¯¯¯¯¯¯¯¯¯¯¯¯¯¯¯¯¯¯¯¯¯¯¯¯¯¯¯¯¯¯¯¯¯¯¯¯¯¯¯¯¯¯
103

Wastewater Reclamation for Potable Reuse: Application of MBR Technology ¯¯¯¯¯¯¯¯¯¯¯¯¯¯¯¯¯¯¯¯¯¯¯¯¯¯¯¯¯¯¯¯¯¯¯¯¯¯¯¯¯¯¯¯¯¯¯¯¯¯¯¯¯¯¯¯¯¯¯¯¯¯¯¯¯¯¯¯¯¯¯¯¯¯¯¯¯¯¯¯¯¯¯¯¯¯¯
104

Wastewater Reclamation for Potable Reuse: Application of MBR Technology ¯¯¯¯¯¯¯¯¯¯¯¯¯¯¯¯¯¯¯¯¯¯¯¯¯¯¯¯¯¯¯¯¯¯¯¯¯¯¯¯¯¯¯¯¯¯¯¯¯¯¯¯¯¯¯¯¯¯¯¯¯¯¯¯¯¯¯¯¯¯¯¯¯¯¯¯¯¯¯¯¯¯¯¯¯¯¯
105
Annexure B-G
Direct Potable Reuse Option for eThekwini Municipality
*Golder & Associates (2010) Feasibility Study of Project Options for Reclamation and Reuse of Treated
Sewage Effluents
12125-002
Reclaimed WaterStorage Reservoirs
TreatedWastewater
Coagulant
H O2 2
Waste Sludge
Hypochlorite
Filter BackwashWater
Ozone
Off site CarbonRegeneration
Reclaimed WaterDistribution
Recycle
UltrafiltrationMembrane (UF)
UV Disinfection(UV)
Flocculation/Clarification (CFC)
OzoneContactors (O )3
Biologically ActivatedCarbon
Columns (BAC)
GranularActivatedCarbon
Columns (GAC)
A
A