non-tariff measures in agri-food trade: what does the … · non-tariff measures in agri-food...
TRANSCRIPT

Non-Tariff Measures in Agri-Food Trade: What Does the Data Tell Us?
Evidence from a Cluster Analysis on OECD Imports
Anne-Célia Disdier♦ Frank van Tongeren#
Preliminary version – Please do not quote without authors’ permission
Abstract
Non-tariff measures (NTMs) are playing an increasing role in international trade of agri-food trade.
Although well-recognized, this aspect has not been extensively analyzed at a disaggregated product
level. This paper presents a quantitative analysis of the trade incidence of NTMs notified by
Organisation for Economic Co-operation and Development countries (OECD) countries on 777
products and clusters these products according to three trade indicators. While the ‘protection for
sale’ literature provides useful explanations, it is not completely satisfying in resolving the puzzle
of cross-product differences in the occurrence of NTMs.
Keywords: non-tariff measures, cluster analysis, political economy of protection
JEL Classification: C83, P16, Q17
♦ INRA, UMR Economie Publique INRA-AgroParisTech, 16 rue Claude Bernard, 75231 Paris Cedex 05. Email : [email protected] # OECD, Trade and Agriculture Directorate, 2 rue André Pascal, 75775 Paris Cedex 16. Email: [email protected] The views expressed in this paper are those of the authors and do not reflect the official view of the OECD or of the governments of its member countries. The research was initiating while the first author was visiting OECD.

Introduction
Non-tariff measures (NTMs) are widely believed to assume an increasingly important role in
determining international trade, especially between developed and developing economies. Agri-
food products are extensively affected, and these products are the ones with the largest number of
NTM complaints relative to the sectoral export value (United Nations Conference on Trade and
Development).
NTMs are used for a variety of reasons, including the correction of information
asymmetries and other market failures, but also possibly protectionist purposes. The relevance of
these motivations will clearly differ across products. In some products only a few NTMs may be
found, while other products might have a proliferation of NTMs. Such differences may also imply
differences in potential trade frictions between countries. A cluster analysis can help to class
products into coherent groups, taking a multitude of product characteristics into account.
There is no shortage of estimates of the trade effect of NTMs, but despite the increasing
number of papers investigating these measures, assessments of their trade impact by product or at
least by sector tend to be rat1her scarce. Some sectoral differences are present in Henry de Frahan
and Vancauteren. This analysis suggests that the harmonization of standards has a positive and
significant impact on intra-European trade (except for condiments). The effect of harmonization is
small for meat, dairy, tea and coffee but large for sugar and cacao. Fontagné, Mimouni, and Pasteels
highlight a predominance of negative effects of NTMs on trade of fresh and processed food. Flows
of cut flowers, swine meat, vegetables, citrus, sugar, juices, wine, animal feed preparation are
significantly reduced by these measures. Finally, using ad-valorem equivalents of NTMs, Disdier,
Fontagné, and Mimouni find a strong negative and significant impact for live plants and cut
flowers, gums and resins, beverages, and tobacco and trade-enhancing effects are observed for

cereals, and wool and animal hair.1 This paper contributes to the product specific analysis of NTMs
by conducting a quantitative analysis of the trade incidence of NTMs initiated by governments in
Organisation for Economic Co-operation and Development countries (OECD) countries on 777
agri-food products and groups these products into different clusters. Three criteria are used to
evaluate the trade effect, namely the occurrence of NTMs, their trade coverage and the NTM-
related trade frictions amongst countries.
Our cluster analysis provides six robust groups of products, significantly different in terms
of NTM trade incidence. Such differences pose an important unsolved puzzle. They cannot be
solely explained by differences in health and food safety concerns and where international trade acts
as a vector to transmit undesired product attributes. We therefore review additional reasons
proposed in the ‘protection for sale’ literature to explain these differences. In this literature, based
on the political economy model of endogenous protection developed by Grossman and Helpman,
NTMs are the result of lobbying by domestic firms and industries. The existing works, while
providing some useful explanations, are not however completely satisfying in resolving the puzzle
of cross-product differences in the occurrence of NTMs. They rely on crude definitions of
protection and do not account for the complex forms of NTMs that are presently observed in the
agri-food sector of OECD countries. Efficiency costs of such measures are less evident than the
welfare losses associated with tariffs and quantity non-tariff barriers.
We envision several uses for the results contained in this paper. First, it establishes a
formal statistical grouping of products. The clusters can be used to design representative case
studies on the incidence of regulations, types of measures and affected countries. Second, our
results could be the starting point for new theoretical developments trying to explain governments’
1 This work also highlights the sensitivity of results to the measurement used for NTMs and the results are quite
different with frequency indexes as opposed to ad-valorem equivalents.
motivations to implement NTMs on agri-food products. Third, the cluster results can provide
guidance in focusing policy efforts to reduce the trade limiting impacts of NTMs.
The paper is structured as follows. We discuss the rationale for cluster analysis in section 2.
Section 3 describes the construction of the combined database and provides summary statistics.
Section 4 implements the cluster analysis and reports the results. Section 5 links our results to
recent contributions of the political economy literature on protection. Section 6 concludes.
Cluster analysis: rationale
Cluster analysis has been used first by Tryon in 1939 (for a presentation of cluster analysis, see
Everitt, Landau, and Leese; Jain and Dubes; Kaufman and Rousseeuw; and Tan, Steinbach, and
Kumar). The basic idea is to form groups such that the differences between objects in the same
cluster are as small as possible, while the differences between objects in distinct clusters are as large
as possible. Cluster analysis is applied in a wide range of fields. In biology many taxonomies of
species or more recently of genes were achieved using such techniques. In the field of medicine,
cluster analysis is used to categorize diseases, symptoms and cures. In archeology it is employed to
classify objects of past civilizations in order to understand their histories, customs and living habits.
Grouping of information is also a key tool in web-based information retrieval.
The two most common clustering techniques are the ‘one-level partitional’ and the
‘hierarchical’ methods. In both techniques, the formation of clusters is based on measures of
dissimilarities (similarities) or distances between objects. The choice of measures largely depends
on the data used. For continuous data, the most common measure is the Euclidean distance, but
other measures can also be computed such as the Manhattan or the Chebyshev distances, etc.2 For
2 Most of these distances are special cases of the more general Minkowski metric. The Euclidean distance is the
Minkowski metric with argument 2. The Manhattan distance requests the Minkowski one with argument 1. The
Chebyshev distance gives infinite weight.

binary data, a simple matching distance can be used, or alternatively more complex measures based
on a pairwise comparison of scores on binary criteria can be employed.
Next to deciding on the distance measure, the number of clusters (k) has to be determined
beforehand in the so called partitional clustering. Once this is decided, objects are assigned into
mutually exclusive clusters through an iterative process. The procedure starts with k initial group
centers and objects are subsequently assigned to a group based on distance to the nearest centre.
Cluster centers are typically defined as the mean of the observations, or alternatively the median
observation can be used. The k initial group centers are chosen randomly among objects to be
clustered, but during the clustering process centers are updated at each pass and objects can move
from one cluster to another. The process stops when cluster centers do not shift anymore (or more
than a previously defined cut-off value) or when an iteration limit is reached.
By contrast, in the hierarchical clustering, groups are nested and organized as a tree, which
lends itself to graphical prsentatino in a dendrogram. Hierarchical clustering can be divisive or
agglomerative. The divisive clustering starts with only one all-inclusive cluster, which is then split
into different sub-clusters until only singleton clusters of individual items remain. In agglomerative
clustering, items are first joined into groups and groups are then joined to each other into larger
ones. A linkage method for forming clusters must be specified, in addition to the choice of distance
measure. The most straightforward ways of linking clusters are the single and the complete linkage
methods. In the single linkage method, the distance between two clusters is the one between their
two closest neighboring items, while the furthest pair of observations is used in the complete
linkage method.
Hierarchical clustering is very computer-intensive and therefore limited to small samples
(typically <250 items). A second weakness is that merges cannot be undone in a further step.
Partitional clustering does not suffer from these criticisms, but it is sensitive to outliers.
Furthermore, the number of groups has to be specified before the clustering starts. However, the

determination of the optimal number of clusters can be guided by test statistics that inform about the
likelihood of improving the clustering by increasing or decreasing the number of clusters k.
The use of cluster analysis in economics is increasing, but in the agricultural economics
sub-discipline its application has been limited.3 Cluster analysis on agricultural trade policy issues
has recently been used in a number of papers. Diaz-Bonilla et al. use hierarchical and partitional
clustering techniques to classify countries in terms of food security. Their sample includes 167
countries and employs five measures of food security (food production per capita, the ratio of total
exports to food imports, calories per capita, protein per capita, and nonagricultural population share)
to identify 12 country clusters. Their results suggest that the different categories of countries
proposed by the WTO (developed, developing, least developed and net food importing developing)
do not reflect food security issues very well. Bjørnskov and Lind (2002) perform cluster analyses to
identify developing countries’ possible negotiation partners and strategies in the Doha Round. Their
sample includes the positions of 120 WTO members on 13 issues relating to market access, export
support, domestic support, and non-trade concerns following the Doha meeting of November 2001.
The authors apply both the hierarchical and the partitional techniques and show that African and
most Latin America countries pursue quite similar trade policy objectives to the United States and
most of the Cairns Group Countries. Positions of most developing countries are however in
opposition to the European Union (EU). In a later paper the same authors confirm these findings
using updated negotiation positions as of July 2004 (Bjørnskov and Lind, 2005). Costantini et al.
investigate the internal coherence of existing coalitions in the Doha negotiations, with a special
focus on agriculture. However, instead of relying on countries’ self-declared negotiating positions,
3 An Econlit search (made on November 03, 2008) for ‘cluster analysis’ in the paper abstracts provided 399 results, of
which 347 were journal articles, 25 working papers and 27 published as a book. Among the 347 journal articles, 36 of
them were published between 1985 and 1994, 157 between 1995 and 2004 and 154 since 2005. Restricting the search to
papers having “agriculture” as subject yields only 25 journal articles for the whole period 1985-2008.

the authors use 27 indicators concerning economic, social and institutional development level,
openness to trade, agricultural productive structure and market access policies as inputs for the
cluster analysis. Comparing the country groups obtained from the cluster analysis with the existing
ones, they highlight the role of structural features in alliance formation. An example of hierarchical
clustering based on categorical variables and using multiple correspondence analysis is provided in
van Tongeren, van Meijl, and Surry who construct a ‘family tree’ of agricultural trade models based
on eight criteria.
Data
Three pieces of publicly available information are used to group agricultural products:
(i) information on the occurrence of NTMs, (ii) information on trade flows, and (iii) information on
NTM-related trade frictions amongst countries. Our analysis concentrates on NTMs initiated by
OECD governments (with EU countries aggregated to EU). Agricultural products in this study are
the ones covered by the WTO Agreement on Agriculture, plus fish and fish products.
Information on the occurrence of NTMs
One of the main sources for research on NTMs is the Trade Analysis and Information System
(TRAINS) dataset compiled by the United Nations Conference on Trade and Development
(UNCTAD). TRAINS relies heavily on notifications of measures to the WTO (Sanitary and
Phytosanitary (SPS) and Technical Barriers to Trade (TBT) committees). WTO members are
required to notify only new or changed measures since 1995. The notification requirement covers
measures which differ from international standards, guidelines or recommendations, or situations
where no standards exist, and, in addition, may have a significant impact on trade. UNCTAD
complements the notifications using national sources. In spite of this effort, TRAINS does not
provide a complete coverage of NTMs, and furthermore the country coverage is typically biased

towards those countries that diligently notify their measures to the WTO, or those where UNCTAD
happens to do complementary data collection efforts. TRAINS data used for this paper have been
obtained directly from UNCTAD and contain hitherto unpublished updates for Mexico, the
European Union and Japan.4 Trade protection data in TRAINS are reported according to the
following classification: (i) Tariff measures, (ii) Para-Tariff measures, (iii) Price control measures,
(iv) Finance measures, (v) Automatic licensing measures, (vi) Quantity control measures, (vii)
Monopolistic measures, and (viii) Technical measures. These categories are further disaggregated
into finer policy types.5 Our work focuses on NTMs that have not a direct impact on prices or
quantities. This excludes all measures such as tariffs, para-tariffs, price control measures, and direct
quantity control measures such as quota (except on sensitive products).6 Countries can attribute
several motives in their notifications of measures. The following are singled out for this study:
protection of human health, animal health and life, plant health, environment, and wildlife.
The raw TRAINS database requires a considerable amount of filtering and cleaning before
it can be used for statistical analysis. First, some measures notified by OECD countries address all
the above-mentioned motives. In this case we created a separate record for each of the purposes.
Second, some countries, such as Mexico, notify the same measure on the same product several
times. The only difference is the start year. In these cases only the notification with the oldest start
year is kept in order to avoid double-counting. Third, most NTMs are mainly reported on a
Harmonized System (HS) 8-digit level, with some countries (e.g. Japan and the EU), reporting at 2,
4 The use of recent and unpublished updates largely explains the differences in counts reported in this paper and those
obtained by Disdier, Fontagné, and Mimouni.
5 see http://r0.unctad.org/trains_new/tcm_link.shtm
6 Category 6270 ‘Quotas for sensitive products’ primarily relates to products that are deemed harmful for the
environment, such as those subject to the Montreal Protocol on Substances that Deplete the Ozone Layer (1987) and its
later amendments (CFCs, halons, fully halogenated CFCs, carbon tetrachloride and methyl chloroform).
4, 9 and 10 digit. To facilitate a linking of the NTM data to detailed trade data, all NTMs have to be
assigned a 6-digit HS code, which is the lowest level of aggregation at which internationally
comparable trade data are available. This adjustment deflates the number of NTM-counts, because
all the branches below the 6 digit level will eventually be collapsed to account for just one measure
applied at the HS6 product level. The opposite effect, i.e. an inflation of counts, occurs with
notifications filed at a level above the HS6-level. We assume that a NTM notified at the 2 or 4 digit
level will affect all HS6 products included in this chapter and a separate record is created for each
of the products. Four, three different versions (1992, 1996 and 2002) of the HS classification have
been used by OECD countries when providing their notifications and further updates. All HS1992
and HS2002 codes are mapped into the HS1996 system to allow a consistent time series to be
constructed. All these changes and cleanings result in a database that includes only one unique
observation by notifying country, HS6 product and type of measure.
Information on trade flows
The trade data used for this study comes from the OECD’s International Trade by Commodity
Statistics database, as maintained by the OECD Statistics Directorate. This dataset is mirror image
of UN COMTADE and provides bilateral import flows of OECD countries from all countries in the
world at the HS 6-digit level.
Information on WTO specific trade concerns
WTO members can raise specific trade concerns (STCs) in the SPS and TBT committees. These
concerns pertain to issues raised by one (or more) WTO member concerning measures put in place
by other members and deemed to restrict trade. However, not all concerns raised relate to perceived
trade restrictions, as countries sometimes only seek clarification on a measure put in place by a
trading partner, or remind a trading partner of lacking notifications to the SPS or TBT committee.

Raising an issue as a specific trade concern is an important way to start information exchange and
bilateral consultations (Organisation for Economic Co-operation and Development).
Although the WTO secretariat keeps a record of concerns raised in both committees since
1995, only the SPS concerns are accessible in a database format through a web-based portal, and are
used in this paper.7 The SPS-STC database provides a summary description of cases, as well as
pointers to relevant documents. The data on STC cases include a record of which member raised a
concern and when, which countries, if any, supported the concern, which countries maintained a
measure deemed to restrict exports of the country raising the concern. The data also give an
indication of the products involved using the HS coding system. One potential caveat of this
approach based on available data is that it will not capture cases where trade tensions on NTMs are
settled bilaterally without raising the issue at the WTO.
To create a usable dataset several manipulations were necessary. First, the product
classification was carefully checked using the SPS committee background documents, and where
necessary the product coding was adjusted. Still, the product detail is necessarily limited, as
measures often cover a whole range of aggregate items (or even the whole agri-food sector, as in the
case of concerns about non-transparent procedures). Second, EU countries are aggregated into EU
and in cases where several EU members raised a concern or maintained a measure, just one
observation is kept.
Combining the three pieces of information
Combining the data on NTMs with the information on specific trade concerns and the trade
statistics allows the correlation between incidence of NTMs and incidence of trade frictions to be
identified. Table 1 presents this combination of information from a commodity perspective for the
period 1996-2006. EU is defined as EU15 between 1996 and 2003 and as EU25 for 2004-2006. The
7 http://spsims.wto.org/web/pages/search/stc/Search.aspx
sample covers 769 products that are subject to at least one NTM. Only eight of the total 777
products for which positive trade flows are observed do not face any NTM in any OECD country,
and all of those fibers in an early processing stage (HS 500200 - Raw silk; HS 500310 - Silk waste,
not carded or combed; HS 500390 - Silk waste, other; HS 520300 - Cotton, carded or combed; HS
530121 - Flax, broken or scotched; HS 530129 – Flax hackled or otherwise processed, but not spun;
HS 530130 - Flax tow and waste; HS 530290 - True hemp, other).
Column (1) reports the number of affected products by HS 2-digit chapter, while column
(2) presents the distribution of notifications. OECD countries often notify several measures on a
given product. Not surprisingly there is a higher concentration of NTMs around fresh products (fish,
meat, etc.), with fish and other aquatic products topping the list. However processed products are
also well represented. Column (3) investigates the trade coverage ratio by HS2 chapter. This ratio
represents the value of imports subject to notified NTMs relative to total imports. Fish and meat are
again at the top of the ranking. The share of affected trade is also quite high for products of animal
origin (HS05), meat, fish and seafood preparations (HS16) and live animals (HS01). Columns (4)
and (5) report the number of SPS trade concerns raised by and against OECD countries for each HS
2-digit chapter. Between 1996 and 2006 a total of 233 specific trade concerns dealing with agri-
food products were raised. Out of these 233 cases, 150 were raised by OECD countries. In 139
cases raised, the measure was maintained by at least one OECD country. In column (4), if a concern
is raised by several OECD countries, we create a separate record for each country. Furthermore,
many concerns involve different HS 2-digit chapters. A separate record is created for each of the
chapters. Similarly, in column (5), a separate record is created for each OECD country against
which a concern is raised, as well as for each HS2 chapters affected. Most of the SPS concerns are
on meat (HS02), fruits (HS08), vegetables (HS08), dairy products (HS04), live animals (HS01), and
products of animal origin (HS05).
Insert table 1 here

Cluster analysis: implementation and results
The cluster analysis uses three criteria, one from each of the underlying datasets described in the
previous section, to provide a statistically sound grouping of agri-food products. The clustering is
done on 2006 data. That is to say, Comtrade data for 2006 for 12 OECD importing countries
(counting the EU15 as 1), 212 exporting countries and 777 HS6 agricultural products are merged
with TRAINS data on NTM notifications until 2006 by OECD countries and with concerns brought
to the SPS Committee until 2006 and in which OECD countries maintained the measure. Missing
and zero trade flows are kept in the database as these observations could be subject to NTMs or
specific trade concerns. The analysis is conducted at the HS6 product level, using 777 observations,
and the cluster criteria are as follows:
- Share of affected trade for each product: imports of each product in OECD countries
affected by at least one NTM relative to total imports of that product in OECD countries;
- NTM notifications for each product: total number of NTMs applied by all OECD countries
on each product (if two countries apply the same NTM, it is counted as two NTMs, because
the NTM code assigned by UNCTAD could in practice coincide with different import
requirements imposed by these two countries);
- Number of SPS concerns by HS6 product (if a concern is raised against two countries, it is
counted as two concerns).
Because the three variables are measured in different units they are standardized to zero
means and unit variance before clustering. The grouping is obtained by a partitional cluster analysis
using the mean of the observations as cluster centers. The distance is measured using the standard
Euclidean distance.8 Using the Calinski and Harabasz stopping rule,9 the optimal number of clusters
(based on k-mean clustering) is found to be six.
8 The Euclidean distance between two observations x and y in the 3-dimensional space spanned by the 3 clustering
variables is defined as the square root of the sum of squared differences, i.e. .

Table 2 presents the number of observations within each cluster and information on their
homogeneity. Cluster 1 is much smaller than other clusters. All clusters show high internal
cohesion: small within cluster standard deviation, short average and maximum distances from
cluster centre. Clusters 2 and 3, followed by cluster 4, are the most homogeneous, with low
dispersion around their centers. On the other hand, cluster 1 is the least homogeneous. Clusters 5
and 6 are in-between, cluster 6 being slightly more compact than cluster 5.
Insert table 2 here
Table 3 reports the Euclidean distance between cluster centers. Cluster 1 is relatively
distant from all other clusters, while clusters 3 and 4 are closest to each other. The matrix also
suggests that clusters are becoming more and more different when one is moving from cluster 1 to
cluster 6.
Insert table 3 here
Table 4 provides the mean of each criterion for each cluster and the whole sample. To ease
the interpretation of results, the means reported in table 4 are calculated using non-standardized
variables. Strong differences exist between clusters. A high share of imports of products included in
clusters 1-4 faced NTMs (over 85%), while this share is only 38.6% for products of cluster 5 and
21.6% for those included in cluster 6. Furthermore, the average number of notifications on products
of clusters 1-3 is high (on average 23 NTMs). By comparison, this number is only 15.4 for products
of cluster 4, 16.7 for products of cluster 5 and 5.3 for those of cluster 6. Finally, the number of SPS
9 The Calinski-Harabasz pseudo-F stopping rule is (with N observations and k clusters): , where B is the
between-cluster sum of squares and cross-products matrix and W is the within-cluster sum of squares and cross-
products matrix. A larger value of the statistic suggests a better clustering, i.e. more distinct groups.
trade concerns is very high for products of cluster 1 (57.1 on average), high for products of cluster 2
(16.5) but low for all other clusters.
Insert table 4 here
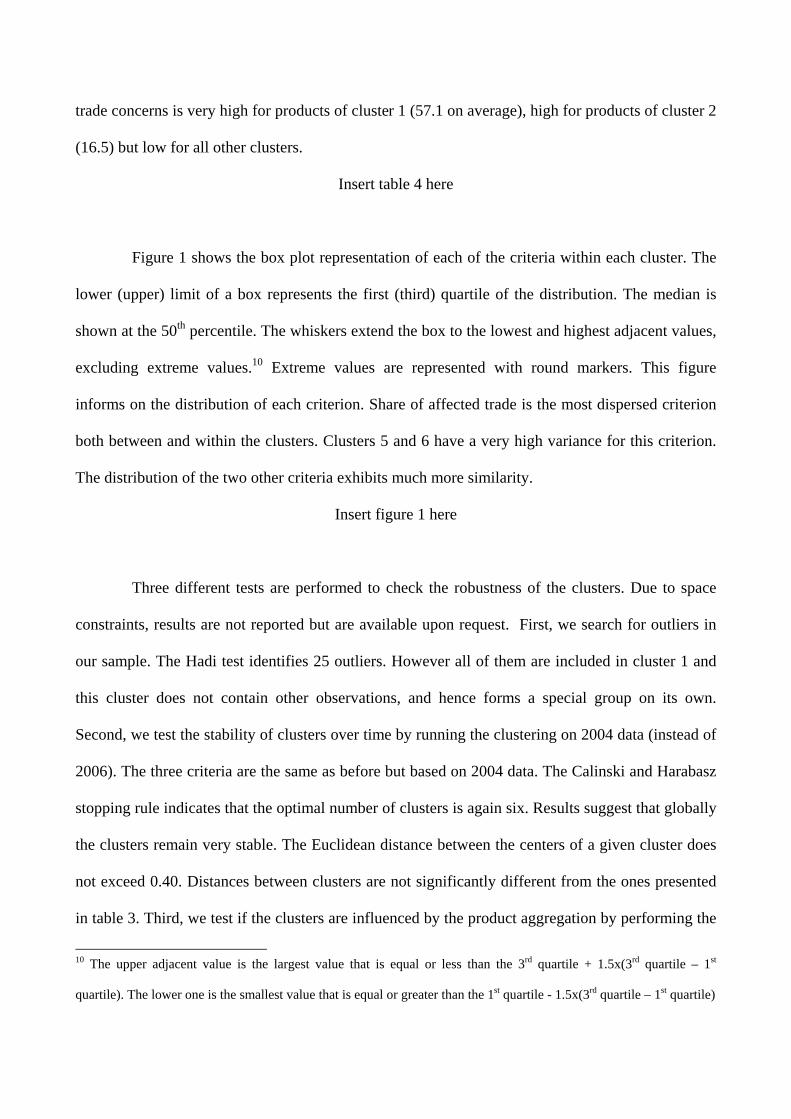
Figure 1 shows the box plot representation of each of the criteria within each cluster. The
lower (upper) limit of a box represents the first (third) quartile of the distribution. The median is
shown at the 50th percentile. The whiskers extend the box to the lowest and highest adjacent values,
excluding extreme values.10 Extreme values are represented with round markers. This figure
informs on the distribution of each criterion. Share of affected trade is the most dispersed criterion
both between and within the clusters. Clusters 5 and 6 have a very high variance for this criterion.
The distribution of the two other criteria exhibits much more similarity.
Insert figure 1 here
Three different tests are performed to check the robustness of the clusters. Due to space
constraints, results are not reported but are available upon request. First, we search for outliers in
our sample. The Hadi test identifies 25 outliers. However all of them are included in cluster 1 and
this cluster does not contain other observations, and hence forms a special group on its own.
Second, we test the stability of clusters over time by running the clustering on 2004 data (instead of
2006). The three criteria are the same as before but based on 2004 data. The Calinski and Harabasz
stopping rule indicates that the optimal number of clusters is again six. Results suggest that globally
the clusters remain very stable. The Euclidean distance between the centers of a given cluster does
not exceed 0.40. Distances between clusters are not significantly different from the ones presented
in table 3. Third, we test if the clusters are influenced by the product aggregation by performing the
10 The upper adjacent value is the largest value that is equal or less than the 3rd quartile + 1.5x(3rd quartile – 1st
quartile). The lower one is the smallest value that is equal or greater than the 1st quartile - 1.5x(3rd quartile – 1st quartile)

clustering on HS4 data. The optimal number of clusters provided by the Calinski and Harabasz
stopping rule is, as before, equal to six. The distances between cluster centers at the HS 6-digit and
4-digit levels are not strongly different from the ones reported in table 3, which confirms the
robustness of our cluster analysis.
We go further in the analysis and investigate the product content of each cluster. Table A.1
in the annex reports information on it. For space and readability reasons, we cannot present the
classification of all the 777 products. We therefore decided to mention for each HS4 category the
cluster which includes a majority of HS6 products.11 If products are equally split between two (or
more) clusters, then the clusters that contain the same and highest number of observations are
marked. For example, HS4 0101 consists of three products, two being included in cluster 4 and one
in cluster 5. Therefore in table A.1, products of HS0101 are reported as belonging to cluster 4.
Cluster 1 (high trade coverage, high number of notifications, very high number of concerns) is the
smallest in terms of size and includes two types of products: bovine meat (HS0201-0202) and many
dairy products: milk, cream, buttermilk and butter (HS0401-0403, and HS0405), cheese (HS0406)
and edible products of animal origin (HS0410).
Cluster 2 (high trade coverage, high number of notifications, high number of concerns) contains:
- All meat products (HS02), except bovine meat and HS020732;
- Many vegetables (HS07), i.e. potatoes, (HS0701), tomatoes (HS0702), onions, shallots,
garlic, leeks (HS0703), cucumbers and gherkins (HS0707), leguminous vegetables
(HS0708), dried vegetables (HS0712), dried and shelled vegetables and leguminous
11 For a detailed description of each HS2 and HS4 code, see: http://comtrade.un.org/db/mr/rfCommoditiesList.aspx

(HS0713), manioc, row root, salep (HS0714 except 071490), and part of vegetables
provisionally preserved, not ready to eat (HS0711);
- Products of HS08 “edible fruit, nuts, peel of citrus fruit” (except HS081050 and 081220).
Cluster 3 (high trade coverage, high number of notifications, low number of concerns) includes:
- Live trees, plants, bulbs, and roots (HS06 except flowers);
- Cereals (HS10 except HS100640);
- Related to cereals, several products of HS19 “cereal, flour, starch, milk preparations and
products” (HS1901, 1903-1905);
- Meat, fish and seafood food preparations (HS16 except HS160210 and 160232);
- Most products of HS20 “preparations of vegetables, fruit, nuts or other parts of plants”;
- ¾ of HS21 “miscellaneous edible preparations”;
- Most products of HS22 “beverages, spirits, vinegar”.
Cluster 3 also contains of some specific products: live non-farm animals (HS0106), fish fillets
(HS0304), crustaceans (HS0306 except 030623), birds’ eggs (HS0407-0408 except 040899), and
natural honey (HS0409).
Cluster 4 (high trade coverage, low number of notifications, low number of concerns) contains:
- Live farm animals (HS01 except 0106);
- Two-third of the fish products (HS03);
- Many products of animal origin (all products of HS0501 “human hair, waste”, HS0502
“bristle, pig, badger’s hair, brush making hair, waste”, HS0503 “horsehair, waste”, HS0504
“guts, bladders and stomachs of animals except fish”, HS0508 “coral, shell, cuttle bone,
waste”, HS0509 “natural sponges of animal origin”, and HS0510 “ambergris, civet, musk,
for pharmaceutical use”);

- Cut flowers (HS0603);
- Almost all vegetables (HS07) not included in cluster 2;
- All products included in HS1201 “soya beans”, HS1203 “copra”, HS1204 “linseed”,
HS1208 “flour, meal of oleaginous seed or fruit except mustard”, HS1213 “cereal straw and
husks, unprepared”, and HS1214 “animal fodder and forage products”;
- Half of cocoa products (HS1801 “cocoa beans”, HS1802 “cocoa shells, husks, skins and
waste”, and HS180310 “cocoa paste, not defatted”).
Cluster 5 (low trade coverage, low number of notifications, low number of concerns) includes:
- Two-third of HS11 “milling products, malt, starches, inulin, wheat gluten” (except HS1105
and 1107);
- Half of the animal and vegetable fats and oils (mostly goods from HS1502 “bovine, sheep,
and goat fats”, HS1503 “lard stearin, oleostearin & oils”, HS1509 “olive oil”, HS1510
“other olive oils”, HS1512 “safflower, sunflower, cotton-seed oil”, HS1515 “other fixed
vegetable fats and oils”, HS1518 “processed animal and vegetable fats and oils”);
- Half of sugar products (most products included in HS1701 “solid cane or beet sugar and
chemically pure sucrose”, HS1702 “other sugars” and HS1703 “molasses”);
- Remaining cocoa products (HS18).
Cluster 6 (very low trade coverage, very low number of notifications, low number of concerns)
mainly includes products of chapters 24 and higher: tobacco products (HS24), mannitol and sorbitol
(HS2905), essential oils, perfumes, cosmetics (HS33 except 330190), albuminoids and modified
starches (HS35 except 350211), amylaceous finishing agents and dye carriers (HS380910), silk
(HS50), wool, animal hair products (HS51), cotton (HS52), and vegetable textile fibers (HS53).

Discussion
The statistical analysis resulted in six rather robust clusters. But the clusters are heterogeneous in
terms of products contained in them, and some product groups are spread over several clusters.
How can such cross-product differences be explained?
The political analysis of Kono emphasizes that politicians in more democratic societies
tend to be more sensitive to public concerns about health, product safety and the environment,
which reinforces the tendency to use complex measures and suggests that cross-industry differences
could be observed in the degree of NTM coverage. Kono’s empirical analysis, cross-country as well
as cross-sectoral, lends support to this hypothesis. Kono highlights that NTMs will be more frequent
in those agri-food subsectors where consumer interest groups voice concerns relating to food safety,
animal welfare and the environment. A coalition of producers and consumers can successfully
demand NTMs to address profound health and food safety concerns, where international trade acts
as a vector to transmit undesired product attributes. Fresh fruits and vegetables and certain animal
products can be seen as falling into that category, and our cluster analysis tends to put those into the
groups with high NTM coverage and high trade coverage.
The ‘protection for sale’ literature proposes some additional reasons to explain cross-
product differences. The political economy model of endogenous protection developed by
Grossman and Helpman postulates rent maximizing lobbying activities in return for political
support contributions and takes both import elasticities and industry stakes into account. It predicts
that the lower the price elasticity of imports, the higher the level of protection afforded to the
industry, because the deadweight loss from import protection increases with the price elasticity of
imports. In addition, a low ratio of imports to output favors larger lobbying contributions, and will
tend to raise protection in the political economy equilibrium, because low import volumes mean a
low of social cost of protection.

Gawande and Bandyopadhyay test this theory empirically using US non-tariff barriers and
lobbying spending and find indeed that protection decreases with the import penetration ratio if the
sector is organized, while protection increases with import penetration if the sector is not organized.
The proportion of consumption sourced internationally is typically quite small across all agricultural
sectors and across countries, but there are some differences across the products included in our
sample. For example, the international dairy market is very ‘thin’ with small trade volumes relative
to domestic absorption. The cluster analysis squarely puts dairy products into the group with the
highest NTM coverage. A more serious testing of the inverse relationship between the import
penetration and NTM coverage can be done using trade data and domestic consumption figures.
Extending the Grossman-Helpman framework into a heterogeneous firm model,
Bombardini explains why larger firms are more likely to lobby and makes a link between the size
distribution of firms and protection. If lobbying involves fixed costs, then the lobbying will be
concentrated amongst the larger firms. The more concentrated industry is more effective in its
lobbying, as the benefits are kept inside a smaller group. In contrast the marginal benefits of
increased protection are declining, and may not outweigh the costs of lobbying, if more firms enter
the club. These predictions are not refuted empirically for data on the US. The implication for agri-
food is that we would observe more NTMs in more concentrated sub-sectors.
Another possible cause of differences in NTMs occurrence could be governments’ support
to ailing sectors. Baldwin and Robert-Nicoud address the question why declining industries account
for most of the protection granted in all industrialized nations. Their framework rests on sunk entry
costs, and predicts that in expanding industries rents would attract new entry that would eventually
erode the rents generated by protection. In declining industries that is not true, as protection can
raise profits sufficiently high, but below the normal return on capital, to make lobbying for
protection a rewarding activity. The implication of this approach for agri-food is that we would
expect to see relatively more tariff- and non-tariff barriers in sub-sectors that are on the decline in

the OECD countries, while we would observe less protection in growing sub-sectors. This pattern is
to some extent present in the clustering results, which tend to put the more dynamic processed
products (HS24 and higher) mainly in cluster 6.
The analysis by Fischer and Serra suggests also that some industries would face more
pressure from domestic producers to implement a protectionist standard than others. While a non-
discriminatory standard raises costs for both domestic and foreign firms, it can be profit enhancing
to the domestic firm if the foreign competitor would face high cost of implementing the standard
that is specific to one of its export destinations and if the foreign competitor can divert supplies to
other markets. This analysis suggests that one would observe country- and product specific
lobbying pressures for agri-food standards.
The theories briefly sketched above are useful to further understanding of the patterns of
protection across broadly defined industries, e.g. high level of protection in aircraft manufacturing
versus low protection in computer manufacturing. But can they also be helpful in understanding
differences in protection within agriculture? We have made some attempts above to relate the
theoretical insights to our clustering results, but this is necessarily sketchy and should be subjected
to further statistical scrutiny.
One problem that the theories discussed above do not tackle sufficiently is the question
when a measure can be considered protectionist.12 They have a relatively straightforward definition
of protection: either a tariff or quantitative border measure (both rising behind the border price of
imported goods) or a domestic subsidy (lowering the domestic price of domestically produced
goods). The NTMs analyzed in this paper are considerably more complex and their efficiency costs
are much less evident than the welfare losses associated with tariffs and quantity barriers. NTMs do
12 With the exception of Fischer and Serra who propose a welfare-theoretic definition of a protectionist standard.
According to them a standard is protectionist if it exceeds a welfare optimal standard, in the sense of internalizing all
production- and consumption externalities, that a social planner would apply if all producers were domestic.
not necessarily embody the economic inefficiencies that are associated with classical trade barriers
and they may be the least trade-restricting policies available in the face of market imperfections. It
is therefore not clear a priori that the removal of NTMs would achieve efficiency gains that would
exceed the losses from weaker regulation. A fuller theory of NTMs to explain differences across
products should therefore take into account also consumer benefits (and concomitant incentives to
engage in lobbying for regulation) as well as producer incentives to lobby for protection.
Conclusion
This paper investigates the variation in the trade incidence of NTMs across agri-food products. The
cluster analysis suggests that the 777 products of our sample can be classified into six robust
groups. Only a slight portion of the cross-product variance could be explained by differences in
health, food safety, and environmental concerns. The remaining variance is partially explained by
the literature on endogenous protection. However, the justifications provided in this literature are
not fully satisfying and invite further research.
References
Baldwin, R.E., and F. Robert-Nicoud. “Entry and asymmetric lobbying: why governments pick
losers.” Journal of the European Economic Association 5 (September 2007):1064-93.
Bjørnskov, C., and K.M. Lind. “Underlying Policies in the WTO, the Harbinson Proposal and the
Modalities Agreement.” Revue Economique 56 (November 2005):1385-412.
___. “Where Do Developing Countries Go After Doha? An Analysis of WTO Positions and
Potential Alliances.” Journal of World Trade 36 (2002):543–62.
Bombardini, M. “Firm heterogeneity and lobby participation.” Journal of International Economics
75 (July 2008):329-48.

Calinski, T., and J. Harabasz. “A dentrite method for cluster analysis.” Communications in
Statistics 3 (1974):1-27.
Costantini, V., R. Crescenzi, F. De Filippis, and L. Salvatici. “Bargaining Coalitions in the WTO
Agricultural Negotiations.” The World Economy 30 (May 2007):863-91.
Diaz-Bonilla, E., M. Thomas, S. Robinson, and A. Cattaneo. “Food Security and Trade
Negotiations in the World Trade Organization: A Cluster Analysis of Country Groups.” Working
paper, Trade and Macroeconomics Division, IFPRI, Washington. 2000
Disdier, A-C., L. Fontagné, and M. Mimouni. “The Impact of Regulations on Agricultural Trade:
Evidence from the SPS and TBT Agreements.” American Journal of Agricultural Economics 90
(May 2008):336-50.
Everitt, B., S. Landau, and M. Leese. Cluster analysis, 4th ed. London: Arnold Publishers, 2001.
Fischer, R., and P. Serra. “Standards and protection.” Journal of International Economics 52
(December 2000):377-400.
Fontagné, L., M. Mimouni, and J.-M. Pasteels. “Estimating the Impact of Environmental SPS and
TBT on International Trade.” Integration and Trade Journal 22 (January-June 2005):7–37.
Gawande, K., and U. Bandyopadhyay. “Is protection for sale? Evidence on the Grossman-Helpman
theory of endogenous protection.” Review of Economics and Statistics 82 (February 2000):139-52.
Grossman, G.M., and E. Helpman. “Protection for sale.” American Economic Review 84
(September 1994):833-50.
Hadi, A.S. “A Modification of a Method for the Detection of Outliers in Multivariate Samples.”
Journal of the Royal Statistical Society Series (B) 56 (1994):393-6.
Henry de Frahan, B., and M. Vancauteren. “Harmonisation of food regulations and trade in the
Single Market: evidence from disaggregated data.” European Review of Agricultural Economics 33
(September 2006):337–60.
Jain, A., and R. Dubes. Algorithms for Clustering Data. Upper Saddle River: Prentice Hall, 1988.

Kaufman, L., and P.J. Rousseeuw. Finding groups in data: An introduction to cluster analysis. New
York: Wiley, 2005.
Kono, D.Y. “Optimal Obfuscation: Democracy and Trade Policy Transparency.” American Political
Science Review 100 (August 2006):369-84.
Organisation for Economic Co-operation and Development. Sanitary and phytosanitary measures
and agricultural trade: a survey of issues and concerns raised in the WTO’s SPS Committee. Joint
Working Party on Agriculture and Trade, COM/TD/AGR/WP(2002)21/FINAL. Paris, 2002.
Tan P., M. Steinbach, and V. Kumar. Introduction to Data Mining. Boston: Addison-Wesley, 2005.
Tryon, R.C. Cluster Analysis. Ann Arbor: Edwards Brothers, 1939.
United Nations, Conference on Trade and Development. Methodologies, Classifications,
Quantification and Development Impacts of Non-Tariff Barriers. Geneva, 2005.
van Tongeren, F., H. van Meijl, and Y. Surry. “Global models of trade in agriculture: a review and
assessment.” Agricultural Economics 26 (November 2001):149-72.
Appendix
Insert table A.1 here
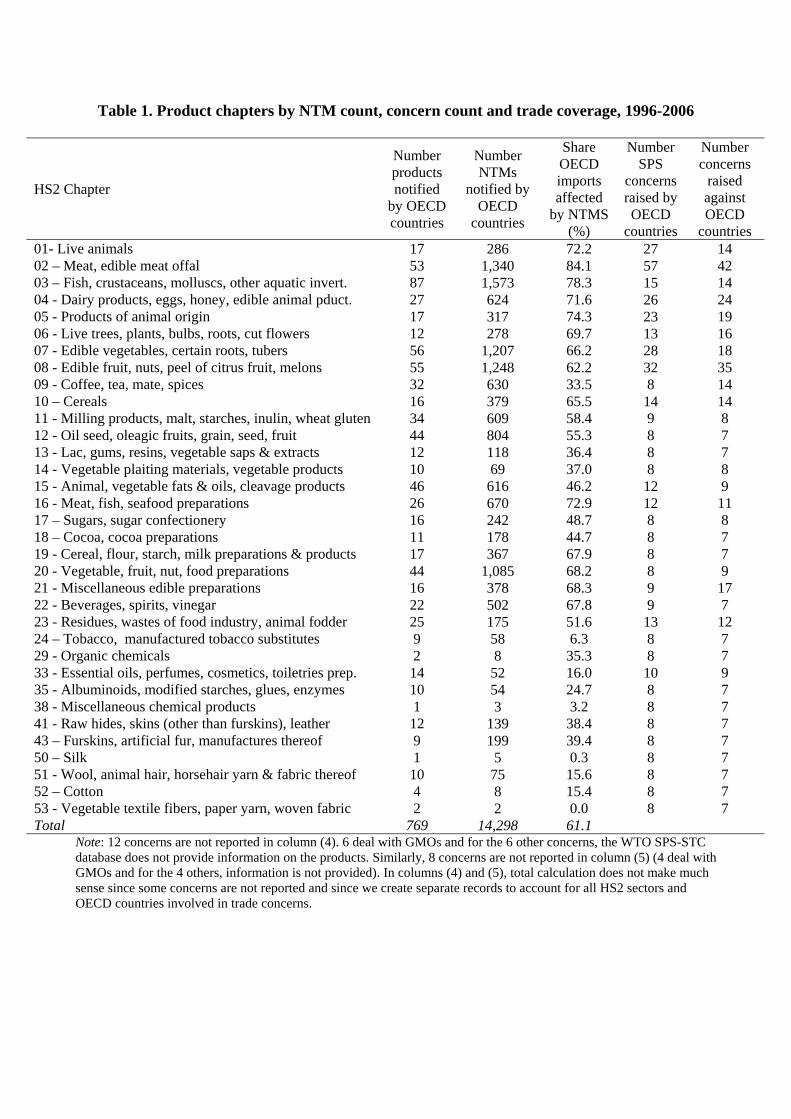
Table 1. Product chapters by NTM count, concern count and trade coverage, 1996-2006
HS2 Chapter
Number products notified
by OECD countries
Number NTMs
notified by OECD
countries
Share OECD imports affected
by NTMS (%)
Number SPS
concerns raised by OECD
countries
Number concerns
raised against OECD
countries 01- Live animals 17 286 72.2 27 14 02 – Meat, edible meat offal 53 1,340 84.1 57 42 03 – Fish, crustaceans, molluscs, other aquatic invert. 87 1,573 78.3 15 14 04 - Dairy products, eggs, honey, edible animal pduct. 27 624 71.6 26 24 05 - Products of animal origin 17 317 74.3 23 19 06 - Live trees, plants, bulbs, roots, cut flowers 12 278 69.7 13 16 07 - Edible vegetables, certain roots, tubers 56 1,207 66.2 28 18 08 - Edible fruit, nuts, peel of citrus fruit, melons 55 1,248 62.2 32 35 09 - Coffee, tea, mate, spices 32 630 33.5 8 14 10 – Cereals 16 379 65.5 14 14 11 - Milling products, malt, starches, inulin, wheat gluten 34 609 58.4 9 8 12 - Oil seed, oleagic fruits, grain, seed, fruit 44 804 55.3 8 7 13 - Lac, gums, resins, vegetable saps & extracts 12 118 36.4 8 7 14 - Vegetable plaiting materials, vegetable products 10 69 37.0 8 8 15 - Animal, vegetable fats & oils, cleavage products 46 616 46.2 12 9 16 - Meat, fish, seafood preparations 26 670 72.9 12 11 17 – Sugars, sugar confectionery 16 242 48.7 8 8 18 – Cocoa, cocoa preparations 11 178 44.7 8 7 19 - Cereal, flour, starch, milk preparations & products 17 367 67.9 8 7 20 - Vegetable, fruit, nut, food preparations 44 1,085 68.2 8 9 21 - Miscellaneous edible preparations 16 378 68.3 9 17 22 - Beverages, spirits, vinegar 22 502 67.8 9 7 23 - Residues, wastes of food industry, animal fodder 25 175 51.6 13 12 24 – Tobacco, manufactured tobacco substitutes 9 58 6.3 8 7 29 - Organic chemicals 2 8 35.3 8 7 33 - Essential oils, perfumes, cosmetics, toiletries prep. 14 52 16.0 10 9 35 - Albuminoids, modified starches, glues, enzymes 10 54 24.7 8 7 38 - Miscellaneous chemical products 1 3 3.2 8 7 41 - Raw hides, skins (other than furskins), leather 12 139 38.4 8 7 43 – Furskins, artificial fur, manufactures thereof 9 199 39.4 8 7 50 – Silk 1 5 0.3 8 7 51 - Wool, animal hair, horsehair yarn & fabric thereof 10 75 15.6 8 7 52 – Cotton 4 8 15.4 8 7 53 - Vegetable textile fibers, paper yarn, woven fabric 2 2 0.0 8 7 Total 769 14,298 61.1
Note: 12 concerns are not reported in column (4). 6 deal with GMOs and for the 6 other concerns, the WTO SPS-STC database does not provide information on the products. Similarly, 8 concerns are not reported in column (5) (4 deal with GMOs and for the 4 others, information is not provided). In columns (4) and (5), total calculation does not make much sense since some concerns are not reported and since we create separate records to account for all HS2 sectors and OECD countries involved in trade concerns.

Table 2. Clusters characteristics
Nb.
observations Within Cluster Std
Deviation Avge Distance from
Cluster Centre Max. Distance from
cluster Centre Cluster 1 25 0.54 1.01 2.84 Cluster 2 131 0.24 0.61 1.23 Cluster 3 195 0.27 0.54 2.13 Cluster 4 216 0.31 0.64 1.65 Cluster 5 116 0.40 0.84 2.12 Cluster 6 94 0.36 0.79 1.71
Table 3. Euclidean distances between cluster centers
Cluster 1 Cluster 2 Cluster 3 Cluster 4 Cluster 5 Cluster 6 Cluster 1 0 Cluster 2 3.60 0 Cluster 3 4.86 1.29 0 Cluster 4 4.90 1.65 1.19 0 Cluster 5 5.21 2.46 1.91 1.66 0 Cluster 6 6.07 3.88 3.49 2.69 1.82 0
Table 4. Mean for each criterion, by cluster and for the whole sample
Share notified imports (%) Nb. notified NTMs Nb. SPS trade concerns Cluster 1 85.7 23.2 57.1 Cluster 2 94.6 22.9 16.5 Cluster 3 87.3 23.2 2.2 Cluster 4 87.6 15.4 3.4 Cluster 5 38.6 16.7 2.1 Cluster 6 21.6 5.3 0.7
Whole sample 73.3 17.9 6.5

Table A.1. Products’ groups from the cluster analysis HS2 Cluster 1 Cluster 2 Cluster 3 Cluster 4 Cluster 5 Cluster 6 01 0106 0101-0105 0104 02 0201-0202 0203-0210 03 0304; 0306 0301-0303; 0305; 0307
04 0401-0403; 0405-0406; 0410 0407-0409 0404
05 0511 0505-0507 0501-0504; 0508-0510 0507 06 0601-0602; 0604 0603
07 0701-0703; 0707-0708; 0711-0714 0704-0706; 0709-0711 0705
08 0801-0814 09 0901-0902; 0909 0902-0903; 0907-0908 0904-0906; 0910 0906; 0910 10 1001-1008 11 1105 1105; 1107 1101-1104; 1106; 1108-1109 12 1202; 1205-1207; 1212 1201-1204; 1208-1209; 1213-1214 1209-1211 13 1302 1302 1301-1302 14 1401-1404
15 1504; 1516 1501; 1504-1508; 1511; 1513-1514; 1517; 1521 1502-1504; 1507-1518 1505; 1520-1522
16 1601-1605 17 1704 1701-1703 18 1801-1803 1803-1806 19 1901; 1903-1905 1902; 1904 1904 20 2001-2005; 2007-2009 2001; 2004; 2006 2001 21 2101; 2103-2106 2102 22 2202-2208 2201 2201-2202; 2209 23 2301; 2303-2306; 2308-2309 2301 2302; 2306-2308 24 2401-2403 29 2905 33 3301 35 3501-3504 38 3809 41 4102-4103 4101 43 4301 50 5001-5003

51 5102 5101-5103 52 5201-5203 53 5301-5302

020
4060
8010
0Va
lue
clus
ter a
naly
sis'
crit
eria
Affected trade (%) Nb. notifications Nb. trade concerns1 2 3 4 5 6 1 2 3 4 5 6 1 2 3 4 5 6
Figure 1. Box plots for each criterion, by cluster