nonbanks, credit provision and the transmission of
TRANSCRIPT

Nonbanks, Credit Provision and the Transmission of Monetary Policy in Denmark
Dominic Cucic
Research Economist
ØP/RESEARCH
Denis Gorea
Senior Research Economist
ØP/RESEARCH
The viewpoints and conclusions stated are the responsibility of the individual contributors, and do not necessarily reflect the views of Danmarks Nationalbank.
2 9 NO V E M B E R 2 02 1 — N O . 8

E C O N O M I C M E M O — D AN M A R K S N A T IO N A L B A N K
2 9 NO V E M B E R 2 02 1 — N O . 8
2
The rise of nonbank lenders raises many questions
Global lending markets have changed dramatically
since the global financial crisis of 2007-2009. In
response to the crisis, regulation of traditional banks
tightened, which contributed to a drop in total bank
credit. This development was accompanied by an
increase in credit provided by various nonbank
financial intermediaries who operate outside the
scope of traditional banking regulation and
supervision. The growing importance of nonbanks in
today's credit markets raises a number of questions
about their impact on the overall credit supply,
financial stability and the transmission of monetary
policy.
How important are nonbank lenders in corporate
and consumer credit markets in Denmark? Who are
these nonbank lenders and who borrows from them
instead of borrowing from traditional banks? A key
concern is whether less regulated nonbanks lend
primarily to riskier borrowers, thus threatening
financial stability. Lastly, how do nonbanks affect the
transmission of monetary policy to credit markets?
Does a tightening of monetary policy lead them to
cut their lending, similar to traditional banks, or do
they tend to increase their lending by picking up
some of the slack left by traditional banks?
Nonbanks, Credit Provision and the Transmission of Monetary Policy in Denmark
Abstract
This memo provides three insights
into the inner workings of nonbank
lending in Denmark. First, we show
that nonbanks are an important
source of funding for Danish firms and
households, accounting for about 8
per cent of total unsecured corporate
and consumer credit. Second, we
show that the risk profiles of firms
borrowing from banks and nonbanks
appear similar. Instead, households
borrowing from nonbanks appear to
be riskier compared to those
borrowing from banks.
Third, we provide evidence on how
the presence of nonbank lenders
influences the transmission of
monetary policy. We show that
nonbanks increase their share of total
credit when interest rates are hiked,
attenuating the transmission of
monetary tightening. This shift in the
credit share away from banks during
episodes of monetary policy
tightening is not accompanied by
riskier lending, as nonbanks tend to
increase their lending mainly to ex-
ante safer firms and households.
Nonbanks, Credit Provision and the Transmission of Monetary Policy in Denmark

E C O N O M I C M E M O — D AN M A R K S N A T IO N A L B A N K
2 9 NO V E M B E R 2 02 1 — N O . 8
3
These questions have been the topic of several
international analyses in recent years. However,
the existing evidence on the role of nonbanks in
credit markets is almost exclusively based on data
from the United States, where nonbanks today
account for more than 50 per cent of mortgage
originations and half of all consumer credit.1 Due to
the many differences between credit markets in the
United States and Europe, it is not clear whether
existing insights apply to European nonbanks. In this
memo, we provide an answer to these questions by
presenting novel evidence on the role of nonbank
lenders in the Danish corporate and consumer credit
markets.
To this end, we use loan-level data from the Danish
Tax Agency (SKAT) on the universe of unsecured
loans extended between 2003 and 2018 to Danish
non-financial corporations and individuals by banks
and nonbanks.2 Nonbanks in our sample are financial
firms that are not deposit-taking institutions or
mortgage banks. These are mainly specialised
finance companies, financial leasing firms, wealth
managers other than insurance companies and
1 See, for example, Chernenko et al. (2020), Elliott et al. (2019), Elliott et
al. (2021) and Fleckenstein et al. (2020). 2 Unsecured loans do not include mortgages.
pension funds, and consumer finance companies. The
loan-level data is based on tax filings by credit
granting institutions in Denmark that report
outstanding balances on loans at the end of a
calendar year, as well as interest paid on these loans
over the course of said year. We combine these two
datasets with annual information on the balance
sheets and income statements of firms, and tax
records of households, as recorded by Statistics
Denmark. This information allows us to get a better
understanding of the characteristics of borrowers
relying primarily on credit from nonbanks and
compare them to the characteristics of borrowers at
traditional banks.
We find that the share of nonbank credit in total
unsecured credit is substantial, averaging around 8
per cent of total credit in both the consumer credit
and the corporate credit markets. Considering that
the value of unsecured credit in Denmark is equal to
approximately 50 per cent of Danish GDP, our results
highlight that nonbanks are economically significant
actors in Danish credit markets.
When it comes to borrower characteristics, we find
that firms that rely mainly on nonbank lenders have
larger balance sheets and slightly worse financial
Share of nonbank credit in corporate and consumer credit markets Chart 1
Note.: The shares are computed as the ratio between loan balances served by nonbanks to total unsecured loan balances in a given year.
Source: Statistics Denmark and own computations.
0
2
4
6
8
10
12
Share of corporate credit, per cent
03 04 05 06 07 08 09 10 11 12 13 14 15 16 17 180
2
4
6
8
10
12
03 04 05 06 07 08 09 10 11 12 13 14 15 16 17 18
Share of consumer credit, per cent

E C O N O M I C M E M O — D AN M A R K S N A T IO N A L B A N K
2 9 NO V E M B E R 2 02 1 — N O . 8
4
ratios. While households relying mainly on nonbank
credit borrow less than those relying on traditional
banks, nonbank borrowers tend to have less
disposable income and are somewhat more likely to
have recently unemployed members.
In a regression analysis that uses monetary policy
shocks from the euro area, which are exogenous to
Danish economic conditions, we also show that
nonbanks react differently to changes in monetary
policy compared to banks in Denmark. Our empirical
strategy relies on the fact that Danish monetary
policy is exogenous to Danish economic conditions,
as the sole objective of monetary policy in Denmark
is to maintain a fixed exchange rate between the
Danish krone and the euro. We find a significant
increase in the volume of outstanding nonbank debt
relative to bank debt in both corporate and
consumer credit markets in response to a monetary
tightening. Our results indicate that a surprise
increase of interest rates of one per cent would yield
an additional supply of nonbank credit equal to 2.5
per cent of Danish GDP. Focusing on corporate
credit, the implied increase in nonbank loans would
be equivalent to 1.5 per cent of total outstanding
corporate credit (secured and unsecured).
Our findings suggest that the presence of nonbank
lenders attenuates the effectiveness of contractionary
monetary policy in achieving lower credit growth.
This result should be interpreted with care in a
context where Danish monetary policy does not try
to achieve a certain level of credit growth through
interest rates changes, but rather focuses solely on
its fixed exchange rate objective. Our results also
suggest that nonbanks increase their lending
especially to ex-ante safer borrowers when it comes
to households, and to firms with less sales.
Nonbanks are important players in consumer and
corporate credit markets
Chart 1 depicts the share of unsecured credit
extended by nonbank lenders relative to total
unsecured credit in Denmark. The chart on the left
shows that nonbank lenders accounted on average
for 7.9 per cent of total unsecured credit to non-
financial corporations (NFCs) between 2003 and
2018. The share of nonbanks of total corporate
lending dropped from about 10 per cent to 3 per
cent between 2003 and 2005. It then increased to
around 12 per cent in 2013, but has been on a steady
decline since then. Danish firms have been
deleveraging since the global financial crisis, and this
deleveraging may have influenced the decline in the
nonbank share. As banks have more long-lasting
relationships with firms, it may have become
increasingly difficult for nonbanks to increase their
market share in an environment where most
borrowers deleverage and there is little inflow of new
borrowers.
The chart on the right describes the evolution of debt
issued by nonbanks to Danish households as a share
of total unsecured consumer credit. The nonbank
share dropped from around 8 per cent to 4 per cent
between 2003 and 2007. It stayed relatively constant
during the global financial crisis and immediately
after, but increased considerably since 2010,
reaching 8.4 per cent in 2018. This evolution
highlights the importance of assessing potential
threats to financial stability and the transmission of
monetary policy that may arise if nonbanks become
an even bigger player in consumer and corporate
credit markets.

E C O N O M I C M E M O — D AN M A R K S N A T IO N A L B A N K
2 9 NO V E M B E R 2 02 1 — N O . 8
5
To better understand the nature of nonbank lenders
in Denmark we investigate the main nonbank
industries. Chart 2 depicts the share of credit to NFCs
and households extended by the three largest
nonbank lender industries, accounting for roughly 80
per cent of the nonbank lending market, which we
determine by using the 6-digit NACE industry codes
for each lender in our data.
The chart on the left shows that nonbanks not
involved in monetary intermediation, such as
specialised finance companies, are the most
important type of nonbank lender in the Danish
corporate credit market. They account for more than
4 per cent of total unsecured corporate loans.
Typically, these institutions finance themselves by
issuing bonds and their lending can take a variety of
forms, such as loans, international trade financing,
and the provision of long-term finance to industry by
industrial loan companies. These lenders tend to
have a competitive advantage in terms of lending to
particular industries, but are also likely to be more
sensitive to idiosyncratic demand shocks due to their
highly concentrated lending portfolio relative to the
portfolio of a typical bank.
The second largest type of nonbanks in the Danish
corporate credit market comprises wealth managers,
venture capital firms and investment funds that invest
for their own account in securities, bonds and other
instruments. These institutions account for nearly 2
per cent of all unsecured corporate credit, and
roughly 25 per cent of the nonbank lending market.
Lastly, firms engaged in financial leasing are the third
largest nonbank lender type and account for about
0.8 per cent of unsecured corporate credit.
Largest nonbank lender industries in corporate and consumer credit markets Chart 2
Note.: The shares are computed as the ratio between loan balances served by a given nonbank industry to total loan balances across all
lender industries in a given year. Lender industries are defined based on 6-digit NACE codes. I&P stands for Insurance and Pension.
Source: Statistics Denmark and own computations.
0
1
2
3
4
5
Specialised financecompanies
Wealth managers(except I&P)
Financial leasing
Share of corporate credit, per cent
0
1
2
3
4
5
Financial leasing Consumer creditcompanies
Wealth managers(except I&P)
Share of consumer credit, per cent

E C O N O M I C M E M O — D AN M A R K S N A T IO N A L B A N K
2 9 NO V E M B E R 2 02 1 — N O . 8
6
In the consumer credit market, the right panel of
Chart 2 shows that financial leasing companies
dominate the list of nonbank lenders. These lenders
are responsible for close to 3 per cent of total
consumer credit in Denmark. Consumer credit
companies that are not deposit-taking institutions
account for about 1.5 per cent, while wealth
managers, other than insurance companies and
pension funds, extend around 1 per cent of total
consumer credit. Overall, our evidence suggests that
a variety of nonbanks are important in consumer
credit markets while the distribution of nonbank
lenders in the corporate credit market is more
concentrated around specialised finance companies.
How do nonbank borrowers differ from bank
borrowers?
We now turn our attention to debtors and analyse
how borrowers from nonbanks differ from those
borrowing from traditional banks. Comparing
debtors across the two types of lenders can help us
get a preliminary understanding of whether
nonbanks have a riskier customer base relative to
that of banks. Between 2003 and 2018, NFCs in
Denmark had on average 1.8 lenders in a given year.
However, this average masks substantial differences
in corporate lending relationships. While the median
firm borrowed from only one lender, 10 per cent of
firms had at least 3 distinct lenders in a given year.
Nevertheless, most firms can be clearly classified as
bank or nonbank borrowers since the majority of
NFCs obtain their funding exclusively from one type
of lender. In other words, relatively few firms have
simultaneous debts with both bank and nonbank
lenders.
Corporate credit: Borrower characteristics Chart 3
Note.: All values in the charts above are averages of the respective variables. Firms are grouped into bank vs. nonbank depending on the
lender type from which they borrow most. Firms’ cash ratio measures their cash and cash equivalents relative to their outstanding short-term
debt. The operating cash flow ratio illustrates firms’ sales and other operating income relative to their short-term debt.
Source: Statistics Denmark and own computations.
0
50
100
150
200
Total assets
Kr. million
0
2
4
6
Debt to equity
Banks
Ratio
0,0
0,2
0,4
0,6
Cash ratio
Nonbanks
Ratio
0
2
4
6
Operating cash flow ratio
Ratio

E C O N O M I C M E M O — D AN M A R K S N A T IO N A L B A N K
2 9 NO V E M B E R 2 02 1 — N O . 8
7
Chart 3 depicts several key firm characteristics by
their main type of lender, which is the lender type
holding more than 50 per cent of the firm's
outstanding loan volume. Nonbank borrowers have
larger balance sheets as measured by total assets
and somewhat worse financial ratios compared to
bank borrowers. While the differences we document
in Chart 3 are not statistically significant, nonbank
borrowers may still be perceived as slightly riskier
from a creditor's perspective. The chart highlights
this by contrasting three important financial ratios
across the two types of borrower groups. Nonbank
borrowers rely more on debt financing than bank
borrowers, as measured by their debt-to-equity
ratios. Moreover, nonbank borrowers are somewhat
less liquid and profitable compared to bank
borrowers, as highlighted by their cash ratios and
their operating cash flow ratios.
Next, we contrast households that borrow primarily
from nonbanks to the ones that rely mainly on bank
financing. Households have on average 2.12 lending
relationships in a given year. This average
overemphasises the importance of multiple lenders
per borrower, as most of the households in our
sample borrow from only one lender. About 10 per
cent of households have more than 4 lending
relationships, which drives up the average number of
lenders per household.
Chart 4 shows that households that are primarily
served by banks have around kr. 325,000 in
outstanding unsecured debt while households that
borrow mostly from nonbanks are less indebted, with
an outstanding balance of kr. 121,000.3 Moreover,
households borrowing mostly from nonbanks have
slightly lower disposable incomes, tend to be older
and are more likely to have been unemployed in the
past 24 months. While quantitatively small, the
differences between the two borrower groups are
statistically significant. This may imply that lenders
perceive nonbank borrowers as slightly riskier,
similar to our results for corporate borrowers.
3 Values are deflated to 2015 levels in order to account for inflation
during our sample period.
Consumer credit: Borrower characteristics Chart 4
Note.: All values in the charts above are averages of the respective variables. Households are grouped into bank vs. nonbank depending on
the lender type from which they borrow most. Consumer credit is the total amount of loans taken out by the household in our loan-level data.
Disposable income is measured as income after tax and interest payments but including rent value of own property. Share unemployed
stands for the share of households that have had an unemployed member during the previous 24 months.
Source: Statistics Denmark and own computations.
0
50
100
150
200
250
300
350
Disposable Income
Banks
Kr. 1000
0
50
100
150
200
250
300
350
Consumer credit
Kr. 1000
0
10
20
30
40
50
Age of household head
Nonbanks
Years
0,00
0,02
0,04
0,06
0,08
0,10
Share unemployed
Share

E C O N O M I C M E M O — D AN M A R K S N A T IO N A L B A N K
2 9 NO V E M B E R 2 02 1 — N O . 8
8
Sectoral differences in bank vs nonbank lending
A potential explanation for the differences in financial
ratios across bank and nonbank corporate
borrowers may be that they operate in different
industries, and consequently with different business
and financing models. To explore this hypothesis,
Chart 5 illustrates to which industries banks and
nonbanks primarily lend most. For each lender type,
the chart depicts the share of credit extended to
borrowers in a given industry relative to total credit
given by the respective lender type.
Chart 5 shows that nonbanks lend primarily to firms
in the transport and storage industry (46 per cent of
nonbank credit), and in particular to firms operating
sea and coastal freight water transport. The industry
receiving the second-most nonbank credit (16 per
cent) consists of firms renting and operating real
estate. Banks, on the other hand, do not appear to
specialise in lending to any one industry as much as
nonbanks do in lending to shipping and transport
firms, although 22 per cent of bank credit is
concentrated in the real estate sector. Consequently,
the distribution of bank credit across borrower
industries is less skewed.
Geographical distribution of nonbank lending
We also explore the degree to which nonbanks
intermediate credit across different parts of
Denmark. We use the location of borrowers, which in
the case of firms is the location of their headquarters,
to compute the share of nonbank credit in total
unsecured credit within a municipality. Chart 6
documents how the share of nonbank corporate
debt is distributed across Danish municipalities.
There is some concentration of the nonbank debt
share in the Capital Region, where most
municipalities have an above average share of
nonbank credit. As described in Chart 3, nonbanks
tend to serve firms with larger total assets, and since
larger firms tend to be concentrated around the
Capital Region, it should come as no surprise that
this region has an above average share of nonbank
credit.
Share of nonbank and bank debt held in various industries
Chart 5
Note: Blue bars indicate the share of outstanding corporate
bank debt in the respective industries relative to total
outstanding bank debt. Similarly, purple bars indicate the share
of corporate nonbank debt in the industry among total nonbank
debt. Public administration includes defence sector. Professional
activities include scientifice and technical activities. Electricity
and gas include steam and air conditioning supply.
Source: Statistics Denmark and own computations
Nonbank share of total corporate credit by municipality (per cent)
Chart 6
Note: Darker shades correspond to higher shares of nonbank debt
relative to total debt within the municipality.
Source: Statistics Denmark and own computations
0,0 0,1 0,2 0,3 0,4 0,5
Transportation and storage
Real estate activities
Wholesale and retail trade
Mining and quarrying
Construction
Electricity and gas
Professional activities
Public administration
NonbanksBanks

E C O N O M I C M E M O — D AN M A R K S N A T IO N A L B A N K
2 9 NO V E M B E R 2 02 1 — N O . 8
9
Contrary to corporate credit, lending by nonbanks to
households as a fraction of total consumer credit is
somewhat more concentrated in the eastern part of
Denmark. As Chart 7 shows, nonbanks are
responsible for a large share of total lending (above
10 per cent) in the Zealand Region, the Capital
Region (with the exception of the municipalities of
Copenhagen, Frederiksberg and some of the
wealthier municipalities north of Copenhagen), as
well as many municipalities on the island of Funen
and the smaller islands surrounding it. Most
municipalities in Jutland have lower than average
shares of nonbank lending in total consumer credit.
Nonbanks and the transmission of monetary policy
Lastly, we explore how nonbank lenders affect the
effectiveness of monetary policy transmission to
credit supply in Denmark. Since a tightening of
monetary policy increases the funding cost of all
financial intermediaries relying on short-term
funding, nonbanks may reduce their lending after an
unexpected increase in policy interest rates, similarly
to the well-known bank lending channel. However,
several international studies have shown that tighter
monetary policy induces a reduction in bank reserves
and deposit flows from banks to nonbanks.4 These
conflicting predictions make it unclear whether the
presence of nonbanks attenuates or strengthens the
bank lending channel of monetary policy
transmission.
To identify monetary policy shocks we exploit the fact
that Denmark's monetary policy is aimed at keeping
the exchange rate of the krone relative to the euro
fixed within a fluctuation band, which effectively
aligns its monetary policy to that of the European
Central Bank(ECB). This introduces exogenous
variation in policy rates, as the ECB does not set
interest rates in the euro area based on changes in
Danish GDP or local credit conditions. This allows us
to use the monetary policy shock series computed
for the euro area by Jarocinski and Karadi (2020) to
proxy for changes in monetary policy in Denmark.
4 See Drechsler, Savov, and Schnabl (2017) as well as (Xiao, forthcoming).
In our regression model, which is summarised in Box
1, we use these shock series to study changes in the
volume of outstanding nonbank debt relative to bank
debt in response to a monetary tightening. Our
analysis controls for time varying credit demand and
unobservable firm and household characteristics.
Moreover, we account for macroeconomic conditions
in Denmark (GDP, GDP forecast, and inflation), as
well as stock market uncertainty (VIX index).
Chart 8 summarises the results from our regression
analysis. Our results show that an unexpected
monetary tightening leads to an increase in the
outstanding level of nonbank debt relative to bank
debt in both corporate and consumer credit markets.
In particular, a one standard deviation increase of
monetary policy rates increases the outstanding debt
share of nonbanks significantly by about 4 per cent in
the corporate credit market. This effect is statistically
significant at the 5 per cent level. The relative
increase of nonbank credit in response to a monetary
tightening is even more pronounced in consumer
credit markets. The share of total credit supply by
nonbanks to consumers increases by about 6 per
cent in response to a one standard deviation
Nonbank share of total consumer credit by municipality (per cent)
Chart 7
Note: Darker shades correspond to higher shares of nonbank debt
relative to total debt within the municipality.
Source: Statistics Denmark and own computations

E C O N O M I C M E M O — D AN M A R K S N A T IO N A L B A N K
2 9 NO V E M B E R 2 02 1 — N O . 8
10
increase in interest rates, and this response is
significant at the 1 per cent level.
Additionally, we contrast the response of bank and
nonbank borrowers' interest rates to monetary
policy shocks in Chart 8. We find that in both cases
(i.e., firms and households) interest rates paid to
nonbanks change only slightly after a surprise
monetary tightening relative to the interest rates
charged by banks.
The response of interest rates for corporate
borrowers is negative but not statistically
significant. The unresponsiveness of interest rates on
corporate loans may be driven by the fact that these
loans tend to be fixed rate loans, which insulate firms
from fluctuations in interest rates in the short term. In
contrast, we find a statistically significant increase in
interest rates on nonbank loans relative to bank
loans in consumer credit markets. This may be due to
the fact that consumer loans more often feature
variable interest rates or that their maturity is short,
allowing to adjust interest rates more easily to
monetary policy changes compared to corporate
loans.
Next, we extend our baseline regression analysis, as
described in Box 1, to study which types of
borrowers benefit most from the increase in the
share of nonbank credit supply after an increase in
interest rates. In the case of NFCs, we study if firms'
leverage or size, measured by their total sales, are
important determinants of the relative increase in the
share of nonbank credit they experience. Similarly,
we study if nonbanks channel their funds to
households depending on their leverage, income and
unemployment status.
Chart 9 shows that nonbanks extend relatively less
credit in response to a monetary policy tightening to
firms that have above-median leverage, as well as to
the ones that have above-median sales or an above-
median cash ratio. None of the coefficients on the
triple interaction effects are statistically significant at
the 5 per cent level. This suggests that we find no
difference between bank and nonbank lenders in
terms of risk profiles of their corporate borrowers
after interest rate hikes.
Nonbanks and monetary policy transmission
Chart 8
`
Note: Regression coefficients measure the response in
outstanding debt and interest rates to a one standard deviation
increase in the monetary policy measure.
Source: Statistics Denmark and own computations
Triple interactions – Corporate credit Chart 9
Note: Estimated coefficients measure by how much, relative to
banks, nonbanks increase their lending to a particular risk group in
response to a one standard deviation contractionary monetary
policy shock. Leverage measures total liabilities to total assets. The
cash ratio is the ratio of cash holdings to short-term debt.
Source: Statistics Denmark and own computations
0
2
4
6
8
Outstanding debt
Corporate lending
Regression coefficient
-0,006
-0,004
-0,002
0,000
0,002
0,004
Interest rates
Consumer lending
Regression coefficient
-4
-3
-2
-1
0
Leverage Sales Cash ratio
Triple-interaction coefficients
E C O N O M I C M E M O — D AN M A R K S N A T IO N A L B A N K
2 9 NO V E M B E R 2 02 1 — N O . 8
11
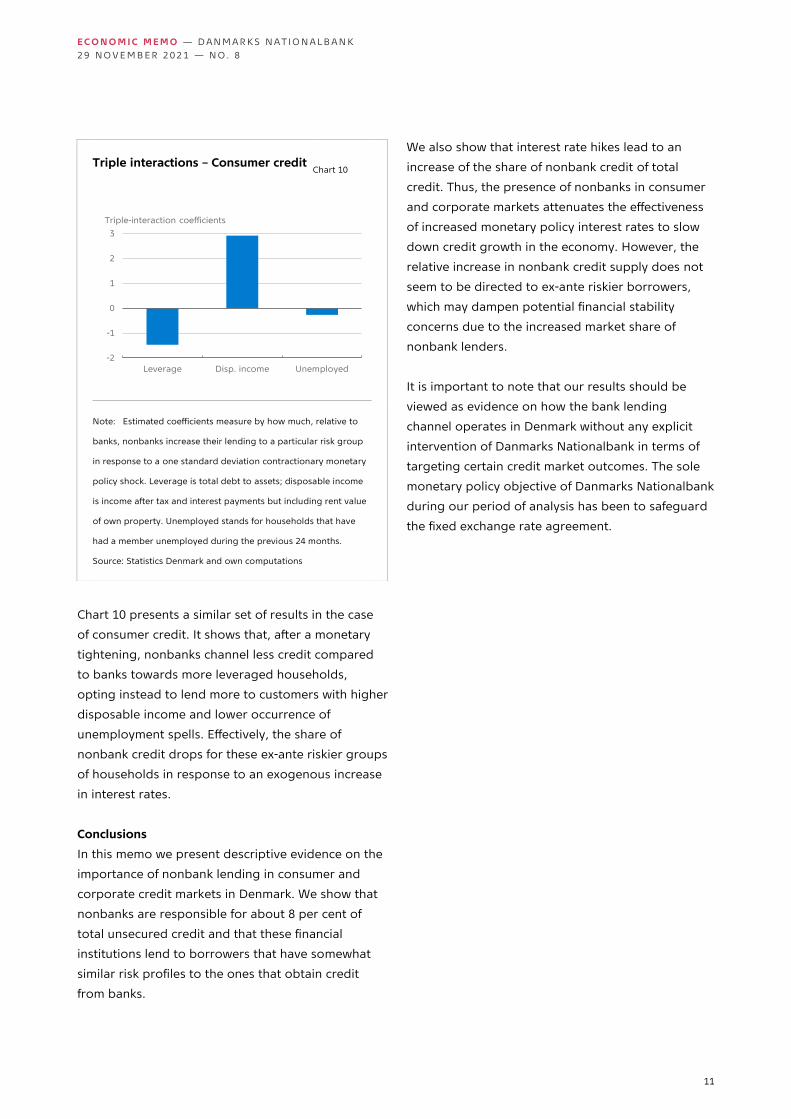
Chart 10 presents a similar set of results in the case
of consumer credit. It shows that, after a monetary
tightening, nonbanks channel less credit compared
to banks towards more leveraged households,
opting instead to lend more to customers with higher
disposable income and lower occurrence of
unemployment spells. Effectively, the share of
nonbank credit drops for these ex-ante riskier groups
of households in response to an exogenous increase
in interest rates.
Conclusions
In this memo we present descriptive evidence on the
importance of nonbank lending in consumer and
corporate credit markets in Denmark. We show that
nonbanks are responsible for about 8 per cent of
total unsecured credit and that these financial
institutions lend to borrowers that have somewhat
similar risk profiles to the ones that obtain credit
from banks.
We also show that interest rate hikes lead to an
increase of the share of nonbank credit of total
credit. Thus, the presence of nonbanks in consumer
and corporate markets attenuates the effectiveness
of increased monetary policy interest rates to slow
down credit growth in the economy. However, the
relative increase in nonbank credit supply does not
seem to be directed to ex-ante riskier borrowers,
which may dampen potential financial stability
concerns due to the increased market share of
nonbank lenders.
It is important to note that our results should be
viewed as evidence on how the bank lending
channel operates in Denmark without any explicit
intervention of Danmarks Nationalbank in terms of
targeting certain credit market outcomes. The sole
monetary policy objective of Danmarks Nationalbank
during our period of analysis has been to safeguard
the fixed exchange rate agreement.
Triple interactions – Consumer credit Chart 10
Note: Estimated coefficients measure by how much, relative to
banks, nonbanks increase their lending to a particular risk group
in response to a one standard deviation contractionary monetary
policy shock. Leverage is total debt to assets; disposable income
is income after tax and interest payments but including rent value
of own property. Unemployed stands for households that have
had a member unemployed during the previous 24 months.
Source: Statistics Denmark and own computations
-2
-1
0
1
2
3
Leverage Disp. income Unemployed
Triple-interaction coefficients

E C O N O M I C M E M O — D AN M A R K S N A T IO N A L B A N K
2 9 NO V E M B E R 2 02 1 — N O . 8
12
References
Auer, R., & Ongena, S. (2019). The countercyclical
capital buffer and the composition of bank
lending.
Chernenko, S., Erel, I., & Prilmeier, R. (2020). Why do
firms borrow directly from nonbanks? Tech.
rep., National Bureau of Economic Research.
Drechsler, I., Savov, A., & Schnabl, P. (2017). The
deposits channel of monetary policy. The
Quarterly Journal of Economics, 132, 1819–
1876.
Elliott, D., Meisenzahl, R. R., & Peydró, J.-L. (2021).
Nonbank lenders as global shock absorbers:
Evidence from US monetary policy spillovers.
Elliott, D., Meisenzahl, R., Peydró, J.-L., & Turner, B. C.
(2020). Nonbanks, banks, and monetary
policy: US loan-level evidence since the
1990s.
Fleckenstein, Q., Gopal, M., Gutierrez Gallardo, G., &
Hillenbrand, S. (2020). Nonbank lending and
credit cyclicality. NYU Stern School of
Business.
Jarociński, M., & Karadi, P. (2020). Deconstructing
monetary policy surprises—the role of
information shocks. American Economic
Journal: Macroeconomics, 12, 1–43.
Jiménez, G., Ongena, S., Peydró, J.-L., & Saurina, J.
(2012). Credit supply and monetary policy:
Identifying the bank balance-sheet channel
with loan applications. American Economic
Review, 102, 2301–26.
Khwaja, A. I., & Mian, A. (2008). Tracing the impact of
bank liquidity shocks: Evidence from an
emerging market. American Economic Review,
98, 1413–42.
Xiao, K. (2020). Monetary transmission through
shadow banks. The Review of Financial
Studies, 33, 2379–2420.
E C O N O M I C M E M O — D AN M A R K S N A T IO N A L B A N K
2 9 NO V E M B E R 2 02 1 — N O . 8
13
Box 1: Regression model
We use data at the borrower-lender-year level to estimate the following regression model in the consumer and
corporate credit markets:
Yb,l,t = 𝛼𝑏,𝑡 + 𝛿𝑙 + 𝛽Nonbank dummy𝑙,𝑡 × Monetary policy shock𝑡−1
+𝛾Nonbank dummy𝑙,𝑡 × Macroeconomic controls𝑡−1 + 휀𝑏,𝑙,𝑡
where the dependent variable Y is either log of total debt outstanding by borrower b to lender l in year t or the
interest rate of that borrower charged by the same lender in year t. Interest rates are computed as the ratio of
payments to mean outstanding debt, where the mean is computed between current year debt and previous year
debt. We estimate the model separately for two samples, one in which borrowers b are firms and another in which
they are households. Our regression model includes two fixed effects. 𝛼𝑏,𝑡 stands for the borrower-time fixed effect.
This fixed effect at the level of the borrower is designed to capture the borrower demand channel which, coupled
with our sample setting in which borrowers have lending agreements with multiple lenders, allows us to distinguish
between credit demand and credit supply effects in the spirit of Khwaja and Mian (2008) and Jiménez et al. (2012).
We also include lender fixed effects, 𝛿𝑙, to ensure that time-invariant lender characteristics such as differences in
business models don’t drive our results.
Our main variable of interest when it comes to determining the role of nonbanks in the transmission of monetary
policy is the interaction term between the nonbank dummy, (Nonbank dummy𝑙,𝑡), which is equal to one if lender l in
year t is a nonbank, and the monetary policy shock in the previous year (Monetary policy shock𝑡−1), which is the
cumulative sum at the annual level of the Jarocinski and Karadi (2020) monetary policy shock series for the euro
area. We use the monetary shock series for the euro area as a source of exogenous variation in Danish interest
rates. This assumption relies on the fact that the Danish Krone is pegged to the Euro and any changes in interest
rates initiated by the European Central Bank will immediately be arbitraged away by financial market participants,
thus transferring near perfectly the monetary policy shocks from the Euro Area to Denmark. To ensure that we
identify the differential effect of monetary policy across banks and nonbanks on corporate and consumer credit as
opposed to a more general differential impact through varying economic conditions, we also include in our
regression interaction terms between the nonbank dummy and a number of macroeconomic variables such as: the
growth rate of real GDP in Denmark, a one-year forecast of the growth rate of GDP in Denmark, the inflation rate in
Denmark, and a stock market volatility index (VIX).
We also examine whether nonbanks tailor their response to changes in monetary policy depending on the type of
clientele that they have a lending arrangement with. To this end, we add to our main regression model above a
triple interaction term which combines the nonbank dummy with the monetary policy shock series and another
dummy that is based on firm or household characteristics. In the case of households, our triple interaction term is
based on a dummy variable that takes the value of 1 if: (i) the households’ debt-to-assets ratio is above the median
ratio, (ii) the households’ disposable income is higher than median income, and (iii) the household has had an
unemployed member over the past 24 months. For firms, the dummy variable takes the value of 1 if the firm is
above the respective median level of (i) leverage, (ii) sales, and (iii) cash ratio. All medians are computed at the
annual level for each household or firm. The equation below describes our model that also includes an interaction
term between the nonbank dummy and the borrower type dummy besides the triple interaction term.
Yb,l,t = 𝛼𝑏,𝑡 + 𝛿𝑙 + 𝛽Nonbank dummy𝑙,𝑡 × Monetary policy shock𝑡−1 + 𝛾Nonbank dummy𝑙,𝑡 × Macroeconomic controls𝑡−1
+ 𝜎Nonbank dummy𝑙,𝑡 × Monetary policy shock𝑡−1 × Borrower type𝑙,𝑡
+ 𝜃Nonbank dummy𝑙,𝑡 × Borrower type𝑙,𝑡 + 휀𝑏,𝑙,𝑡
,

E C O N O M I C M E M O — D AN M A R K S N A T IO N A L B A N K
2 9 NO V E M B E R 2 02 1 — N O . 8
14
Danmarks Nationalbank's Economic Memos are published at www.nationalbanken.dk. A free electronic subscription is also available at the website. The subscriber receives an e-mail notification whenever a new Economic Memo is published. Text may be copied from this publication provided that the source is specifically stated. Changes to or misrepresentation of the content are not permitted. Please direct any enquiries directly to the contributors or to Danmarks Nationalbank, Communications, [email protected].

E C O N O M I C M E M O — D AN M A R K S N A T IO N A L B A N K
2 9 NO V E M B E R 2 02 1 — N O . 8
15
Danmarks Nationalbank's Economic Memos are published at www.nationalbanken.dk. A free electronic subscription is also available at the website. The subscriber receives an e-mail notification whenever a new Economic Memo is published. Text may be copied from this publication provided that the source is specifically stated. Changes to or misrepresentation of the content are not permitted. Please direct any enquiries directly to the contributors or to Danmarks Nationalbank, Communications, [email protected].