nonlinearity in econometrics
DESCRIPTION
Nonlinearity in Econometrics. Andrew P. Blake HKMA/CCBS May 2004. Nonlinearities in Economics. ‘Functional’ nonlinearity Utility functions, production functions Zero-bound constraint, Phillips curves Nonlinear time series Thresholds - exchange rate bands Markov-switching behaviour Chaos - PowerPoint PPT PresentationTRANSCRIPT

Nonlinearity in Econometrics
Andrew P. Blake
HKMA/CCBS May 2004

Nonlinearities in Economics
• ‘Functional’ nonlinearity– Utility functions, production functions– Zero-bound constraint, Phillips curves
• Nonlinear time series– Thresholds - exchange rate bands– Markov-switching behaviour
• Chaos– Rare (and not usually very interesting)

Defining nonlinearity
• Nonlinear ‘in mean’ (Lee, White & Granger 1993)– Null hypothesis
– Alternative
1)|( ttt xxyEP
1)|( ttt xxyEP
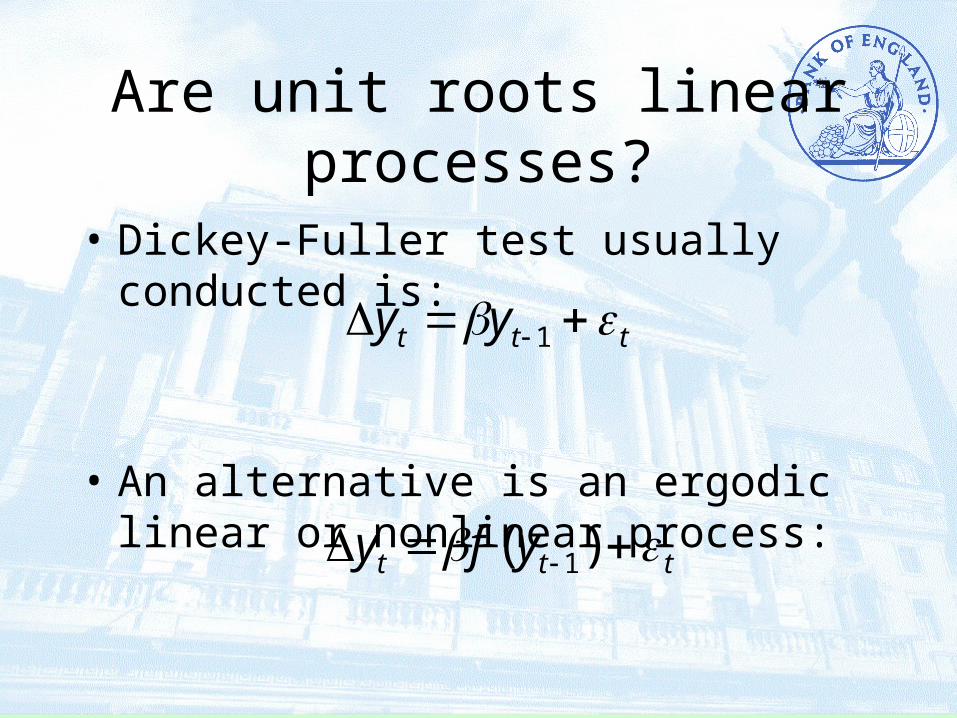
Are unit roots linear processes?
• Dickey-Fuller test usually conducted is:
• An alternative is an ergodic linear or nonlinear process:
ttt yfy )( 1
ttt yy 1

Is ARCH a nonlinear process?
• Not nonlinear ‘in mean’– Forecast value unaffected– Coefficient estimates unbiased but inefficient
• May be nonlinear in argument of conditional variance, i.e.:
,...),,()|( 23
22
211
2 tttttt fhIE

A test for nonlinearity
• Estimate augmented model:
• Construct Wald test of significance of :
• where R is a selector matrix, W the regressors
t
q
jtjjtt xxy
1
),(
2112
~ˆ))((ˆˆ1
qRWWR

Testing in practice
• Need to specify:– Appropriate nonlinear function,– Number of extra functions estimated, q
• Nonlinear function needs to be ‘general’– Has to capture a wide variety of potential
nonlinearities– Needs to be straightforward to implement
(estimation procedure, parametric choices)
),( tj x
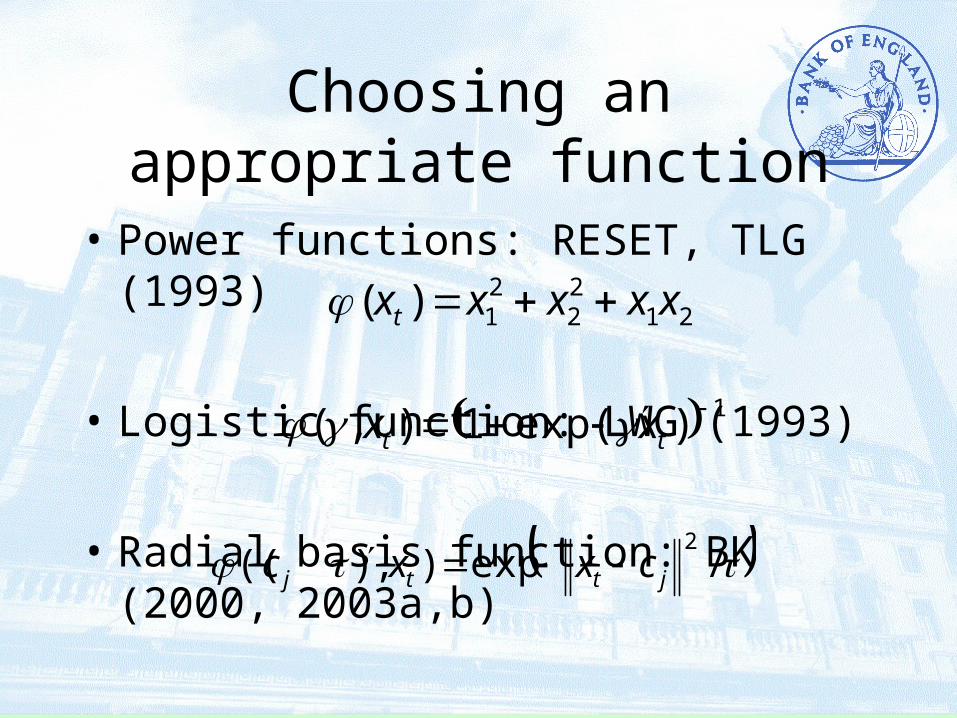
Choosing an appropriate function
• Power functions: RESET, TLG (1993)
• Logistic function: LWG (1993)
• Radial basis function: BK (2000, 2003a,b)
2122
21)( xxxxxt
1)exp(1),( tt xx
/exp),)((2
jttj cxxc

All you ever wanted to know about artificial neural networks….
…but were afraid to ask

Design problems for an ANN test
• Power functions– Choose an expansion
• Logistic function– Choose number of logistic functions
– Randomly generate coefficients
– Identifies under the null
• Radial basis function– Use information criterion to choose RBFs by
significance - Bootstrap problem

How good is a test?
• Evaluate the tests by Monte Carlo– General problem, no analytic results– Small sample distributions unknown
• Size– What is the probability of Type 1 error?– Are the nominal and actual sizes the same?
• Power– What is the probability of Type 2 error?– Is it powerful against different models?

1. Neglected nonlinearity (BK, 2003c)
• Evaluate the size/power characteristics
• Monte Carlo ‘design’– Set up linear model (size)– Set up appropriate nonlinear models (power)– Look at sample size effects
• ‘Bad’ Monte Carlo design can give misleading results

Self Exciting Threshold AR Models
• SETAR : Tong (1978)– Model 1
– Model 2
0 if ,6.0
0 if ,6.0
11
11
ttt
tttt yy
yyy
0 if ,8.0
0 if ,8.0
11
11
ttt
tttt yy
yyy
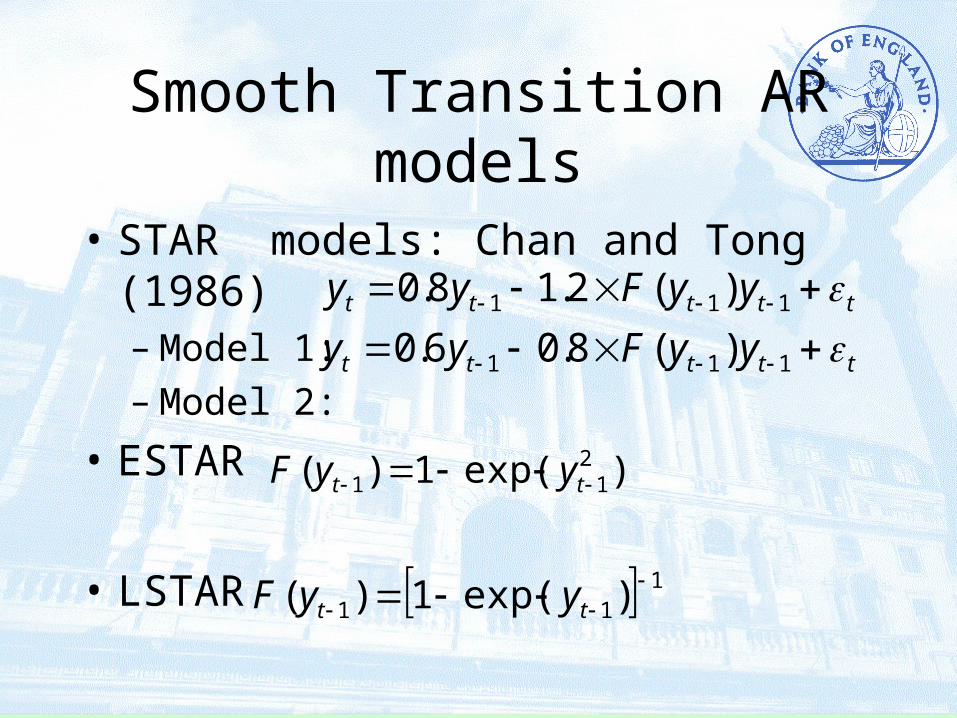
Smooth Transition AR models
• STAR models: Chan and Tong (1986)– Model 1:– Model 2:
• ESTAR
• LSTAR
ttttt yyFyy 111 )(2.18.0
ttttt yyFyy 111 )(8.06.0
)exp(1)( 211 tt yyF
111 )exp(1)(
tt yyF
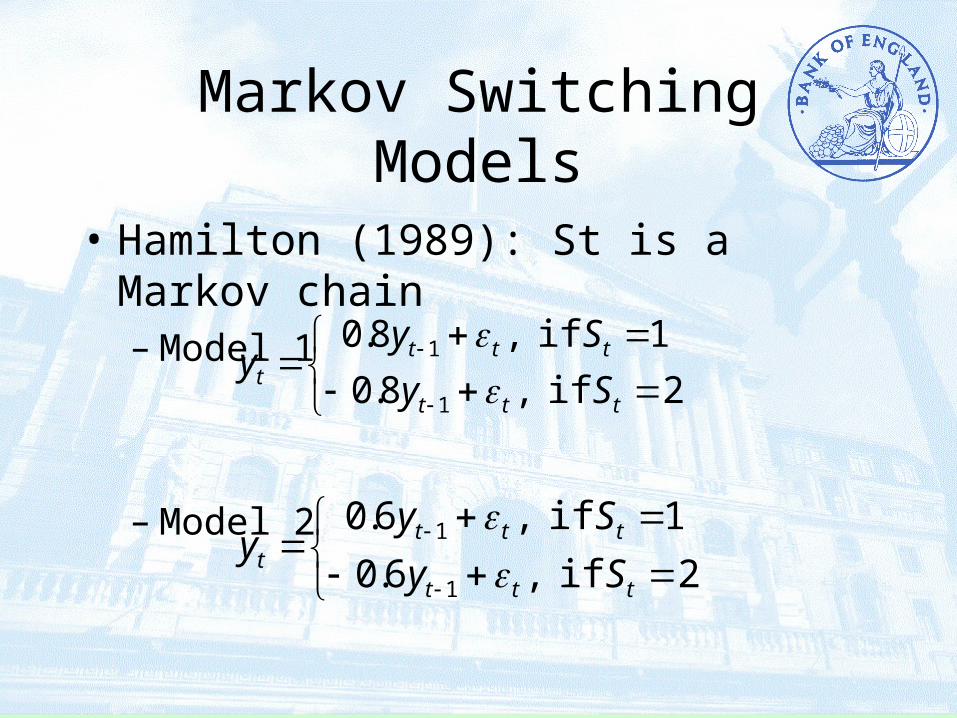
Markov Switching Models
• Hamilton (1989): St is a Markov chain– Model 1
– Model 2
2 if ,8.0
1 if ,8.0
1
1
ttt
tttt Sy
Syy
2 if ,6.0
1 if ,6.0
1
1
ttt
tttt Sy
Syy

Bilinear Models
• Granger and Anderson (1978), common in the finance literature:– Model 1
– Model 2
tttt yy 117.0
tttt yy 113.0
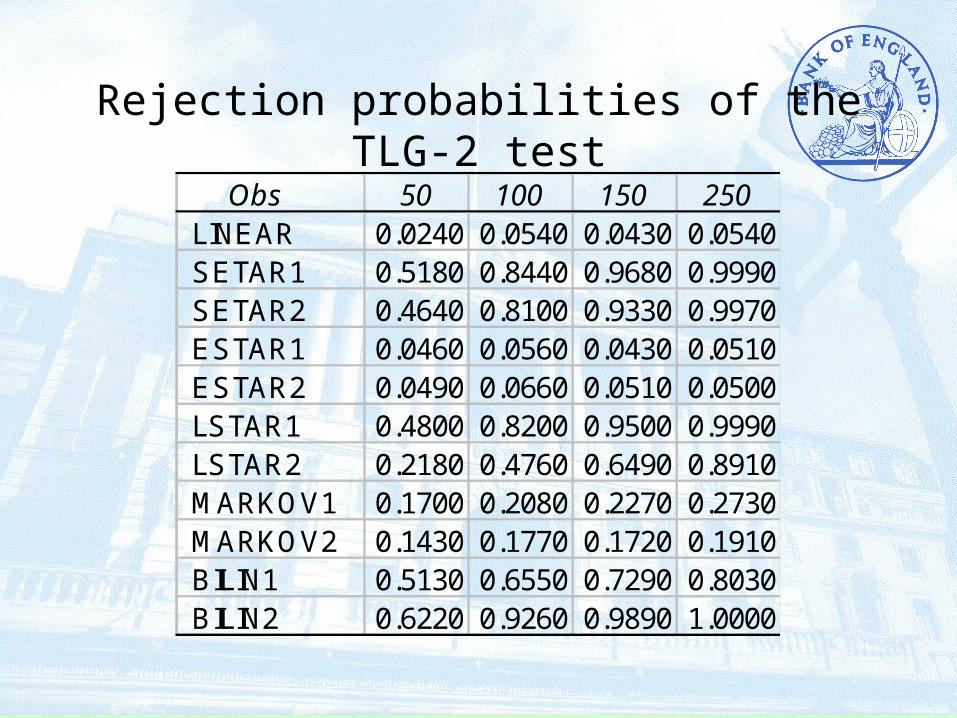
Rejection probabilities of the TLG-2 test
Obs 50 100 150 250 LINEAR 0.0240 0.0540 0.0430 0.0540 SETAR1 0.5180 0.8440 0.9680 0.9990 SETAR2 0.4640 0.8100 0.9330 0.9970 ESTAR1 0.0460 0.0560 0.0430 0.0510 ESTAR2 0.0490 0.0660 0.0510 0.0500 LSTAR1 0.4800 0.8200 0.9500 0.9990 LSTAR2 0.2180 0.4760 0.6490 0.8910 MARKOV1 0.1700 0.2080 0.2270 0.2730 MARKOV2 0.1430 0.1770 0.1720 0.1910 BILIN1 0.5130 0.6550 0.7290 0.8030 BILIN2 0.6220 0.9260 0.9890 1.0000

Rejection probabilities of the LWG test
Obs. 50 100 150 250 LINEAR 0.0330 0.0480 0.0370 0.0550 SETAR1 0.5830 0.9020 0.9890 0.9990 SETAR2 0.4500 0.7960 0.9280 0.9990 ESTAR1 0.2030 0.4190 0.5450 0.7730 ESTAR2 0.1170 0.2350 0.2500 0.4180 LSTAR1 0.3940 0.7540 0.9190 0.9960 LSTAR2 0.1560 0.3960 0.5660 0.8300 MARKOV1 0.2130 0.2990 0.3120 0.4100 MARKOV2 0.1520 0.2110 0.2330 0.2780 BILIN1 0.7320 0.8710 0.9300 0.9540 BILIN2 0.5280 0.8900 0.9820 1.0000

Rejection probabilities of the RBF test
Obs. 50 100 150 250 LINEAR 0.0920 0.0870 0.0790 0.0610 SETAR1 0.7120 0.9320 0.9930 0.9980 SETAR2 0.5840 0.8710 0.9530 1.0000 ESTAR1 0.3330 0.5250 0.6440 0.8170 ESTAR2 0.2360 0.3190 0.3430 0.5000 LSTAR1 0.5530 0.8210 0.9510 0.9980 LSTAR2 0.2830 0.4950 0.6650 0.8890 MARKOV1 0.3970 0.4370 0.4460 0.5190 MARKOV2 0.3060 0.3330 0.3410 0.3930 BILIN1 0.8870 0.9760 0.9920 0.9900 BILIN2 0.6850 0.9390 0.9920 0.9990
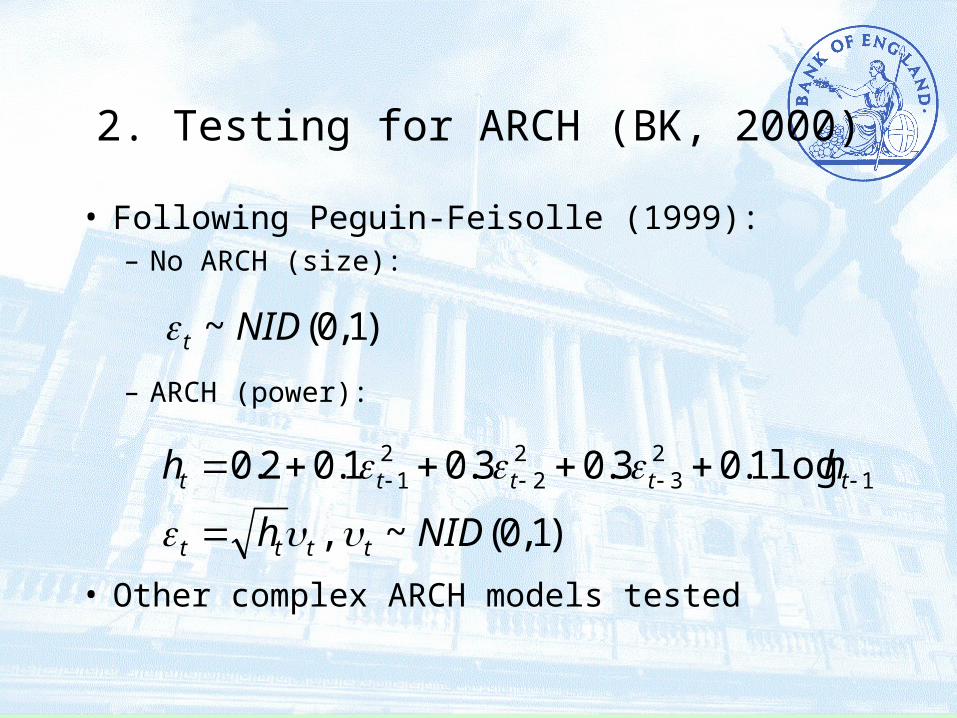
2. Testing for ARCH (BK, 2000)
• Following Peguin-Feisolle (1999):– No ARCH (size):
– ARCH (power):
• Other complex ARCH models tested
)1 ,0(~ NIDt
)1 ,0(~ ,
log1.03.03.01.02.0 12
32
22
1
NIDh
hh
tttt
ttttt

3. Does neglected nonlinearity look like ARCH? (BK, 2003c)
• Often assume that there is a linear model when testing for ARCH effects (we did!)
• Neglected nonlinearity might induce variation in the conditional variance
• ARCH ‘powerful’ against variety of mis-specified models
• Try to construct ‘nonlinearity robust’ ARCH test

Nonlinearity robust ARCH tests
• Complicated problem, as difficult to know what to do
• We propose a ‘nonlinear filter’, i.e. fit a neural network model and test the residuals
• Lots of options, possibilities, pitfalls
• Turns out we can find a good test:– Filter using RBF, AIC– Test using Engle’s LM test

4. Nonlinear unit root testing (BK, 2003a)
• SETAR model again:
• Nonlinear 6:
• Nonlinear 7:
• Nonlinear 8:
ryy
ryyy
ttt
tttt || if ,
|| if ,
112
111
5.2 0.9, 1.3, 21 r
5.3 0.9, 1.3, 21 r
5.0 0.9, 1.7, 21 r
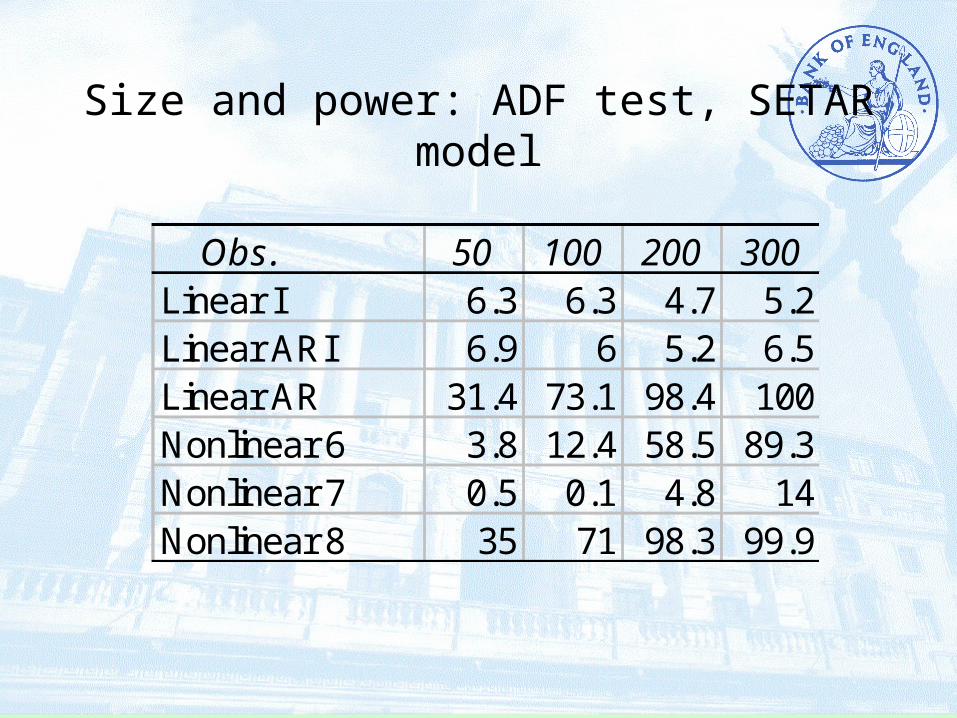
Size and power: ADF test, SETAR model
Obs. 50 100 200 300Linear I 6.3 6.3 4.7 5.2Linear ARI 6.9 6 5.2 6.5Linear AR 31.4 73.1 98.4 100Nonlinear 6 3.8 12.4 58.5 89.3Nonlinear 7 0.5 0.1 4.8 14Nonlinear 8 35 71 98.3 99.9
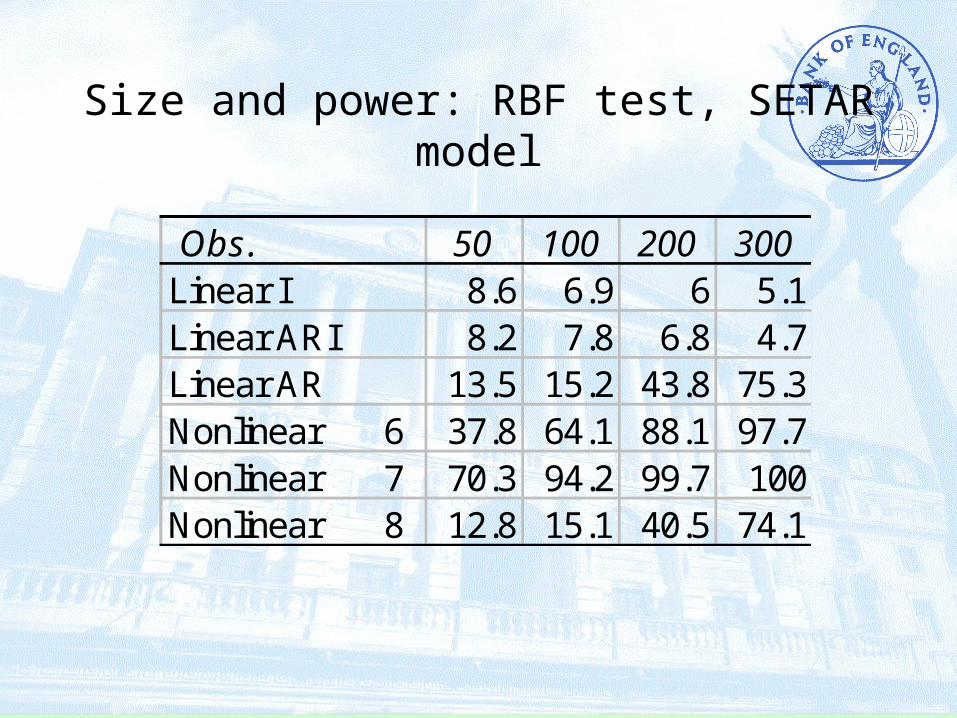
Size and power: RBF test, SETAR model
Obs. 50 100 200 300Linear I 8.6 6.9 6 5.1Linear ARI 8.2 7.8 6.8 4.7Linear AR 13.5 15.2 43.8 75.3Nonlinear 6 37.8 64.1 88.1 97.7Nonlinear 7 70.3 94.2 99.7 100Nonlinear 8 12.8 15.1 40.5 74.1

Conclusions on nonlinearity testing
• Nonlinearity testing is related to other forms of mis-specification
• Structural breaks are a type of nonlinearity• Difficult to detect nonlinearity of the forms we
often model - Markov switching, for example• ‘Too many’ unit roots - need more power against
nonlinear alternatives in general• ‘Too much’ ARCH• Neural networks weren’t that hard, were they?
References
• Blake, A.P. & G. Kapetanios (2000) ‘A radial basis function artificial neural network test for ARCH’, Economic Letters 69(1), 15-23.
• Blake, A.P. & G. Kapetanios (2003a) ‘Pure significance tests of the unit root hypothesis against nonlinear alternatives’, Journal of Time Series Analysis 24(3), 253-267.
• Blake, A.P. & G. Kapetanios (2003b) ‘A radial basis function artificial neural network test for neglected nonlinearity’, The Econometrics Journal 6(2), 357-373.
• Blake, A.P. & G. Kapetanios (2003c) ‘Testing for ARCH in the presence of nonlinearity of unknown form in the conditional mean’, Queen Mary, University of London, Department of Economics Working Paper No. 496.
• Blake, A.P. & G. Kapetanios (2004) ‘Testing for neglected nonlinearity in cointegrating relationships’, QMUL, Dept. Economics WP No. 508.