normandy park - king county
TRANSCRIPT

Residential Revalue
2012 Assessment Roll
Normandy Park
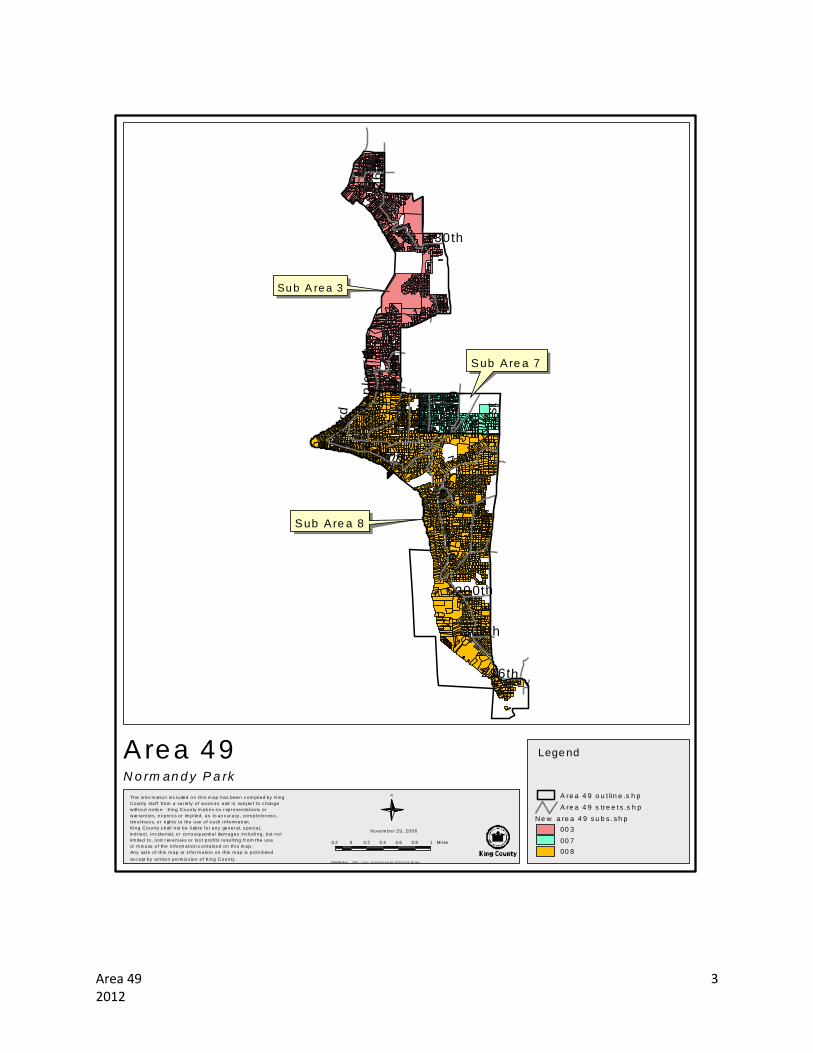
Area 49
King County Department of Assessments
Seattle, Washington

Area 49 2 2012
Department of Assessments Accounting Division 500 Fourth Avenue, ADM-AS-0740 Seattle, WA 98104-2384 (206) 205-0444 FAX (206) 296-0106 Email: [email protected] http://www.kingcounty.gov/assessor/
Dear Property Owners: Property assessments for the 2012 assessment year are being completed by my staff throughout the year and change of value notices are being mailed as neighborhoods are completed. We value property at fee simple, reflecting property at its highest and best use and following the requirement of RCW 84.40.030 to appraise property at true and fair value. We have worked hard to implement your suggestions to place more information in an e-Environment to meet your needs for timely and accurate information. The following report summarizes the results of the 2012 assessment for this area. (See map within report). It is meant to provide you with helpful background information about the process used and basis for property assessments in your area. Fair and uniform assessments set the foundation for effective government and I am pleased that we are able to make continuous and ongoing improvements to serve you. Assessment Standards information is available on the Assessor’s website at: http://www.kingcounty.gov/Assessor/Reports/AreaReports/~/media/Assessor/AreaReports/AppraisalStandard.ashx Please feel welcome to call my staff if you have questions about the property assessment process and how it relates to your property. Sincerely,
Lloyd Hara Assessor
Lloyd Hara Assessor
Area 49 3 2012
1s
t
21
st
8th
Ma
rine
Vie
w
26
th
172nd
19
th
14
t hMa
ple
wild
174th
144th
200th
208th
130th
216th
33
rd 1s
t
Su b A re a 3
Sub Are a 7
Sub A re a 8
The in fo r m ation inc luded on th is m ap has been c om pi led by K ing
Coun ty sta ff from a va r ie ty o f sou rc es and is sub jec t to c hange
w ithou t no tic e . K ing Coun ty m ak es no r ep r esen ta tions o r
war ran ties, ex p res s o r im p l ied , as to ac c ur acy , com p le tenes s ,
tim e l ines s, o r righ ts to the use o f s uch in fo rm a tion .
King Coun ty s hal l not be l iab le fo r any gener a l, s pecia l,
ind i rect, i nc iden ta l, o r cons equentia l dam ages inc lud ing , but no t
lim ited to , lost r ev enues o r los t p ro fi ts r esu l ting fr om the us e
or m is use o f the in fo rm ation c on ta ined on th is m ap .
Any sa le o f th is m ap or in fo r m ation on th is m ap is p roh ib ited
ex c ept by w ri tten pe rm is s ion o f K ing Coun ty .
0.2 0 0.2 0.4 0.6 0.8 1 Mi les
N
Area 49N o rm an d y P a rk
N e w a re a 4 9 s u b s . s h p
00 3
00 7
00 8
A re a 4 9 s tre e t s .s h p
A re a 4 9 o u t lin e .s h p
Novem ber 29 , 2006
Lege nd
Fil e N a m e: JW E c:\a rc v ie w \ne w a re as 20 07\ ar ea 49 .ap r

Area 49 4 2012
Normandy Park’s
Housing

Area 49 5 2012
Grade 7/ Year Built 1949/ Total Living Area 1160
Grade 9/ Year Built 1988/ Total Living Area 3300
Grade 11/ Year Built 1989/ Total Living Area 3450
Grade 8/Year Built 1963/Total Living Area 1880
Grade 10/Year Built 1983/Total Living Area 5420
Grade 13/ Year Built 1998/ Total Living Area 13.350

Area 49 6 2012
Glossary for Improved Sales Condition: Relative to Age and Grade 1= Poor Many repairs needed. Showing serious deterioration 2= Fair Some repairs needed immediately. Much deferred maintenance. 3= Average Depending upon age of improvement; normal amount of upkeep for the age of the home. 4= Good Condition above the norm for the age of the home. Indicates extra attention and care has been taken to maintain 5= Very Good Excellent maintenance and updating on home. Not a total renovation.
Residential Building Grades Grades 1 - 3 Falls short of minimum building standards. Normally cabin or inferior structure. Grade 4 Generally older low quality construction. Does not meet code. Grade 5 Lower construction costs and workmanship. Small, simple design. Grade 6 Lowest grade currently meeting building codes. Low quality materials, simple designs. Grade 7 Average grade of construction and design. Commonly seen in plats and older subdivisions. Grade 8 Just above average in construction and design. Usually better materials in both the exterior and interior finishes. Grade 9 Better architectural design, with extra exterior and interior design and quality. Grade 10 Homes of this quality generally have high quality features. Finish work is better, and more design quality is seen in the floor plans and larger square footage. Grade 11 Custom design and higher quality finish work, with added amenities of solid woods, bathroom fixtures and more luxurious options. Grade 12 Custom design and excellent builders. All materials are of the highest quality and all conveniences are present. Grade 13 Generally custom designed and built. Approaching the Mansion level. Large amount of highest quality cabinet work, wood trim and marble; large entries.

Area 49 7 2012
Summary Characteristics-Based Market Adjustment for 2012 Assessment Roll
Area Name / Number: Normandy Park /Area 49 Number of Improved Sales: 268 Range of Sale Dates: 1/1/2009 – 1/1/2012
Sales – Average Improved Valuation Change Summary
Land Imps Total Sale Price* Ratio COD
2011 Value $179,700 $237,800 $417,500
2012 Value $172,100 $229,500 $401,600 $442,600 90.7% 9.99%
Change -$7,600 -$8,300 -$15,900
% Change -4.2% -3.5% -3.8%
*Sales are time adjusted to 1/1/2012. Coefficient of Dispersion (COD) is a measure of the uniformity of the predicted assessed values for properties within this geographic area. The lower the COD, the more uniform are the predicted assessed values. Assessment standards prescribed by the International Association of Assessing Officers identify that the COD in rural or diverse neighborhoods should be no more that 20%. In the face of smaller overall sales volume, an unstable real property market and an increasing number of financial institution re-sales, the resulting COD meets or exceeds the industry assessment standards.
Population - Improved Parcel Summary:
Land Imps Total
2011 Value $194,100 $224,500 $418,600
2012 Value $186,000 $216,700 $402,700
Percent Change -4.2% -3.5% -3.8%
Number of one to three unit residences in the population: 5339 Summary of Findings: The analysis for this area consisted of a general review of applicable characteristics such as grade, age, condition, stories, living area, views, waterfront, lot size, land problems and neighborhoods. The analysis results showed that the area required a single standard adjustment. We recommend posting these values for the 2012 Assessment Roll.

Area 49 8 2012
Sales Sample Representation of Population - Year Built / Renovated
Sales Sample Population
Year Built/Ren Frequency % Sales Sample Year Built/Ren Frequency % Population
1910 0 0.00% 1910 10 0.19%
1920 4 1.49% 1920 99 1.85%
1930 3 1.12% 1930 110 2.06%
1940 7 2.61% 1940 153 2.87%
1950 25 9.33% 1950 635 11.89%
1960 114 42.54% 1960 2090 39.15%
1970 32 11.94% 1970 765 14.33%
1980 19 7.09% 1980 493 9.23%
1990 24 8.96% 1990 416 7.79%
2000 12 4.48% 2000 316 5.92%
2011 28 10.45% 2011 252 4.72%
268 5339
0.00%
5.00%
10.00%
15.00%
20.00%
25.00%
30.00%
35.00%
40.00%
45.00%
1910 1920 1930 1940 1950 1960 1970 1980 1990 2000 2011
Year Built/Ren
% Sales Sample
% Population
The sales sample frequency distribution follows the population distribution very closely with regard to Year Built/Renovated. This distribution is ideal for both accurate analysis and appraisals.

Area 49 9 2012
Sales Sample Representation of Population - Above Grade Living Area
Sales Sample Population
AGLA Frequency % Sales Sample AGLA Frequency % Population
500 0 0.00% 500 7 0.13%
1000 13 4.85% 1000 320 5.99%
1500 96 35.82% 1500 2005 37.55%
2000 80 29.85% 2000 1531 28.68%
2500 34 12.69% 2500 731 13.69%
3000 22 8.21% 3000 358 6.71%
3500 12 4.48% 3500 187 3.50%
4000 8 2.99% 4000 104 1.95%
4500 2 0.75% 4500 51 0.96%
5000 1 0.37% 5000 19 0.36%
5500 0 0.00% 5500 14 0.26%
7500 0 0.00% 7500+ 12 0.22%
268 5339
0.00%
5.00%
10.00%
15.00%
20.00%
25.00%
30.00%
35.00%
40.00%
500 1000 1500 2000 2500 3000 3500 4000 4500 5000 5500 7500
Above Grade Living Area
% Sales Sample
% Population
The sales sample frequency distribution follows the population distribution very closely with regard to
Above Grade Living Area. This distribution is ideal for both accurate analysis and appraisals.

Area 49 10 2012
Sales Sample Representation of Population - Grade
Sales Sample Population
Grade Frequency % Sales Sample Grade Frequency % Population
1 0 0.00% 1 0 0.00%
2 0 0.00% 2 0 0.00%
3 0 0.00% 3 2 0.04%
4 0 0.00% 4 9 0.17%
5 0 0.00% 5 84 1.57%
6 15 5.60% 6 464 8.69%
7 102 38.06% 7 1957 36.65%
8 98 36.57% 8 1962 36.75%
9 37 13.81% 9 554 10.38%
10 10 3.73% 10 201 3.76%
11 6 2.24% 11 79 1.48%
12 0 0.00% 12 20 0.37%
13 0 0.00% 13 7 0.13%
268 5339
0.00%
5.00%
10.00%
15.00%
20.00%
25.00%
30.00%
35.00%
40.00%
1 2 3 4 5 6 7 8 9 10 11 12 13
Grade
% Sales Sample
% Population
The sales sample frequency distribution follows the population distribution very closely with regard to
Building Grade. This distribution is ideal for both accurate analysis and appraisals.

Area 49 11 2012
Sales Screening for Improved Parcel Analysis In order to ensure that the Assessor’s analysis of sales of improved properties best reflects the market value of the majority of the properties within an area, non-typical properties must be removed so a representative sales sample can be analyzed to determine the new valuation level. The following list illustrates examples of non-typical properties which are removed prior to the beginning of the analysis.
1. Vacant parcels 2. Mobile Home parcels 3. Multi-Parcel or Multi Building parcels 4. New construction where less than a 100% complete house was assessed for 2011 5. Existing residences where the data for 2011 is significantly different than the data for 2012 due
to remodeling 6. Parcels with improvement values, but no characteristics 7. Parcels with either land or improvement values of $25,000 or less posted for the 2011
Assessment Roll 8. Short sales, financial institution re-sales and foreclosure sales verified or appearing to be not at
market 9. Others as identified in the sales removed list
(See the attached Improved Sales Used in this Annual Update Analysis and Improved Sales Removed from this Annual Update Analysis for more detailed information)
Land Update Vacant land in this area is in a holding pattern with a strong lack of development. This results in limited land segregation and permit activity. Based on the 4 usable land sales available in the area and supplemented by the value decrease in sales of improved parcels, a 3.8% overall decrease (based on truncation) was made to the land assessment for the 2012 Assessment Year.
Improved Parcel Update The analysis for this area consisted of a general review of applicable characteristics such as grade, age, condition, stories, living area, views, waterfront, lot size, land problems and neighborhoods. The analysis results showed that the area required a single standard adjustment. With the exception of real property mobile home parcels & parcels with “accessory only” improvements, the new recommended values on all improved parcels were based on the analysis of the 268 useable residential sales in the area. Sales used in the valuation model were time adjusted to January 1, 2012. The chosen adjustment model was developed using multiple regression. An explanatory adjustment table is included in this report.

Area 49 12 2012
Mobile Home Update There were an inadequate number of sales for an analysis (i.e. 1 sale) of Mobile Homes within this area, therefore Mobile Homes received the Total % Change indicated by the sales sample as reflected on the Summary page.
Results The resulting assessment level is 90.7%. The standard statistical measures of valuation performance are all within the IAAO recommended range of .90 to 1.10. Application of these recommended values for the 2012 assessment year (taxes payable in 2013) results in an average total change from the 2011 assessments of -3.8%. This decrease is due partly to market changes over time and the previous assessment levels. Note: Additional information may reside in the Assessor’s Real Property Database, Assessor’s procedures, Assessor’s “field” maps, Revalue Plan, separate studies, and statutes. Any properties excluded from the annual up-date process are noted in RealProperty.
Area 49 13 2012
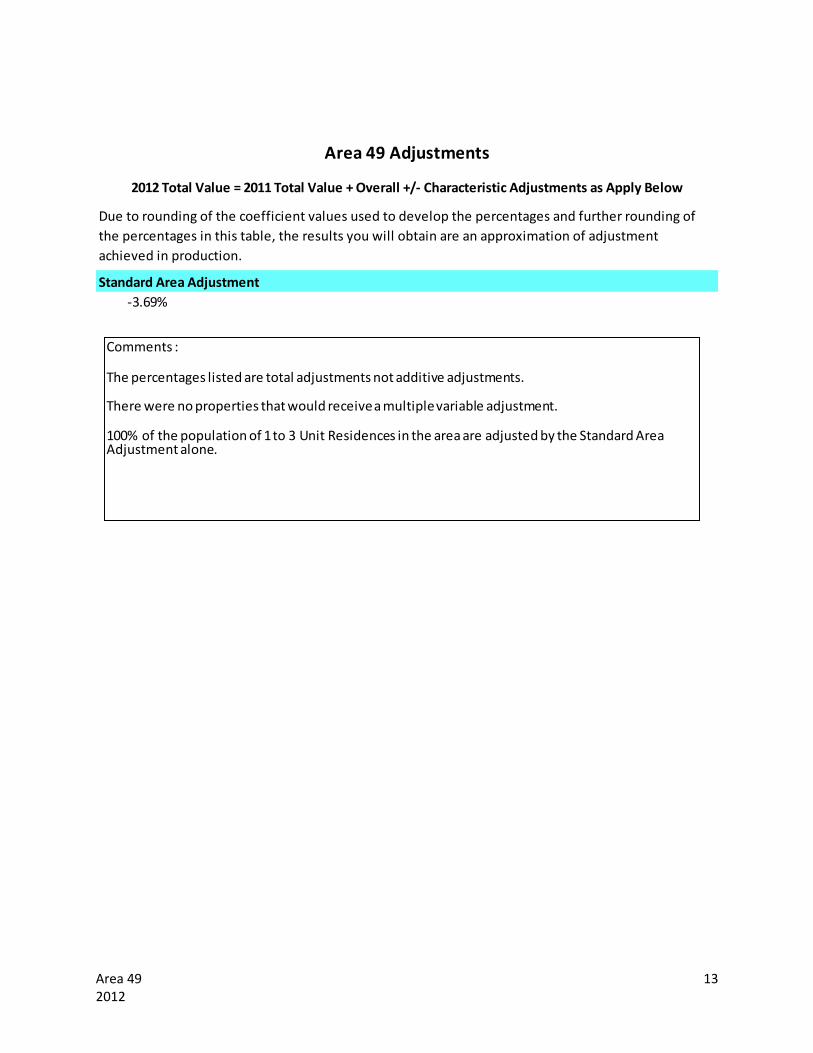
Standard Area Adjustment
-3.69%
Area 49 Adjustments
2012 Total Value = 2011 Total Value + Overall +/- Characteristic Adjustments as Apply Below
Due to rounding of the coefficient values used to develop the percentages and further rounding of
the percentages in this table, the results you will obtain are an approximation of adjustment
achieved in production.
Comments :
The percentages listed are total adjustments not additive adjustments.
There were no properties that would receive a multiple variable adjustment.
100% of the population of 1 to 3 Unit Residences in the area are adjusted by the Standard Area Adjustment alone.

Area 49 14 2012
Area 49 Market Value Changes Over Time In a changing market, recognition of a sales trend to adjust a population of sold properties to a common date is required to allow for value differences over time between a range of sales dates and the assessment date. The following chart shows the % time adjustment required for sales to reflect the indicated market value as of the assessment date, January 1, 2012. For example, a sale of $525000 which occurred on August 1, 2009 would be adjusted by the time trend factor of 0.883, resulting in an adjusted value of $463,000 ($525000 X .883=$463,575 – rounded to the nearest $1000.
Market Adjustment to 1/1/2012
Sale Date Downward Adjustment
(Factor) Equivalent Percent
1/1/2009 0.854 -14.6%
2/1/2009 0.859 -14.1%
3/1/2009 0.862 -13.8%
4/1/2009 0.866 -13.4%
5/1/2009 0.870 -13.0%
6/1/2009 0.875 -12.5%
7/1/2009 0.879 -12.1%
8/1/2009 0.883 -11.7%
9/1/2009 0.887 -11.3%
10/1/2009 0.891 -10.9%
11/1/2009 0.895 -10.5%
12/1/2009 0.899 -10.1%
1/1/2010 0.903 -9.7%
2/1/2010 0.907 -9.3%
3/1/2010 0.911 -8.9%
4/1/2010 0.915 -8.5%
5/1/2010 0.919 -8.1%
6/1/2010 0.923 -7.7%
7/1/2010 0.927 -7.3%
8/1/2010 0.931 -6.9%
9/1/2010 0.935 -6.5%
10/1/2010 0.939 -6.1%
11/1/2010 0.943 -5.7%
12/1/2010 0.947 -5.3%
1/1/2011 0.951 -4.9%
2/1/2011 0.956 -4.4%
3/1/2011 0.959 -4.1%
4/1/2011 0.963 -3.7%
5/1/2011 0.967 -3.3%
6/1/2011 0.972 -2.8%
7/1/2011 0.976 -2.4%
8/1/2011 0.980 -2.0%
9/1/2011 0.984 -1.6%
10/1/2011 0.988 -1.2%
11/1/2011 0.992 -0.8%
12/1/2011 0.996 -0.4%
1/1/2012 1.000 0.0%

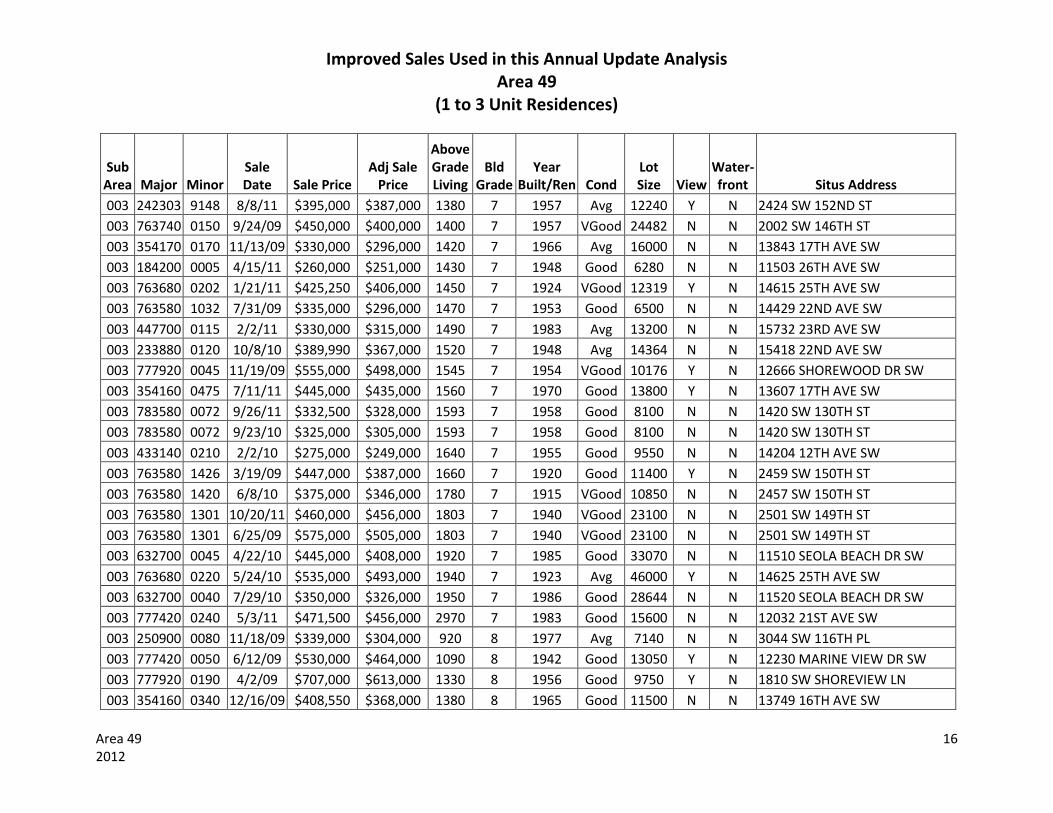
Improved Sales Used in this Annual Update Analysis Area 49
(1 to 3 Unit Residences)
Area 49 15 2012
Sub Area Major Minor
Sale Date Sale Price
Adj Sale Price
Above Grade Living
Bld Grade
Year Built/Ren Cond
Lot Size View
Water- front Situs Address
003 233880 0180 2/10/11 $245,000 $234,000 870 6 1947 Avg 7847 N N 15427 21ST AVE SW
003 433140 0065 6/28/10 $235,000 $218,000 1130 6 1950 Good 8320 N N 14322 11TH AVE SW
003 433140 0085 1/5/10 $300,000 $271,000 1400 6 1952 Good 8960 N N 14234 11TH AVE SW
003 763580 1162 9/14/10 $335,000 $314,000 1570 6 1947 Good 10400 N N 2415 SW 146TH ST
003 233880 0190 11/13/09 $297,000 $266,000 1580 6 2002 Avg 7847 N N 15445 21ST AVE SW
003 447580 0035 8/14/09 $410,000 $363,000 1660 6 1918 Good 12000 Y N 15245 22ND AVE SW
003 632600 0216 9/27/10 $270,000 $253,000 910 7 1962 Avg 11087 N N 2910 SW 119TH ST
003 783580 0345 8/12/11 $255,000 $250,000 930 7 1955 Avg 8277 N N 1127 SW 134TH ST
003 763580 1412 7/9/10 $369,850 $343,000 980 7 1955 Avg 8680 N N 2402 SW 150TH ST
003 810300 0125 9/8/09 $330,000 $293,000 1070 7 1953 Avg 7500 N N 2709 SW 114TH ST
003 632700 0135 5/21/10 $395,000 $364,000 1150 7 1954 Good 8700 N N 11556 30TH PL SW
003 777380 0020 7/27/09 $485,000 $428,000 1150 7 1949 Good 13341 Y N 12009 26TH AVE SW
003 632700 0065 12/10/09 $330,000 $297,000 1160 7 1953 Avg 13446 N N 11507 30TH PL SW
003 632700 0075 3/22/11 $362,250 $349,000 1160 7 1954 Good 13236 N N 11433 30TH PL SW
003 632700 0140 5/12/10 $360,000 $331,000 1190 7 1954 Good 9700 N N 11550 30TH PL SW
003 610240 0070 11/12/10 $296,000 $280,000 1200 7 1957 Avg 14109 N N 15212 26TH AVE SW
003 632600 0045 8/10/10 $305,000 $284,000 1210 7 2006 Avg 7200 N N 11515 29TH AVE SW
003 763580 1024 12/9/11 $319,000 $318,000 1220 7 1955 Good 7500 N N 14415 22ND AVE SW
003 777420 0095 9/22/10 $495,000 $464,000 1230 7 1948 Good 15901 Y N 12122 25TH AVE SW
003 354160 0110 4/7/10 $331,000 $303,000 1250 7 1971 Avg 11700 N N 13908 15TH PL SW
003 810300 0007 9/10/09 $308,000 $273,000 1270 7 1961 Avg 7800 N N 2605 SW 112TH ST
003 763740 0140 6/23/10 $379,000 $351,000 1330 7 1946 Avg 21814 N N 2010 SW 146TH ST
003 777420 0160 6/24/09 $655,000 $575,000 1330 7 1948 Good 26149 Y N 12240 25TH CT SW
Improved Sales Used in this Annual Update Analysis Area 49
(1 to 3 Unit Residences)
Area 49 16 2012
Sub Area Major Minor
Sale Date Sale Price
Adj Sale Price
Above Grade Living
Bld Grade
Year Built/Ren Cond
Lot Size View
Water- front Situs Address
003 242303 9148 8/8/11 $395,000 $387,000 1380 7 1957 Avg 12240 Y N 2424 SW 152ND ST
003 763740 0150 9/24/09 $450,000 $400,000 1400 7 1957 VGood 24482 N N 2002 SW 146TH ST
003 354170 0170 11/13/09 $330,000 $296,000 1420 7 1966 Avg 16000 N N 13843 17TH AVE SW
003 184200 0005 4/15/11 $260,000 $251,000 1430 7 1948 Good 6280 N N 11503 26TH AVE SW
003 763680 0202 1/21/11 $425,250 $406,000 1450 7 1924 VGood 12319 Y N 14615 25TH AVE SW
003 763580 1032 7/31/09 $335,000 $296,000 1470 7 1953 Good 6500 N N 14429 22ND AVE SW
003 447700 0115 2/2/11 $330,000 $315,000 1490 7 1983 Avg 13200 N N 15732 23RD AVE SW
003 233880 0120 10/8/10 $389,990 $367,000 1520 7 1948 Avg 14364 N N 15418 22ND AVE SW
003 777920 0045 11/19/09 $555,000 $498,000 1545 7 1954 VGood 10176 Y N 12666 SHOREWOOD DR SW
003 354160 0475 7/11/11 $445,000 $435,000 1560 7 1970 Good 13800 Y N 13607 17TH AVE SW
003 783580 0072 9/26/11 $332,500 $328,000 1593 7 1958 Good 8100 N N 1420 SW 130TH ST
003 783580 0072 9/23/10 $325,000 $305,000 1593 7 1958 Good 8100 N N 1420 SW 130TH ST
003 433140 0210 2/2/10 $275,000 $249,000 1640 7 1955 Good 9550 N N 14204 12TH AVE SW
003 763580 1426 3/19/09 $447,000 $387,000 1660 7 1920 Good 11400 Y N 2459 SW 150TH ST
003 763580 1420 6/8/10 $375,000 $346,000 1780 7 1915 VGood 10850 N N 2457 SW 150TH ST
003 763580 1301 10/20/11 $460,000 $456,000 1803 7 1940 VGood 23100 N N 2501 SW 149TH ST
003 763580 1301 6/25/09 $575,000 $505,000 1803 7 1940 VGood 23100 N N 2501 SW 149TH ST
003 632700 0045 4/22/10 $445,000 $408,000 1920 7 1985 Good 33070 N N 11510 SEOLA BEACH DR SW
003 763680 0220 5/24/10 $535,000 $493,000 1940 7 1923 Avg 46000 Y N 14625 25TH AVE SW
003 632700 0040 7/29/10 $350,000 $326,000 1950 7 1986 Good 28644 N N 11520 SEOLA BEACH DR SW
003 777420 0240 5/3/11 $471,500 $456,000 2970 7 1983 Good 15600 N N 12032 21ST AVE SW
003 250900 0080 11/18/09 $339,000 $304,000 920 8 1977 Avg 7140 N N 3044 SW 116TH PL
003 777420 0050 6/12/09 $530,000 $464,000 1090 8 1942 Good 13050 Y N 12230 MARINE VIEW DR SW
003 777920 0190 4/2/09 $707,000 $613,000 1330 8 1956 Good 9750 Y N 1810 SW SHOREVIEW LN
003 354160 0340 12/16/09 $408,550 $368,000 1380 8 1965 Good 11500 N N 13749 16TH AVE SW

Improved Sales Used in this Annual Update Analysis Area 49
(1 to 3 Unit Residences)
Area 49 17 2012
Sub Area Major Minor
Sale Date Sale Price
Adj Sale Price
Above Grade Living
Bld Grade
Year Built/Ren Cond
Lot Size View
Water- front Situs Address
003 250900 0040 2/25/09 $475,000 $409,000 1400 8 1963 Good 7200 N N 3020 SW 116TH PL
003 179500 0020 4/29/11 $425,500 $412,000 1420 8 1975 Avg 9000 Y N 1909 SW COVE POINT RD
003 763580 1191 6/29/10 $355,000 $329,000 1450 8 1959 Good 12000 N N 14430 25TH AVE SW
003 778400 0200 3/14/11 $400,000 $384,000 1450 8 1950 Good 9750 Y N 12129 MARINE VIEW DR SW
003 885900 0035 9/6/11 $398,000 $392,000 1490 8 1955 Good 6504 Y N 11914 26TH PL SW
003 354160 0125 7/22/09 $353,000 $311,000 1540 8 1969 Good 11000 N N 13926 15TH PL SW
003 354160 0300 12/14/09 $380,000 $342,000 1570 8 1974 Avg 20100 N N 13827 16TH AVE SW
003 273160 0080 6/18/09 $410,000 $359,000 1580 8 1975 Good 9200 N N 14981 22ND AVE SW
003 777920 0445 4/20/09 $457,000 $397,000 1600 8 1962 Avg 16900 N N 12816 SHOREWOOD PL SW
003 354160 0020 11/3/11 $440,000 $437,000 1670 8 1969 Avg 12500 Y N 1434 SW 137TH ST
003 763580 1100 12/28/09 $382,000 $345,000 1670 8 1940 Good 9100 N N 14656 24TH AVE SW
003 778440 0110 4/16/10 $631,500 $579,000 1730 8 1955 Good 9450 Y N 12249 MARINE VIEW DR SW
003 632600 0300 6/23/11 $365,000 $356,000 1820 8 1953 Good 7800 Y N 11922 30TH AVE SW
003 777920 0280 3/12/09 $567,000 $490,000 1870 8 1959 Avg 8786 Y N 12863 SHORE CREST DR SW
003 273160 0055 8/2/10 $478,000 $445,000 1940 8 1946 VGood 9200 N N 15108 24TH AVE SW
003 447580 0025 4/15/09 $410,000 $356,000 1970 8 1997 Avg 7936 N N 15250 22ND AVE SW
003 273160 0091 9/14/10 $345,800 $324,000 2260 8 1965 Avg 4600 N N 14961 22ND AVE SW
003 763580 1401 9/1/10 $599,950 $561,000 2700 8 1998 Avg 18370 N N 2428 SW 150TH ST
003 777920 0355 10/12/09 $732,500 $654,000 3610 8 1954 Good 17483 Y N 13111 SHOREWOOD DR SW
003 763240 0277 2/2/11 $900,000 $860,000 3910 8 1993 Avg 15490 Y Y 15929 MAPLEWILD AVE SW
003 447700 0290 10/10/11 $415,000 $410,000 1130 9 1975 Avg 15400 Y N 15911 25TH AVE SW
003 778400 0300 12/9/09 $860,000 $774,000 1309 9 1977 Good 21300 Y Y 12209 SHOREWOOD DR SW
003 296680 0035 7/14/10 $745,000 $692,000 2190 9 1992 Avg 9943 Y N 15240 MAPLEWILD AVE SW
003 777920 0035 2/27/09 $670,000 $578,000 2240 9 1977 Avg 11610 Y N 12654 SHOREWOOD DR SW
003 233880 0045 9/26/10 $650,000 $610,000 3138 10 2005 Avg 12135 Y N 2240 SW 156TH ST

Improved Sales Used in this Annual Update Analysis Area 49
(1 to 3 Unit Residences)
Area 49 18 2012
Sub Area Major Minor
Sale Date Sale Price
Adj Sale Price
Above Grade Living
Bld Grade
Year Built/Ren Cond
Lot Size View
Water- front Situs Address
003 447700 0005 3/13/09 $875,000 $756,000 3471 10 2008 Avg 27929 N N 15685 21ST AVE SW
003 447700 0280 4/13/11 $910,000 $878,000 2040 11 2002 Avg 11800 Y N 15889 25TH AVE SW
007 296880 1605 9/23/09 $299,000 $266,000 720 6 1954 VGood 6720 N N 16227 8TH AVE SW
007 296880 0125 8/2/11 $205,000 $201,000 880 6 1946 Good 7620 N N 16024 10TH AVE SW
007 296880 0830 3/12/10 $244,000 $223,000 900 6 1948 Good 7620 N N 16245 15TH AVE SW
007 296880 0576 9/1/10 $235,000 $220,000 1010 6 1952 VGood 7440 N N 1419 SW 160TH ST
007 296880 0115 4/12/10 $272,000 $249,000 1080 6 1954 VGood 7620 N N 16012 10TH AVE SW
007 121400 0085 4/1/10 $265,000 $242,000 1180 6 1951 Good 8532 N N 16004 6TH AVE SW
007 296880 1165 11/3/10 $255,000 $241,000 900 7 1972 Avg 8370 N N 16233 12TH AVE SW
007 296880 0846 9/24/10 $255,000 $239,000 920 7 1954 VGood 6968 N N 1502 SW 164TH ST
007 296880 1360 7/9/09 $277,000 $244,000 1030 7 1955 Good 7620 N N 16250 11TH AVE SW
007 024300 0060 4/14/10 $285,000 $261,000 1070 7 1953 VGood 8100 N N 16431 12TH AVE SW
007 441560 0045 6/23/09 $349,000 $306,000 1090 7 1953 VGood 7599 N N 16660 14TH AVE SW
007 024300 0536 7/21/09 $265,000 $234,000 1120 7 1953 Good 9720 N N 16629 14TH AVE SW
007 296880 1085 4/29/09 $282,000 $245,000 1180 7 1965 Good 7620 N N 16204 13TH AVE SW
007 419740 0149 4/9/09 $310,000 $269,000 1204 7 1985 Good 18121 N N 16627 6TH AVE SW
007 024300 0380 11/17/10 $340,000 $321,000 1220 7 1955 VGood 7800 N N 16620 16TH AVE SW
007 816760 0035 4/14/10 $305,000 $280,000 1370 7 1958 VGood 11200 N N 16619 SYLVESTER RD SW
007 024300 0365 5/27/09 $317,500 $277,000 1410 7 1954 Avg 8645 N N 16604 16TH AVE SW
007 093600 0166 8/26/09 $465,000 $412,000 1430 7 1936 VGood 18522 N N 132 SW 166TH ST
007 296880 1005 5/7/10 $271,500 $250,000 1440 7 2009 Avg 7620 N N 16238 14TH AVE SW
007 121700 0383 9/16/09 $307,500 $273,000 1510 7 1947 Good 10800 N N 16429 11TH AVE SW
007 296880 1225 5/12/09 $333,000 $290,000 1680 7 1955 Good 7620 N N 16232 12TH AVE SW
007 093600 0105 4/27/11 $410,000 $396,000 1370 8 1961 VGood 36261 N N 16437 3RD AVE SW
007 296880 1135 10/28/09 $445,000 $398,000 1502 8 2009 Avg 8854 N N 1284 SW 164TH ST
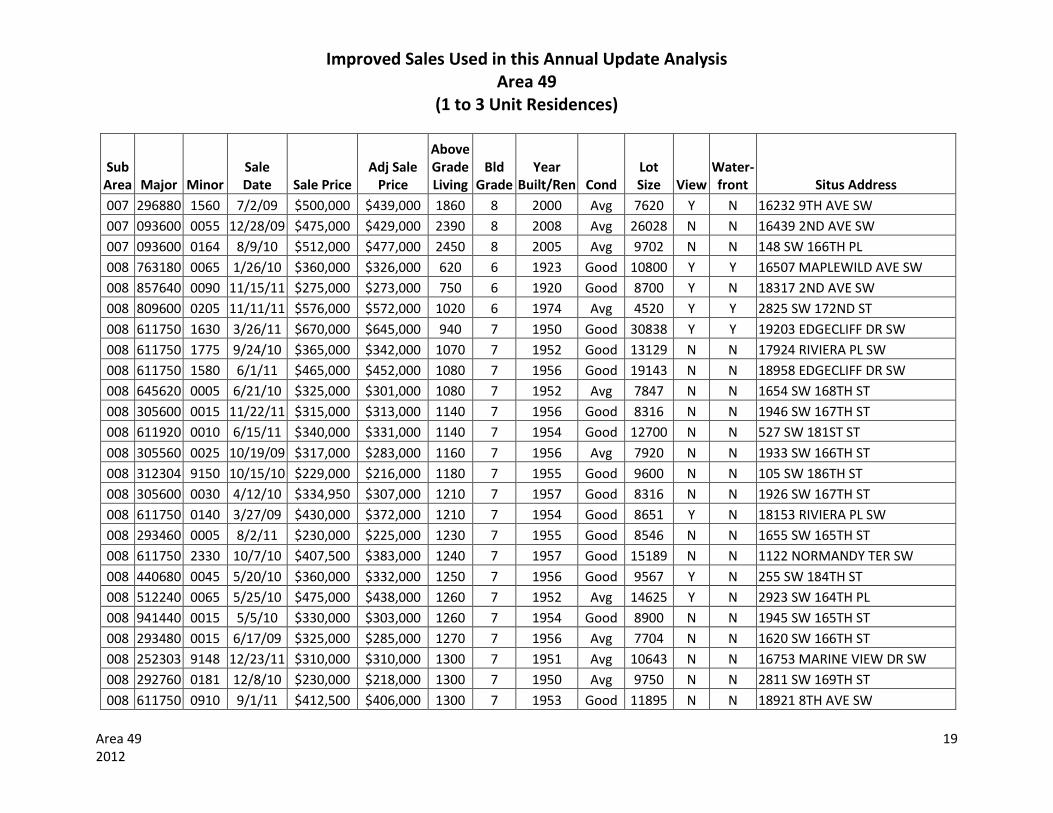
Improved Sales Used in this Annual Update Analysis Area 49
(1 to 3 Unit Residences)
Area 49 19 2012
Sub Area Major Minor
Sale Date Sale Price
Adj Sale Price
Above Grade Living
Bld Grade
Year Built/Ren Cond
Lot Size View
Water- front Situs Address
007 296880 1560 7/2/09 $500,000 $439,000 1860 8 2000 Avg 7620 Y N 16232 9TH AVE SW
007 093600 0055 12/28/09 $475,000 $429,000 2390 8 2008 Avg 26028 N N 16439 2ND AVE SW
007 093600 0164 8/9/10 $512,000 $477,000 2450 8 2005 Avg 9702 N N 148 SW 166TH PL
008 763180 0065 1/26/10 $360,000 $326,000 620 6 1923 Good 10800 Y Y 16507 MAPLEWILD AVE SW
008 857640 0090 11/15/11 $275,000 $273,000 750 6 1920 Good 8700 Y N 18317 2ND AVE SW
008 809600 0205 11/11/11 $576,000 $572,000 1020 6 1974 Avg 4520 Y Y 2825 SW 172ND ST
008 611750 1630 3/26/11 $670,000 $645,000 940 7 1950 Good 30838 Y Y 19203 EDGECLIFF DR SW
008 611750 1775 9/24/10 $365,000 $342,000 1070 7 1952 Good 13129 N N 17924 RIVIERA PL SW
008 611750 1580 6/1/11 $465,000 $452,000 1080 7 1956 Good 19143 N N 18958 EDGECLIFF DR SW
008 645620 0005 6/21/10 $325,000 $301,000 1080 7 1952 Avg 7847 N N 1654 SW 168TH ST
008 305600 0015 11/22/11 $315,000 $313,000 1140 7 1956 Good 8316 N N 1946 SW 167TH ST
008 611920 0010 6/15/11 $340,000 $331,000 1140 7 1954 Good 12700 N N 527 SW 181ST ST
008 305560 0025 10/19/09 $317,000 $283,000 1160 7 1956 Avg 7920 N N 1933 SW 166TH ST
008 312304 9150 10/15/10 $229,000 $216,000 1180 7 1955 Good 9600 N N 105 SW 186TH ST
008 305600 0030 4/12/10 $334,950 $307,000 1210 7 1957 Good 8316 N N 1926 SW 167TH ST
008 611750 0140 3/27/09 $430,000 $372,000 1210 7 1954 Good 8651 Y N 18153 RIVIERA PL SW
008 293460 0005 8/2/11 $230,000 $225,000 1230 7 1955 Good 8546 N N 1655 SW 165TH ST
008 611750 2330 10/7/10 $407,500 $383,000 1240 7 1957 Good 15189 N N 1122 NORMANDY TER SW
008 440680 0045 5/20/10 $360,000 $332,000 1250 7 1956 Good 9567 Y N 255 SW 184TH ST
008 512240 0065 5/25/10 $475,000 $438,000 1260 7 1952 Avg 14625 Y N 2923 SW 164TH PL
008 941440 0015 5/5/10 $330,000 $303,000 1260 7 1954 Good 8900 N N 1945 SW 165TH ST
008 293480 0015 6/17/09 $325,000 $285,000 1270 7 1956 Avg 7704 N N 1620 SW 166TH ST
008 252303 9148 12/23/11 $310,000 $310,000 1300 7 1951 Avg 10643 N N 16753 MARINE VIEW DR SW
008 292760 0181 12/8/10 $230,000 $218,000 1300 7 1950 Avg 9750 N N 2811 SW 169TH ST
008 611750 0910 9/1/11 $412,500 $406,000 1300 7 1953 Good 11895 N N 18921 8TH AVE SW

Improved Sales Used in this Annual Update Analysis Area 49
(1 to 3 Unit Residences)
Area 49 20 2012
Sub Area Major Minor
Sale Date Sale Price
Adj Sale Price
Above Grade Living
Bld Grade
Year Built/Ren Cond
Lot Size View
Water- front Situs Address
008 292760 0281 2/24/11 $300,000 $288,000 1340 7 1949 Good 8600 N N 2822 SW 169TH ST
008 611650 0195 1/12/11 $415,000 $395,000 1350 7 1953 Avg 57934 Y N 17045 16TH AVE SW
008 433500 0020 3/23/11 $339,000 $326,000 1380 7 1955 Good 11900 N N 16912 26TH AVE SW
008 293480 0010 10/27/11 $369,000 $366,000 1390 7 1956 Good 7490 N N 1612 SW 166TH ST
008 061600 0175 3/22/10 $365,000 $333,000 1400 7 1956 Good 12800 N N 20821 2ND PL SW
008 611650 0120 5/18/10 $261,000 $240,000 1470 7 1951 Avg 9500 N N 16824 19TH AVE SW
008 611750 1440 4/4/11 $392,000 $378,000 1480 7 1939 VGood 23202 N N 18951 MARINE VIEW DR SW
008 611750 2380 6/29/10 $370,000 $343,000 1490 7 1958 Good 12324 N N 17820 MARINE VIEW DR SW
008 300180 0024 11/8/10 $480,000 $453,000 1500 7 1954 VGood 8100 N N 16424 21ST AVE SW
008 374160 0035 10/11/10 $353,000 $332,000 1580 7 1952 Avg 9335 N N 2621 SW 167TH PL
008 427640 0040 8/31/10 $335,000 $313,000 1590 7 1952 Good 11340 N N 16904 22ND AVE SW
008 293460 0010 12/8/11 $246,610 $246,000 1600 7 1955 Good 8176 N N 1647 SW 165TH ST
008 061600 0115 9/17/09 $379,000 $337,000 1610 7 1953 Good 13000 N N 20858 2ND PL SW
008 374160 0055 9/9/11 $285,000 $281,000 1630 7 1950 Avg 10054 N N 16717 MARINE VIEW DR SW
008 611650 0332 3/11/10 $341,000 $311,000 1630 7 1957 Good 19100 N N 1239 SW 168TH ST
008 776470 0020 11/30/11 $299,000 $298,000 1700 7 1949 Avg 22800 Y N 17220 SYLVESTER RD SW
008 512240 0070 9/24/09 $520,000 $463,000 1770 7 1955 Good 16537 Y N 2921 SW 164TH PL
008 440680 0060 3/22/10 $315,000 $288,000 1790 7 1958 Avg 8475 N N 233 SW 184TH ST
008 292760 0025 4/19/10 $369,000 $338,000 1810 7 1954 Good 11250 N N 16901 26TH AVE SW
008 611750 2370 9/15/10 $471,000 $441,000 1850 7 1953 VGood 11988 N N 1002 NORMANDY TER SW
008 300180 0021 11/2/11 $410,000 $407,000 1860 7 1953 Avg 18630 N N 16418 21ST AVE SW
008 611750 0255 5/26/11 $401,000 $389,000 1860 7 1955 Good 12000 Y N 18194 BRITTANY DR SW
008 611540 0081 1/13/09 $435,000 $372,000 1920 7 1953 VGood 13872 N N 107 SW 194TH PL
008 062204 9092 4/8/10 $370,000 $339,000 2030 7 1960 Good 15246 N N 20205 MARINE VIEW DR SW
008 312304 9080 12/12/11 $370,000 $369,000 2040 7 1960 Good 14810 Y N 235 SW 186TH ST

Improved Sales Used in this Annual Update Analysis Area 49
(1 to 3 Unit Residences)
Area 49 21 2012
Sub Area Major Minor
Sale Date Sale Price
Adj Sale Price
Above Grade Living
Bld Grade
Year Built/Ren Cond
Lot Size View
Water- front Situs Address
008 292860 0220 12/9/09 $531,000 $478,000 2110 7 1934 VGood 10672 N N 2656 SW 172ND ST
008 302304 9265 7/10/09 $454,950 $400,000 2220 7 1952 Good 14652 N N 1348 SW 175TH ST
008 611340 0046 7/14/11 $317,000 $310,000 2220 7 1968 Good 15770 N N 19422 NORMANDY PARK DR SW
008 776570 0030 7/13/11 $585,000 $572,000 2430 7 1952 VGood 51400 N N 824 SW 174TH ST
008 252303 9046 11/4/10 $360,000 $340,000 2550 7 1960 Avg 25700 N N 1619 SW 160TH ST
008 374160 0030 4/26/10 $395,000 $363,000 1140 8 1951 VGood 10231 N N 2633 SW 167TH PL
008 611750 0960 5/8/09 $565,000 $492,000 1200 8 2008 Avg 11504 N N 18968 MARINE VIEW DR SW
008 061800 0030 3/3/09 $585,000 $505,000 1260 8 1969 Good 21600 Y N 430 SW 206TH ST
008 763120 0185 9/14/11 $475,000 $468,000 1300 8 1989 Good 7800 Y N 3539 SW 170TH ST
008 252303 9131 8/24/09 $620,000 $549,000 1335 8 1947 Good 10853 Y N 2803 SW 167TH PL
008 507240 0461 5/24/10 $419,500 $387,000 1340 8 1961 Good 10200 N N 17476 7TH AVE SW
008 611750 1200 1/24/09 $471,500 $404,000 1340 8 1953 Good 21857 Y N 19644 MARINE VIEW DR SW
008 519410 0020 10/21/09 $700,000 $625,000 1350 8 1953 Good 21683 Y N 19679 MARINE VIEW DR SW
008 612090 0010 5/29/09 $471,000 $412,000 1350 8 1976 Avg 10454 Y N 18216 4TH AVE SW
008 768040 0180 7/12/10 $649,250 $603,000 1350 8 1956 Avg 28278 Y N 16617 25TH AVE SW
008 611750 1980 8/19/10 $406,000 $379,000 1380 8 1948 Good 11711 Y N 17962 BRITTANY DR SW
008 292860 0020 3/31/09 $650,000 $563,000 1400 8 1959 VGood 9000 Y N 3148 SW 171ST ST
008 279200 0060 11/7/11 $447,500 $444,000 1450 8 1966 Good 9761 Y N 425 SW 183RD ST
008 507240 0450 4/8/10 $405,500 $371,000 1460 8 1961 Good 12800 N N 648 SW 175TH ST
008 507190 0040 12/5/11 $392,000 $391,000 1490 8 1957 Good 8800 Y N 17711 3RD PL SW
008 302304 9357 8/4/11 $450,000 $441,000 1500 8 1971 VGood 20908 N N 525 SW 171ST PL
008 188850 0030 6/17/10 $385,000 $356,000 1510 8 1976 Good 15000 N N 106 SW 194TH ST
008 507220 0075 9/27/10 $465,000 $437,000 1510 8 1959 Good 10300 Y N 17833 3RD PL SW
008 611200 0025 10/27/11 $310,000 $307,000 1530 8 1959 Good 15498 N N 20036 3RD PL SW
008 767840 0025 8/17/10 $430,000 $401,000 1530 8 1947 Avg 9277 Y N 2822 SW 167TH PL

Improved Sales Used in this Annual Update Analysis Area 49
(1 to 3 Unit Residences)
Area 49 22 2012
Sub Area Major Minor
Sale Date Sale Price
Adj Sale Price
Above Grade Living
Bld Grade
Year Built/Ren Cond
Lot Size View
Water- front Situs Address
008 507230 0005 4/21/10 $450,000 $413,000 1550 8 1960 Good 10450 Y N 398 SW 176TH PL
008 188850 0070 4/27/11 $500,000 $483,000 1560 8 1969 VGood 15767 Y N 140 SW 194TH ST
008 612090 0080 10/12/10 $315,000 $296,000 1560 8 1974 Avg 9000 N N 18221 3RD PL SW
008 061900 0125 9/8/09 $400,000 $355,000 1590 8 1959 Good 20600 N N 20721 2ND AVE SW
008 507190 0050 4/14/10 $590,000 $541,000 1590 8 1959 Good 12750 Y N 210 SW 178TH ST
008 507210 0035 3/6/09 $575,000 $496,000 1590 8 1957 Good 9900 Y N 17805 6TH AVE SW
008 519410 0045 11/17/11 $559,000 $556,000 1600 8 1952 VGood 10093 Y N 19815 MARINE VIEW DR SW
008 611540 0008 4/16/09 $450,000 $391,000 1600 8 1956 Avg 20868 Y N 159 SW 192ND ST
008 507240 0380 7/21/09 $410,000 $361,000 1640 8 1966 Good 11000 Y N 449 SW 175TH ST
008 061900 0095 2/11/10 $387,000 $352,000 1650 8 1960 Good 15030 N N 20449 2ND AVE SW
008 302304 9248 8/27/09 $456,000 $404,000 1670 8 1950 Avg 22651 N N 255 SW 171ST ST
008 512240 0150 2/28/10 $725,000 $660,000 1700 8 1952 VGood 18266 Y N 2734 SW 167TH ST
008 302304 9343 3/10/10 $315,000 $287,000 1710 8 1963 Avg 20037 N N 103 SW 171ST ST
008 512240 0055 3/24/11 $737,500 $710,000 1710 8 1958 Avg 16394 Y N 16429 29TH PL SW
008 507210 0095 9/13/10 $345,000 $323,000 1720 8 1958 Good 12900 Y N 17817 5TH AVE SW
008 507220 0100 12/21/11 $375,000 $374,000 1740 8 1964 Good 9450 Y N 17804 3RD PL SW
008 310200 0060 5/24/09 $520,000 $454,000 1750 8 1979 Good 8400 N N 18129 6TH PL SW
008 512240 0105 5/5/11 $660,000 $639,000 1760 8 1960 VGood 14398 Y N 2651 SW 164TH PL
008 236560 0020 4/24/09 $485,000 $422,000 1820 8 1959 Good 16730 Y N 230 SW 191ST ST
008 611750 1010 1/27/09 $410,000 $352,000 1840 8 1953 Good 15089 N N 18967 MARINE VIEW DR SW
008 312304 9191 4/29/10 $375,000 $344,000 1850 8 1967 Good 14722 N N 141 SW 186TH ST
008 302304 9322 6/16/09 $465,000 $408,000 1860 8 1965 Good 25115 N N 238 SW 176TH ST
008 028265 0260 8/9/10 $433,500 $404,000 1900 8 1966 Good 14926 N N 19620 1ST PL SW
008 611230 0150 8/25/11 $494,500 $486,000 1950 8 1969 Avg 15002 N N 408 SW 197TH ST
008 768040 0010 3/5/10 $345,000 $314,000 1950 8 1949 Good 16200 N N 16405 MARINE VIEW DR SW

Improved Sales Used in this Annual Update Analysis Area 49
(1 to 3 Unit Residences)
Area 49 23 2012
Sub Area Major Minor
Sale Date Sale Price
Adj Sale Price
Above Grade Living
Bld Grade
Year Built/Ren Cond
Lot Size View
Water- front Situs Address
008 292860 0325 10/16/09 $685,000 $612,000 1960 8 1961 Avg 33502 Y N 3107 SW 171ST ST
008 507240 0280 11/17/11 $459,000 $456,000 1980 8 1959 Good 9900 Y N 602 SW 175TH PL
008 262303 9032 3/23/11 $1,400,000 $1,347,000 2010 8 1963 Avg 24065 Y Y 3760 SW 171ST ST
008 611750 0800 1/16/09 $475,000 $407,000 2010 8 1957 VGood 10260 N N 18654 MARINE VIEW DR SW
008 061600 0200 7/11/11 $390,000 $381,000 2040 8 1959 Good 13860 N N 20818 MARINE VIEW DR SW
008 611860 0045 12/2/11 $385,000 $383,000 2060 8 1957 Good 13400 Y N 511 SW 182ND ST
008 302304 9087 8/29/11 $455,000 $447,000 2080 8 1957 Good 19166 N N 16846 2ND AVE SW
008 770155 0020 11/9/10 $475,000 $449,000 2100 8 1982 Avg 15195 N N 617 SW 189TH ST
008 507241 0020 8/23/10 $425,000 $397,000 2120 8 1978 Avg 10330 N N 17823 7TH PL SW
008 611750 1560 7/30/09 $550,000 $485,000 2180 8 1966 Good 25690 N N 19230 EDGECLIFF DR SW
008 611750 2435 3/3/11 $528,000 $507,000 2180 8 1952 Good 19376 N N 253 SW 191ST ST
008 611340 0060 4/22/10 $560,000 $514,000 2210 8 1992 Avg 15048 Y N 19452 NORMANDY PARK DR SW
008 507190 0075 4/1/10 $500,000 $457,000 2220 8 1956 Good 15600 Y N 17820 3RD AVE SW
008 507230 0220 7/14/11 $427,285 $418,000 2240 8 1958 Good 11000 Y N 325 SW 177TH ST
008 300180 0135 2/12/10 $385,000 $350,000 2340 8 2000 Avg 7223 N N 1642 SW 166TH ST
008 611750 0325 11/1/10 $730,000 $689,000 2360 8 1931 Good 12600 Y N 18135 BRITTANY DR SW
008 611480 0045 9/14/11 $479,000 $472,000 2710 8 1962 Good 41600 N N 17159 6TH PL SW
008 611440 0141 10/12/10 $528,350 $497,000 2860 8 1953 Good 41250 N N 17124 4TH AVE SW
008 300180 0153 12/3/09 $463,000 $416,000 2880 8 1989 Avg 8712 N N 16417 16TH AVE SW
008 252303 9044 1/5/10 $560,000 $506,000 2890 8 1999 Avg 12104 N N 2025 SW 163RD CT
008 611750 1790 11/5/09 $715,000 $640,000 2900 8 2009 Avg 12611 N N 835 NORMANDY TER SW
008 302304 9354 7/1/09 $550,000 $483,000 3220 8 1973 Good 28314 N N 17200 2ND AVE SW
008 062204 9098 6/25/09 $525,000 $461,000 3330 8 1968 Good 15300 N N 20206 MARINE VIEW DR SW
008 061800 0170 11/9/10 $745,000 $704,000 3518 8 2008 Avg 17200 N N 20605 MARINE VIEW DR
008 302304 9076 7/27/09 $507,000 $447,000 1110 9 1981 Avg 24460 N N 1213 SW 174TH ST

Improved Sales Used in this Annual Update Analysis Area 49
(1 to 3 Unit Residences)
Area 49 24 2012
Sub Area Major Minor
Sale Date Sale Price
Adj Sale Price
Above Grade Living
Bld Grade
Year Built/Ren Cond
Lot Size View
Water- front Situs Address
008 767840 0060 4/15/11 $575,000 $555,000 1370 9 1956 Good 12892 Y N 2648 SW 167TH PL
008 292960 0127 10/6/09 $450,000 $401,000 1410 9 1971 Avg 18235 Y N 17226 HILLCREST TER SW
008 664180 0040 7/21/10 $499,000 $464,000 1500 9 1969 Good 17560 Y N 21553 1ST CT S
008 611750 1262 4/20/11 $499,998 $483,000 1570 9 1987 Avg 22902 N N 19420 MARINE VIEW DR SW
008 611750 1655 9/24/10 $750,000 $704,000 1740 9 1958 Good 31554 Y Y 19253 EDGECLIFF DR SW
008 611440 0035 4/1/11 $524,000 $505,000 1780 9 1955 Good 34950 N N 17438 6TH AVE SW
008 763120 0040 9/24/09 $615,000 $547,000 1890 9 1981 Avg 12080 Y N 16751 MAPLEWILD AVE SW
008 611750 2795 8/21/09 $700,000 $620,000 2130 9 1977 Avg 20065 Y N 18507 NORMANDY TER SW
008 000120 0013 12/8/11 $657,000 $655,000 2312 9 2005 Avg 20156 N N 1148 SW SHOREBROOK DR
008 786570 0030 8/5/10 $500,000 $466,000 2330 9 1986 Avg 10085 N N 420 SW 185TH PL
008 611340 0050 2/12/09 $700,000 $602,000 2420 9 1989 VGood 22361 N N 19436 NORMANDY PARK DR SW
008 292760 0692 12/23/11 $700,000 $699,000 2430 9 1996 Avg 9740 Y N 16750 MAPLEWILD AVE SW
008 611750 1420 3/13/09 $550,000 $475,000 2470 9 1983 Avg 14091 N N 835 CHANNON DR
008 324000 0090 3/23/11 $462,500 $445,000 2600 9 1988 Avg 9700 N N 455 SW 191ST ST
008 611650 0420 10/26/09 $649,500 $581,000 2610 9 1957 Good 30900 Y N 1400 SW 171ST PL
008 611970 0040 2/9/10 $508,500 $462,000 2640 9 1986 Avg 12500 Y N 18647 5TH AVE SW
008 302304 9247 9/19/10 $635,000 $595,000 2680 9 1951 Good 17034 N N 1335 SW 174TH ST
008 611750 1845 10/18/11 $450,000 $446,000 2680 9 1989 Good 9454 Y N 1042 SHOREMONT AVE
008 292960 0045 6/15/11 $570,000 $555,000 2760 9 2008 Avg 9880 Y N 17435 SYLVESTER RD SW
008 611750 2555 9/16/10 $542,500 $508,000 2780 9 1965 Good 13773 N N 19010 2ND PL SW
008 182720 0250 4/28/10 $605,000 $556,000 2800 9 1988 Avg 14314 Y N 17515 16TH AVE SW
008 028250 0080 7/14/09 $725,000 $638,000 2825 9 1987 Good 17576 N N 19432 4TH AVE SW
008 612020 0040 12/12/11 $620,000 $618,000 2970 9 2003 Avg 20551 N N 855 SW NORMANDY TER
008 312304 9328 4/7/09 $680,000 $590,000 3270 9 2008 Avg 7980 N N 127 SW 186TH ST
008 252303 9346 4/30/10 $750,000 $689,000 3276 9 2008 Avg 10801 N N 16045 21ST AVE SW
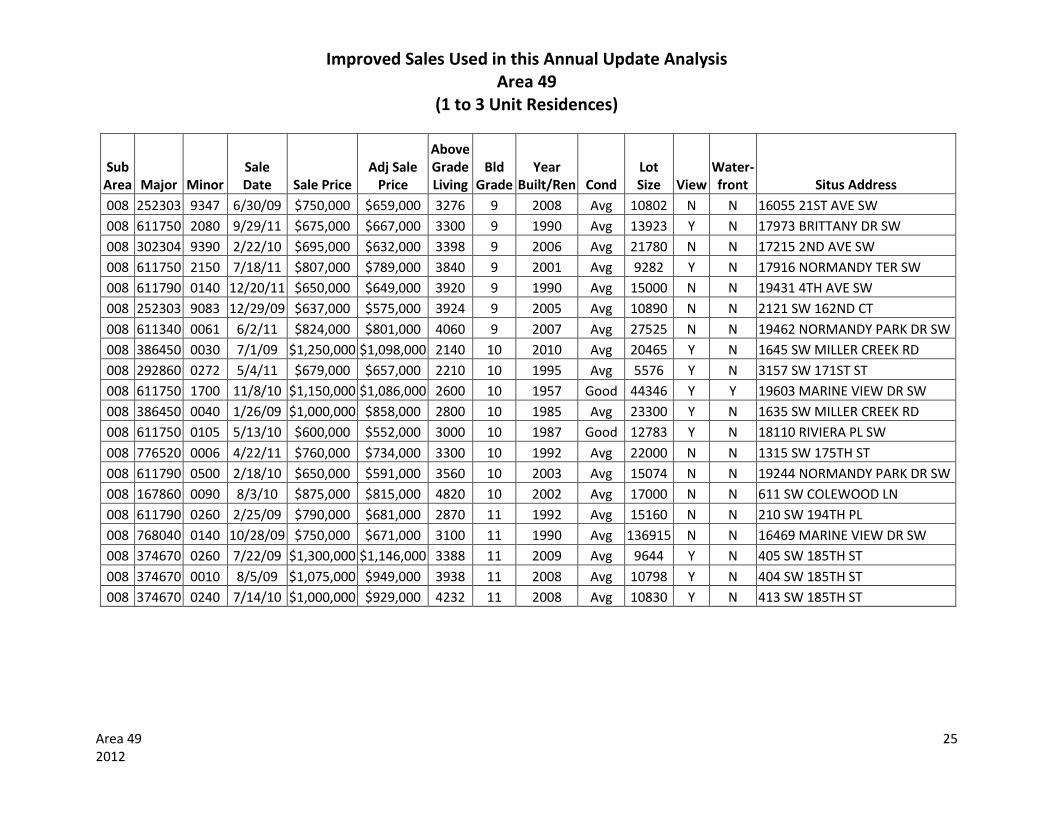
Improved Sales Used in this Annual Update Analysis Area 49
(1 to 3 Unit Residences)
Area 49 25 2012
Sub Area Major Minor
Sale Date Sale Price
Adj Sale Price
Above Grade Living
Bld Grade
Year Built/Ren Cond
Lot Size View
Water- front Situs Address
008 252303 9347 6/30/09 $750,000 $659,000 3276 9 2008 Avg 10802 N N 16055 21ST AVE SW
008 611750 2080 9/29/11 $675,000 $667,000 3300 9 1990 Avg 13923 Y N 17973 BRITTANY DR SW
008 302304 9390 2/22/10 $695,000 $632,000 3398 9 2006 Avg 21780 N N 17215 2ND AVE SW
008 611750 2150 7/18/11 $807,000 $789,000 3840 9 2001 Avg 9282 Y N 17916 NORMANDY TER SW
008 611790 0140 12/20/11 $650,000 $649,000 3920 9 1990 Avg 15000 N N 19431 4TH AVE SW
008 252303 9083 12/29/09 $637,000 $575,000 3924 9 2005 Avg 10890 N N 2121 SW 162ND CT
008 611340 0061 6/2/11 $824,000 $801,000 4060 9 2007 Avg 27525 N N 19462 NORMANDY PARK DR SW
008 386450 0030 7/1/09 $1,250,000 $1,098,000 2140 10 2010 Avg 20465 Y N 1645 SW MILLER CREEK RD
008 292860 0272 5/4/11 $679,000 $657,000 2210 10 1995 Avg 5576 Y N 3157 SW 171ST ST
008 611750 1700 11/8/10 $1,150,000 $1,086,000 2600 10 1957 Good 44346 Y Y 19603 MARINE VIEW DR SW
008 386450 0040 1/26/09 $1,000,000 $858,000 2800 10 1985 Avg 23300 Y N 1635 SW MILLER CREEK RD
008 611750 0105 5/13/10 $600,000 $552,000 3000 10 1987 Good 12783 Y N 18110 RIVIERA PL SW
008 776520 0006 4/22/11 $760,000 $734,000 3300 10 1992 Avg 22000 N N 1315 SW 175TH ST
008 611790 0500 2/18/10 $650,000 $591,000 3560 10 2003 Avg 15074 N N 19244 NORMANDY PARK DR SW
008 167860 0090 8/3/10 $875,000 $815,000 4820 10 2002 Avg 17000 N N 611 SW COLEWOOD LN
008 611790 0260 2/25/09 $790,000 $681,000 2870 11 1992 Avg 15160 N N 210 SW 194TH PL
008 768040 0140 10/28/09 $750,000 $671,000 3100 11 1990 Avg 136915 N N 16469 MARINE VIEW DR SW
008 374670 0260 7/22/09 $1,300,000 $1,146,000 3388 11 2009 Avg 9644 Y N 405 SW 185TH ST
008 374670 0010 8/5/09 $1,075,000 $949,000 3938 11 2008 Avg 10798 Y N 404 SW 185TH ST
008 374670 0240 7/14/10 $1,000,000 $929,000 4232 11 2008 Avg 10830 Y N 413 SW 185TH ST

Improved Sales Removed in this Annual Update Analysis Area 49
(1 to 3 Unit Residences)
Area 49 26 2012
Sub Area Major Minor
Sale Date Sale Price Comments
003 122303 9078 6/10/10 $10,000 DOR RATIO;OBSOL;EASEMENT OR RIGHT-OF-WAY
003 122303 9127 3/6/09 $542,000 ESTATE ADMINISTRATOR, GUARDIAN, OR EXECUTOR;
003 179500 0020 4/29/11 $425,500 RELOCATION - SALE TO SERVICE
003 182304 9176 2/22/11 $133,000 DOR RATIO;GOVERNMENT AGENCY;
003 233880 0050 4/9/09 $509,000 BANKRUPTCY - RECEIVER OR TRUSTEE
003 242303 9144 10/5/11 $575,000 IMP COUNT
003 250900 0150 10/28/09 $390,000 NON-REPRESENTATIVE SALE
003 273160 0085 2/4/11 $225,000 RELATED PARTY, FRIEND, OR NEIGHBOR
003 296680 0100 9/24/10 $393,000 IMP COUNT
003 354160 0175 1/16/09 $365,000 IMP. CHARACTERISTICS CHANGED SINCE SALE;
003 354160 0240 8/27/09 $280,000 Diagnostic Outlier-SAS
003 360660 0020 9/30/11 $320,000 Diagnostic Outlier-SAS
003 360660 0055 4/7/11 $317,000 ESTATE ADMINISTRATOR, GUARDIAN, OR EXECUTOR
003 433140 0135 3/11/10 $249,000 Diagnostic Outlier-SAS
003 433140 0375 4/26/10 $205,000 ESTATE ADMINISTRATOR, GUARDIAN, OR EXECUTOR
003 433220 0036 1/26/11 $350,000 Diagnostic Outlier-SAS
003 433220 0075 7/22/10 $283,000 ESTATE ADMINISTRATOR, GUARDIAN, OR EXECUTOR
003 447580 0070 2/14/11 $100,000 DOR RATIO;GOVERNMENT AGENCY;
003 610240 0160 5/27/11 $350,000 Diagnostic Outlier-SAS
003 610240 0175 9/23/09 $202,416 PARTIAL INTEREST (1/3, 1/2, Etc.)
003 632600 0110 7/18/11 $285,000 ESTATE ADMINISTRATOR, GUARDIAN, OR EXECUTOR
003 763240 0035 6/5/09 $910,000 MULTI-PARCEL SALE; SHORT SALE
003 763580 1112 3/11/10 $187,500 ESTATE ADMINISTRATOR, GUARDIAN, OR EXECUTOR
003 763580 1112 3/11/10 $187,500 DOR RATIO;PARTIAL INTEREST (1/3, 1/2, Etc.)
003 763580 1349 6/3/10 $800,000 FINANCIAL INSTITUTION RESALE
003 763580 1360 10/28/11 $400,000 ESTATE ADMINISTRATOR, GUARDIAN, OR EXECUTOR
003 763580 1540 5/18/10 $210,000 Diagnostic Outlier-SAS
003 763680 0100 6/13/11 $487,618 QUIT CLAIM DEED
003 773660 0070 11/10/09 $400,000 FORCED SALE
003 777420 0045 1/21/10 $520,000 FINANCIAL INSTITUTION RESALE
003 777420 0130 5/24/11 $274,950 DOR RATIO;%COMPL;FINANCIAL INSTITUTION RESALE
003 777420 0186 3/29/10 $345,000 FINANCIAL INSTITUTION RESALE
003 777420 0187 1/21/11 $352,500 FINANCIAL INSTITUTION RESALE
003 777420 0240 12/15/09 $270,500 FINANCIAL INSTITUTION RESALE
003 777920 0320 7/29/11 $400,000 RELATED PARTY, FRIEND, OR NEIGHBOR
003 778160 0035 6/3/11 $1,850,000 Diagnostic Outlier-SAS
003 778160 0050 8/15/11 $715,000 ESTATE ADMINISTRATOR, GUARDIAN, OR EXECUTOR
003 778160 0100 9/24/10 $1,525,000 Diagnostic Outlier-SAS
003 778440 0065 7/24/09 $447,500 Lack of Representation-Fair Condition
003 783580 0040 12/4/09 $260,000 IMP. CHARACTERISTICS CHANGED SINCE SALE;
003 783580 0042 1/10/11 $345,000 Diagnostic Outlier-SAS
003 783580 0080 3/28/11 $240,000 Diagnostic Outlier-SAS
003 783580 0135 1/27/10 $241,000 BANKRUPTCY - RECEIVER OR TRUSTEE;
003 783580 0135 11/6/09 $271,123 GOVERNMENT AGENCY; EXEMPT FROM EXCISE TAX;
003 783580 0191 8/4/10 $60,000 DOR RATIO;QUIT CLAIM DEED; STATEMENT TO DOR

Improved Sales Removed in this Annual Update Analysis Area 49
(1 to 3 Unit Residences)
Area 49 27 2012
Sub Area Major Minor
Sale Date Sale Price Comments
003 810300 0106 12/7/11 $235,000 ESTATE ADMINISTRATOR, GUARDIAN, OR EXECUTOR
003 810360 0056 9/26/11 $330,000 ESTATE ADMINISTRATOR, GUARDIAN, OR EXECUTOR
003 810360 0165 5/3/11 $219,950 Diagnostic Outlier-SAS
003 885900 0035 9/6/11 $398,000 RELOCATION - SALE TO SERVICE
007 024300 0100 6/9/11 $166,500 ESTATE ADMINISTRATOR, GUARDIAN, OR EXECUTOR
007 093600 0025 5/27/11 $417,000 FINANCIAL INSTITUTION RESALE
007 121700 0340 7/23/09 $165,250 QUIT CLAIM DEED
007 296880 0005 6/30/09 $120,000 NON-REPRESENTATIVE SALE
007 296880 0025 9/26/11 $220,000 FINANCIAL INSTITUTION RESALE
007 296880 0106 6/27/11 $165,000 FINANCIAL INSTITUTION RESALE
007 296880 0175 1/13/11 $179,000 ESTATE ADMINISTRATOR, GUARDIAN, OR EXECUTOR
007 296880 0206 4/5/11 $239,500 Diagnostic Outlier-SAS
007 296880 0220 11/30/11 $225,000 ESTATE ADMINISTRATOR, GUARDIAN, OR EXECUTOR
007 296880 0484 1/28/11 $112,749 DOR RATIO;QUIT CLAIM DEED;
007 296880 0595 11/14/11 $86,500 PREVIMP<=25K
007 296880 0720 1/19/11 $180,000 ESTATE ADMINISTRATOR, GUARDIAN, OR EXECUTOR
007 296880 0725 3/23/11 $275,000 ESTATE ADMINISTRATOR, GUARDIAN, OR EXECUTOR
007 296880 1005 8/5/09 $155,000 IMP. CHARACTERISTICS CHANGED SINCE SALE
007 296880 1025 7/21/11 $207,000 ESTATE ADMINISTRATOR, GUARDIAN, OR EXECUTOR
007 296880 1055 10/18/10 $206,500 FINANCIAL INSTITUTION RESALE
007 296880 1175 12/21/11 $169,200 DOR RATIO;EXEMPT FROM EXCISE TAX;
007 296880 1210 9/10/09 $130,000 %NETCOND;PREVIMP<=25K;
007 296880 1265 10/27/11 $209,000 Diagnostic Outlier-SAS
007 296880 1350 10/21/09 $240,000 GOVERNMENT AGENCY; EXEMPT FROM EXCISE TAX;
007 296880 1450 10/7/10 $225,000 FINANCIAL INSTITUTION RESALE
007 296880 1485 11/16/09 $320,000 NO MARKET EXPOSURE;
007 296880 1600 9/20/11 $142,000 FINANCIAL INSTITUTION RESALE
007 302304 9241 7/29/09 $252,000 RELATED PARTY, FRIEND, OR NEIGHBOR
007 302304 9285 1/31/11 $375,000 Diagnostic Outlier
007 419740 0011 11/30/11 $88,900 %NETCOND;PREVIMP<=25K
007 419740 0013 8/18/11 $257,000 ESTATE ADMINISTRATOR, GUARDIAN, OR EXECUTOR
007 419740 0098 8/6/10 $210,000 Diagnostic Outlier-SAS
007 419740 0147 10/21/10 $383,500 FINANCIAL INSTITUTION RESALE
008 028250 0050 4/8/11 $660,000 FINANCIAL INSTITUTION RESALE
008 028265 0090 3/3/10 $432,000 STATEMENT TO DOR; FINANCIAL INSTITUTION RESALE
008 028265 0160 7/1/09 $320,000 ESTATE ADMINISTRATOR, GUARDIAN, OR EXECUTOR
008 028265 0170 1/19/11 $310,000 Diagnostic Outlier-SAS
008 061600 0150 3/9/10 $99,975 DOR RATIO;QUIT CLAIM DEED; STATEMENT TO DOR
008 061800 0060 12/21/11 $462,500 ESTATE ADMINISTRATOR, GUARDIAN, OR EXECUTOR
008 062204 9104 4/29/11 $302,400 RELATED PARTY, FRIEND, OR NEIGHBOR;
008 182720 0095 6/26/09 $500,000 NO MARKET EXPOSURE;
008 182720 0275 6/10/10 $1,500,000 Diagnostic Outlier-SAS
008 200900 0820 6/10/09 $100,000 DOR RATIO;NO MARKET EXPOSURE
008 200900 0830 12/13/11 $290,126 FINANCIAL INSTITUTION RESALE
008 252303 9037 10/19/09 $1,975,000 Lack of Representation-Grade12

Improved Sales Removed in this Annual Update Analysis Area 49
(1 to 3 Unit Residences)
Area 49 28 2012
Sub Area Major Minor
Sale Date Sale Price Comments
008 252303 9077 9/20/11 $645,000 Diagnostic Outlier-SAS
008 252303 9158 7/13/09 $370,000 OBSOL
008 252303 9268 5/26/09 $268,500 IMP. CHARACTERISTICS CHANGED SINCE SALE
008 252303 9279 11/15/11 $235,000 Diagnostic Outlier-SAS
008 252303 9287 5/12/11 $230,000 Diagnostic Outlier-SAS
008 252303 9342 12/30/11 $700,000 DOR RATIO
008 262303 9055 5/12/11 $285,000 ESTATE ADMINISTRATOR, GUARDIAN, OR EXECUTOR
008 279180 0060 2/11/11 $222,000 FINANCIAL INSTITUTION RESALE
008 292760 0150 6/30/11 $350,000 Diagnostic Outlier
008 293160 0010 11/19/10 $114,290 DOR RATIO;QUIT CLAIM DEED
008 302304 9128 11/18/09 $594,000 SHORT SALE
008 302304 9247 8/16/10 $246,402 DOR RATIO
008 302304 9300 3/1/11 $290,000 Diagnostic Outlier
008 302304 9320 9/28/09 $300,000 BANKRUPTCY - RECEIVER OR TRUSTEE;
008 312304 9070 10/22/10 $373,900 Lack of Representation-Grade5
008 312304 9098 10/13/10 $160,325 DOR RATIO;QUIT CLAIM DEED
008 312304 9171 9/14/11 $345,000 EXEMPT FROM EXCISE TAX
008 312304 9175 11/11/10 $287,000 STATEMENT TO DOR; FINANCIAL INSTITUTION RESALE
008 362303 9006 11/3/10 $625,000 PREVIMP<=25K
008 374670 0030 3/31/10 $1,075,000 FINANCIAL INSTITUTION RESALE
008 374670 0040 9/13/10 $965,000 FINANCIAL INSTITUTION RESALE
008 374670 0050 10/12/10 $932,000 FINANCIAL INSTITUTION RESALE
008 374670 0060 7/20/10 $237,000 DOR RATIO;%COMPL
008 395670 0030 12/15/10 $1,140,000 Diagnostic Outlier-SAS
008 427400 0010 12/1/09 $260,000 IMP. CHARACTERISTICS CHANGED SINCE SALE
008 432820 0005 8/22/11 $460,000 ESTATE ADMINISTRATOR, GUARDIAN, OR EXECUTOR
008 433460 0055 4/9/10 $342,000 ESTATE ADMINISTRATOR, GUARDIAN, OR EXECUTOR
008 433460 0075 7/17/09 $320,000 OBSOL;IMP. CHARACTERISTICS CHANGED SINCE SALE
008 433500 0120 11/17/11 $315,000 ESTATE ADMINISTRATOR, GUARDIAN, OR EXECUTOR
008 443840 0015 3/16/10 $136,500 FINANCIAL INSTITUTION RESALE
008 507190 0090 11/24/09 $217,000 NO MARKET EXPOSURE;
008 507210 0025 12/9/11 $335,000 ESTATE ADMINISTRATOR, GUARDIAN, OR EXECUTOR
008 507210 0035 7/14/09 $485,000 NO MARKET EXPOSURE
008 507220 0025 7/22/11 $370,000 Diagnostic Outlier-SAS
008 507241 0010 11/10/11 $493,913 GOVERNMENT AGENCY; EXEMPT FROM EXCISE TAX;
008 509780 0090 12/7/11 $5,217 DOR RATIO
008 512240 0195 7/1/09 $696,395 IMP. CHARACTERISTICS CHANGED SINCE SALE
008 611140 0015 7/15/11 $220,000 Diagnostic Outlier-SAS
008 611140 0020 5/8/09 $408,000 RELATED PARTY, FRIEND, OR NEIGHBOR
008 611140 0055 5/14/09 $280,000 IMP. CHARACTERISTICS CHANGED SINCE SALE
008 611200 0005 9/23/11 $260,000 Diagnostic Outlier-SAS
008 611200 0060 2/25/10 $270,000 Diagnostic Outlier-SAS
008 611440 0051 12/8/11 $790,000 Diagnostic Outlier-SAS
008 611440 0070 4/5/10 $450,000 OBSOL
008 611440 0091 12/20/11 $385,000 ESTATE ADMINISTRATOR, GUARDIAN, OR EXECUTOR

Improved Sales Removed in this Annual Update Analysis Area 49
(1 to 3 Unit Residences)
Area 49 29 2012
Sub Area Major Minor
Sale Date Sale Price Comments
008 611440 0131 6/3/10 $795,000 BANKRUPTCY - RECEIVER OR TRUSTEE
008 611460 0040 12/29/09 $355,300 RELATED PARTY, FRIEND, OR NEIGHBOR;
008 611540 0240 12/22/10 $375,000 FINANCIAL INSTITUTION RESALE
008 611540 0327 8/2/11 $77,900 DOR RATIO;FINANCIAL INSTITUTION RESALE
008 611650 0016 8/3/11 $110,000 DOR RATIO
008 611650 0458 11/19/10 $271,900 DOR RATIO;FINANCIAL INSTITUTION RESALE
008 611650 0490 11/12/10 $350,000 ESTATE ADMINISTRATOR, GUARDIAN, OR EXECUTOR
008 611750 0565 3/10/09 $483,333 ESTATE ADMINISTRATOR, GUARDIAN, OR EXECUTOR;
008 611750 0590 6/8/09 $200,000 EXEMPT FROM EXCISE TAX;
008 611750 0770 12/19/11 $335,000 ESTATE ADMINISTRATOR, GUARDIAN, OR EXECUTOR
008 611750 0785 4/9/10 $673,953 EXEMPT FROM EXCISE TAX
008 611750 0785 7/6/10 $410,000 FINANCIAL INSTITUTION RESALE
008 611750 0790 6/19/09 $451,000 OBSOL;SHORT SALE
008 611750 0885 7/12/10 $640,000 ACTIVE PERMIT BEFORE SALE>25K
008 611750 2241 5/19/09 $1,650,000 IMP. CHARACTERISTICS CHANGED SINCE SALE
008 611750 2356 11/23/09 $517,000 NO MARKET EXPOSURE;
008 611750 2555 8/19/09 $542,500 NO MARKET EXPOSURE;
008 611750 2786 8/31/09 $1,500,000 RELATED PARTY, FRIEND, OR NEIGHBOR
008 611750 2795 8/17/09 $700,000 RELOCATION - SALE TO SERVICE;
008 612020 0015 3/10/11 $373,725 ESTATE ADMINISTRATOR, GUARDIAN, OR EXECUTOR;
008 612020 0027 7/16/09 $360,000 SHORT SALE
008 763120 0075 7/19/10 $691,100 Diagnostic Outlier-SAS
008 767840 0020 5/13/10 $600,000 ESTATE ADMINISTRATOR, GUARDIAN, OR EXECUTOR
008 768040 0080 5/12/10 $467,800 ESTATE ADMINISTRATOR, GUARDIAN, OR EXECUTOR
008 768040 0140 12/17/09 $50,400 DOR RATIO;SEGREGATION AND/OR MERGER;
008 768040 0160 6/10/11 $799,950 QUIT CLAIM DEED
008 768040 0171 4/26/10 $645,000 ESTATE ADMINISTRATOR, GUARDIAN, OR EXECUTOR
008 768040 0200 11/10/11 $160,000 DOR RATIO
008 786570 0030 2/22/10 $225,000 DOR RATIO
008 788870 0050 5/14/10 $471,500 OBSOL
008 809600 0140 8/8/11 $635,000 ESTATE ADMINISTRATOR, GUARDIAN, OR EXECUTOR
008 885775 0060 12/8/10 $261,250 ESTATE ADMINISTRATOR, GUARDIAN, OR EXECUTOR
008 929080 0015 8/9/11 $490,000 Diagnostic Outlier-SAS
008 929080 0070 8/31/11 $319,995 Diagnostic Outlier-SAS

Vacant Sales Used in this Annual Update Analysis Area 49
(1 to 3 Unit Residences)
Area 49 30 2012
Sub Area Major Minor
Sale Date
Sale Price
Lot Size View
Water- front
7 296880 1590 7/15/11 $80,000 6,780 N N
8 62204 9145 10/14/09 $209,500 15,200 N N
8 374670 0020 4/6/10 $325,000 10,822 Y N
8 374670 0220 3/25/11 $200,000 9,959 Y N

Vacant Sales Removed in this Annual Update Analysis Area 49
(1 to 3 Unit Residences)
Area 49 31 2012
Sub Area Major Minor Sale Date
Sale Price Comments
003 783580 0001 4/1/2010 $25,000 FINANCIAL INSTITUTION RESALE;
007 024300 0590 5/26/2009 $5,000 NO MARKET EXPOSURE;
008 061700 0105 1/27/2011 $60,000 NO MARKET EXPOSURE;
008 061700 0110 12/9/2010 $70,000 NO MARKET EXPOSURE;
008 061700 0120 5/28/2009 $50,000 NO MARKET EXPOSURE;
008 061700 0125 1/11/2011 $50,000 NO MARKET EXPOSURE;
008 061700 0140 5/15/2009 $50,000 NO MARKET EXPOSURE;
008 061700 0150 6/4/2009 $50,000 NO MARKET EXPOSURE;
008 061700 0160 12/20/2010 $50,000 NO MARKET EXPOSURE;
008 061700 0170 3/22/2010 $70,000 ESTATE ADMINISTRATOR, GUARDIAN, OR EXECUTOR;
008 061700 0190 12/21/2010 $50,000 NO MARKET EXPOSURE;
008 061700 0230 9/23/2009 $70,000 EASEMENT OR RIGHT-OF-WAY;
008 061700 0240 8/3/2009 $50,000 NO MARKET EXPOSURE;
008 062204 9026 6/2/2009 $42,500 NO MARKET EXPOSURE;
008 374670 0230 9/22/2011 $150,000 NO MARKET EXPOSURE;