north concho river improvement/bank stabilization project
TRANSCRIPT

North Concho River Improvement/Bank Stabilization Project
FINAL REPORT Upper Colorado River Authority
San Angelo, Texas 76903
Funding Source:
Nonpoint Source Program CWA §319(h) Prepared in cooperation with the Texas Commission on Environmental Quality
and the U.S. Environmental Protection Agency
Contract 582.12.10082

Table of Contents Executive Summary ......................................................................................................................... 1
Introduction .................................................................................................................................... 2
Project Significance and Background .............................................................................................. 2
Methods .......................................................................................................................................... 4
Construction Methods ................................................................................................................ 4
Sediment Load Reduction Volumetric Calculation Methods ...................................................... 4
Bacteria Load Reduction Estimation Methods ............................................................................ 4
NO3-N and P Load Reduction Estimation Methods..................................................................... 5
Potential Ancillary Improvements in DO ..................................................................................... 5
Results and Observations ............................................................................................................... 6
Sediment Load Reduction Calculation Details ............................................................................ 6
Bacteria Load Calculation Details ................................................................................................ 7
NO3-N and P Load Reduction Calculation Details ....................................................................... 7
Annual Pollutant Load Reductions .............................................................................................. 8
Comparative Analysis of DO ........................................................................................................ 8
Discussion........................................................................................................................................ 8
Bank Stabilization Construction Discussion ................................................................................ 8
Bacteria Load Reduction Discussion ........................................................................................... 9
NO3-N and P Load Reduction Discussion .................................................................................... 9
Comparative Analysis of DO Discussion ...................................................................................... 9
Education Outreach Activities Discussion ................................................................................. 10
Summary ....................................................................................................................................... 11
References .................................................................................................................................... 13
List of Tables Table 1 Load Reductions ................................................................................................................. 8 Table 2 North Concho River Improvement Project Dissolved Oxygen ........................................... 8 List of Appendices Appendix A Bank Erosion Hazardous Index Assessment Materials Appendix B Pre- and Post-construction Photos Appendix C Newspaper Articles

Upper Colorado River Authority Page 1
Executive Summary The North Concho River Improvement/Bank Stabilization Project was funded through a CWA 319(h) program grant managed by the Texas Commission on Environmental Quality (TCEQ) the in the amount of $372,512. Matching non-federal funds of $249,008 was provided by the City of San Angelo (COSA). This section of the river is was included on the 303(d) list of impaired watersheds in 2008 for bacteria and depressed dissolved oxygen levels. The project was designed as a control strategy to address these water quality impairments. Almost 6 million pounds of highly erodible material was removed along a 2000’ stretch of the North Concho River’s bank adjacent to Santa Fe Park near downtown San Angelo, Texas. This entire stretch of river bank was stabilized with boulder rip rap and slab stone. These activities not only provided an impressive aesthetic improvement to the river in the project area, but will also contribute important water quality benefits. Prior to stabilization the river bank exhibited numerous areas where rapid erosional processes of surface soil was evident. Also, large areas of the bank had been undercut by wave action and were in imminent danger of collapse and sloughing directly into the river. By proactively removing the highly erodible material before it washed or collapsed into the river, the direct deposition of sediment and sludge into the streambed of the river was prevented. Because streambed sediment and sludge provides a reservoir for not only bacteria, but also other oxygen depriving organics, the prevention of this deposition cannot help but provide significant future water quality improvements to this segment of the North Concho River. It is recognized in the literature that E. coli persists in soils especially in warmer climates in areas with moist soils such as along river banks. These are background populations of E. coli not related to animal fecal events. It is estimated that 1.031624 billion colony forming units (cfu)s of E. coli were removed during the excavation and slope grading activities of this project. In addition to the sediment and bacteria load reductions, it is conservatively estimated that load reductions of 175.02 lbs of nitrate nitrogen (NO3-N) and 287.91 lbs of phosphorus (P) were achieved. A simple comparison was made between pre- and post-construction water quality data collected at the North Concho River Continuous Ambient Monitoring Station (CAMS) and reported through the Continuous Water Quality Monitoring Network (CWQMN). The results of the comparison show that the mean minimum DO measured in all months is significantly higher in the post-construction period relative to the pre-construction period. Moreover, the severity of diurnal swings in DO is significantly attenuated in the post-construction data relative to the pre-construction data. Through the efforts of Dr. Christy Youker, UCRA’s Education and Outreach Director, the project was publicized in the media and throughout San Angelo’s middle and elementary schools. Numerous tours with local public officials and other groups were conducted. Attributes of the

Upper Colorado River Authority Page 2
project were presented in classrooms, on various websites, at various events, and through the local media.
Introduction Prior to funding of this project, the UCRA used the Bank Erosion Hazard Index (BEHI) developed by Dr. David L. Rosgen as part of the Watershed Assessment of River Stability and Sediment Supply (WARSSS) technical procedure for assessing the stability and erosion potential of stream banks. The WARSSS procedure is included in the EPA’s technical toolbox website. UCRA personnel evaluated bank characteristics at seven stations using the BEHI method (worksheets and photographs are attached in Appendix A). Representative soil samples were collected at three of the stations, composited and classified according to grain size percentages, and utilized in the characterization process (soil classification attached in Appendix A). The outcome of the BEHI evaluation process resulted in six of the stations being characterized with high bank erosion potentials and one being characterized with very high bank erosion potential. Based on this analysis, the UCRA applied for, and received a bank stabilization grant from the TCEQ. Funding for the project is provided by the CWA 319(h) program with match provided by the COSA. The project target area is located within the urban reach of the North Concho River in segment 1421, AU_08 and consists of approximately 2,000 linear feet of river bank beginning approximately 2,300 feet upstream of the Irving Street river crossing (designated on construction plans as sections 127 to 147). The bank stabilization was designed to stabilize areas of bank deterioration and trees at risk of collapsing into the river, thereby mitigating slumping and erosion that contribute to streambed deposition of substantial quantities of sediment and sludge. The project improves water quality through the removal of highly erodible materials, the emplacement of bank stabilizing boulders/rip-rap and slab stone, and the grading of the river bank to optimum slopes. Sediment load reductions were determined using actual measured quantities of sediment removed. Load reductions of bacteria were estimated using literature values correlated to the amounts of soil removed. Nutrient load reductions (NO3-N and P) were also estimated using literature values correlated to the quantity of soil removed. Potential ancillary water quality improvements in DO were evaluated by comparative analysis of pre- and post-construction acquired water quality data.
Project Significance and Background The urban portion of the North Concho River watershed (segment 1421, assessment unit 1421_08) is comprised of approximately 7,750 acres almost totally developed for residential, commercial and light industrial uses. Although some new development is occurring, little undeveloped property remains in the watershed and much of the area has been developed for

Upper Colorado River Authority Page 3
a long period of time. The drainage system in this area consists primarily of natural surface drainage features and a minor system of constructed storm sewers located almost exclusively in the downtown area. Several small dams impound water in this section of river. These dams have effectively created a series of urban storm water impoundments characterized by very low flows except during storm events. Due to deteriorated water quality and frequent fish kills, the urban North Concho River and particularly the downtown stream reach have been the focus of significant nonpoint source (NPS) study, monitoring and BMP construction in recent years. These activities had their beginnings in the development by COSA of an NPS abatement master plan. Several projects identified in the master plan have been implemented through funding from the EPA Clean Water Act (CWA) 319(h) program administered by the TCEQ. To date, the NPS abatement program consisting of the construction of several runoff detention and filtration BMPs has been successful. This is evidenced by a general improvement in water quality and a concomitant reduction in the occurrence of fish kills. However, poor water quality conditions continue to be manifested in AU 1421_08, which was first included in the 303(d) List in the 2008 Texas Integrated Report as being impaired for dissolved oxygen and bacteria. Voters in San Angelo approved a multi-million dollar project funded with sales tax revenues to make improvements along the North Concho River. A portion of these funds was used to dredge 52,250 cubic yards of anoxic solids along 1.5 river miles of streambed. The City of San Angelo earmarked over $3,000,000 in additional funds for bank stabilization, of which $249,008 were approved and set aside as local match for this grant. As previously mentioned, the in-town sections of the river primarily consist of a series of in-channel dams and reservoirs that are dominated by urban runoff. These impoundments and the river become progressively larger downstream through the city. During storm events, accumulations of sludge in upstream impoundments mix with stormwater runoff and are hydraulically exported and deposited downstream. This re-introduces nutrients into the water column and induces an oxygen depressive effect. One of the major contributors of this sediment was identified as erosion and bank/tree collapse within the project area. The project target consists of approximately 2,000 linear feet of the North Concho River bank beginning approximately 2,300 feet upstream of the Irving Street river crossing. The project area lies within AU 1421_08, which TCEQ has defined as that portion of the North Concho River segment 1421 from the confluence of the South Concho River upstream to the O.C. Fisher dam. This project is part of a larger River Improvement Project being conducted by COSA, the administration and management of which was performed by the UCRA under contract from COSA. The project planning, permitting and engineering was funded by COSA and accomplished prior to the grant commencement date.

Upper Colorado River Authority Page 4
Methods Construction Methods The construction phase of the river bank stabilization consisted of the excavation of highly erodible materials, the emplacement of bank stabilizing boulders (rip-rap) and slab stone. During this process the river bank was graded to optimum slopes for erosion prevention. Boulder rip rap was used in harder to access areas with steep slopes. This is a cost effective method that provides high quality aquatic life habitat. Slab stone stabilization, which provides an aesthetically pleasing natural ledge appearance and also provides quality habitat, was used elsewhere. Sediment Load Reduction Volumetric Calculation Methods The soil that was excavated prior to the emplacement of the bank stabilization components was placed by the construction contractors in three spoils piles and segregated from other spoils piles. The length, width and the estimated height of each of these three piles were measured. Volumetric calculations (length X width X height) were performed on each pile to determine the amount of material in each spoils pile. These results were summed to arrive at the total cubic yards of highly erodible material excavated and removed from the project area. This total comprises the volume of material prevented from eroding and/ or sloughing into the river and being deposited as sediment in the streambed. To determine the sediment load reduction, the volume was converted to weight. This was accomplished using the Tom Green County Soils Survey (1976) to identify soil names and textural descriptions, and the official USDA textural ternary diagram from the NRCS Soil Survey Manual (1993) to determine the soils classifications, i.e. percentages of sand silt and clay. The percentages of sand, silt and clay were then multiplied by the midrange weights of each of these constituents obtained from the Natural Resources Conservation Service (NRCS) Field Office Technical Guide (FOTG) on Streambank Erosion (2003) to arrive at the pounds of each constituent excavated. These were summed to arrive at the total pounds of sediment removed, which equates to the sediment total load reduction. The Upper Colorado River Authority calculated annualized rate of pollutant load reductions based on a ten year average of the total amounts of pollutants removed. The ten year time frame is the estimated time period during which the materials would have sloughed or have been eroded into the North Conch River. The calculated annualized TSS load reductions are presented in the table included in the next section of this report. Bacteria Load Reduction Estimation Methods It has been shown in numerous studies that river bottom sediments serve as a reservoir for E coli and fecal bacteria. The sediment load reductions realized through this project prevent future deposition of the removed sediment in the streambed, thereby decreasing the available bacteria reservoir, thus preventing the resuspension during runoff events of in situ E. coli into the water column.

Upper Colorado River Authority Page 5
The bacteria load reduction estimate was ascertained using literature values of mean E. coli counts from background (not derived from animal fecal contamination) E. coli occurring in temperate soils from a riparian ecosystem that exemplified similar textural characteristics. The reference study used is entitled Population structure, persistence, and seasonality of autochthonous Escherichia coli in temperate, coastal forest soil form a Great Lakes watershed (Byappanahalli, M.N. et al., 2006). In this study, the samples were taken from the upper 6cm (2.36”) of soil and the overall mean counts of E. coli from this study are given as MPN g-1. The surface area of excavated material removed during bank stabilization and slope grading in this project was conservatively estimated to average 5 foot/linear foot. This number was used to calculate total square footage and the square footage was used in conjunction with the 2.36” (depth of soil samples in the reference study) to calculate the volume of surface soil removed. The weight of removed soil was calculated using the average weight/cu. ft. of soil taken from the sediment load reduction calculations. This number was converted to grams and reduced to 88% of the total (to conform to the percentage of samples in which E. coli occurred in reference study) and was used with the mean MPN from the reference study to calculate the total number of cfu removed. The calculated annualized bacteria load reductions are presented in the table included in the next section of this report. NO3-N and P Load Reduction Estimation Methods The NO3-N and P load reduction estimates were calculated using mean NO3-N and P values from soils collected in semi-arid riparian areas with textural characteristics similar to soils of the bank stabilization project. The reference research paper used is entitled Flow regulation has minimal influence on mycorrhizal fungi of a semi-arid floodplain ecosystem despite changes in hydrology, soils, and vegetation (Beauchamp, V. B. et al., 2006). Although the research focus of the reference paper is not pertinent to NO3-N and P load reductions, the research effort involved obtaining a large data set of laboratory analyses that included NO3-N and P values. The data set provides mean NO3-N and P values derived from soil test analyses of randomly selected 5 part composited samples from each of twenty-seven 100m2 plots. This large data set provides excellent representative values of No3-N and P, which correspond very well to the riparian soils removed during the bank stabilization project. The NO3-N and P values, given in ppm in the reference paper, were converted to lbs./cu. ft. NO3-N and lbs./cu. ft. P using methodology included in (Camberato, Jim et al., 2013) and (Liu, Guodong et al., 2013) respectively. These results were multiplied by the total cubic feet of soil removed from the project site during bank stabilization activities to calculate the NO3-N and P load reductions. The calculated pollutant NO3-N and P load reductions are presented in the table included in the next section of this report. Potential Ancillary Improvements in DO Potential ancillary water quality improvements in DO were evaluated by comparative analysis using simple measures of central tendency of pre- and post-construction water quality data acquired data from the TCEQ Continuous Water Quality Monitoring Network (CWQMN)

Upper Colorado River Authority Page 6
Program.
Results and Observations The construction phase of the bank river improvement and back stabilization project was conducted between October 2011 and year-end 2012. This project was conducted on river sections designated as 127 to 147 on the bank stabilization construction plans (previously submitted to TCEQ). The project resulted in the removal of 5,969,882.7 lbs. of highly erodible materials and portions of river bank in imminent danger of collapse and sloughing into the river. The excavated areas were replaced with boulder rip rap and slab stone bank stabilization materials along 2,000 linear feet of targeted river bank. Construction activities also included grading the river bank to the optimum slope to minimize erosion potential. Sediment Load Reduction Calculation Details Using the measurement and calculation methods described above, the following provides a detailed presentation of the sediment load reduction calculations. The measurements of each of the three segregated spoils piles derived from excavation and slope grading at the project follows: 50’ x 62’ x 10’ = 31,000 cu feet = 1,148 cu yds. 62’ x 49’ x 10’ = 30,380 cu feet = 1,125 cu yds. 29’ x 49’ x 8’ = 11,368 cu feet = 421 cu yds. The three piles totaled 2,694 cu. yds of material excavated. This converts to a total of 72,748 cubic feet. The sand silt and clay percentages were derived using the methods described above. The Tom Green County Soil Survey Map identifies the soils at the project site to be in the Rio Concho and Spur Soil Series (1976). Each of these series is described as consisting of a clay loam from the surface down to 80 inches (1976), which is the deepest depth described. The midpoint of the official USDA textural ternary diagram (1993) for clay loam gives the following percentages of sand, silt and clay. The weights of each constituent are taken from FOTG on Streambank Erosion (2003). Sand 32.5% = 23,642.1 cu ft. X 100 lb/cubic foot = 2,364,310 lbs of sand removed Silt 32.5% = 23,643.1 cu ft. X 82.5 lbs/cubic foot = 1,950,55.7 lbs of silt removed Clay 35% = 25,468.8 cu ft. X 65 lb/cubic foot = 1,655,017 lbs of clay removed The calculated total lbs. of sediment removed = 5,969,882.7 lbs. The average weight per cu. ft. calculates to 82.06 lbs/cu. ft.

Upper Colorado River Authority Page 7
Bacteria Load Calculation Details E. coli is used as the indicator bacteria in this document. The bacteria load reduction calculations uses data provided in the reference document (Byappanahalli, M.N. et al., 2006). The following provides a detailed presentation of the estimated E. coli load reductions achieved through this project. It is assumed that an amount of E. coli bacteria equivalent to those presented in the above named reference document (Byappanahalli, M.N. et al., 2006) are present in the similar soils excavated and disposed of during implementation of the North Concho River Improvements/Bank Stabilization Project. The research document states a background E. coli overall mean count of 16 MPN)/g-1 persisting in soils located near a tributary to the Great Lakes. MPN is most probable number of colony forming units. This value was from soil samples collected from the surface to a depth of 6cm, and when converted to inches equals 2.36”. Conversion of 2.36 inches depth to volume calculates to 339.84 cu. in. per square foot. It is conservatively estimated that 10,000 square feet of surface soil was removed from the site during bank stabilization excavation and optimal slope grading activities. The estimated 10,000 square feet multiplied by the 339.84 cu. in. per square foot equals 3,398,400 cu. in., and when converted to cu. ft., equals 1,966.67 cu. ft. Using the 82.06 lbs./cu. ft. value taken from the sediment loading calculations multiplied by the 1,966.67 cu. ft. of soil removed equals a total of 161,384.94 lbs. of soil removed. Converting this amount to grams results in 76,268,762.85 grams of soil removed. Because only 88% of the samples in the reference study contained E. coli, a reduction to 88% of the total grams of soil removed is required. This leaves 64,476,511.31 grams of soil with E. coli. Finally, because the reported mean MPN is 16, a final multiplication of 16 is required to arrive at the final number of 1,031,624,180.94 MPN. For the purposes of this calculation, MPN and cfu are interchangeable, thus the calculated final E. coli load reduction is 1.031624 billion cfu. NO3-N and P Load Reduction Calculation Details The value given in ppm NO3-N in the reference paper, (Beauchamp, V. B. et al., 2006) required a conversion to lbs./cu. ft. NO3-N to facilitate calculating load reduction. Using the methodology of (Camberato, Jim et al., 2013), the 26.2 ppm NO3-N converts to 104.8 lbs./acre at 12 inches sample depth. This was converted to lbs./cu. ft. by dividing by 43,560, which results in 0.0024058 lbs./cu. ft. The 72,748 cu. ft. of soil that was excavated and removed during bank stabilization was multiplied by the 0.0024058 lbs./cu. ft. to ascertain the NO3-N load reduction of 175.02 lbs. The value given in ppm P in the reference paper, (Beauchamp, V. B. et al., 2006) required a conversion to lbs./cu. ft. NO3-N to facilitate calculating load reduction. Using the methodology of Liu, Guodong et al., (2013), the 43.1ppm P converts to 172.4 lbs/acre at 12 inches sample depth. This was converted to lbs./cu.ft. by dividing by 43,560, which results in 0.0039577 lbs./cu. ft. The 72,748 cu. ft. of soil that was excavated and removed during bank stabilization. This value was multiplied by the 0.0039577 lbs./cu. ft. to ascertain the P load reduction of
Upper Colorado River Authority Page 8
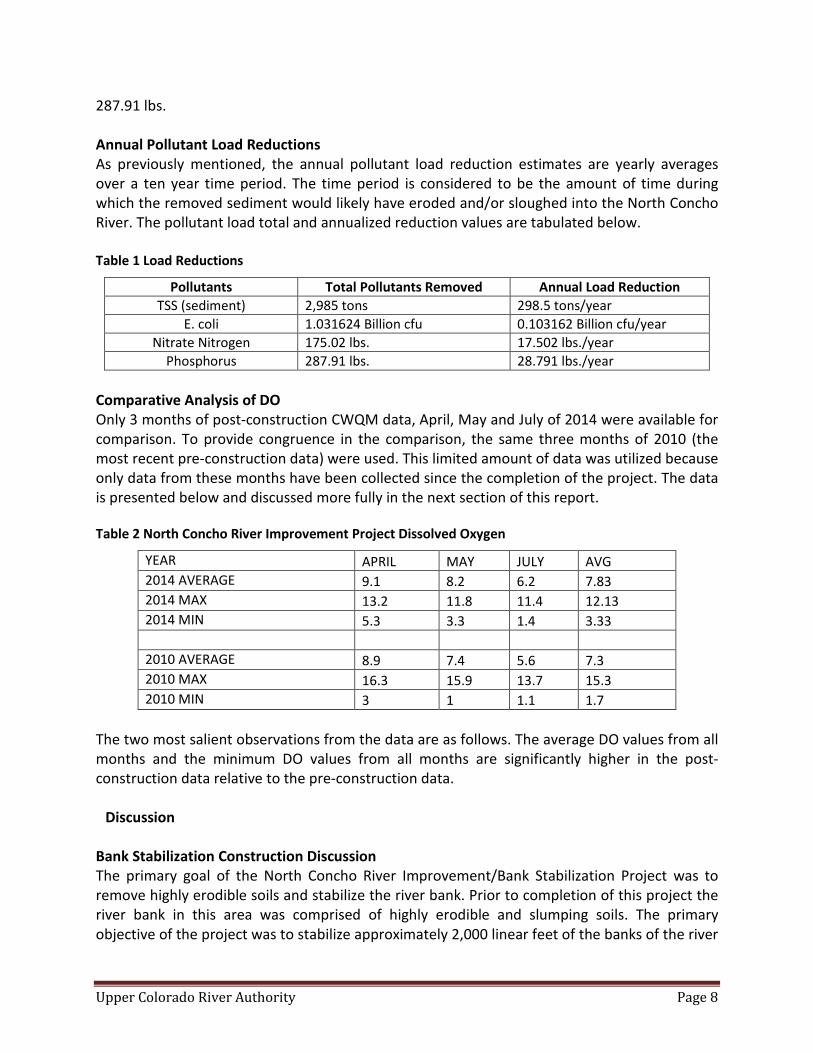
287.91 lbs. Annual Pollutant Load Reductions As previously mentioned, the annual pollutant load reduction estimates are yearly averages over a ten year time period. The time period is considered to be the amount of time during which the removed sediment would likely have eroded and/or sloughed into the North Concho River. The pollutant load total and annualized reduction values are tabulated below. Table 1 Load Reductions
Pollutants Total Pollutants Removed Annual Load Reduction TSS (sediment) 2,985 tons 298.5 tons/year
E. coli 1.031624 Billion cfu 0.103162 Billion cfu/year Nitrate Nitrogen 175.02 lbs. 17.502 lbs./year
Phosphorus 287.91 lbs. 28.791 lbs./year Comparative Analysis of DO Only 3 months of post-construction CWQM data, April, May and July of 2014 were available for comparison. To provide congruence in the comparison, the same three months of 2010 (the most recent pre-construction data) were used. This limited amount of data was utilized because only data from these months have been collected since the completion of the project. The data is presented below and discussed more fully in the next section of this report. Table 2 North Concho River Improvement Project Dissolved Oxygen
YEAR APRIL MAY JULY AVG 2014 AVERAGE 9.1 8.2 6.2 7.83 2014 MAX 13.2 11.8 11.4 12.13 2014 MIN 5.3 3.3 1.4 3.33
2010 AVERAGE 8.9 7.4 5.6 7.3 2010 MAX 16.3 15.9 13.7 15.3 2010 MIN 3 1 1.1 1.7
The two most salient observations from the data are as follows. The average DO values from all months and the minimum DO values from all months are significantly higher in the post-construction data relative to the pre-construction data.
Discussion Bank Stabilization Construction Discussion The primary goal of the North Concho River Improvement/Bank Stabilization Project was to remove highly erodible soils and stabilize the river bank. Prior to completion of this project the river bank in this area was comprised of highly erodible and slumping soils. The primary objective of the project was to stabilize approximately 2,000 linear feet of the banks of the river

Upper Colorado River Authority Page 9
to prevent rapid erosion and deposition of bank materials in the streambed of the river. The work included the excavation of the river bank, emplacement of boulder rip rap or slab stone and grading the near-bank surface to optimum slopes to prevent erosion. This work was begun in October of 2011 and concluded near the end of 2012. Spoils piles from excavation of the river bank were measured and it was determined that 72,748 cu. ft. of soil, with an estimated weight of 5,969,882.7 lbs., was excavated and disposed. This amount represents the total sediment load reduction achieved by the project. On an annualized basis, this calculates to be a load reduction of 298.5 tons/yr. Bacteria Load Reduction Discussion It is not only the load reduction of sediment that will positively impact water quality in the North Concho River, but also the load reductions of bacteria, NO3-N and P. The reported bacteria load reduction of 1.031624 billion cfu was calculated using literature values of a research paper that observed and counted bacteria colonies in a riparian setting near Lake Michigan. It is considered likely that the bacteria load reduction is underreporting the actual case. Generally speaking, background E. coli colonies in soils should persist more robustly in the warmer climate of the project site than in northern climes. There was no funding in the project budget for the collection and analysis of soil samples for E. coli to confirm this assertion. However, it is considered a valid point and the 1.031624 billion cfu bacteria load reduction is considered to be a very conservative estimate. On an annualized basis, this calculates to be a load reduction of 0.103162 billion cfu/yr. NO3-N and P Load Reduction Discussion It is likewise asserted that the reported total NO3-N load reduction of 175.02 lbs. and P load reduction of 287.91 lbs. may also be underreported. This potential exists because the soils at the bank stabilization site, although similar in textural characteristics to the reference soils, have a modestly higher content of clay. NO3-N and P leach at a slower rate in clay and finer grained soils, and typically have higher NO3-N and P retention capacities than do coarser soils (Gaines, T.P. et al., 2008). The reported 175.02 lbs. NO3-N and 287.91 P load reductions are also considered conservative estimates. On an annualized basis, this calculates to be load reductions of 17.502 lbs/yr NO3-N and 28.791 lbs/yr P. Comparative Analysis of DO Discussion The most critical DO value is the minimum DO. In the post-construction data set the minimum DO values for each of the months for which data was available are all higher than the corresponding DO values for the pre-construction data. On a percentage basis the minimum DO improvements are >76%, >300% and > 7% for the months of April, May and July respectively. This is a considered a major improvement in DO. The monthly mean DO values are also all higher than the corresponding DO values from the pre-construction data. The percentages >2%, >10% and >10% for the months of April, May and July respectively.

Upper Colorado River Authority Page 10
The maximum DO values of the pre-construction data set are significantly higher than the post-construction values for each month. Although counter-intuitive, this is actually a good result. What this is expressing is the fact that the radical diurnal swings in DO have been attenuated. Instead of the DO going from almost nothing to very high on a daily basis, it is staying in a tighter range while maintaining higher minimum daily values. This produces a much less stressful aquatic habitat and is a more desirable condition. Education Outreach Activities Discussion A pre-construction tour for public officials took place on 4/24/12. An additional tour was conducted on 3/27/12 after the Clean River Program Coordinated Monitoring Meeting. A middle school group toured the construction site with UCRA’s Educator, Christy Youker on 4/25/12. UCRA worked with City staff throughout the construction of the project to keep the general public apprised of the on-going project, both inside and outside the project area. The City kept real time updates on construction progress on their website through October 2013. UCRA included a link on its project web page to this as well. The website (and links) were removed in October 2013 after the formal project dedication. The City Council addressed Concho River bank stabilization issues at a Council meeting in August 2012. The meeting received local media coverage. A large sign, identifying the project management and funding by TCEQ & EPA respectively, was placed at the construction sign on 6/15/12 and remains to this date. UCRA staff documented and photographed placement of the sign and emailed photos to the TCEQ Project Manager on 6/15/12. UCRA’s Education and Outreach Coordinator, Dr. Christy Youker, conducted several youth camps in the summer of 2012 and worked with the Aqua Squad, a group of local middle school “Water Ambassadors”. Youker incorporated teachable moments in emphasizing the value bank stabilization for water quality, specifically as it relates to the project, into regular education events. The Bank Stabilization project and past 319(h) projects are used as examples of how the UCRA, TCEQ & EPA are making a difference in the local river. These events have received substantial media coverage. Youker and Aqua Squad have actively promoted the river project with many large scale events. Aqua Squad assisted with Alta Loma Elementary Science Night on 10/12/12, the annual EcoFair on 10/13/12 and “The Great Reveal” on 10/27/12. Is it estimated that 575 students and adult were served. Youker continued to incorporate emphasis on the value bank stabilization for water quality, specifically as it relates to the project, into these events.

Upper Colorado River Authority Page 11
Other events included; Santa Rita Elementary School Family Math and Science Night on 1/23/13 with 300 adults/children in attendance, Bradford Elementary School’s Math & Science Night on 2/7/13 with 175 adults/children in attendance and ASU’s Expanding Your Horizons Event on 2/23/13, with 25 middle school students from the region that included two sessions on building a watershed model. Youker was featured in local media in February 2013 with two T.V. spots and one radio interview discussing general water quality issues which included the benefits and status of the bank stabilization project. Fort Concho Math & Science Night was held on 3/26/13 with 350 parents/children in attendance. World Water Week was the week of March 18, 2013. Events included water quality testing with CHS Environmental Science students and the annual river blessing at Celebration Bridge with students from Fort Concho Elementary & Angelo Catholic schools on 3/22/13. Youker was featured in local media television coverage on 3/12/13, 3/19/13, 4/4/13, 4/9/13, 5/10/13 and 5/15/13. Youker discussed general water quality issues that also pertain to the bank stabilization project and the benefits thereof. The Art of Nature camp was held in June 2013. Campers learned about watersheds, made a salt map watershed, fished, created xeriscape models, made rain catchment barrels and canoed the Concho that included the portion where the project took place. These activities are paired with others to teach campers about conservation and water quality enhancements that also include discussion of the project area and the benefits to the watershed in regards to NPS abatement. 100 students, ages 7-12 participated in the camp. Camp Odyssey was held August 5-0, 2013 and focused on conservation. All activities included discussion of the project area and the benefits that NPS abatement creates in the watershed. 35 students, grades 4-8 participated in the camp. Aqua Squad made a presentation to the San Angelo City Council on Oct 1, 2013 entitled “Crisis on the Concho” and it was well received. Riverfest and the annual Eco Fair was held October 18-19, 2013 serving as the kickoff/post construction tour of the completed bank stabilization project. A dedication ceremony was held on 10/19/13. The event was a huge success with an estimated 6000 people attending the events over the weekend. The event garnered substantial media coverage and attention to the area A series of short one minute videos were prepared in QTR1FYE14 and are showcased on the SAISD website, the COSA website and the local city channel. Videos feature water quality preservation and conservation tips, some relating to NPS prevention.
Summary The Project successfully stabilized approximately 2000 linear feet of riverbank on the N. Concho River in San Angelo, TX.

Upper Colorado River Authority Page 12
A total of 2,694 cu. yds. of highly erodible riverbank soil was removed during the bank stabilization construction phase of the project. This equates to a total sediment load reduction of 5,969,882.7 lbs. The estimated load reduction for NO3-N is 175.02 lbs. and the estimated load reduction for P is 287.91 lbs. The comparative analysis conducted on pre- and post-construction DO data indicated that, subsequent to the completion of the back stabilization project, higher minimum DO values are being maintained in this section of the river. Not only are higher minimum DO values being maintained, but radical diurnal swings of DO values have been attenuated, providing an improvement to the aquatic environment. Pre-construction and post-construction photographic documentation of the project site are included in Appendix B. Copies of pertinent articles published in the San Angelo Standard Times (the local newspaper) are included in Appendix C. Numerous education and outreach activities were conducted in conjunction with the bank stabilization project. These include numerous tours of the site, conducted prior to construction, during construction, and post-construction. Various tour groups included public officials, Clean Rivers Program Partners, middle school groups, and others. COSA staff maintained a public informational website (with a link to the UCRA website) throughout construction of the project. In October 2013, a well publicized and well attended “Riverfest” celebration (total weekend attendance estimated at 6,000) was held in conjunction with the annual EcoFair to celebrate the completion of COSA’s River Improvement Project. Signage, identifying project management and funding by TCEQ and EPA respectively, was placed at the site on June 15 2012 and currently remains there. UCRA’s Education and Outreach Coordinator, Dr. Christy Youker, in her work with the local media and Aqua Squad emphasized to local middle school and elementary students the value of the bank stabilization project for water quality and how the partnership of URCA, TCEQ and EPA is improving water quality in the river. Youker and Aqua Squad promoted the river project with many other large scale events to hundreds of students and adults. A series of one minute videos were showcased on the SAISD and COSA’s websites and the local city information TV channel. Implementation of the bank stabilization project of the North Concho River accomplished one of the major BMPs identified in the Concho River Basin Watershed Protection Plan.

Upper Colorado River Authority Page 13
References Beauchamp, V.B., Stromberg, J.C., and Stutz, J.C., 2007, Flow regulation has minimal influence on mycorrhizal fungi of a semi-arid floodplain ecosystem despite changes in hydrology, soils, and vegetation, Journal of Arid Environments, v. 68, p. 188-205. Byappanahalli M.N, Whitman, R.L ., Shively, D.A., Sadowsky, M. J., and Ishii, S., 2006, Population structure, persistence, and seasonality of autochthonous Escherichia coli in temperate, coastal forest soil from a Great Lakes watershed, Environmental Microbiology, v. 8 (3), p.504-513. Camverato, J., Nielsen, R.L., and Joern, B., 2013, Assessing Available Nitrogen from Fall- Spring- Applied Nitrogen Applications, Purdue University Department of Agronomy Corny News Network, http://www.kingcorn.org/news/timeless/AssessAvailableN.html Gaines, T.P., 2008, Soil texture effect on nitrate leaching in soil percolates, Communications in Soil Science and Plant Analysis, v.25 issue 13-14, p. 2561-2570. Liu, G., Li, Y., and Gazula, A., 2013, Conversions of parts per million on soil test reports to pounds per acre, University of Florida IFAS Estension HS 1229, http://edis.ifas.ufl.edu/hs1229 Soil Survey Division Staff, 1993 Soil survey manual, Soil Conservation Service. U.S. Department of Agriculture Handbook 18. Soil Survey of Tom Green County, Texas, 1976, United States Department of Agriculture. Stream Bank Erosion, NRCS Field Office Technical Guide, 2003, United States Department of Agriculture

Upper Colorado River Authority Page 14