north lansing, michigan - the julian samora research … · north lansing, michigan: ... irish,...
TRANSCRIPT
Statistical Brief No. 10Cifras Breves No. 10
North Lansing, Michigan:Profile of an Inner City
By
Marcelo E. SilesSenior Research Associate, JSRI
Refugio I. RochínDirector and Professor, JSRI
August 1998
A Publication of
Julian Samora Research InstituteMichigan State University
112 Paolucci BuildingEast Lansing, MI 48824-1110
Phone: (517) 432-1317 • Fax: (517) 432-2221E-Mail: [email protected]
Web Page: http//www.jsri.msu.edu
The Julian Samora Research Institute is a unit of the Colleges of Social Sciences andAgriculture & Natural Resources at Michigan State University.
Michigan State UniversityEast Lansing, Michigan
Julian Samora Research InstituteRefugio I. Rochín, Director
Marcelo E. Siles, CIFRAS EditorDanny Layne, Layout Editor
SUGGESTED CITATION
Siles, Marcelo E. and Refugio I. Rochín. “North Lansing, Michigan: Profile of an Inner City.” JSRI CIFRASStatistical Brief No. 10, the Julian Samora Research Institute. Michigan State University, East Lansing, Michi-gan. August, 1998.
OTHER JULIAN SAMORA RESEARCH INSTITUTE STATISTICAL BRIEFS
CIFRAS-1 Aponte, Robert and Marcelo Siles. “Michigan Hispanics: A Socio-Economic Profile.” (1994)
CIFRAS-2 Rochín, Refugio and Marcelo Siles. “Michigan’s Farmworkers: A Status Report on Employmentand Housing.” (1994)
CIFRAS-3 Rosenbaum, Rene. “Hispanic Business Ownership and Industry Concentration in Michigan:A Comparison to National Patterns.” (1995)
CIFRAS-4 Siles, Marcelo and Rosemary Aponte. “The Education of Hispanics in Michigan: A ComparativeAssessment.” (1995)
CIFRAS-5 Aponte, Robert and Marcelo Siles. “Winds of Change: Latinos in the Heartland and the Nation.”(1997)
CIFRAS-6 Rumbaut, Rubén “Immigrants from Latin America and the Caribbean; A Socioeconomic Pro-file.” (1995)
CIFRAS-7 Allensworth, Elaine and Refugio Rochín. “Rural California Communities: Trends in Latino Pop-ulation and Community Life.” (1995)
CIFRAS-8 Heiderson, Mazin and Edgar Leon. “Patterns and Trends in Michigan Migrant Education.”(1996)
CIFRAS-9 Rochín, Refugio and Marcelo Siles. “Latinos in Nebraska: A Socio-Historical Profile.” (1996)
Lansing is one of the growth poles in Michiganwith a growing minority population. Its Hispanicshave registered more rapid growth than any otherminority group. One area within Lansing, the Northarea, houses a relatively large proportion of Latinos;16.7% as of the 1990 census. By comparison, theCity of Lansing is 8% Latino overall. The Metropol-itan Statistical Area (MSA) of Lansing, includingthree counties (Clinton, Eaton, and Ingham) has 3.5%Hispanics in the region.
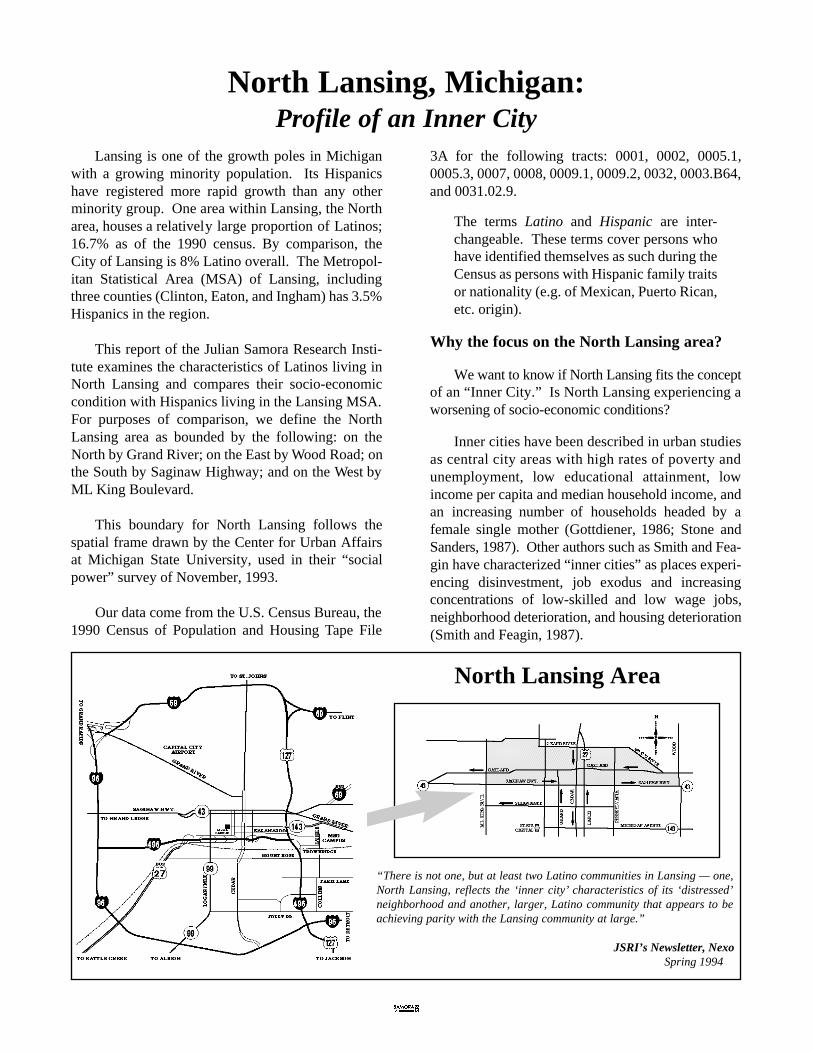
This report of the Julian Samora Research Insti-tute examines the characteristics of Latinos living inNorth Lansing and compares their socio-economiccondition with Hispanics living in the Lansing MSA.For purposes of comparison, we define the NorthLansing area as bounded by the following: on theNorth by Grand River; on the East by Wood Road; onthe South by Saginaw Highway; and on the West byML King Boulevard.
This boundary for North Lansing follows thespatial frame drawn by the Center for Urban Affairsat Michigan State University, used in their “socialpower” survey of November, 1993.
Our data come from the U.S. Census Bureau, the1990 Census of Population and Housing Tape File
3A for the following tracts: 0001, 0002, 0005.1,0005.3, 0007, 0008, 0009.1, 0009.2, 0032, 0003.B64,and 0031.02.9.
The terms Latino and Hispanic are inter-changeable. These terms cover persons whohave identified themselves as such during theCensus as persons with Hispanic family traitsor nationality (e.g. of Mexican, Puerto Rican,etc. origin).
Why the focus on the North Lansing area?
We want to know if North Lansing fits the conceptof an “Inner City.” Is North Lansing experiencing aworsening of socio-economic conditions?
Inner cities have been described in urban studiesas central city areas with high rates of poverty andunemployment, low educational attainment, lowincome per capita and median household income, andan increasing number of households headed by afemale single mother (Gottdiener, 1986; Stone andSanders, 1987). Other authors such as Smith and Fea-gin have characterized “inner cities” as places experi-encing disinvestment, job exodus and increasingconcentrations of low-skilled and low wage jobs,neighborhood deterioration, and housing deterioration(Smith and Feagin, 1987).
North Lansing, Michigan:Profile of an Inner City
North Lansing Area
“There is not one, but at least two Latino communities in Lansing — one,North Lansing, reflects the ‘inner city’ characteristics of its ‘distressed’neighborhood and another, larger, Latino community that appears to beachieving parity with the Lansing community at large.”
JSRI’s Newsletter, NexoSpring 1994
Researchers, including Gappert and Rose, havenoted other social and economic conditions of particu-lar “inner city.” For example, there is difficult physi-cal access to public services and lower quality ofservices provided in “inner cities.” Also, investmentsin education and recreational outlets for youth are par-ticularly low. The “inner city” also faces a low rev-enue base of tax dollars or private donations. This lowtax base, in turn, corresponds to a deterioration of thehousing stock and a general decline of private busi-ness. Conceomitantly, there is an accumulation offactors with an aggregated affect in the “inner city”and a subsequent impact on families and individuals(Gappert and Rose, 1975).
Multicultural/Ethnic Dimensions
North Lansing is undergoing transformations inits revenue base, in its social and economic condi-tions, and in the concerns expressed by local busi-nesses to redevelop North Lansing. The area, though,is not simply an urban space with an aggregation ofproblems. It is a community where Anglos, AfricanAmericans, Hispanics, Asians, and Native Americansshare their multicultural attributes. It is a confluenceof cultures, histories, and different groups who some-times differ in needs, but share a common space forcommunity relations.
Ethnic settlements are not new in North Lansing.Irish, Italian, and other European groups settled therebefore, dating back to the early years of this century.Also, North Lansing is considered by many as the
“original” Hispanic settlement area in Lansing, withorigins dating to the 40’s. It continues to be the placewhere there is a high degree of Hispanic concentration.North Lansing seems also to serve as a springboard forsome Hispanics who, after improving their humancapital and employment, take advantage of opportuni-ties to move to other areas in the MSA. A new A s i a norigin population is also arriving, thus making NorthLansing a dynamic community of diverse multiracial,multicultural, and multi-ethnic interests.
Given the growing concentration of Latinos inNorth Lansing, there is interest in knowing if the areais also becoming a “barrio” and especially, an “under-class barrio” with persistent, concentrated poverty.Although this Statistical Brief hints at underclassconditions, the report does not present an adequateanalysis of the “barrio-zation” underway in NorthLansing (See Moore and Pinderhughes, 1993).
General Contrasts: From the 1990 Census
From what the literature suggests, North Lansingappears to have “inner city” conditions:
• North Lansing has a relatively high concentrationof minorities. The proportion of Latinos in NorthLansing is nearly 17%. In the Lansing Metro-politan Statistical Area, the proportion of Latinosis 3.5%.
• The poverty rate of Hispanics in North Lansing isalmost double the rate in the MSA, i.e., Latinos
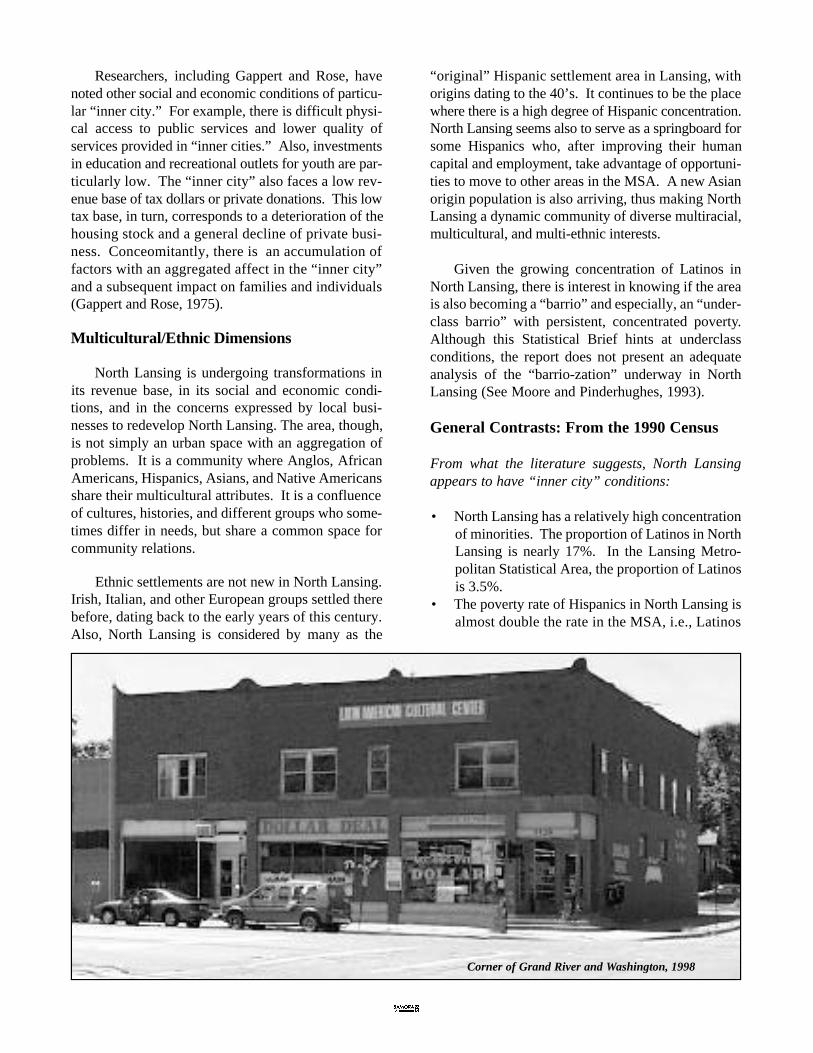
Corner of Grand River and Washington, 1998

there have a rate of 41.4%, whereas Hispanics inLansing MSA have a poverty rate of 23%.
• Hispanics in North Lansing earn considerablyless income. For example, the per capita incomefor Latinos of North Lansing is $5,832 whereasfor Latinos in the Lansing MSAit is $8,312 a netdifference of $2,480.
• Median household income is also different; forLatinos in North Lansing the median is $16,830whereas for Lansing MSAit is $27,814. In otherwords, Latinos in North Lansing earn 40% lessthan Latinos in the MSA.
• Household composition indicates that 28.5% ofthe Hispanic households in North Lansing areheaded by a female with no husband present;whereas for the Lansing MSA the rate is 23.5%.
• Educational attainment is lower for Latinos in theNorth Lansing area. Latinos 25 years and olderhave a graduation rate of 44.6% for high school,whereas in Lansing MSA is 64.3%.
• College graduation is also different. Latinos inNorth Lansing obtaining a College diploma rep-resent 5.6%, while in Lansing MSA it is 20%.
• Employment for Hispanics is low in North Lans-ing. The labor force participation rates for malesin North Lansing is 74%, and 54.5% for females.In contrast in the Lansing MSA, it is 77% formales and 61% for females. More employmentis evident for females in the MSA.
• Unemployment rates have significant variation inboth areas. Hispanic males in North Lansing havea rate of 13.5%, while males in MSA have 12.5%.A variation is found for females who in NorthLansing have a 18.4% unemployment rate, whilein the MSA it is 9.9%, almost double the rate.
• Hispanics pay more to rent housing than non-Hispanics. Median cash rent in North Lansingfor non-Hispanics is $397, whereas for Hispanicsit is $459.
• Median mortgage payments for Hispanics is$472 in North Lansing whereas in the MSA it is$623. Median owner costs is $191 in North Lans-ing, and $256 in the MSA. The differences hereshow that the quality of housing is low in NorthLansing, which causes owners to pay almost thesame amount as others living in outlining areas.Yet, residents in North Lansing earn consider-ably less.
Chart 1. Total Population Distribution by Race in Lansing, 1990
AIAAN American Indian, Eskimo, or Aleut AAPAsian or Pacific Islander
In 1990, Hispanics represented 16.2% of the total population in the North Lansing area and 3.3% in the Lansing MSA. Whitesconstituted the largest population in both the North Lansing and the Lansing MSA (62.7% and 87.6% respectively). Blacks repre -sented 16.8% in the North Lansing area and 6.7% in the Lansing MSA. All other groups accounted for 4.3% in North Lansing and2.5% in Lansing MSA.
A. The Demographics
The Lansing metropolitan area is a diverse urbanarea. Chart 1 shows the composition of persons liv-ing in North Lansing by race and ethnicity. Of thetotal 432,674 persons living in the MSA of Lansingalmost 4% (3.9) reside in the North Lansing area or17,897 persons. North Lansing’s proportional shareof Latinos increases when the area is compared tojust the City of Lansing. The share of total residentsliving in the North area increases to 14.6%. Overall,the distribution of population in North Lansing is63% for Whites, 16.8% for Blacks, 16.2% for His-panics, and 4.5% for others. In the Lansing MSA,Whites represent 88%, Blacks 7%, Hispanics 3%,and others 3%.
As indicated in Chart 1, both Latinos and A f r i c a nAmericans are the two largest groups of minorities inthe North Lansing area. The differences in percent-ages are insignificant, the rate for Latinos is 16.2% andfor Blacks is 16.8% of the total population of NorthLansing. However, both groups constitute a signifi-cant one-third of the total population in the area.
There are 2,900 Latinos living in the North Lans-ing area. In terms of origin, of the total population ofHispanics, Mexican origin residents constitute the
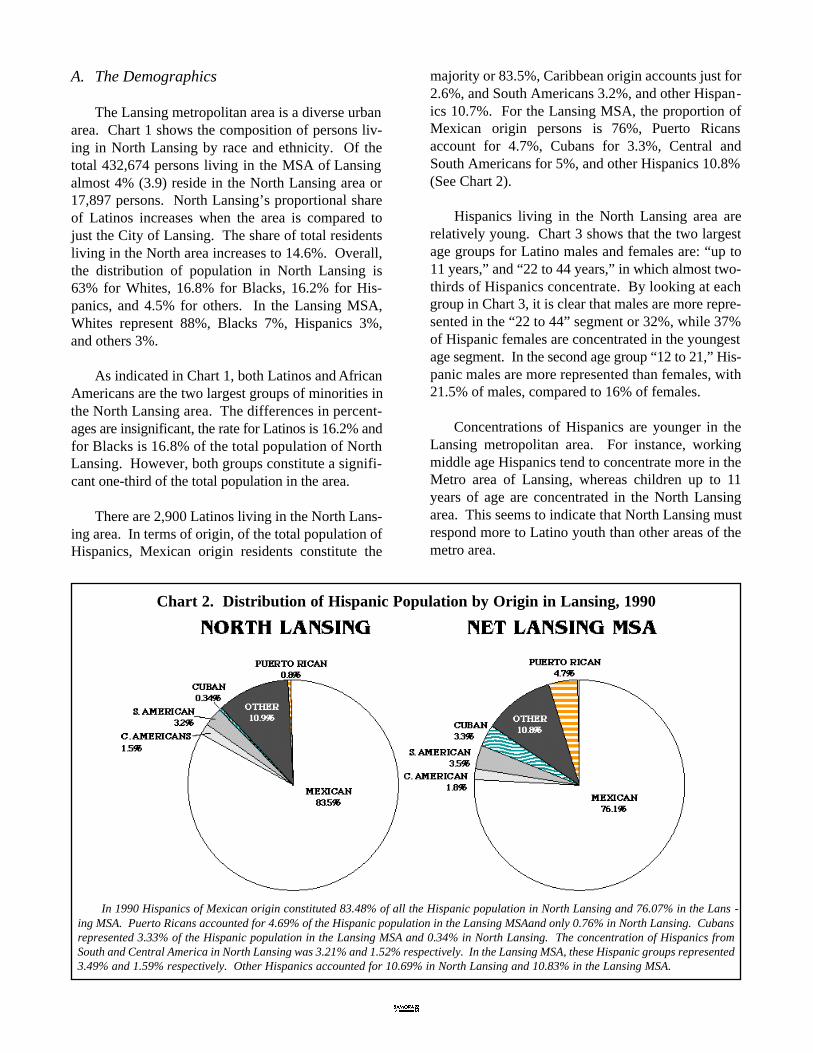
majority or 83.5%, Caribbean origin accounts just for2.6%, and South Americans 3.2%, and other Hispan-ics 10.7%. For the Lansing MSA, the proportion ofMexican origin persons is 76%, Puerto Ricansaccount for 4.7%, Cubans for 3.3%, Central andSouth Americans for 5%, and other Hispanics 10.8%(See Chart 2).
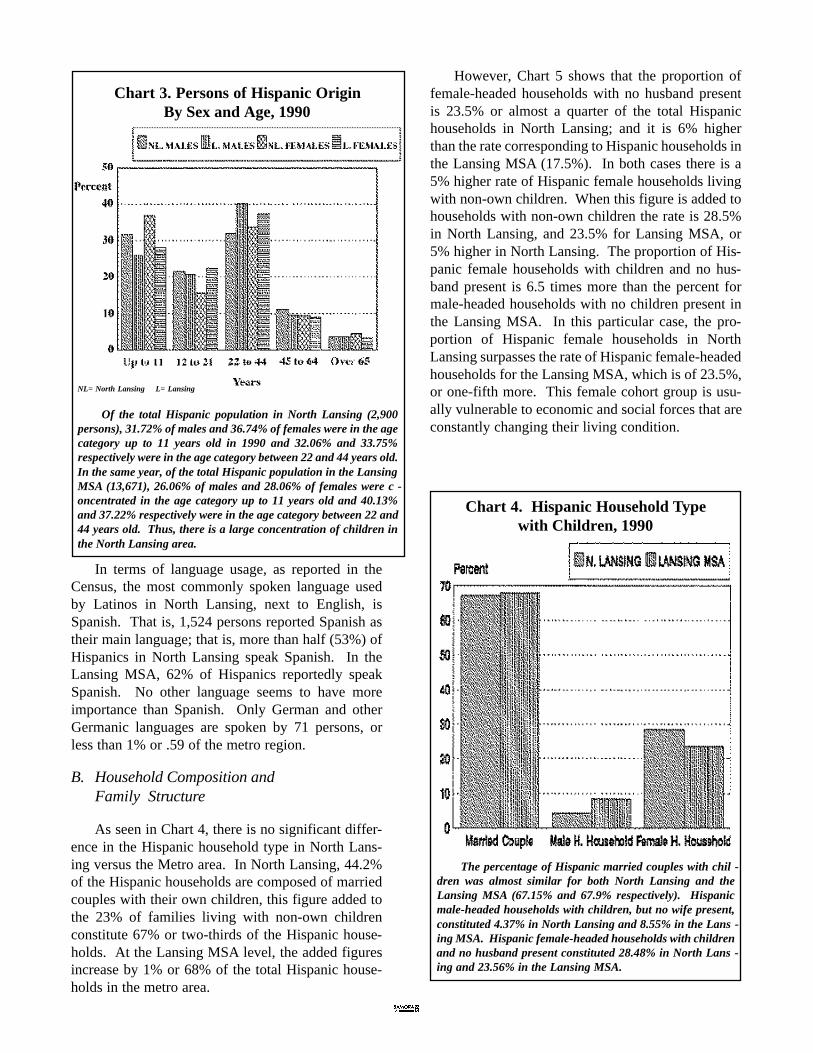
Hispanics living in the North Lansing area arerelatively young. Chart 3 shows that the two largestage groups for Latino males and females are: “up to11 years,” and “22 to 44 years,” in which almost two-thirds of Hispanics concentrate. By looking at eachgroup in Chart 3, it is clear that males are more repre-sented in the “22 to 44” segment or 32%, while 37%of Hispanic females are concentrated in the youngestage segment. In the second age group “12 to 21,” His-panic males are more represented than females, with21.5% of males, compared to 16% of females.
Concentrations of Hispanics are younger in theLansing metropolitan area. For instance, workingmiddle age Hispanics tend to concentrate more in theMetro area of Lansing, whereas children up to 11years of age are concentrated in the North Lansingarea. This seems to indicate that North Lansing mustrespond more to Latino youth than other areas of themetro area.
Chart 2. Distribution of Hispanic Population by Origin in Lansing, 1990
In 1990 Hispanics of Mexican origin constituted 83.48% of all the Hispanic population in North Lansing and 76.07% in the Lans -ing MSA. Puerto Ricans accounted for 4.69% of the Hispanic population in the Lansing MSAand only 0.76% in North Lansing. Cubansrepresented 3.33% of the Hispanic population in the Lansing MSA and 0.34% in North Lansing. The concentration of Hispanics fromSouth and Central America in North Lansing was 3.21% and 1.52% respectively. In the Lansing MSA, these Hispanic groups represented3.49% and 1.59% respectively. Other Hispanics accounted for 10.69% in North Lansing and 10.83% in the Lansing MSA.
In terms of language usage, as reported in theCensus, the most commonly spoken language usedby Latinos in North Lansing, next to English, isSpanish. That is, 1,524 persons reported Spanish astheir main language; that is, more than half (53%) ofHispanics in North Lansing speak Spanish. In theLansing MSA, 62% of Hispanics reportedly speakSpanish. No other language seems to have moreimportance than Spanish. Only German and otherGermanic languages are spoken by 71 persons, orless than 1% or .59 of the metro region.
B . Household Composition and Family Stru c t u re
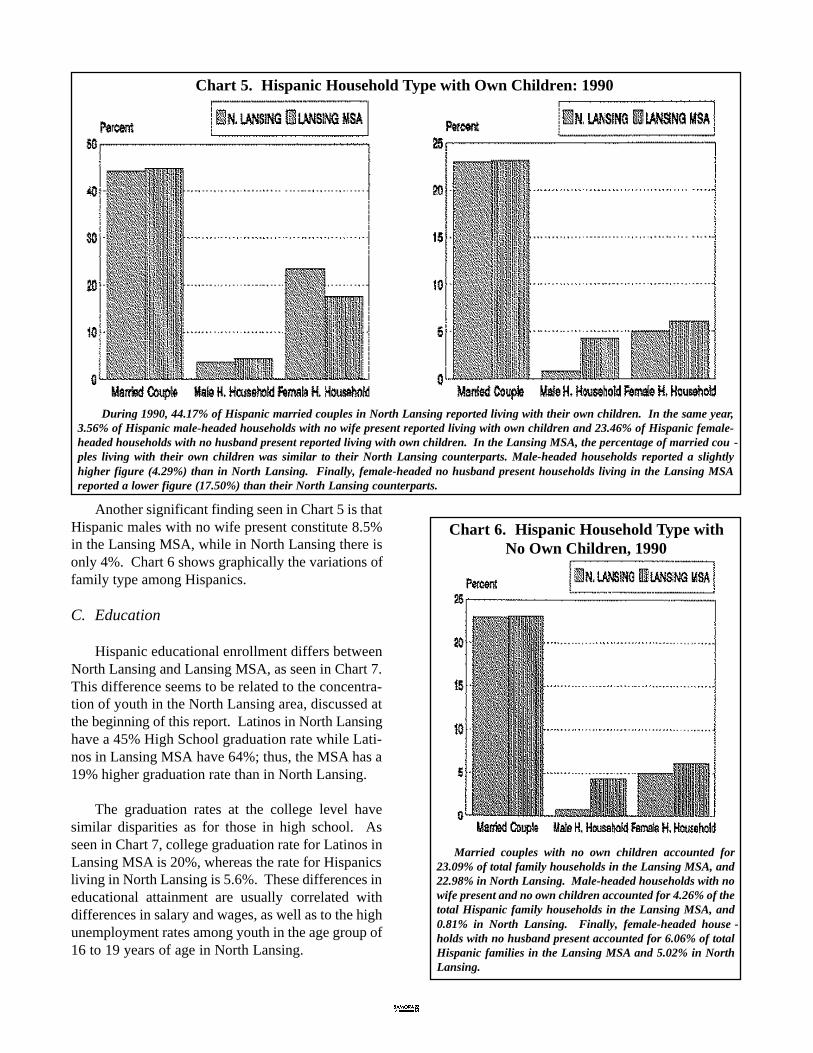
As seen in Chart 4, there is no significant differ-ence in the Hispanic household type in North Lans-ing versus the Metro area. In North Lansing, 44.2%of the Hispanic households are composed of marriedcouples with their own children, this figure added tothe 23% of families living with non-own childrenconstitute 67% or two-thirds of the Hispanic house-holds. At the Lansing MSA level, the added figuresincrease by 1% or 68% of the total Hispanic house-holds in the metro area.
However, Chart 5 shows that the proportion offemale-headed households with no husband presentis 23.5% or almost a quarter of the total Hispanichouseholds in North Lansing; and it is 6% higherthan the rate corresponding to Hispanic households inthe Lansing MSA (17.5%). In both cases there is a5% higher rate of Hispanic female households livingwith non-own children. When this figure is added tohouseholds with non-own children the rate is 28.5%in North Lansing, and 23.5% for Lansing MSA, or5% higher in North Lansing. The proportion of His-panic female households with children and no hus-band present is 6.5 times more than the percent formale-headed households with no children present inthe Lansing MSA. In this particular case, the pro-portion of Hispanic female households in NorthLansing surpasses the rate of Hispanic female-headedhouseholds for the Lansing MSA, which is of 23.5%,or one-fifth more. This female cohort group is usu-ally vulnerable to economic and social forces that areconstantly changing their living condition.
Chart 3. Persons of Hispanic OriginBy Sex and Age, 1990
Of the total Hispanic population in North Lansing (2,900persons), 31.72% of males and 36.74% of females were in the agecategory up to 11 years old in 1990 and 32.06% and 33.75%respectively were in the age category between 22 and 44 years old.In the same year, of the total Hispanic population in the LansingMSA (13,671), 26.06% of males and 28.06% of females were c -oncentrated in the age category up to 11 years old and 40.13%and 37.22% respectively were in the age category between 22 and44 years old. Thus, there is a large concentration of children inthe North Lansing area.
NL= North Lansing L= Lansing
Chart 4. Hispanic Household Typewith Children, 1990
The percentage of Hispanic married couples with chil -dren was almost similar for both North Lansing and theLansing MSA (67.15% and 67.9% respectively). Hispanicmale-headed households with children, but no wife present,constituted 4.37% in North Lansing and 8.55% in the Lans -ing MSA. Hispanic female-headed households with childrenand no husband present constituted 28.48% in North Lans -ing and 23.56% in the Lansing MSA.
Another significant finding seen in Chart 5 is thatHispanic males with no wife present constitute 8.5%in the Lansing MSA, while in North Lansing there isonly 4%. Chart 6 shows graphically the variations offamily type among Hispanics.
C. Education
Hispanic educational enrollment differs betweenNorth Lansing and Lansing MSA, as seen in Chart 7.This difference seems to be related to the concentra-tion of youth in the North Lansing area, discussed atthe beginning of this report. Latinos in North Lansinghave a 45% High School graduation rate while Lati-nos in Lansing MSA have 64%; thus, the MSA has a19% higher graduation rate than in North Lansing.
The graduation rates at the college level havesimilar disparities as for those in high school. Asseen in Chart 7, college graduation rate for Latinos inLansing MSA is 20%, whereas the rate for Hispanicsliving in North Lansing is 5.6%. These differences ineducational attainment are usually correlated withdifferences in salary and wages, as well as to the highunemployment rates among youth in the age group of16 to 19 years of age in North Lansing.
Chart 5. Hispanic Household Type with Own Children: 1990
Married couples with no own children accounted for23.09% of total family households in the Lansing MSA, and22.98% in North Lansing. Male-headed households with nowife present and no own children accounted for 4.26% of thetotal Hispanic family households in the Lansing MSA, and0.81% in North Lansing. Finally, female-headed house -holds with no husband present accounted for 6.06% of totalHispanic families in the Lansing MSA and 5.02% in NorthLansing.
During 1990, 44.17% of Hispanic married couples in North Lansing reported living with their own children. In the same year,3.56% of Hispanic male-headed households with no wife present reported living with own children and 23.46% of Hispanic female-headed households with no husband present reported living with own children. In the Lansing MSA, the percentage of married cou -ples living with their own children was similar to their North Lansing counterparts. Male-headed households reported a slightlyhigher figure (4.29%) than in North Lansing. Finally, female-headed no husband present households living in the Lansing MSAreported a lower figure (17.50%) than their North Lansing counterparts.
Chart 6. Hispanic Household Type withNo Own Children, 1990
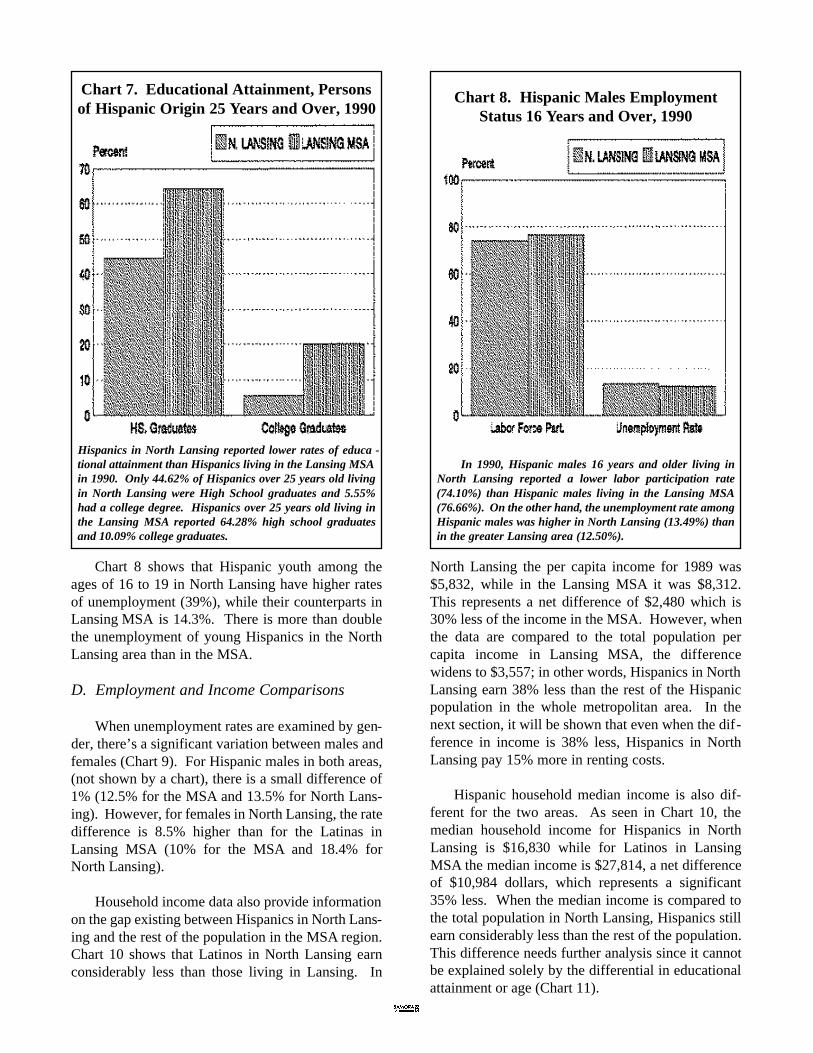
Chart 8 shows that Hispanic youth among theages of 16 to 19 in North Lansing have higher ratesof unemployment (39%), while their counterparts inLansing MSA is 14.3%. There is more than doublethe unemployment of young Hispanics in the NorthLansing area than in the MSA.
D. Employment and Income Comparisons
When unemployment rates are examined by gen-der, there’s a significant variation between males andfemales (Chart 9). For Hispanic males in both areas,(not shown by a chart), there is a small difference of1% (12.5% for the MSA and 13.5% for North Lans-ing). However, for females in North Lansing, the ratedifference is 8.5% higher than for the Latinas inLansing MSA (10% for the MSA and 18.4% forNorth Lansing).
Household income data also provide informationon the gap existing between Hispanics in North Lans-ing and the rest of the population in the MSA region.Chart 10 shows that Latinos in North Lansing earnconsiderably less than those living in Lansing. In
North Lansing the per capita income for 1989 was$5,832, while in the Lansing MSA it was $8,312.This represents a net difference of $2,480 which is30% less of the income in the MSA. However, whenthe data are compared to the total population percapita income in Lansing MSA, the diff e r e n c ewidens to $3,557; in other words, Hispanics in NorthLansing earn 38% less than the rest of the Hispanicpopulation in the whole metropolitan area. In thenext section, it will be shown that even when the dif-ference in income is 38% less, Hispanics in NorthLansing pay 15% more in renting costs.
Hispanic household median income is also dif-ferent for the two areas. As seen in Chart 10, themedian household income for Hispanics in NorthLansing is $16,830 while for Latinos in LansingMSA the median income is $27,814, a net differenceof $10,984 dollars, which represents a significant35% less. When the median income is compared tothe total population in North Lansing, Hispanics stillearn considerably less than the rest of the population.This difference needs further analysis since it cannotbe explained solely by the differential in educationalattainment or age (Chart 11).
Chart 8. Hispanic Males EmploymentStatus 16 Years and Over, 1990
In 1990, Hispanic males 16 years and older living inNorth Lansing reported a lower labor participation rate(74.10%) than Hispanic males living in the Lansing MSA(76.66%). On the other hand, the unemployment rate amongHispanic males was higher in North Lansing (13.49%) thanin the greater Lansing area (12.50%).
Hispanics in North Lansing reported lower rates of educa -tional attainment than Hispanics living in the Lansing MSAin 1990. Only 44.62% of Hispanics over 25 years old livingin North Lansing were High School graduates and 5.55%had a college degree. Hispanics over 25 years old living inthe Lansing MSA reported 64.28% high school graduatesand 10.09% college graduates.
Chart 7. Educational Attainment, Personsof Hispanic Origin 25 Years and Over, 1990
E. Poverty Status
Chart 12 shows that poverty conditions of Lati-nos in North Lansing are also severe. The povertyrate for Latinos in Lansing MSA is 23%, while therate in North Lansing is equal to 41.4%. Thus thepoverty rate among Hispanics in North Lansing isalmost 2 times larger (15.1% higher) than the rate ofthe MSA. In other words, one in two Hispanics liv-ing in North Lansing are below the poverty level,whereas one in four Latinos in Lansing are living inthose conditions.
Considering gender, Latina, or female-headedhouseholds reported high rates of poverty. Chart 12shows that Hispanic female household with no hus-band present in North Lansing have 69% of povertyrate, while in the Lansing MSA is 46%. The differ-ence of poverty rate for Latinas in North Lansing isthen, one and a half times higher than their counter-parts in the MSA.
As seen in Chart 12, no significant differencewas found among male-headed households. T h epoverty rate in North Lansing in 36.4%, while therate corresponding to the Lansing MSA is 31.6%, ad i fference of almost 4.8%. However, Hispanicfemale-headed households have a 32.5% higherpoverty rate than males. In fact, when the rates ofpoverty of Hispanic females are compared to the restof the population, their condition fares worst. Forinstance, the poverty rate among female-headedhouseholds in North Lansing is 5.3 times higher thanthe poverty rate corresponding to all persons in theLansing MSA.
The conditions are not better when data isexplored by married couple families. Almost a quar-ter of Hispanic married couple families in NorthLansing tend to be poor. Whereas Latinos in LansingMSA show that only 11.6% of the households arebelow the poverty rate line, 24.015% of the marriedcouple families in North Lansing are below thepoverty line.
F. Household Ownership
There is no difference in the ownership of resi-dences for Hispanics in both areas, as seen in Chart14. In terms of renting patterns, Hispanics againhave no significant difference between those living inNorth Lansing and Lansing MSA. Approximately55% own a home and 45% rent. However, Latinosrenting in North Lansing pay more than their coun-terparts by $30 a month (See Chart 15). Actually,Hispanics in North Lansing pay $60 more monthlyfor rent than non-Hispanics.
As shown in Chart 16 median mortgage paymentis $472 in North Lansing, while it is $624 in theLansing MSA. The median owner costs are $190 forHispanic owners in North Lansing, as compared to$256 for Latinos in the MSA. This may be a reflec-tion of the real estate cost/quality characteristics thatare similar in any other urban area (See Chart 16). Inaddition, Chart 17 shows that plumbing facilities aredifferent, since almost 1% of the Hispanic house-holds in North Lansing lacks these facilities; and onlya third of a percentage or 0.36% live in those condi-tions in the Lansing MSA (See Chart 17). Chart 18shows that 20% of the Hispanic households do notown at least one vehicle, compared to 12% of Latinosin the Lansing MSA.
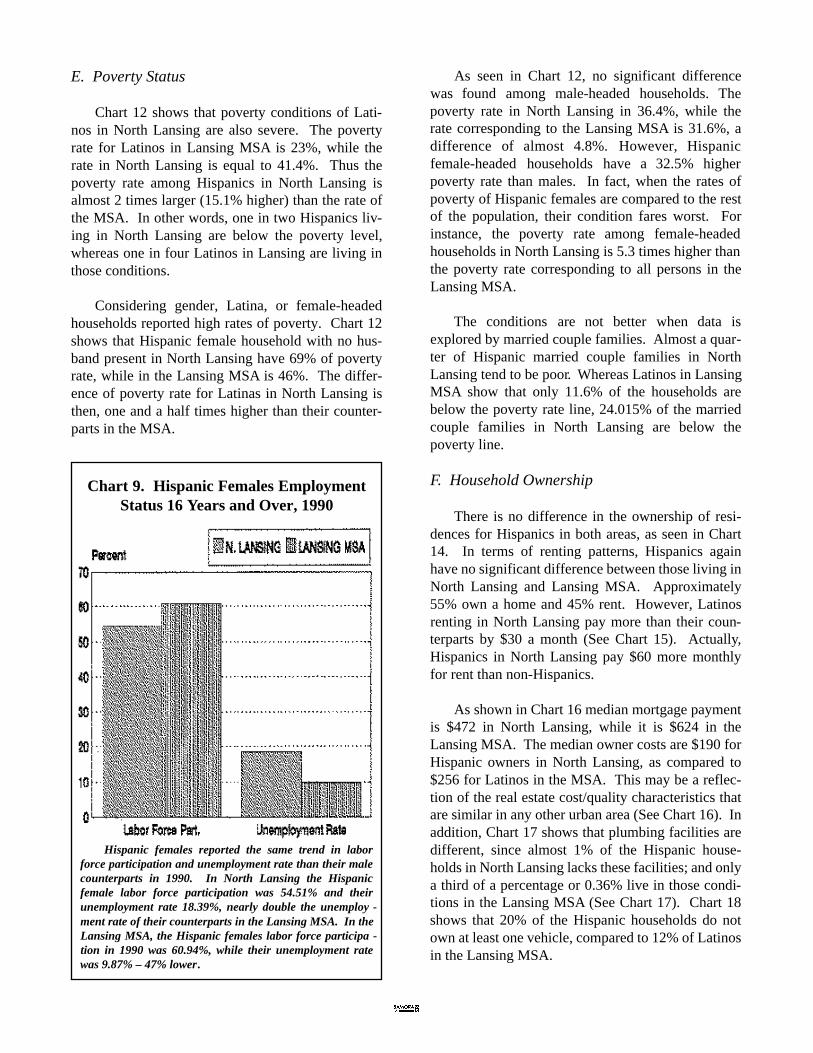
Chart 9. Hispanic Females EmploymentStatus 16 Years and Over, 1990
Hispanic females reported the same trend in laborforce participation and unemployment rate than their malecounterparts in 1990. In North Lansing the Hispanicfemale labor force participation was 54.51% and theirunemployment rate 18.39%, nearly double the unemploy -ment rate of their counterparts in the Lansing MSA. In theLansing MSA, the Hispanic females labor force participa -tion in 1990 was 60.94%, while their unemployment ratewas 9.87% – 47% lower.
Summary and Conclusions
The major findings of this paper high-light the general living conditions in NorthLansing. The stark contrasts between thearea of North Lansing and the MSA sug-gest conditions of an “inner city.” Asshown by the data for 1990, the basic sta-tistics for income, educational attainment,poverty rates, housing conditions, andother traits are signs of relatively lowerstandards of living within North Lansing,compared to the general conditions of theMSA.
Based on these findings, it is neces-sary to continue research efforts for identi-fying the processes effecting the greaterconcentration of Latinos and poor withinNorth Lansing. The research on barriounderclass formation would be a usefulplace to begin with an in-depth study (SeeMoore and Pinderhughes).
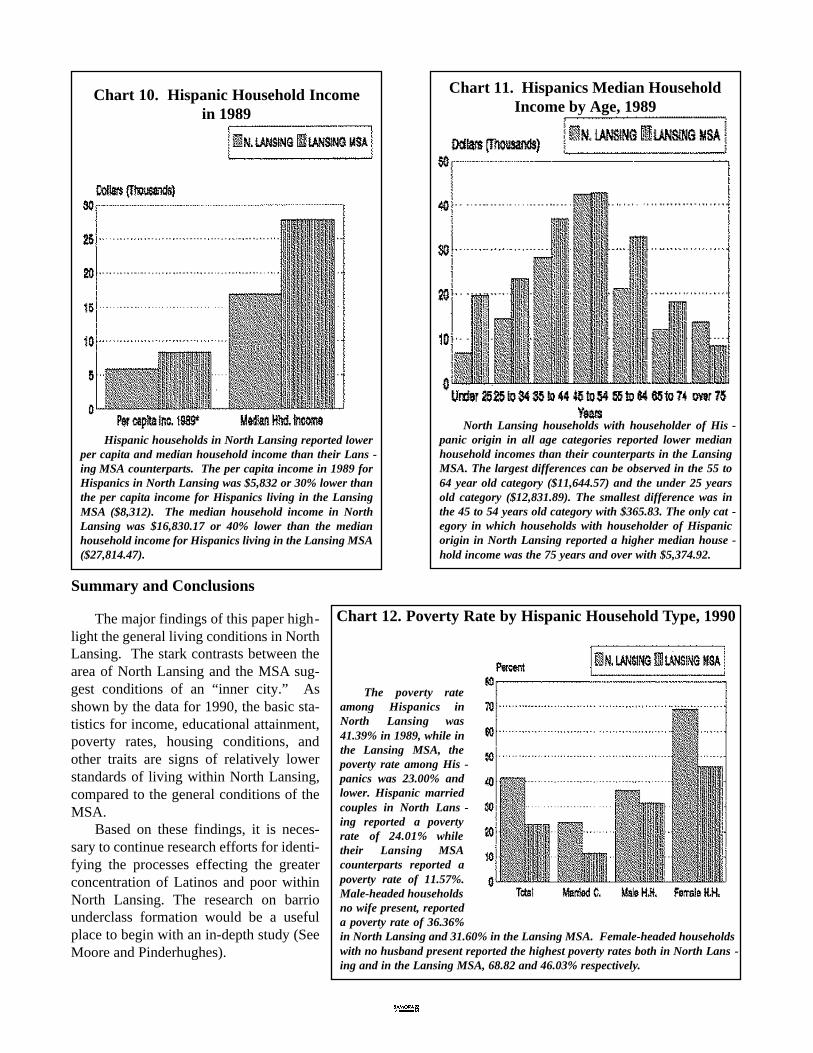
Chart 10. Hispanic Household Incomein 1989
Hispanic households in North Lansing reported lowerper capita and median household income than their Lans -ing MSA counterparts. The per capita income in 1989 forHispanics in North Lansing was $5,832 or 30% lower thanthe per capita income for Hispanics living in the LansingMSA ($8,312). The median household income in NorthLansing was $16,830.17 or 40% lower than the medianhousehold income for Hispanics living in the Lansing MSA($27,814.47).
Chart 11. Hispanics Median HouseholdIncome by Age, 1989
North Lansing households with householder of His -panic origin in all age categories reported lower medianhousehold incomes than their counterparts in the LansingMSA. The largest differences can be observed in the 55 to64 year old category ($11,644.57) and the under 25 yearsold category ($12,831.89). The smallest difference was inthe 45 to 54 years old category with $365.83. The only cat -egory in which households with householder of Hispanicorigin in North Lansing reported a higher median house -hold income was the 75 years and over with $5,374.92.
Chart 12. Poverty Rate by Hispanic Household Type, 1990
The poverty rateamong Hispanics inNorth Lansing was41.39% in 1989, while inthe Lansing MSA, thepoverty rate among His -panics was 23.00% andlower. Hispanic marriedcouples in North Lans -ing reported a povertyrate of 24.01% whiletheir Lansing MSAcounterparts reported apoverty rate of 11.57%.Male-headed householdsno wife present, reporteda poverty rate of 36.36%in North Lansing and 31.60% in the Lansing MSA. Female-headed householdswith no husband present reported the highest poverty rates both in North Lans -ing and in the Lansing MSA, 68.82 and 46.03% respectively.
A practical next step is to analyze the primarydata obtained through the survey planned and exe-cuted by the Department of Urban Affairs at MSU.This data should provide more recent informationabout the basic needs and concerns of the differentgroups living in the area. In addition, it will be inter-esting to pursue similar research efforts in other Met-ropolitan Areas (MSA) in which similar orcomparable characteristics can be found in order todesign an empirical model that can describe and eval-uate the causes that make Latino Communities “InnerCity” comparable communities.
Further efforts should be made to generategreater investments into local businesses of NorthLansing. The economic base appears to be under-developed within this “inner city.” We end this reportwith some base questions: (1) What kinds of busi -nesses can promote the development of investments,services for youth, and jobs? (2) What changes haveimproved local conditions? (3) What changes havehurt local conditions? (4) What is happening withinthe general MSA? (5) Is there a noticeable gapbetween “haves” and “have nots?”
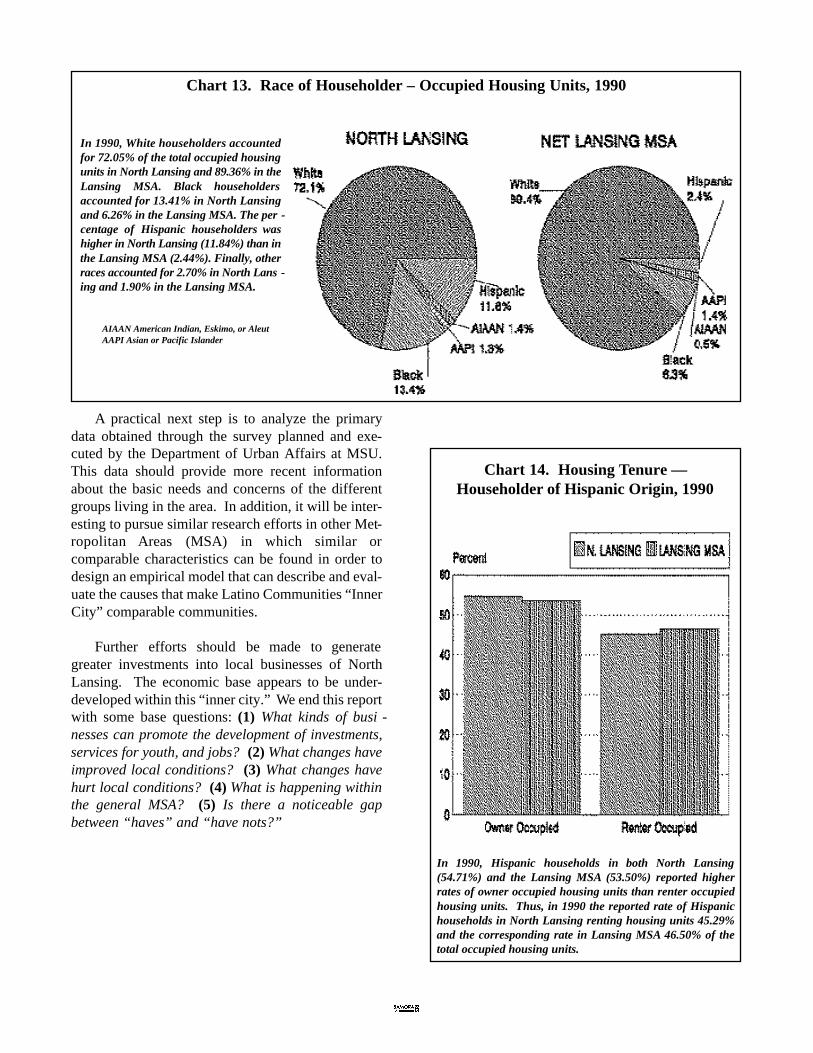
Chart 13. Race of Householder – Occupied Housing Units, 1990
In 1990, White householders accountedfor 72.05% of the total occupied housingunits in North Lansing and 89.36% in theLansing MSA. Black householdersaccounted for 13.41% in North Lansingand 6.26% in the Lansing MSA. The per -centage of Hispanic householders washigher in North Lansing (11.84%) than inthe Lansing MSA (2.44%). Finally, otherraces accounted for 2.70% in North Lans -ing and 1.90% in the Lansing MSA.
AIAAN American Indian, Eskimo, or Aleut AAPI Asian or Pacific Islander
In 1990, Hispanic households in both North Lansing(54.71%) and the Lansing MSA (53.50%) reported higherrates of owner occupied housing units than renter occupiedhousing units. Thus, in 1990 the reported rate of Hispanichouseholds in North Lansing renting housing units 45.29%and the corresponding rate in Lansing MSA 46.50% of thetotal occupied housing units.
Chart 14. Housing Tenure —Householder of Hispanic Origin, 1990
References
Gappert, Gary and Harold M. Rose. “The Social Economy of Cities.” Urban Affairs Annual Review, vol 9. BeverlyHills, Sage Publications. 1975.
Gottdiener, Mark. “Cities in Stress: A New Look at the Urban Crisis.” Urban Affairs Annual Review, vol 30. Bev-erly Hills, Sage Publications. 1986.
Moore, Joan and Raquel Pinderhughes. In the Barrios: Latinos and the Underclass Debate. New York, RussellSage Foundation. 1993
Smith, Michael Peter and Joe R. Feagin. The Capitalist City: Global Restructuring and Community Politics. NewYork, B. Blackwell. 1987.\
Stone, Clarence N. and Heywood T. Sanders. “The Politics of Urban Development.” Studies in Government andPublic Policy. Kansas, University Press of Kansas. 1987
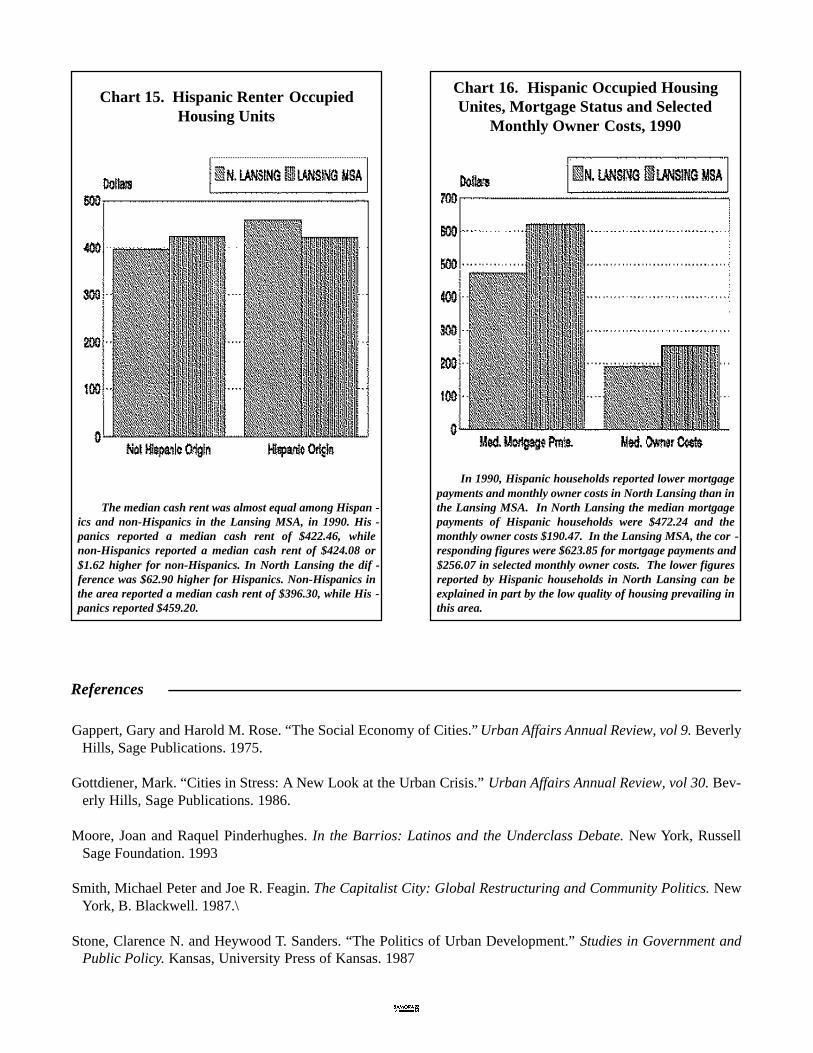
The median cash rent was almost equal among Hispan -ics and non-Hispanics in the Lansing MSA, in 1990. His -panics reported a median cash rent of $422.46, whilenon-Hispanics reported a median cash rent of $424.08 or$1.62 higher for non-Hispanics. In North Lansing the dif -ference was $62.90 higher for Hispanics. Non-Hispanics inthe area reported a median cash rent of $396.30, while His -panics reported $459.20.
Chart 15. Hispanic Renter OccupiedHousing Units
In 1990, Hispanic households reported lower mortgagepayments and monthly owner costs in North Lansing than inthe Lansing MSA. In North Lansing the median mortgagepayments of Hispanic households were $472.24 and themonthly owner costs $190.47. In the Lansing MSA, the cor -responding figures were $623.85 for mortgage payments and$256.07 in selected monthly owner costs. The lower figuresreported by Hispanic households in North Lansing can beexplained in part by the low quality of housing prevailing inthis area.
Chart 16. Hispanic Occupied HousingUnites, Mortgage Status and Selected
Monthly Owner Costs, 1990
Example of building for sale in North Lansing.
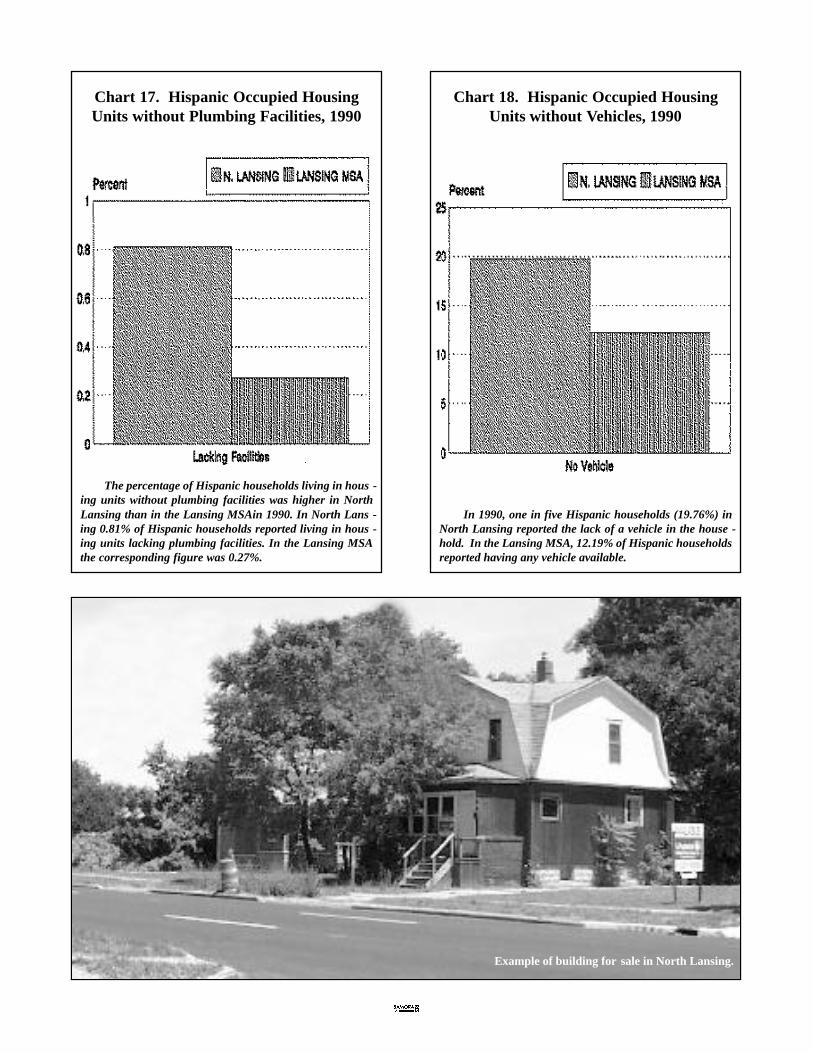
The percentage of Hispanic households living in hous -ing units without plumbing facilities was higher in NorthLansing than in the Lansing MSAin 1990. In North Lans -ing 0.81% of Hispanic households reported living in hous -ing units lacking plumbing facilities. In the Lansing MSAthe corresponding figure was 0.27%.
Chart 17. Hispanic Occupied HousingUnits without Plumbing Facilities, 1990
In 1990, one in five Hispanic households (19.76%) inNorth Lansing reported the lack of a vehicle in the house -hold. In the Lansing MSA, 12.19% of Hispanic householdsreported having any vehicle available.
Chart 18. Hispanic Occupied HousingUnits without Vehicles, 1990