northwest corridor - gnrc
TRANSCRIPT
Northwest Corridor Transit StudySUMMARY OF FINDINGS AND RECOMMENDATIONS | October 2017
Regional Transportation Authority of Middle Tennessee
For a copy of the appendices of the Northwest Corridor Transit Study report, please contact Felix Castrodad at 615-862-5626 or [email protected].
Northwest Corridor Transit Study | F I N A L R E P O R T | 10.2017
ACKNOWLEDGEMENTSThe Regional Transportation Authority (RTA) of Middle Tennessee would like to thank the following for their contributions to the development of the Northwest Corridor Transit Study:
ADVISORY COMMITTEE
Mayor Kim McMillan, City of Clarksville Mayor Rick Johnson, City of Ashland City Mayor Megan Barry, Metropolitan Nashville and Davidson County Mayor Billy Paul Carneal, City of Springfield Mayor Jim Durrett, Montgomery County Mayor David McCullough, Cheatham County Mayor Howard Bradley, Robertson County Commissioner John Schroer, Tennessee Department of Transportation Mr. Stephen Bland, Chief Executive Officer MTA/RTA Mr. Bill Drunsic, President NERR/N&W Railroad COL David Dellinger, Garrison Commander, Fort Campbell Representative Courtney Rogers, Vice Chair Transportation Committee/House District 45 Senator Jim Tracy, Chair, Transportation Committee/Senate District 16 Congressman Jim Cooper, Tennessee House District 5 Congresswoman Marsha Blackburn, Tennessee House District 7 Mayor Perry Keenan, City of Pleasant View Representative Mary Littleton, House District 78
STEERING COMMITTEE
Ms. Tanisha Hall, Director, TDOT Long Range Planning Division Ms. Liza Joffrion, Director, Division of Multimodal Transportation Resources Ms. Michelle Lacewell, Interim Director, Nashville Area Metropolitan Planning Organization Dr. David Ripple, Director, Clarksville-Montgomery County Regional Planning Commission Mr. Chris Brown, Community Planner, Fort Campbell Directorate of Public Works Michael Briggs, Senior Transportation Planner, Nashville Metropolitan Panning Department Mr. Grant Green, Planning Director, Springfield Planning and Development Department Mr. Mark Sturtevant, Director of Infrastructure, Mayor’s Office Ms. Erin Hafkenschiel, Director of Transportation & Sustainability, Mayor’s Office Ms. Mary Beth Ikard, Transportation and Sustainability Manager, Mayor’s Office Mr. Felix Castrodad, Director of Planning & Grants, MTA/RTA Ms. Billy Higgins, Capital Grants Administrator, MTA/RTA Ms. Cortnye Stone, MTA/RTA Mr. Dan Freudberg, Director of Service Quality, MTA/RTA Mr. Eric Beyer, Legislative Liaison & EasyRide Program Manager, MTA/RTA Mr. Justin Curatolo, Planning Analyst, MTA/RTA Ms. Patricia Harris-Morehead, Director of Communications & Marketing, MTA/RTA Ms. Shontrill Lowe, Transit Planner, MTA/RTA Mr. Stan Williams, Transportation Director, Clarksville Urbanized Area Metropolitan Planning Organization
RTA BOARD
Chair: Mayor Kim McMillan, City of Clarksville Vice Chair: Mayor Randall Hutto, Wilson County Secretary: Paula Mansfield, Rutherford County
Cheatham County Ashland City - Mayor Rick Johnson Cheatham County - Mayor David McCullough
Davidson County Belle Meade - Mayor James Hunt Davidson County/Metro Nashville - Mayor Megan Barry Goodlettsville - Mayor John Coombs
Dickson County Dickson City - Mayor Don Weiss, Jr. Dickson County - Mayor Bob Rial
Montgomery County Clarksville - Mayor Kim McMillan Montgomery County - Mayor Jim Durrett
Robertson County Robertson County - Mayor Howard R.a Bradley Springfield - Mayor Billy Paul Carneal
Rutherford County La Vergne - Mayor Dennis R. Waldron Murfreesboro - Mayor Shane McFarland Rutherford County - Mayor Ernest Burgess Smyrna - Mayor Mary Esther Reed
Sumner County Gallatin - Mayor Paige Brown Hendersonville - Mayor Jamie Clary Portland - Mayor Ken Wilber Sumner County - County Executive Anthony Holt Westmoreland - Mayor Jerry Kirkman White House - Mayor Michael Arnold
Williamson County Brentwood - Mayor Regina Smithson Franklin - Mayor Ken Moore Spring Hill - Mayor Rick Graham Williamson County - Mayor Rogers Anderson
Wilson County Lebanon - Mayor Bernie Ash Mt. Juliet - Mayor Ed Hagerty Wilson County - Mayor Randall Hutto
TENNESSEE DEPARTMENT OF TRANSPORTATION
Commissioner John Schroer
GOVERNOR’S APPOINTEES
Cheatham County - Daryl Phillips Davidson County - Ed Cole Dickson County - Scott England Montgomery County - Mike Evans Rutherford County - Paula Mansfield Sumner County - Lee Zoller Williamson County - Kelly Dannenfelser Wilson County - Ken Davis
NORTHWEST CORRIDOR TRANSIT STUDY CONSULTANT TEAM
in association with
CSR Engineering
Volkert Engineering
Lose & Associates
Varrallo Public Relations
© 2017 Northwest Corridor Transit Study. All rights reserved.
i
Regional Transportation Authority of Middle Tennessee
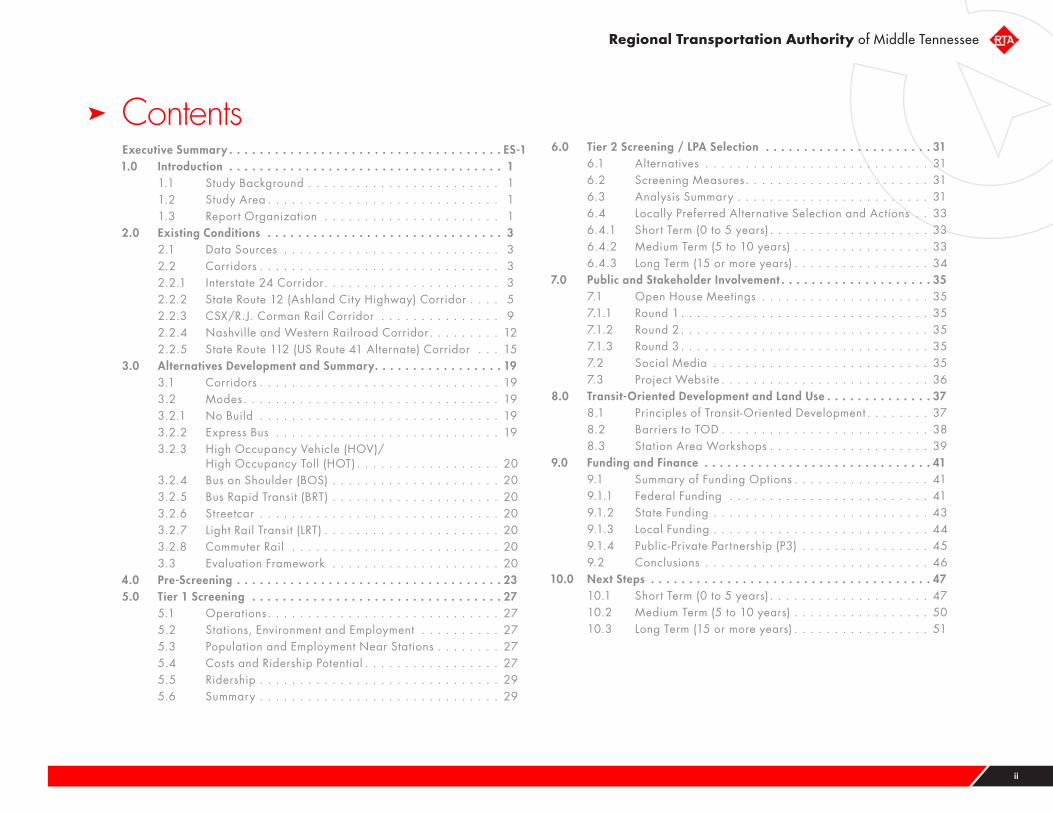
ContentsExecutive Summary . . . . . . . . . . . . . . . . . . . . . . . . . . . . . . . . . . . . ES-11 .0 Introduction . . . . . . . . . . . . . . . . . . . . . . . . . . . . . . . . . . . . 1 1.1 Study Background . . . . . . . . . . . . . . . . . . . . . . . . 1 1.2 Study Area . . . . . . . . . . . . . . . . . . . . . . . . . . . . . 1 1.3 Report Organization . . . . . . . . . . . . . . . . . . . . . . 12 .0 Existing Conditions . . . . . . . . . . . . . . . . . . . . . . . . . . . . . . . 3 2.1 Data Sources . . . . . . . . . . . . . . . . . . . . . . . . . . . 3 2.2 Corridors . . . . . . . . . . . . . . . . . . . . . . . . . . . . . . 3 2.2.1 Interstate 24 Corridor . . . . . . . . . . . . . . . . . . . . . . 3 2.2.2 State Route 12 (Ashland City Highway) Corridor . . . . 5 2.2.3 CSX/R.J. Corman Rail Corridor . . . . . . . . . . . . . . . 9 2.2.4 Nashville and Western Railroad Corridor . . . . . . . . . 12 2.2.5 State Route 112 (US Route 41 Alternate) Corridor . . . 153 .0 Alternatives Development and Summary . . . . . . . . . . . . . . . . . 19 3.1 Corridors . . . . . . . . . . . . . . . . . . . . . . . . . . . . . . 19 3.2 Modes . . . . . . . . . . . . . . . . . . . . . . . . . . . . . . . . 19 3.2.1 No Build . . . . . . . . . . . . . . . . . . . . . . . . . . . . . . 19 3.2.2 Express Bus . . . . . . . . . . . . . . . . . . . . . . . . . . . . 19 3.2.3 High Occupancy Vehicle (HOV)/ High Occupancy Toll (HOT) . . . . . . . . . . . . . . . . . . 20 3.2.4 Bus on Shoulder (BOS) . . . . . . . . . . . . . . . . . . . . . 20 3.2.5 Bus Rapid Transit (BRT) . . . . . . . . . . . . . . . . . . . . . 20 3.2.6 Streetcar . . . . . . . . . . . . . . . . . . . . . . . . . . . . . . 20 3.2.7 Light Rail Transit (LRT) . . . . . . . . . . . . . . . . . . . . . . 20 3.2.8 Commuter Rail . . . . . . . . . . . . . . . . . . . . . . . . . . 20 3.3 Evaluation Framework . . . . . . . . . . . . . . . . . . . . . 204 .0 Pre-Screening . . . . . . . . . . . . . . . . . . . . . . . . . . . . . . . . . . . 235 .0 Tier 1 Screening . . . . . . . . . . . . . . . . . . . . . . . . . . . . . . . . . 27 5.1 Operations . . . . . . . . . . . . . . . . . . . . . . . . . . . . . 27 5.2 Stations, Environment and Employment . . . . . . . . . . 27 5.3 Population and Employment Near Stations . . . . . . . . 27 5.4 Costs and Ridership Potential . . . . . . . . . . . . . . . . . 27 5.5 Ridership . . . . . . . . . . . . . . . . . . . . . . . . . . . . . . 29 5.6 Summary . . . . . . . . . . . . . . . . . . . . . . . . . . . . . . 29
6 .0 Tier 2 Screening / LPA Selection . . . . . . . . . . . . . . . . . . . . . . 31 6.1 Alternatives . . . . . . . . . . . . . . . . . . . . . . . . . . . . 31 6.2 Screening Measures . . . . . . . . . . . . . . . . . . . . . . . 31 6.3 Analysis Summary . . . . . . . . . . . . . . . . . . . . . . . . 31 6.4 Locally Preferred Alternative Selection and Actions . . 33 6.4.1 Short Term (0 to 5 years) . . . . . . . . . . . . . . . . . . . . 33 6.4.2 Medium Term (5 to 10 years) . . . . . . . . . . . . . . . . . 33 6.4.3 Long Term (15 or more years) . . . . . . . . . . . . . . . . . 347 .0 Public and Stakeholder Involvement . . . . . . . . . . . . . . . . . . . . 35 7.1 Open House Meetings . . . . . . . . . . . . . . . . . . . . . 35 7.1.1 Round 1 . . . . . . . . . . . . . . . . . . . . . . . . . . . . . . . 35 7.1.2 Round 2 . . . . . . . . . . . . . . . . . . . . . . . . . . . . . . . 35 7.1.3 Round 3 . . . . . . . . . . . . . . . . . . . . . . . . . . . . . . . 35 7.2 Social Media . . . . . . . . . . . . . . . . . . . . . . . . . . . 35 7.3 Project Website . . . . . . . . . . . . . . . . . . . . . . . . . . 368 .0 Transit-Oriented Development and Land Use . . . . . . . . . . . . . . 37 8.1 Principles of Transit -Oriented Development . . . . . . . . 37 8.2 Barriers to TOD . . . . . . . . . . . . . . . . . . . . . . . . . . 38 8.3 Station Area Workshops . . . . . . . . . . . . . . . . . . . . 399 .0 Funding and Finance . . . . . . . . . . . . . . . . . . . . . . . . . . . . . . 41 9.1 Summary of Funding Options . . . . . . . . . . . . . . . . . 41 9.1.1 Federal Funding . . . . . . . . . . . . . . . . . . . . . . . . . 41 9.1.2 State Funding . . . . . . . . . . . . . . . . . . . . . . . . . . . 43 9.1.3 Local Funding . . . . . . . . . . . . . . . . . . . . . . . . . . . 44 9.1.4 Public-Private Partnership (P3) . . . . . . . . . . . . . . . . 45 9.2 Conclusions . . . . . . . . . . . . . . . . . . . . . . . . . . . . 4610 .0 Next Steps . . . . . . . . . . . . . . . . . . . . . . . . . . . . . . . . . . . . . 47 10.1 Short Term (0 to 5 years) . . . . . . . . . . . . . . . . . . . . 47 10.2 Medium Term (5 to 10 years) . . . . . . . . . . . . . . . . . 50 10.3 Long Term (15 or more years) . . . . . . . . . . . . . . . . . 51
ii
Northwest Corridor Transit Study | F I N A L R E P O R T | 10.2017
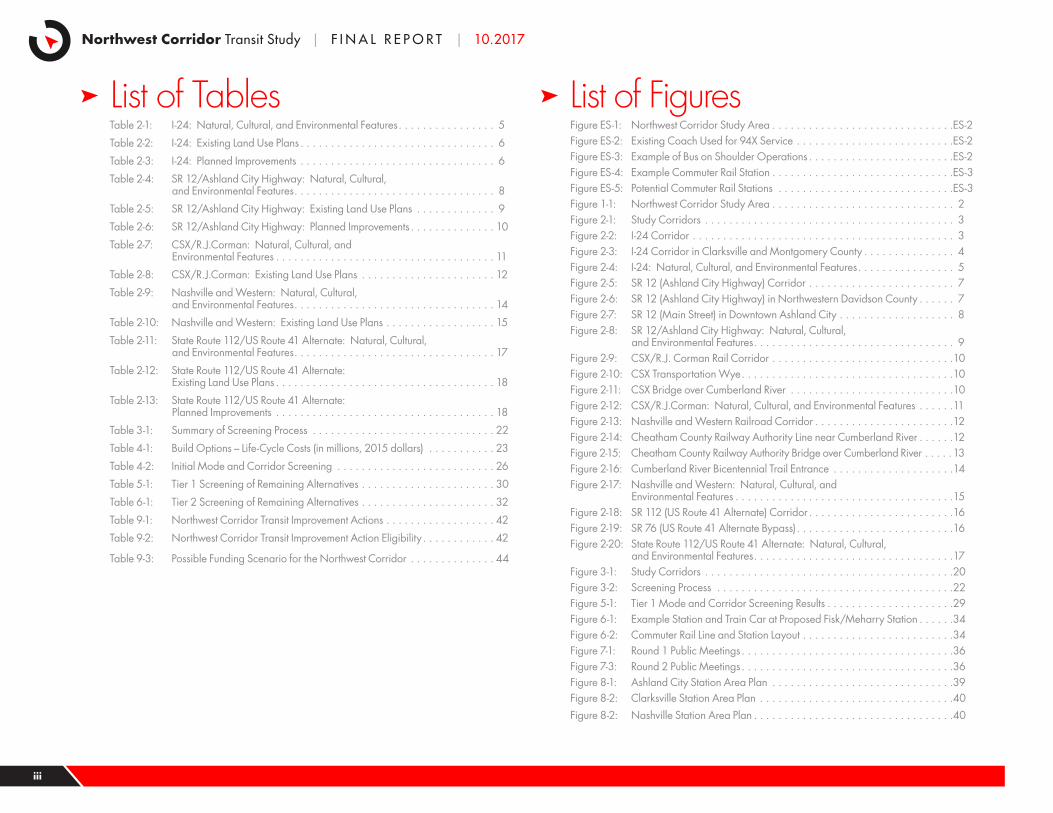
List of TablesTable 2-1: I-24: Natural, Cultural, and Environmental Features . . . . . . . . . . . . . . . . 5
Table 2-2: I-24: Existing Land Use Plans . . . . . . . . . . . . . . . . . . . . . . . . . . . . . . . . 6
Table 2-3: I-24: Planned Improvements . . . . . . . . . . . . . . . . . . . . . . . . . . . . . . . . 6
Table 2-4: SR 12/Ashland City Highway: Natural, Cultural, and Environmental Features . . . . . . . . . . . . . . . . . . . . . . . . . . . . . . . . . 8
Table 2-5: SR 12/Ashland City Highway: Existing Land Use Plans . . . . . . . . . . . . . 9
Table 2-6: SR 12/Ashland City Highway: Planned Improvements . . . . . . . . . . . . . . 10
Table 2-7: CSX/R.J.Corman: Natural, Cultural, and Environmental Features . . . . . . . . . . . . . . . . . . . . . . . . . . . . . . . . . . . . 11
Table 2-8: CSX/R.J.Corman: Existing Land Use Plans . . . . . . . . . . . . . . . . . . . . . . 12
Table 2-9: Nashville and Western: Natural, Cultural, and Environmental Features . . . . . . . . . . . . . . . . . . . . . . . . . . . . . . . . . 14
Table 2-10: Nashville and Western: Existing Land Use Plans . . . . . . . . . . . . . . . . . . 15
Table 2-11: State Route 112/US Route 41 Alternate: Natural, Cultural, and Environmental Features . . . . . . . . . . . . . . . . . . . . . . . . . . . . . . . . . 17
Table 2-12: State Route 112/US Route 41 Alternate: Existing Land Use Plans . . . . . . . . . . . . . . . . . . . . . . . . . . . . . . . . . . . . 18
Table 2-13: State Route 112/US Route 41 Alternate: Planned Improvements . . . . . . . . . . . . . . . . . . . . . . . . . . . . . . . . . . . . 18
Table 3-1: Summary of Screening Process . . . . . . . . . . . . . . . . . . . . . . . . . . . . . . 22
Table 4-1: Build Options – Life-Cycle Costs (in millions, 2015 dollars) . . . . . . . . . . . 23
Table 4-2: Initial Mode and Corridor Screening . . . . . . . . . . . . . . . . . . . . . . . . . . 26
Table 5-1: Tier 1 Screening of Remaining Alternatives . . . . . . . . . . . . . . . . . . . . . . 30
Table 6-1: Tier 2 Screening of Remaining Alternatives . . . . . . . . . . . . . . . . . . . . . . 32
Table 9-1: Northwest Corridor Transit Improvement Actions . . . . . . . . . . . . . . . . . . 42
Table 9-2: Northwest Corridor Transit Improvement Action Eligibility . . . . . . . . . . . . 42
Table 9-3: Possible Funding Scenario for the Northwest Corridor . . . . . . . . . . . . . . 44
List of FiguresFigure ES-1: Northwest Corridor Study Area . . . . . . . . . . . . . . . . . . . . . . . . . . . . . .ES-2Figure ES-2: Existing Coach Used for 94X Service . . . . . . . . . . . . . . . . . . . . . . . . . .ES-2Figure ES-3: Example of Bus on Shoulder Operations . . . . . . . . . . . . . . . . . . . . . . . .ES-2Figure ES-4: Example Commuter Rail Station . . . . . . . . . . . . . . . . . . . . . . . . . . . . . .ES-3Figure ES-5: Potential Commuter Rail Stations . . . . . . . . . . . . . . . . . . . . . . . . . . . . .ES-3Figure 1-1: Northwest Corridor Study Area . . . . . . . . . . . . . . . . . . . . . . . . . . . . . . 2Figure 2-1: Study Corridors . . . . . . . . . . . . . . . . . . . . . . . . . . . . . . . . . . . . . . . . . 3Figure 2-2: I-24 Corridor . . . . . . . . . . . . . . . . . . . . . . . . . . . . . . . . . . . . . . . . . . . 3Figure 2-3: I-24 Corridor in Clarksville and Montgomery County . . . . . . . . . . . . . . . 4Figure 2-4: I-24: Natural, Cultural, and Environmental Features . . . . . . . . . . . . . . . . 5Figure 2-5: SR 12 (Ashland City Highway) Corridor . . . . . . . . . . . . . . . . . . . . . . . . 7Figure 2-6: SR 12 (Ashland City Highway) in Northwestern Davidson County . . . . . . 7Figure 2-7: SR 12 (Main Street) in Downtown Ashland City . . . . . . . . . . . . . . . . . . . 8Figure 2-8: SR 12/Ashland City Highway: Natural, Cultural,
and Environmental Features . . . . . . . . . . . . . . . . . . . . . . . . . . . . . . . . . 9Figure 2-9: CSX/R.J. Corman Rail Corridor . . . . . . . . . . . . . . . . . . . . . . . . . . . . . .10Figure 2-10: CSX Transportation Wye . . . . . . . . . . . . . . . . . . . . . . . . . . . . . . . . . . .10Figure 2-11: CSX Bridge over Cumberland River . . . . . . . . . . . . . . . . . . . . . . . . . . .10Figure 2-12: CSX/R.J.Corman: Natural, Cultural, and Environmental Features . . . . . .11Figure 2-13: Nashville and Western Railroad Corridor . . . . . . . . . . . . . . . . . . . . . . .12Figure 2-14: Cheatham County Railway Authority Line near Cumberland River . . . . . .12Figure 2-15: Cheatham County Railway Authority Bridge over Cumberland River . . . . .13Figure 2-16: Cumberland River Bicentennial Trail Entrance . . . . . . . . . . . . . . . . . . . .14Figure 2-17: Nashville and Western: Natural, Cultural, and
Environmental Features . . . . . . . . . . . . . . . . . . . . . . . . . . . . . . . . . . . .15Figure 2-18: SR 112 (US Route 41 Alternate) Corridor . . . . . . . . . . . . . . . . . . . . . . . .16Figure 2-19: SR 76 (US Route 41 Alternate Bypass) . . . . . . . . . . . . . . . . . . . . . . . . . .16Figure 2-20: State Route 112/US Route 41 Alternate: Natural, Cultural,
and Environmental Features . . . . . . . . . . . . . . . . . . . . . . . . . . . . . . . . .17Figure 3-1: Study Corridors . . . . . . . . . . . . . . . . . . . . . . . . . . . . . . . . . . . . . . . . .20Figure 3-2: Screening Process . . . . . . . . . . . . . . . . . . . . . . . . . . . . . . . . . . . . . . .22Figure 5-1: Tier 1 Mode and Corridor Screening Results . . . . . . . . . . . . . . . . . . . . .29Figure 6-1: Example Station and Train Car at Proposed Fisk/Meharry Station . . . . . .34Figure 6-2: Commuter Rail Line and Station Layout . . . . . . . . . . . . . . . . . . . . . . . . .34Figure 7-1: Round 1 Public Meetings . . . . . . . . . . . . . . . . . . . . . . . . . . . . . . . . . . .36Figure 7-3: Round 2 Public Meetings . . . . . . . . . . . . . . . . . . . . . . . . . . . . . . . . . . .36Figure 8-1: Ashland City Station Area Plan . . . . . . . . . . . . . . . . . . . . . . . . . . . . . .39Figure 8-2: Clarksville Station Area Plan . . . . . . . . . . . . . . . . . . . . . . . . . . . . . . . .40Figure 8-2: Nashville Station Area Plan . . . . . . . . . . . . . . . . . . . . . . . . . . . . . . . . .40
iii
Regional Transportation Authority of Middle Tennessee
AppendicesAppendix A: Existing ConditionsAppendix B: Other Related StudiesAppendix C: Public and Stakeholder InvolvementAppendix D: Travel Demand Forecast Methodology and ResultsAppendix E: TOD Summaries and Station Area PlansAppendix F: Capital and Operations and Maintenance (O&M) Cost Backup InformationAppendix G: Funding and Finance Backup MaterialsAppendix H: Track and Station Area Plan Sheets and Right-of-Way InformationAppendix I: MapsAppendix J: Infographic
AcronymsAA . . . . . . . . . Alternatives AnalysisAPSU . . . . . . . . Austin Peay State UniversityBOS . . . . . . . . Bus On ShoulderBRT . . . . . . . . . Bus Rapid TransitCCRA . . . . . . . Cheatham County Railway AuthorityCE . . . . . . . . . . Categorical ExclusionsCIG . . . . . . . . . Capital Investment GrantCMAQ. . . . . . . Congestion Mitigation Air QualityCTS . . . . . . . . . Clarksville Transit SystemDBOM . . . . . . . Design-Build-Operate-MaintainDMU . . . . . . . . Diesel Multiple UnitEA. . . . . . . . . . Environmental AssessmentEIS . . . . . . . . . Environmental Impact StatementEMU . . . . . . . . Electric multiple unitFAST Act . . . . . Fixing America’s Surface Transportation ActFRA . . . . . . . . . Federal Railroad AdministrationFTA . . . . . . . . . Federal Transit AdministrationGIS . . . . . . . . . Geographical Information SystemsHOT . . . . . . . . High-Occupancy TollHOV . . . . . . . . High-Occupancy VehicleHSIP . . . . . . . . Highway Safety Improvement Program
LPA . . . . . . . . . Locally Preferred AlternativeLPRF . . . . . . . . Local Parks and Recreation FundsLRT . . . . . . . . . Light Rail TransitMOU . . . . . . . . Memorandum of UnderstandingMPO . . . . . . . . Metropolitan Planning OrganizationMTA . . . . . . . . Metropolitan Transit AuthorityNEPA . . . . . . . . National Environmental Policy ActNHS . . . . . . . . National Highway SystemNRHP . . . . . . . National Register of Historic PlacesNWCTS . . . . . . Northwest Corridor Transit StudyNWR . . . . . . . . Nashville and Western RailO&M . . . . . . . . Operations and MaintenanceROD . . . . . . . . Record of DecisionROW . . . . . . . . Right-of-WaySTBG . . . . . . . . Surface Transportation Block GrantTA . . . . . . . . . . Transportation AlternativeTDOT . . . . . . . . Tennessee Department of TransportationTIF . . . . . . . . . . Tax Increment FinancingTOD . . . . . . . . Transit-Oriented DevelopmentTRD . . . . . . . . . Transit ready developmentTSP . . . . . . . . . Transit Signal PriorityUSACE . . . . . . United States Army Corps of EngineersUSDOT . . . . . . US Department of Transportation
iv
Northwest Corridor Transit Study | F I N A L R E P O R T | 10.2017
Executive SummaryThe Northwest Corridor Transit Study (NWCTS) was undertaken to examine the need for higher-capacity, higher-speed transit services in Middle Tennessee, specifically on various routes or corridors from Nashville to Clarksville, Tennessee. The routes included a mixture of new and/or existing rights-of-way including the use/reuse of highway and railway infrastructure. The Regional Transportation Authority (RTA) of Middle Tennessee commissioned the study in late 2014 to explore alternatives for improving transit service between Nashville and Clarksville. The study is being undertaken in accordance with processes established by the Federal Transit Administration (FTA). While there is no longer a requirement to complete an Alternatives Analysis (AA) study, following the previously outlined AA process is generally advisable since it yields products, analysis, and information that may be used in further project development.
The study area consists of five corridors with potential accommodations for improved transit service between Nashville and Clarksville:
• The existing Interstate 24 (I-24) highway corridor, linking downtown Nashville and northeastern Clarksville with regional and national connections via the National Highway System
• The existing State Route (SR) 12 (Ashland City Highway) highway corridor, connecting downtown Nashville and downtown Clarksville via Ashland City
• The existing CSX Transportation and R .J . Corman Railroad Group freight railway corridors, connecting downtown Nashville and downtown Clarksville via Goodlettsville, Ridgetop, Springfield, Adams, and Guthrie, Kentucky
• The former Nashville and Western Rail (NWR) corridor, currently operated in part by the Cheatham County Railway Authority (CCRA) between Nashville and Ashland City with former right-of-way (ROW) and partially remaining infrastructure between Clarksville and Ashland City
• The existing SR 112 (US Route 41 Alternate) highway corridor, running roughly parallel to and southwest of Interstate 24 and linking downtown Nashville and downtown Clarksville via
Pleasant View with regional and national connections via the National Highway System
The RTA provides regional transit services throughout metropolitan Nashville and Middle Tennessee. The system includes nine scheduled bus routes to major suburbs and cities in Middle Tennessee, as well as the Music City STAR regional commuter rail system. Additionally, the RTA organizes various vanpools and carpools for the region.
The RTA Route 94X (Clarksville Express) provides express coach service between Nashville and Clarksville, with partial service to Pleasant View. The route, operated by Gray Line of Tennessee, provides ten trips per weekday, including reverse commute trips, excluding weekends and holidays.
Locally Preferred Alternative (LPA) Over the course of a year and a half, the study examined a variety of mode and corridor options. Based on an integrated stakeholder and public involvement process, the study concluded that the RTA should make transit capital and operations investments within the corridor in three phases.
Short Term (0 to 5 years)Continue to improve the existing 94X Express Bus service with over-the-road coaches (Figure ES-2) in the corridor. The service could be expanded to add more hours and trips, as ridership grows. Improvements to the park-and-ride lots and promotion of the guaranteed ride home program would be needed to expand the service beyond its base of mostly state riders. This would be an investment of an additional $2 million to $4 million in capital costs for additional buses and expanded amenities at the park-and-ride lots (additional shelters with benches, improved lighting, emergency call boxes, close circuit TV monitoring) and improved marketing of the service. This will also increase the operations and maintenance (O&M) costs by an additional $0.5 million. This could increase the daily ridership to approximately 300, an approximate 10 percent increase over existing ridership. Additionally, the short term should also include the transit service improvements identified by nMOTION2016 for the North Nashville area.
EXECUTIVE SUMMARY N E X T S E C T I O N
Executive Summary
Introduction / Purpose of Study
Existing Corridor / Study Area Conditions
Alternatives Development & Summary
Pre-Screening
Tier 1 Screening
Tier 2 Screening / LPA Selection
Public and Stakeholder Involvement
TOD / Land Use
Funding / Finance
Next Steps
ES-1
Regional Transportation Authority of Middle Tennessee
In the meantime, the RTA can work with local, regional, and state partners to acquire and/or preserve the rail ROW owned by the CCRA, begin the necessary environmental clearance for the project, and otherwise begin to advance the various stages of project development.
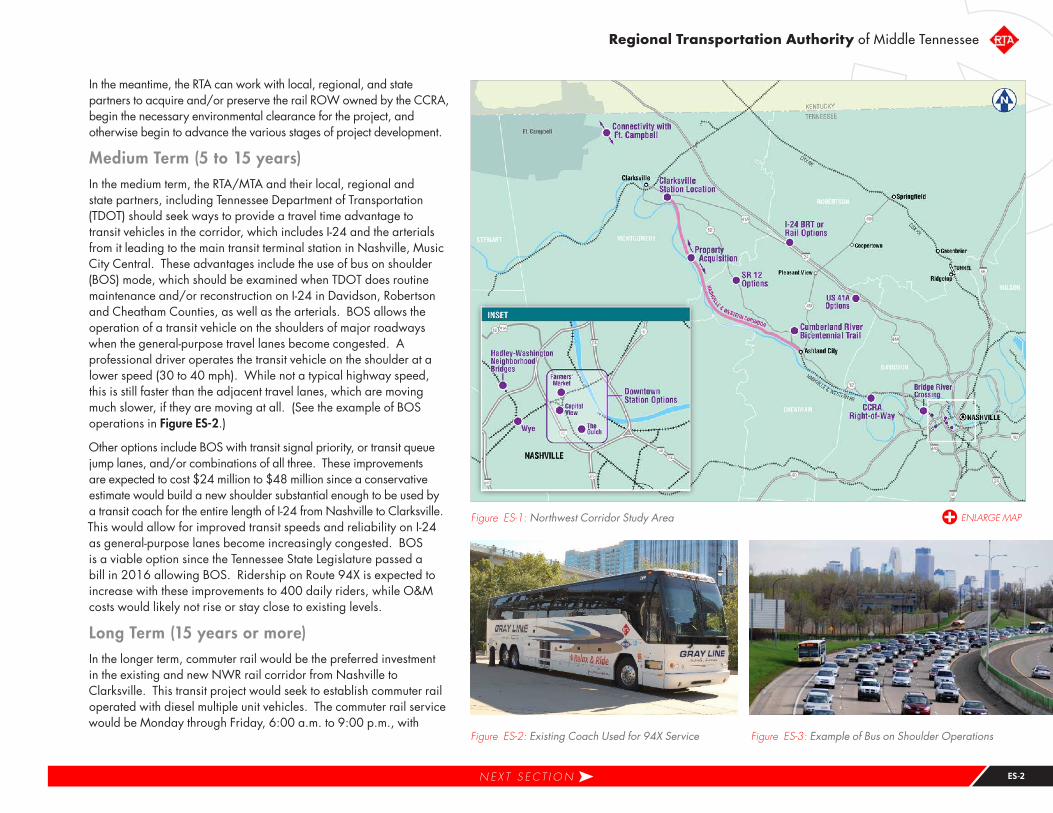
Medium Term (5 to 15 years)In the medium term, the RTA/MTA and their local, regional and state partners, including Tennessee Department of Transportation (TDOT) should seek ways to provide a travel time advantage to transit vehicles in the corridor, which includes I-24 and the arterials from it leading to the main transit terminal station in Nashville, Music City Central. These advantages include the use of bus on shoulder (BOS) mode, which should be examined when TDOT does routine maintenance and/or reconstruction on I-24 in Davidson, Robertson and Cheatham Counties, as well as the arterials. BOS allows the operation of a transit vehicle on the shoulders of major roadways when the general-purpose travel lanes become congested. A professional driver operates the transit vehicle on the shoulder at a lower speed (30 to 40 mph). While not a typical highway speed, this is still faster than the adjacent travel lanes, which are moving much slower, if they are moving at all. (See the example of BOS operations in Figure ES-2.)
Other options include BOS with transit signal priority, or transit queue jump lanes, and/or combinations of all three. These improvements are expected to cost $24 million to $48 million since a conservative estimate would build a new shoulder substantial enough to be used by a transit coach for the entire length of I-24 from Nashville to Clarksville. This would allow for improved transit speeds and reliability on I-24 as general-purpose lanes become increasingly congested. BOS is a viable option since the Tennessee State Legislature passed a bill in 2016 allowing BOS. Ridership on Route 94X is expected to increase with these improvements to 400 daily riders, while O&M costs would likely not rise or stay close to existing levels.
Long Term (15 years or more)In the longer term, commuter rail would be the preferred investment in the existing and new NWR rail corridor from Nashville to Clarksville. This transit project would seek to establish commuter rail operated with diesel multiple unit vehicles. The commuter rail service would be Monday through Friday, 6:00 a.m. to 9:00 p.m., with
Figure ES-1: Northwest Corridor Study Area
Figure ES-2: Existing Coach Used for 94X Service Figure ES-3: Example of Bus on Shoulder Operations
N E X T S E C T I O N ES-2
Northwest Corridor Transit Study | F I N A L R E P O R T | 10.2017
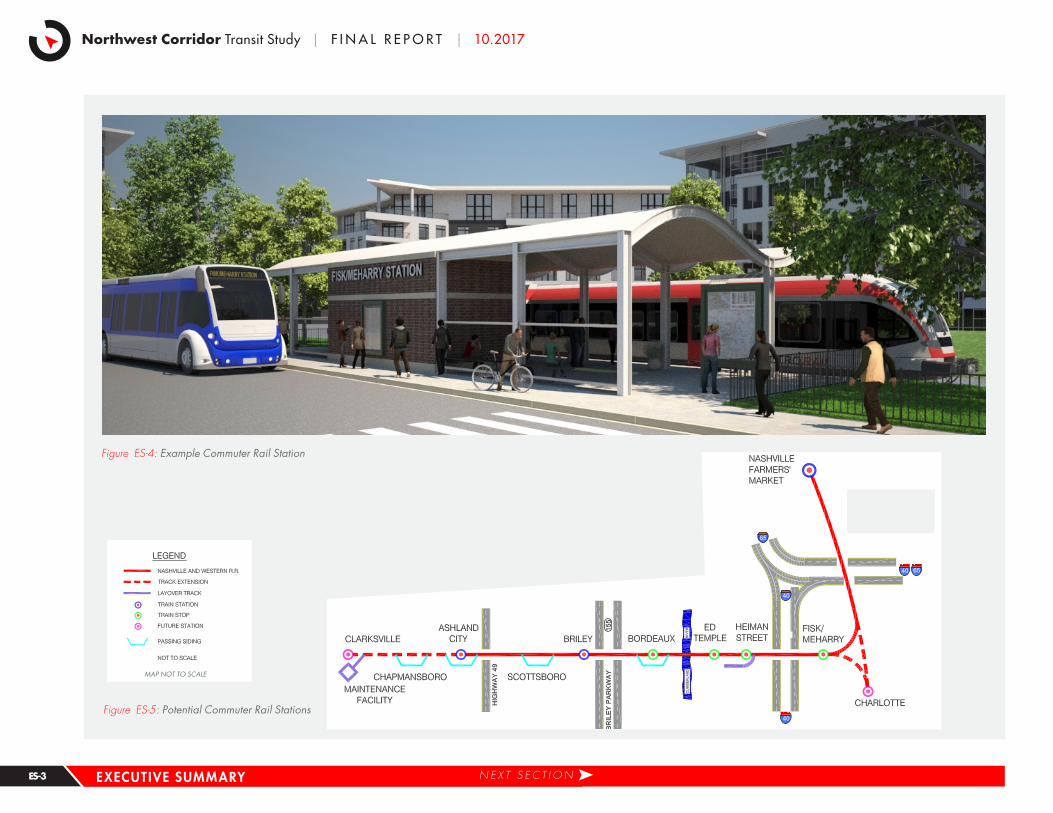
Figure ES-4: Example Commuter Rail Station
Figure ES-5: Potential Commuter Rail Stations
EXECUTIVE SUMMARY N E X T S E C T I O N
MAP NOT TO SCALE
ES-3
Regional Transportation Authority of Middle Tennessee
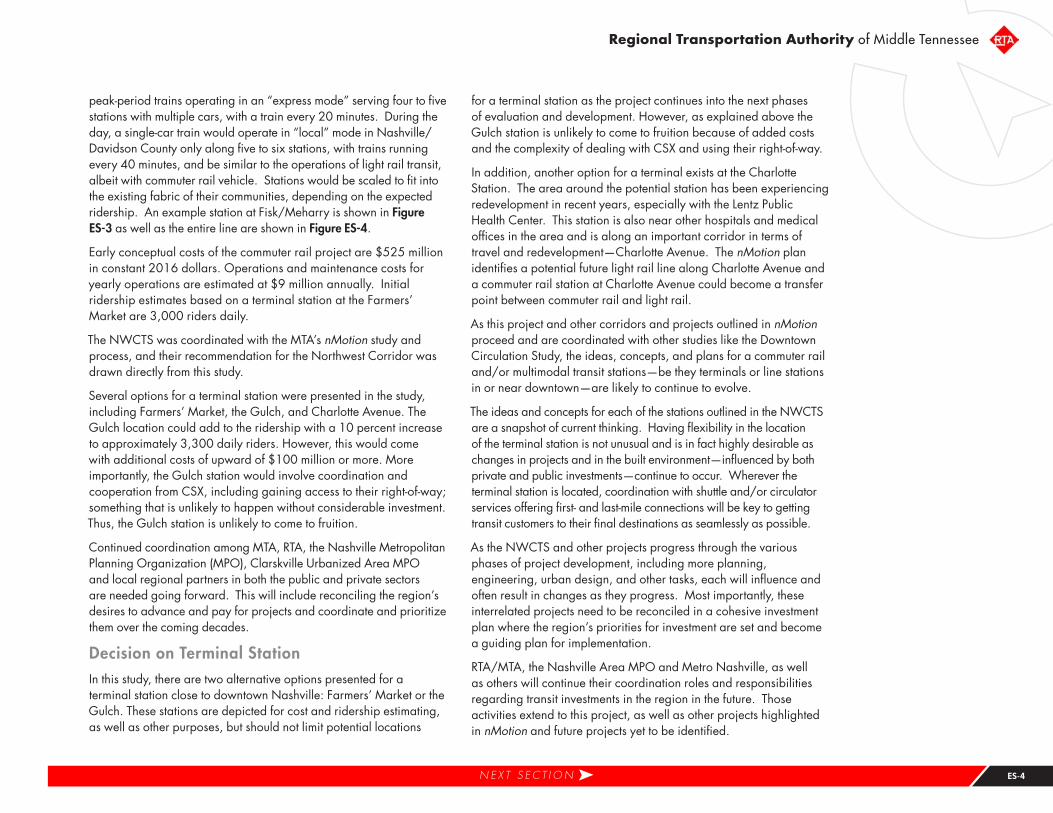
peak-period trains operating in an “express mode” serving four to five stations with multiple cars, with a train every 20 minutes. During the day, a single-car train would operate in “local” mode in Nashville/Davidson County only along five to six stations, with trains running every 40 minutes, and be similar to the operations of light rail transit, albeit with commuter rail vehicle. Stations would be scaled to fit into the existing fabric of their communities, depending on the expected ridership. An example station at Fisk/Meharry is shown in Figure ES-3 as well as the entire line are shown in Figure ES-4.
Early conceptual costs of the commuter rail project are $525 million in constant 2016 dollars. Operations and maintenance costs for yearly operations are estimated at $9 million annually. Initial ridership estimates based on a terminal station at the Farmers’ Market are 3,000 riders daily.
The NWCTS was coordinated with the MTA’s nMotion study and process, and their recommendation for the Northwest Corridor was drawn directly from this study.
Several options for a terminal station were presented in the study, including Farmers’ Market, the Gulch, and Charlotte Avenue. The Gulch location could add to the ridership with a 10 percent increase to approximately 3,300 daily riders. However, this would come with additional costs of upward of $100 million or more. More importantly, the Gulch station would involve coordination and cooperation from CSX, including gaining access to their right-of-way; something that is unlikely to happen without considerable investment. Thus, the Gulch station is unlikely to come to fruition.
Continued coordination among MTA, RTA, the Nashville Metropolitan Planning Organization (MPO), Clarskville Urbanized Area MPO and local regional partners in both the public and private sectors are needed going forward. This will include reconciling the region’s desires to advance and pay for projects and coordinate and prioritize them over the coming decades.
Decision on Terminal StationIn this study, there are two alternative options presented for a terminal station close to downtown Nashville: Farmers’ Market or the Gulch. These stations are depicted for cost and ridership estimating, as well as other purposes, but should not limit potential locations
for a terminal station as the project continues into the next phases of evaluation and development. However, as explained above the Gulch station is unlikely to come to fruition because of added costs and the complexity of dealing with CSX and using their right-of-way.
In addition, another option for a terminal exists at the Charlotte Station. The area around the potential station has been experiencing redevelopment in recent years, especially with the Lentz Public Health Center. This station is also near other hospitals and medical offices in the area and is along an important corridor in terms of travel and redevelopment—Charlotte Avenue. The nMotion plan identifies a potential future light rail line along Charlotte Avenue and a commuter rail station at Charlotte Avenue could become a transfer point between commuter rail and light rail.
As this project and other corridors and projects outlined in nMotion proceed and are coordinated with other studies like the Downtown Circulation Study, the ideas, concepts, and plans for a commuter rail and/or multimodal transit stations—be they terminals or line stations in or near downtown—are likely to continue to evolve.
The ideas and concepts for each of the stations outlined in the NWCTS are a snapshot of current thinking. Having flexibility in the location of the terminal station is not unusual and is in fact highly desirable as changes in projects and in the built environment—influenced by both private and public investments—continue to occur. Wherever the terminal station is located, coordination with shuttle and/or circulator services offering first- and last-mile connections will be key to getting transit customers to their final destinations as seamlessly as possible.
As the NWCTS and other projects progress through the various phases of project development, including more planning, engineering, urban design, and other tasks, each will influence and often result in changes as they progress. Most importantly, these interrelated projects need to be reconciled in a cohesive investment plan where the region’s priorities for investment are set and become a guiding plan for implementation.
RTA/MTA, the Nashville Area MPO and Metro Nashville, as well as others will continue their coordination roles and responsibilities regarding transit investments in the region in the future. Those activities extend to this project, as well as other projects highlighted in nMotion and future projects yet to be identified.
N E X T S E C T I O N ES-4
Northwest Corridor Transit Study | F I N A L R E P O R T | 10.2017
1 IntroductionThis report summarizes the analysis and results of the study undertaken by the Regional Transportation Authority of Middle Tennessee (RTA) for the Northwest Corridor Transit Study (NWCTS). This study was undertaken to examine the need for higher-capacity, higher-speed transit services in Middle Tennessee, specifically on various routes or corridors connecting Nashville to Clarksville, Tennessee. The routes included a mixture of new and/or existing rights-of-way (ROW) including the use/reuse of highway and railway infrastructure and alignments. This study was undertaken largely at the same time and is compatible with the RTA and Metropolitan Transit Authority’s (MTA) transit strategic plan known as nMotion (www.nMotion2016.org). This effort largely looked to the NWCTS to detail opportunities and projects in the Northwest Corridor.
1 .1 Study BackgroundThe Nashville and greater Middle Tennessee region will see tremendous growth in the next few decades. Over 1 million new residents are expected to move to Middle Tennessee by 2040. With this growth comes increased pressure on the region’s infrastructure, most notably its transportation system. The Northwest Corridor has a lesser-used short-line rail corridor that is potentially capable of being utilized for transit. An Initial Feasibility Study of the corridor for transit service was conducted in 2008. Based on that study, the need for more multimodal options, and the fact that the rail corridor exists from Nashville to Ashland City, the RTA commissioned the NWCTS in late 2014 to explore in more detail alternatives for improving transit service on multiple corridors between Nashville and Clarksville.
This study was undertaken in accordance with processes established by the Federal Transit Administration (FTA). While there is no longer a requirement to complete an Alternatives Analysis (AA) study as part of the FTA’s Section 5309 New Starts process for seeking federal funding for major transit corridor infrastructure projects, following the previously outlined AA process is generally advisable since it yields products, analysis, and information that may be used in further project development.
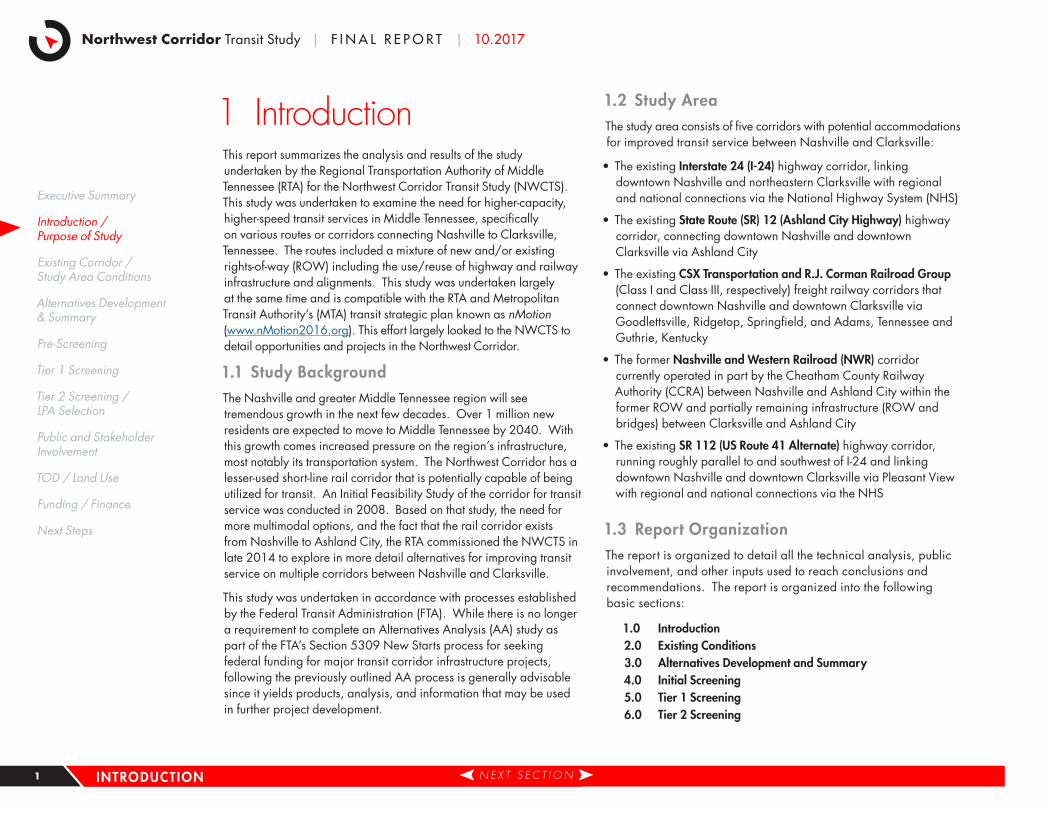
1 .2 Study AreaThe study area consists of five corridors with potential accommodations for improved transit service between Nashville and Clarksville:
• The existing Interstate 24 (I-24) highway corridor, linking downtown Nashville and northeastern Clarksville with regional and national connections via the National Highway System (NHS)
• The existing State Route (SR) 12 (Ashland City Highway) highway corridor, connecting downtown Nashville and downtown Clarksville via Ashland City
• The existing CSX Transportation and R .J . Corman Railroad Group (Class I and Class III, respectively) freight railway corridors that connect downtown Nashville and downtown Clarksville via Goodlettsville, Ridgetop, Springfield, and Adams, Tennessee and Guthrie, Kentucky
• The former Nashville and Western Railroad (NWR) corridor currently operated in part by the Cheatham County Railway Authority (CCRA) between Nashville and Ashland City within the former ROW and partially remaining infrastructure (ROW and bridges) between Clarksville and Ashland City
• The existing SR 112 (US Route 41 Alternate) highway corridor, running roughly parallel to and southwest of I-24 and linking downtown Nashville and downtown Clarksville via Pleasant View with regional and national connections via the NHS
1 .3 Report OrganizationThe report is organized to detail all the technical analysis, public involvement, and other inputs used to reach conclusions and recommendations. The report is organized into the following basic sections:
1 .0 Introduction2 .0 Existing Conditions3 .0 Alternatives Development and Summary4 .0 Initial Screening5 .0 Tier 1 Screening6 .0 Tier 2 Screening
E X E C U T I V E S U M M A R YINTRODUCTION N E X T S E C T I O N
Executive Summary
Introduction / Purpose of Study
Existing Corridor / Study Area Conditions
Alternatives Development & Summary
Pre-Screening
Tier 1 Screening
Tier 2 Screening / LPA Selection
Public and Stakeholder Involvement
TOD / Land Use
Funding / Finance
Next Steps
1
Regional Transportation Authority of Middle Tennessee
7 .0 Public and Stakeholder Involvement8 .0 Transit-Oriented Development (TOD) and Land Use9 .0 Funding and Finance10 .0 Next Steps
Each section mentions salient analysis and conclusions and presents information used to inform the LPA recommendation regarding the project or portrays other important information that shaped that recommendation. In-depth information about various topics, including back-up and detailed information and assumptions, can be found in the various technical appendices:
Appendix A: Existing Conditions
Appendix B: Other Related Studies
Appendix C: Public and Stakeholder Involvement
Appendix D: Travel Demand Forecast Methodology and Results
Appendix E: TOD Summaries and Station Area Plans
Appendix F: Capital and Operations and Maintenance (O&M) Cost Backup Information
Appendix G: Funding and Finance Backup Materials
Appendix H: Track and Station Area Plan Sheets and Right-of-Way Information
Figure 1-1: Northwest Corridor Study Area
N E X T S E C T I O N 2
Northwest Corridor Transit Study | F I N A L R E P O R T | 10.2017
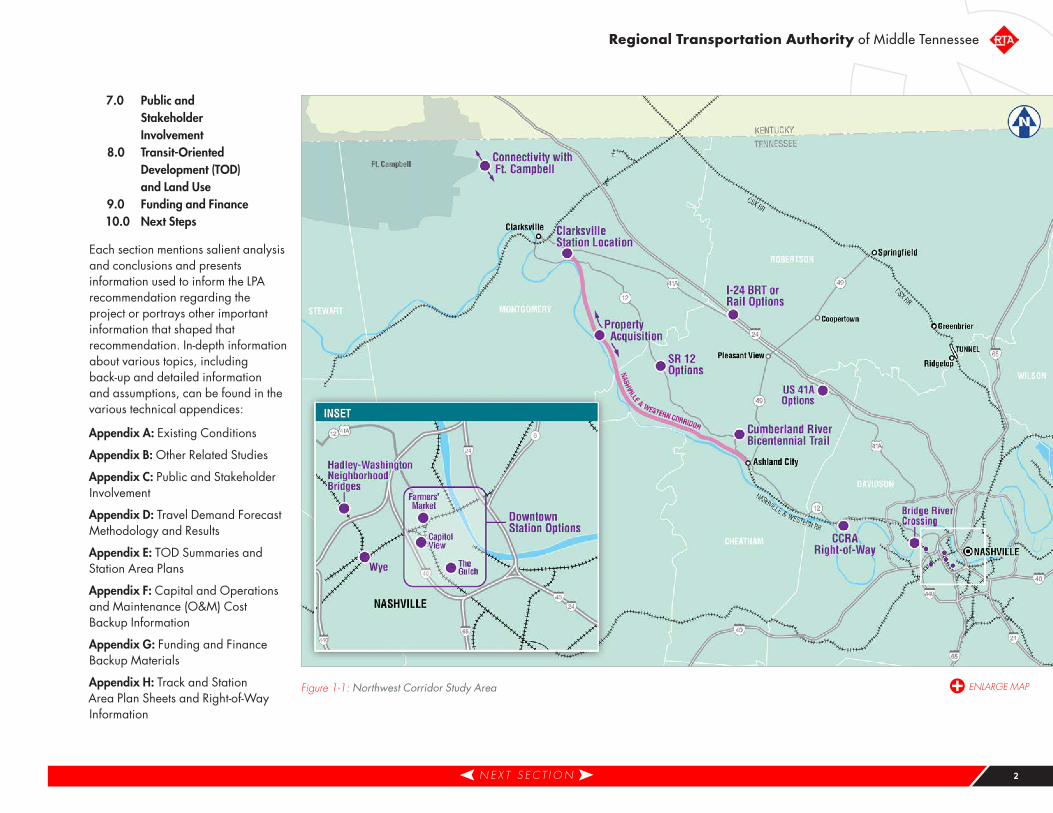
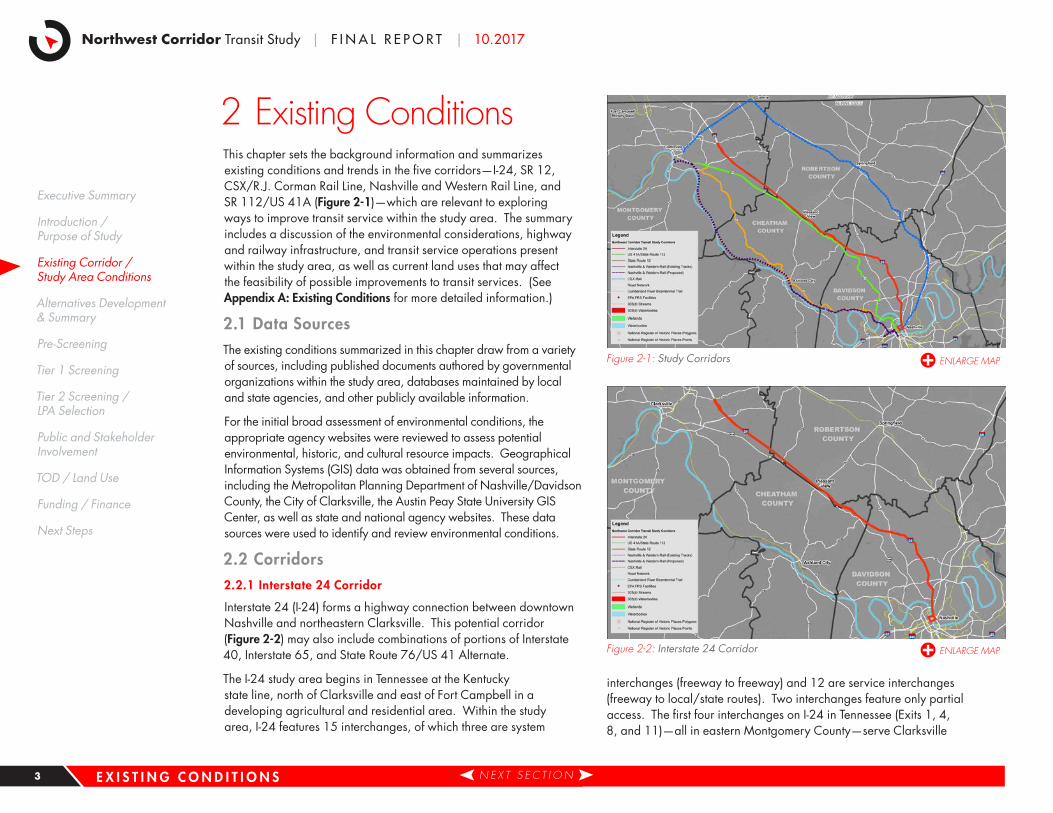
2 Existing ConditionsThis chapter sets the background information and summarizes existing conditions and trends in the five corridors—I-24, SR 12, CSX/R.J. Corman Rail Line, Nashville and Western Rail Line, and SR 112/US 41A (Figure 2-1)—which are relevant to exploring ways to improve transit service within the study area. The summary includes a discussion of the environmental considerations, highway and railway infrastructure, and transit service operations present within the study area, as well as current land uses that may affect the feasibility of possible improvements to transit services. (See Appendix A: Existing Conditions for more detailed information.)
2 .1 Data SourcesThe existing conditions summarized in this chapter draw from a variety of sources, including published documents authored by governmental organizations within the study area, databases maintained by local and state agencies, and other publicly available information.
For the initial broad assessment of environmental conditions, the appropriate agency websites were reviewed to assess potential environmental, historic, and cultural resource impacts. Geographical Information Systems (GIS) data was obtained from several sources, including the Metropolitan Planning Department of Nashville/Davidson County, the City of Clarksville, the Austin Peay State University GIS Center, as well as state and national agency websites. These data sources were used to identify and review environmental conditions.
2 .2 Corridors2 .2 .1 Interstate 24 Corridor
Interstate 24 (I-24) forms a highway connection between downtown Nashville and northeastern Clarksville. This potential corridor (Figure 2-2) may also include combinations of portions of Interstate 40, Interstate 65, and State Route 76/US 41 Alternate.
The I-24 study area begins in Tennessee at the Kentucky state line, north of Clarksville and east of Fort Campbell in a developing agricultural and residential area. Within the study area, I-24 features 15 interchanges, of which three are system
interchanges (freeway to freeway) and 12 are service interchanges (freeway to local/state routes). Two interchanges feature only partial access. The first four interchanges on I-24 in Tennessee (Exits 1, 4, 8, and 11)—all in eastern Montgomery County—serve Clarksville
Figure 2-1: Study Corridors
Figure 2-2: Interstate 24 Corridor
E X I S T I N G C O N D I T I O N S N E X T S E C T I O N
Executive Summary
Introduction / Purpose of Study
Existing Corridor / Study Area Conditions
Alternatives Development & Summary
Pre-Screening
Tier 1 Screening
Tier 2 Screening / LPA Selection
Public and Stakeholder Involvement
TOD / Land Use
Funding / Finance
Next Steps
3
Regional Transportation Authority of Middle Tennessee
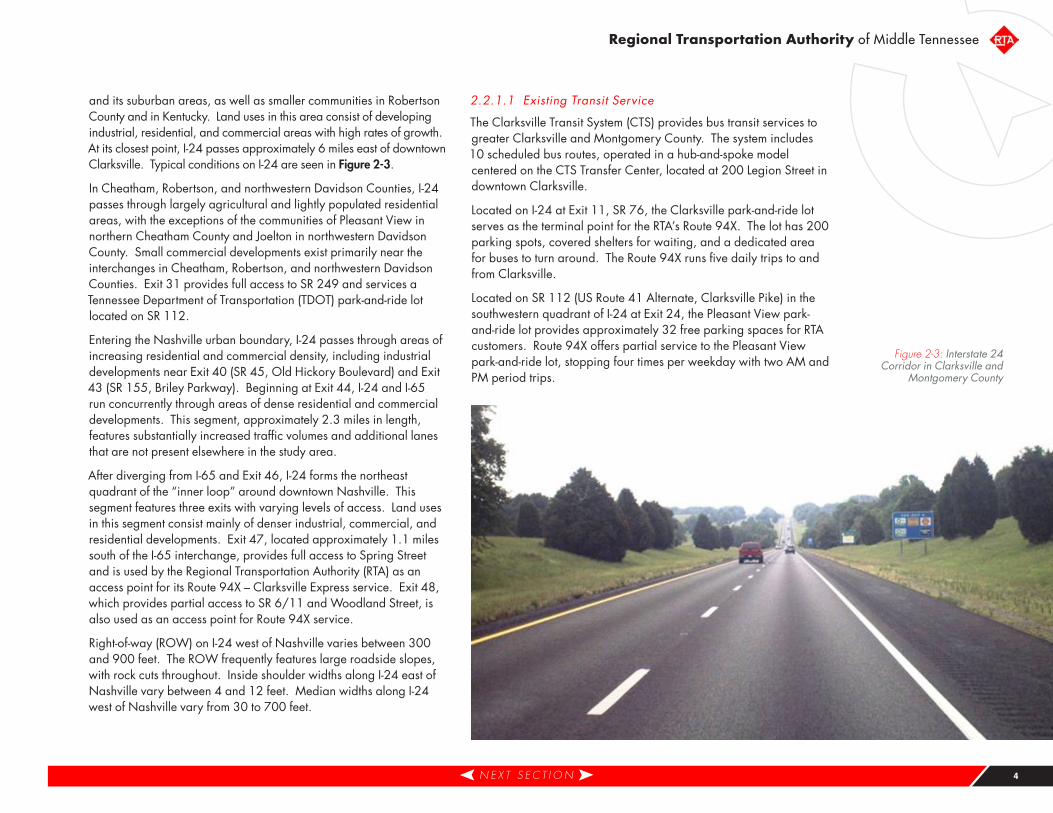
and its suburban areas, as well as smaller communities in Robertson County and in Kentucky. Land uses in this area consist of developing industrial, residential, and commercial areas with high rates of growth. At its closest point, I-24 passes approximately 6 miles east of downtown Clarksville. Typical conditions on I-24 are seen in Figure 2-3.
In Cheatham, Robertson, and northwestern Davidson Counties, I-24 passes through largely agricultural and lightly populated residential areas, with the exceptions of the communities of Pleasant View in northern Cheatham County and Joelton in northwestern Davidson County. Small commercial developments exist primarily near the interchanges in Cheatham, Robertson, and northwestern Davidson Counties. Exit 31 provides full access to SR 249 and services a Tennessee Department of Transportation (TDOT) park-and-ride lot located on SR 112.
Entering the Nashville urban boundary, I-24 passes through areas of increasing residential and commercial density, including industrial developments near Exit 40 (SR 45, Old Hickory Boulevard) and Exit 43 (SR 155, Briley Parkway). Beginning at Exit 44, I-24 and I-65 run concurrently through areas of dense residential and commercial developments. This segment, approximately 2.3 miles in length, features substantially increased traffic volumes and additional lanes that are not present elsewhere in the study area.
After diverging from I-65 and Exit 46, I-24 forms the northeast quadrant of the “inner loop” around downtown Nashville. This segment features three exits with varying levels of access. Land uses in this segment consist mainly of denser industrial, commercial, and residential developments. Exit 47, located approximately 1.1 miles south of the I-65 interchange, provides full access to Spring Street and is used by the Regional Transportation Authority (RTA) as an access point for its Route 94X – Clarksville Express service. Exit 48, which provides partial access to SR 6/11 and Woodland Street, is also used as an access point for Route 94X service.
Right-of-way (ROW) on I-24 west of Nashville varies between 300 and 900 feet. The ROW frequently features large roadside slopes, with rock cuts throughout. Inside shoulder widths along I-24 east of Nashville vary between 4 and 12 feet. Median widths along I-24 west of Nashville vary from 30 to 700 feet.
2.2.1.1 Existing Transit Service
The Clarksville Transit System (CTS) provides bus transit services to greater Clarksville and Montgomery County. The system includes 10 scheduled bus routes, operated in a hub-and-spoke model centered on the CTS Transfer Center, located at 200 Legion Street in downtown Clarksville.
Located on I-24 at Exit 11, SR 76, the Clarksville park-and-ride lot serves as the terminal point for the RTA’s Route 94X. The lot has 200 parking spots, covered shelters for waiting, and a dedicated area for buses to turn around. The Route 94X runs five daily trips to and from Clarksville.
Located on SR 112 (US Route 41 Alternate, Clarksville Pike) in the southwestern quadrant of I-24 at Exit 24, the Pleasant View park-and-ride lot provides approximately 32 free parking spaces for RTA customers. Route 94X offers partial service to the Pleasant View park-and-ride lot, stopping four times per weekday with two AM and PM period trips.
Figure 2-3: Interstate 24 Corridor in Clarksville and
Montgomery County
N E X T S E C T I O N 4
Northwest Corridor Transit Study | F I N A L R E P O R T | 10.2017
Located on Charlotte Avenue in downtown Nashville, Music City Central serves as the hub for the majority of bus routes operated by the RTA and Nashville MTA, as well as approximately 430 paid parking spaces for general use.
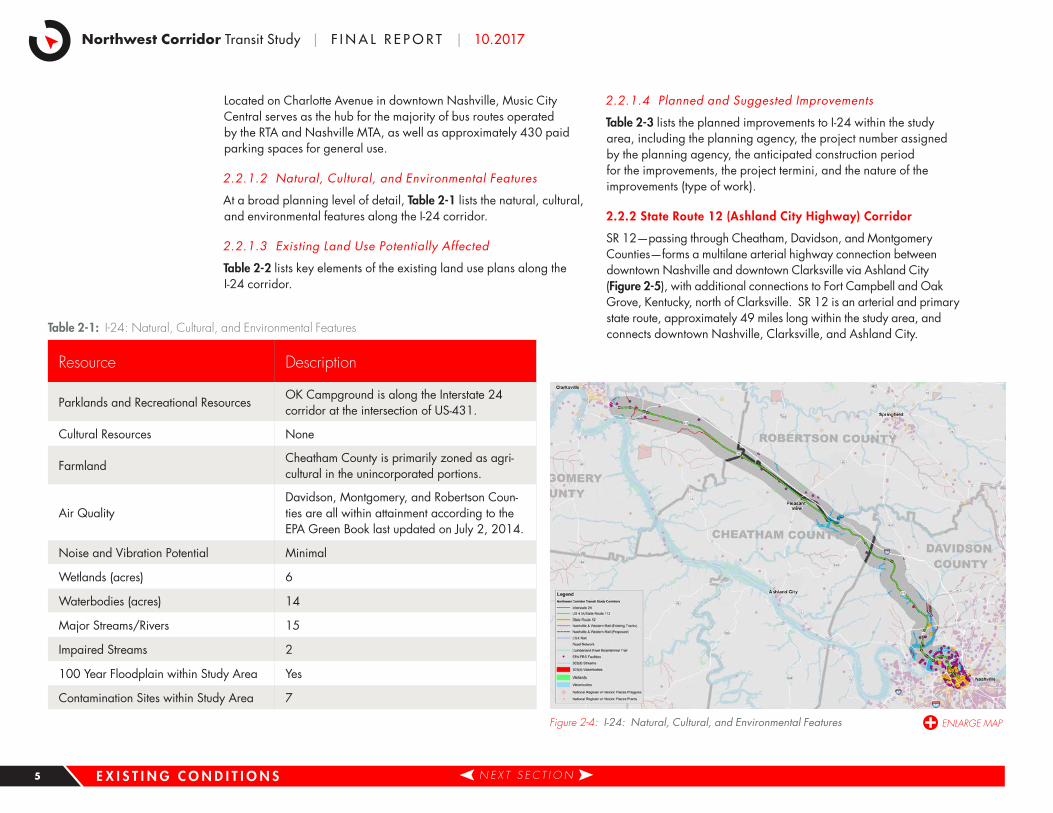
2.2.1.2 Natural, Cultural, and Environmental Features
At a broad planning level of detail, Table 2-1 lists the natural, cultural, and environmental features along the I-24 corridor.
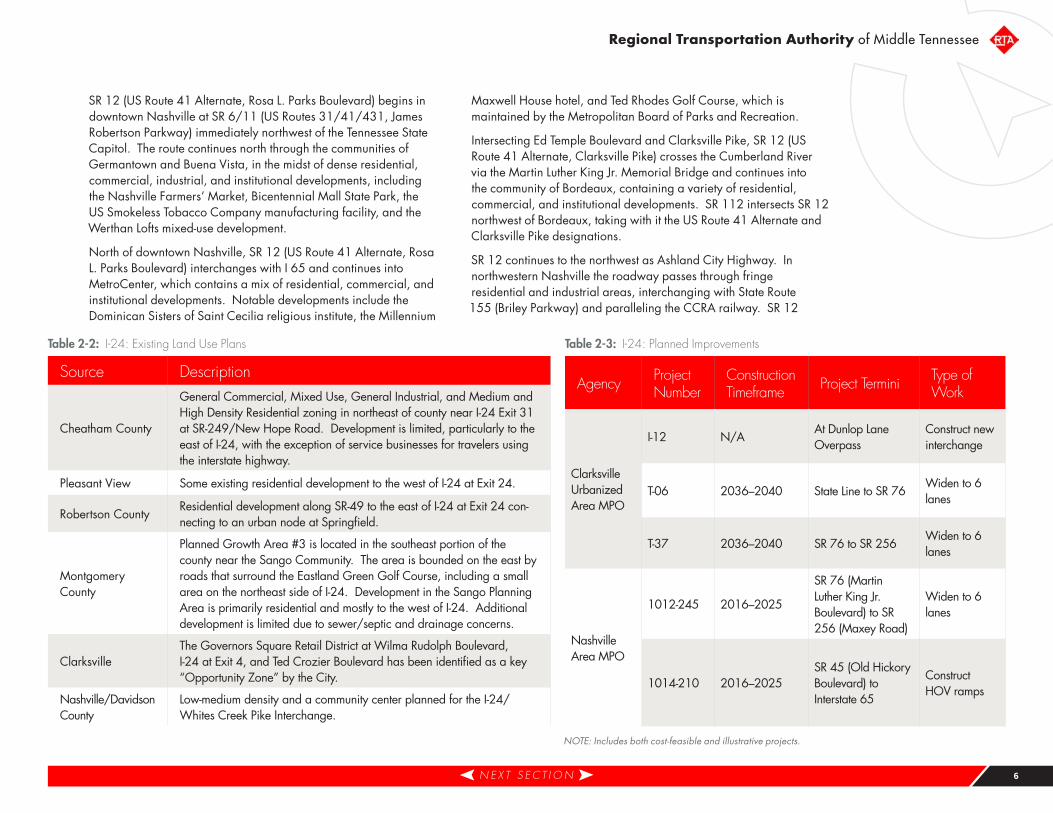
2.2.1.3 Existing Land Use Potentially Affected
Table 2-2 lists key elements of the existing land use plans along the I-24 corridor.
2.2.1.4 Planned and Suggested Improvements
Table 2-3 lists the planned improvements to I-24 within the study area, including the planning agency, the project number assigned by the planning agency, the anticipated construction period for the improvements, the project termini, and the nature of the improvements (type of work).
2 .2 .2 State Route 12 (Ashland City Highway) Corridor
SR 12—passing through Cheatham, Davidson, and Montgomery Counties—forms a multilane arterial highway connection between downtown Nashville and downtown Clarksville via Ashland City (Figure 2-5), with additional connections to Fort Campbell and Oak Grove, Kentucky, north of Clarksville. SR 12 is an arterial and primary state route, approximately 49 miles long within the study area, and connects downtown Nashville, Clarksville, and Ashland City.Table 2-1: I-24: Natural, Cultural, and Environmental Features
Resource Description
Parklands and Recreational ResourcesOK Campground is along the Interstate 24 corridor at the intersection of US-431.
Cultural Resources None
FarmlandCheatham County is primarily zoned as agri-cultural in the unincorporated portions.
Air QualityDavidson, Montgomery, and Robertson Coun-ties are all within attainment according to the EPA Green Book last updated on July 2, 2014.
Noise and Vibration Potential Minimal
Wetlands (acres) 6
Waterbodies (acres) 14
Major Streams/Rivers 15
Impaired Streams 2
100 Year Floodplain within Study Area Yes
Contamination Sites within Study Area 7
Figure 2-4: I-24: Natural, Cultural, and Environmental Features
E X I S T I N G C O N D I T I O N S N E X T S E C T I O N 5
Regional Transportation Authority of Middle Tennessee
SR 12 (US Route 41 Alternate, Rosa L. Parks Boulevard) begins in downtown Nashville at SR 6/11 (US Routes 31/41/431, James Robertson Parkway) immediately northwest of the Tennessee State Capitol. The route continues north through the communities of Germantown and Buena Vista, in the midst of dense residential, commercial, industrial, and institutional developments, including the Nashville Farmers’ Market, Bicentennial Mall State Park, the US Smokeless Tobacco Company manufacturing facility, and the Werthan Lofts mixed-use development.
North of downtown Nashville, SR 12 (US Route 41 Alternate, Rosa L. Parks Boulevard) interchanges with I 65 and continues into MetroCenter, which contains a mix of residential, commercial, and institutional developments. Notable developments include the Dominican Sisters of Saint Cecilia religious institute, the Millennium
Maxwell House hotel, and Ted Rhodes Golf Course, which is maintained by the Metropolitan Board of Parks and Recreation.
Intersecting Ed Temple Boulevard and Clarksville Pike, SR 12 (US Route 41 Alternate, Clarksville Pike) crosses the Cumberland River via the Martin Luther King Jr. Memorial Bridge and continues into the community of Bordeaux, containing a variety of residential, commercial, and institutional developments. SR 112 intersects SR 12 northwest of Bordeaux, taking with it the US Route 41 Alternate and Clarksville Pike designations.
SR 12 continues to the northwest as Ashland City Highway. In northwestern Nashville the roadway passes through fringe residential and industrial areas, interchanging with State Route 155 (Briley Parkway) and paralleling the CCRA railway. SR 12
Table 2-2: I-24: Existing Land Use Plans
Source Description
Cheatham County
General Commercial, Mixed Use, General Industrial, and Medium and High Density Residential zoning in northeast of county near I-24 Exit 31 at SR-249/New Hope Road. Development is limited, particularly to the east of I-24, with the exception of service businesses for travelers using the interstate highway.
Pleasant View Some existing residential development to the west of I-24 at Exit 24.
Robertson CountyResidential development along SR-49 to the east of I-24 at Exit 24 con-necting to an urban node at Springfield.
Montgomery County
Planned Growth Area #3 is located in the southeast portion of the county near the Sango Community. The area is bounded on the east by roads that surround the Eastland Green Golf Course, including a small area on the northeast side of I-24. Development in the Sango Planning Area is primarily residential and mostly to the west of I-24. Additional development is limited due to sewer/septic and drainage concerns.
ClarksvilleThe Governors Square Retail District at Wilma Rudolph Boulevard, I-24 at Exit 4, and Ted Crozier Boulevard has been identified as a key “Opportunity Zone” by the City.
Nashville/Davidson County
Low-medium density and a community center planned for the I-24/Whites Creek Pike Interchange.
Table 2-3: I-24: Planned Improvements
Agency Project Number
Construction Timeframe Project Termini Type of
Work
Clarksville Urbanized Area MPO
I-12 N/AAt Dunlop Lane Overpass
Construct new interchange
T-06 2036–2040 State Line to SR 76Widen to 6 lanes
T-37 2036–2040 SR 76 to SR 256Widen to 6 lanes
Nashville Area MPO
1012-245 2016–2025
SR 76 (Martin Luther King Jr. Boulevard) to SR 256 (Maxey Road)
Widen to 6 lanes
1014-210 2016–2025SR 45 (Old Hickory Boulevard) to Interstate 65
Construct HOV ramps
NOTE: Includes both cost-feasible and illustrative projects.
N E X T S E C T I O N 6
Northwest Corridor Transit Study | F I N A L R E P O R T | 10.2017
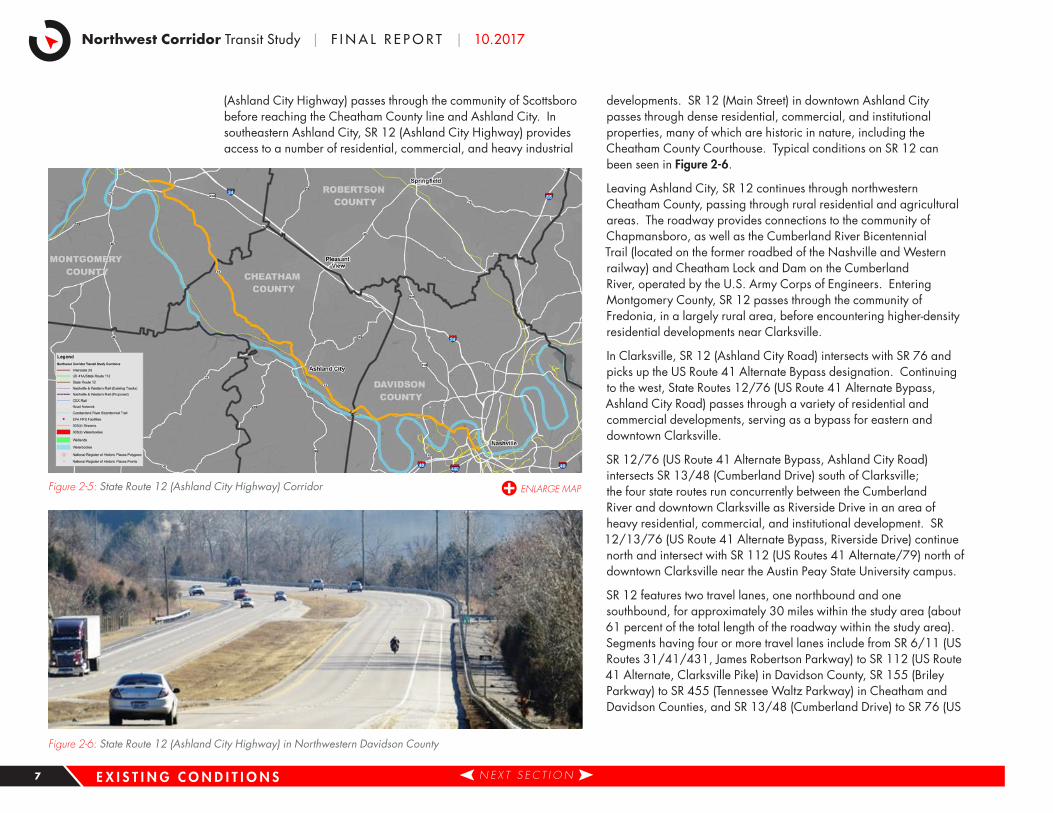
(Ashland City Highway) passes through the community of Scottsboro before reaching the Cheatham County line and Ashland City. In southeastern Ashland City, SR 12 (Ashland City Highway) provides access to a number of residential, commercial, and heavy industrial
developments. SR 12 (Main Street) in downtown Ashland City passes through dense residential, commercial, and institutional properties, many of which are historic in nature, including the Cheatham County Courthouse. Typical conditions on SR 12 can been seen in Figure 2-6.
Leaving Ashland City, SR 12 continues through northwestern Cheatham County, passing through rural residential and agricultural areas. The roadway provides connections to the community of Chapmansboro, as well as the Cumberland River Bicentennial Trail (located on the former roadbed of the Nashville and Western railway) and Cheatham Lock and Dam on the Cumberland River, operated by the U.S. Army Corps of Engineers. Entering Montgomery County, SR 12 passes through the community of Fredonia, in a largely rural area, before encountering higher-density residential developments near Clarksville.
In Clarksville, SR 12 (Ashland City Road) intersects with SR 76 and picks up the US Route 41 Alternate Bypass designation. Continuing to the west, State Routes 12/76 (US Route 41 Alternate Bypass, Ashland City Road) passes through a variety of residential and commercial developments, serving as a bypass for eastern and downtown Clarksville.
SR 12/76 (US Route 41 Alternate Bypass, Ashland City Road) intersects SR 13/48 (Cumberland Drive) south of Clarksville; the four state routes run concurrently between the Cumberland River and downtown Clarksville as Riverside Drive in an area of heavy residential, commercial, and institutional development. SR 12/13/76 (US Route 41 Alternate Bypass, Riverside Drive) continue north and intersect with SR 112 (US Routes 41 Alternate/79) north of downtown Clarksville near the Austin Peay State University campus.
SR 12 features two travel lanes, one northbound and one southbound, for approximately 30 miles within the study area (about 61 percent of the total length of the roadway within the study area). Segments having four or more travel lanes include from SR 6/11 (US Routes 31/41/431, James Robertson Parkway) to SR 112 (US Route 41 Alternate, Clarksville Pike) in Davidson County, SR 155 (Briley Parkway) to SR 455 (Tennessee Waltz Parkway) in Cheatham and Davidson Counties, and SR 13/48 (Cumberland Drive) to SR 76 (US
Figure 2-5: State Route 12 (Ashland City Highway) Corridor
Figure 2-6: State Route 12 (Ashland City Highway) in Northwestern Davidson County
E X I S T I N G C O N D I T I O N S N E X T S E C T I O N 7
Regional Transportation Authority of Middle Tennessee
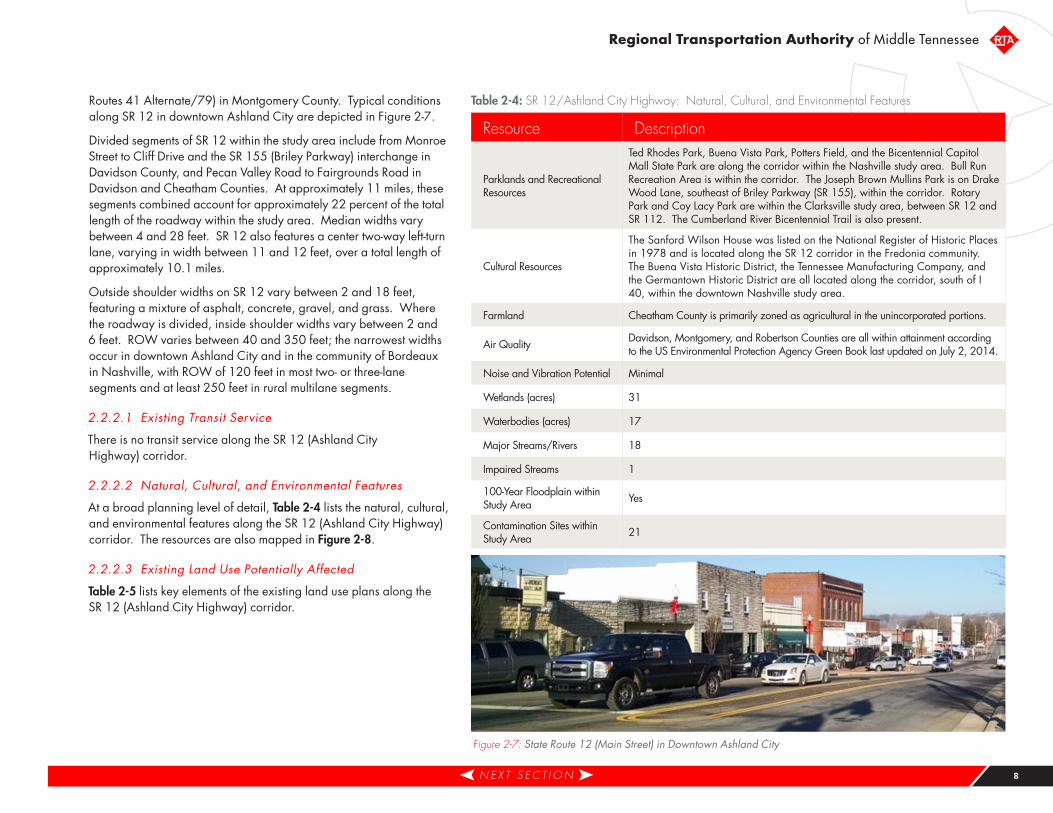
Routes 41 Alternate/79) in Montgomery County. Typical conditions along SR 12 in downtown Ashland City are depicted in Figure 2-7.
Divided segments of SR 12 within the study area include from Monroe Street to Cliff Drive and the SR 155 (Briley Parkway) interchange in Davidson County, and Pecan Valley Road to Fairgrounds Road in Davidson and Cheatham Counties. At approximately 11 miles, these segments combined account for approximately 22 percent of the total length of the roadway within the study area. Median widths vary between 4 and 28 feet. SR 12 also features a center two-way left-turn lane, varying in width between 11 and 12 feet, over a total length of approximately 10.1 miles.
Outside shoulder widths on SR 12 vary between 2 and 18 feet, featuring a mixture of asphalt, concrete, gravel, and grass. Where the roadway is divided, inside shoulder widths vary between 2 and 6 feet. ROW varies between 40 and 350 feet; the narrowest widths occur in downtown Ashland City and in the community of Bordeaux in Nashville, with ROW of 120 feet in most two- or three-lane segments and at least 250 feet in rural multilane segments.
2.2.2.1 Existing Transit Service
There is no transit service along the SR 12 (Ashland City Highway) corridor.
2.2.2.2 Natural, Cultural, and Environmental Features
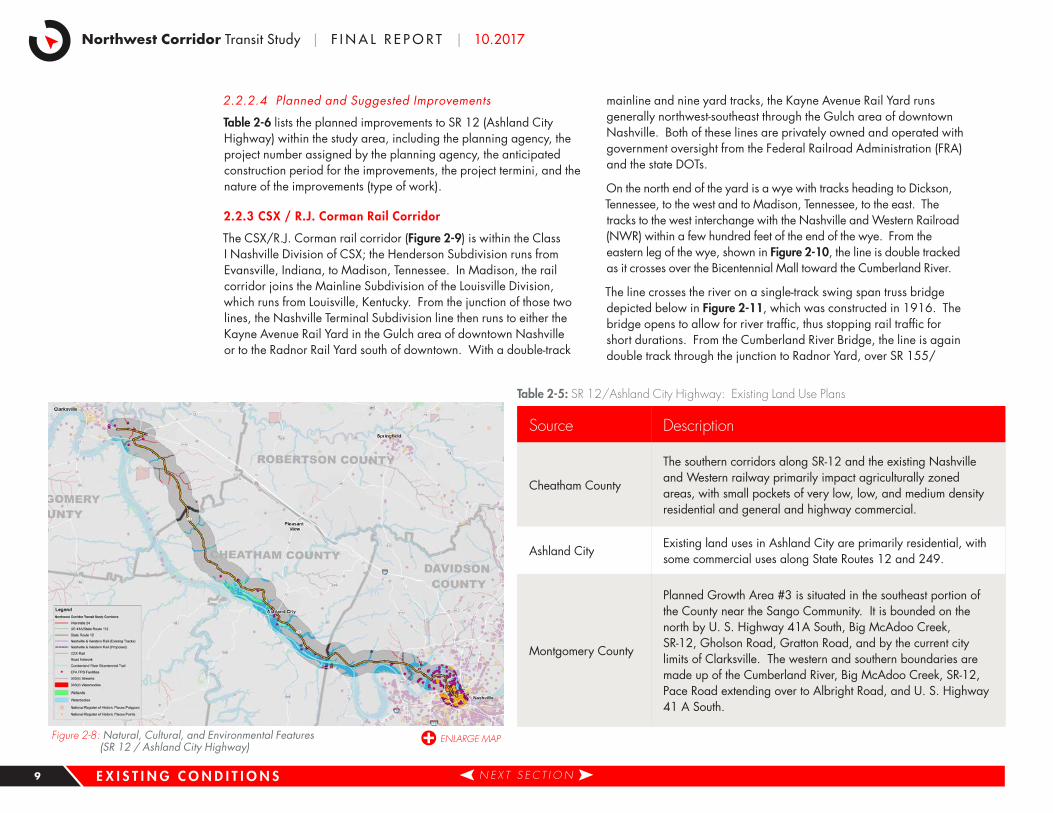
At a broad planning level of detail, Table 2-4 lists the natural, cultural, and environmental features along the SR 12 (Ashland City Highway) corridor. The resources are also mapped in Figure 2-8.
2.2.2.3 Existing Land Use Potentially Affected
Table 2-5 lists key elements of the existing land use plans along the SR 12 (Ashland City Highway) corridor.
Figure 2-7: State Route 12 (Main Street) in Downtown Ashland City
Table 2-4: SR 12/Ashland City Highway: Natural, Cultural, and Environmental Features
Resource Description
Parklands and Recreational Resources
Ted Rhodes Park, Buena Vista Park, Potters Field, and the Bicentennial Capitol Mall State Park are along the corridor within the Nashville study area. Bull Run Recreation Area is within the corridor. The Joseph Brown Mullins Park is on Drake Wood Lane, southeast of Briley Parkway (SR 155), within the corridor. Rotary Park and Coy Lacy Park are within the Clarksville study area, between SR 12 and SR 112. The Cumberland River Bicentennial Trail is also present.
Cultural Resources
The Sanford Wilson House was listed on the National Register of Historic Places in 1978 and is located along the SR 12 corridor in the Fredonia community. The Buena Vista Historic District, the Tennessee Manufacturing Company, and the Germantown Historic District are all located along the corridor, south of I 40, within the downtown Nashville study area.
Farmland Cheatham County is primarily zoned as agricultural in the unincorporated portions.
Air Quality Davidson, Montgomery, and Robertson Counties are all within attainment according to the US Environmental Protection Agency Green Book last updated on July 2, 2014.
Noise and Vibration Potential Minimal
Wetlands (acres) 31
Waterbodies (acres) 17
Major Streams/Rivers 18
Impaired Streams 1
100-Year Floodplain within Study Area Yes
Contamination Sites within Study Area 21
N E X T S E C T I O N 8
Northwest Corridor Transit Study | F I N A L R E P O R T | 10.2017
2.2.2.4 Planned and Suggested Improvements
Table 2-6 lists the planned improvements to SR 12 (Ashland City Highway) within the study area, including the planning agency, the project number assigned by the planning agency, the anticipated construction period for the improvements, the project termini, and the nature of the improvements (type of work).
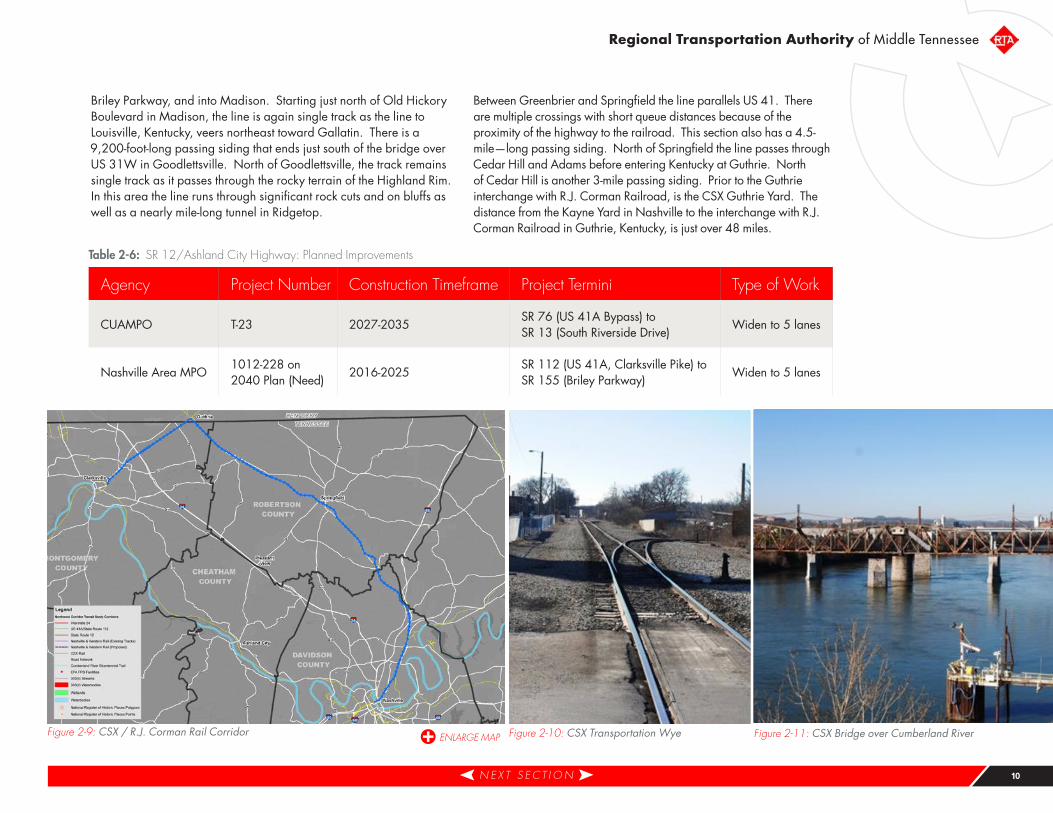
2 .2 .3 CSX / R .J . Corman Rail Corridor
The CSX/R.J. Corman rail corridor (Figure 2-9) is within the Class I Nashville Division of CSX; the Henderson Subdivision runs from Evansville, Indiana, to Madison, Tennessee. In Madison, the rail corridor joins the Mainline Subdivision of the Louisville Division, which runs from Louisville, Kentucky. From the junction of those two lines, the Nashville Terminal Subdivision line then runs to either the Kayne Avenue Rail Yard in the Gulch area of downtown Nashville or to the Radnor Rail Yard south of downtown. With a double-track
mainline and nine yard tracks, the Kayne Avenue Rail Yard runs generally northwest-southeast through the Gulch area of downtown Nashville. Both of these lines are privately owned and operated with government oversight from the Federal Railroad Administration (FRA) and the state DOTs.
On the north end of the yard is a wye with tracks heading to Dickson, Tennessee, to the west and to Madison, Tennessee, to the east. The tracks to the west interchange with the Nashville and Western Railroad (NWR) within a few hundred feet of the end of the wye. From the eastern leg of the wye, shown in Figure 2-10, the line is double tracked as it crosses over the Bicentennial Mall toward the Cumberland River.
The line crosses the river on a single-track swing span truss bridge depicted below in Figure 2-11, which was constructed in 1916. The bridge opens to allow for river traffic, thus stopping rail traffic for short durations. From the Cumberland River Bridge, the line is again double track through the junction to Radnor Yard, over SR 155/
Figure 2-8: Natural, Cultural, and Environmental Features (SR 12 / Ashland City Highway)
Table 2-5: SR 12/Ashland City Highway: Existing Land Use Plans
Source Description
Cheatham County
The southern corridors along SR-12 and the existing Nashville and Western railway primarily impact agriculturally zoned areas, with small pockets of very low, low, and medium density residential and general and highway commercial.
Ashland CityExisting land uses in Ashland City are primarily residential, with some commercial uses along State Routes 12 and 249.
Montgomery County
Planned Growth Area #3 is situated in the southeast portion of the County near the Sango Community. It is bounded on the north by U. S. Highway 41A South, Big McAdoo Creek, SR-12, Gholson Road, Gratton Road, and by the current city limits of Clarksville. The western and southern boundaries are made up of the Cumberland River, Big McAdoo Creek, SR-12, Pace Road extending over to Albright Road, and U. S. Highway 41 A South.
E X I S T I N G C O N D I T I O N S N E X T S E C T I O N 9
Regional Transportation Authority of Middle Tennessee
Briley Parkway, and into Madison. Starting just north of Old Hickory Boulevard in Madison, the line is again single track as the line to Louisville, Kentucky, veers northeast toward Gallatin. There is a 9,200-foot-long passing siding that ends just south of the bridge over US 31W in Goodlettsville. North of Goodlettsville, the track remains single track as it passes through the rocky terrain of the Highland Rim. In this area the line runs through significant rock cuts and on bluffs as well as a nearly mile-long tunnel in Ridgetop.
Between Greenbrier and Springfield the line parallels US 41. There are multiple crossings with short queue distances because of the proximity of the highway to the railroad. This section also has a 4.5-mile—long passing siding. North of Springfield the line passes through Cedar Hill and Adams before entering Kentucky at Guthrie. North of Cedar Hill is another 3-mile passing siding. Prior to the Guthrie interchange with R.J. Corman Railroad, is the CSX Guthrie Yard. The distance from the Kayne Yard in Nashville to the interchange with R.J. Corman Railroad in Guthrie, Kentucky, is just over 48 miles.
Figure 2-9: CSX / R.J. Corman Rail Corridor Figure 2-10: CSX Transportation Wye Figure 2-11: CSX Bridge over Cumberland River
Table 2-6: SR 12/Ashland City Highway: Planned Improvements
Agency Project Number Construction Timeframe Project Termini Type of Work
CUAMPO T-23 2027-2035SR 76 (US 41A Bypass) to SR 13 (South Riverside Drive)
Widen to 5 lanes
Nashville Area MPO1012-228 on 2040 Plan (Need)
2016-2025SR 112 (US 41A, Clarksville Pike) to SR 155 (Briley Parkway)
Widen to 5 lanes
N E X T S E C T I O N 10
Northwest Corridor Transit Study | F I N A L R E P O R T | 10.2017
The Memphis Line of R.J. Corman Railroad Group is a 100-mile Class III Short Line Railroad that runs between South Union in Western Kentucky and Cumberland City in Western Tennessee. The line connects with CSX at Bowling Green and Guthrie, Kentucky. The western portion of the line runs from Guthrie southwest through Clarksville to Cumberland City. It is the portion of the line from Guthrie to Clarksville that could fall within the Northwest Corridor.
This Memphis Line operates two to four trains a day at 10 to 40 miles per hour (mph). Interchanging with CSX less than a mile north of the Tennessee/Kentucky border, the single-track line leads southeast through the rural area. Before crossing under I 24, the line serves several industrial customers. The line runs just south of the commercial district along Wilma Rudolph Boulevard before entering the downtown
area of Clarksville. The line has 19 public and private at-grade crossings, eight overpasses, and three bridges. Built in 1920, the bridge over the Red River is a large fixed-span timber trestle at over 1,000 feet long and 53 feet high.
2.2.3.1 Existing Transit Service
There is no transit service along the CSX/R.J. Corman rail corridor.
2.2.3.2 Natural, Cultural, and Environmental Features
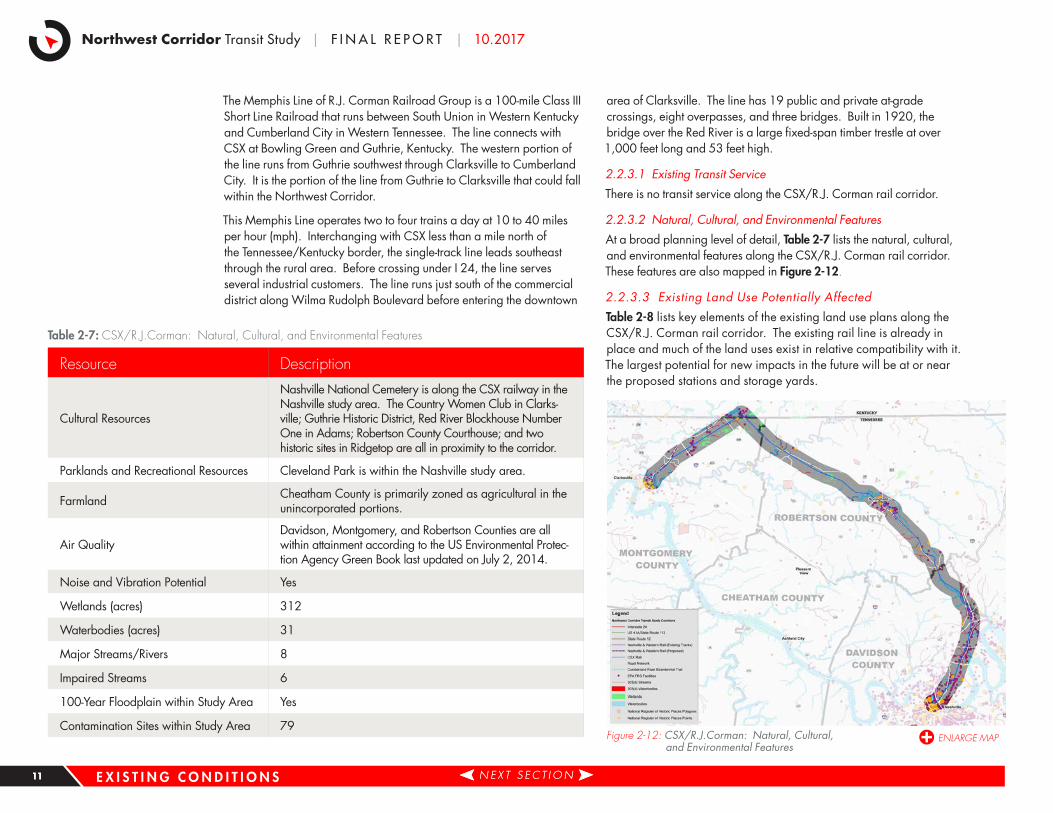
At a broad planning level of detail, Table 2-7 lists the natural, cultural, and environmental features along the CSX/R.J. Corman rail corridor. These features are also mapped in Figure 2-12.
2.2.3.3 Existing Land Use Potentially Affected
Table 2-8 lists key elements of the existing land use plans along the CSX/R.J. Corman rail corridor. The existing rail line is already in place and much of the land uses exist in relative compatibility with it. The largest potential for new impacts in the future will be at or near the proposed stations and storage yards.
Table 2-7: CSX/R.J.Corman: Natural, Cultural, and Environmental Features
Resource Description
Cultural Resources
Nashville National Cemetery is along the CSX railway in the Nashville study area. The Country Women Club in Clarks-ville; Guthrie Historic District, Red River Blockhouse Number One in Adams; Robertson County Courthouse; and two historic sites in Ridgetop are all in proximity to the corridor.
Parklands and Recreational Resources Cleveland Park is within the Nashville study area.
Farmland Cheatham County is primarily zoned as agricultural in the unincorporated portions.
Air QualityDavidson, Montgomery, and Robertson Counties are all within attainment according to the US Environmental Protec-tion Agency Green Book last updated on July 2, 2014.
Noise and Vibration Potential Yes
Wetlands (acres) 312
Waterbodies (acres) 31
Major Streams/Rivers 8
Impaired Streams 6
100-Year Floodplain within Study Area Yes
Contamination Sites within Study Area 79Figure 2-12: CSX/R.J.Corman: Natural, Cultural, and Environmental Features
E X I S T I N G C O N D I T I O N S N E X T S E C T I O N N E X T S E C T I O N 11
Regional Transportation Authority of Middle Tennessee
2.2.3.4 Planned and Suggested Improvements
No major improvements, beyond ongoing maintenance and minor upgrades, are anticipated along the CSX/R.J. Corman rail corridor.
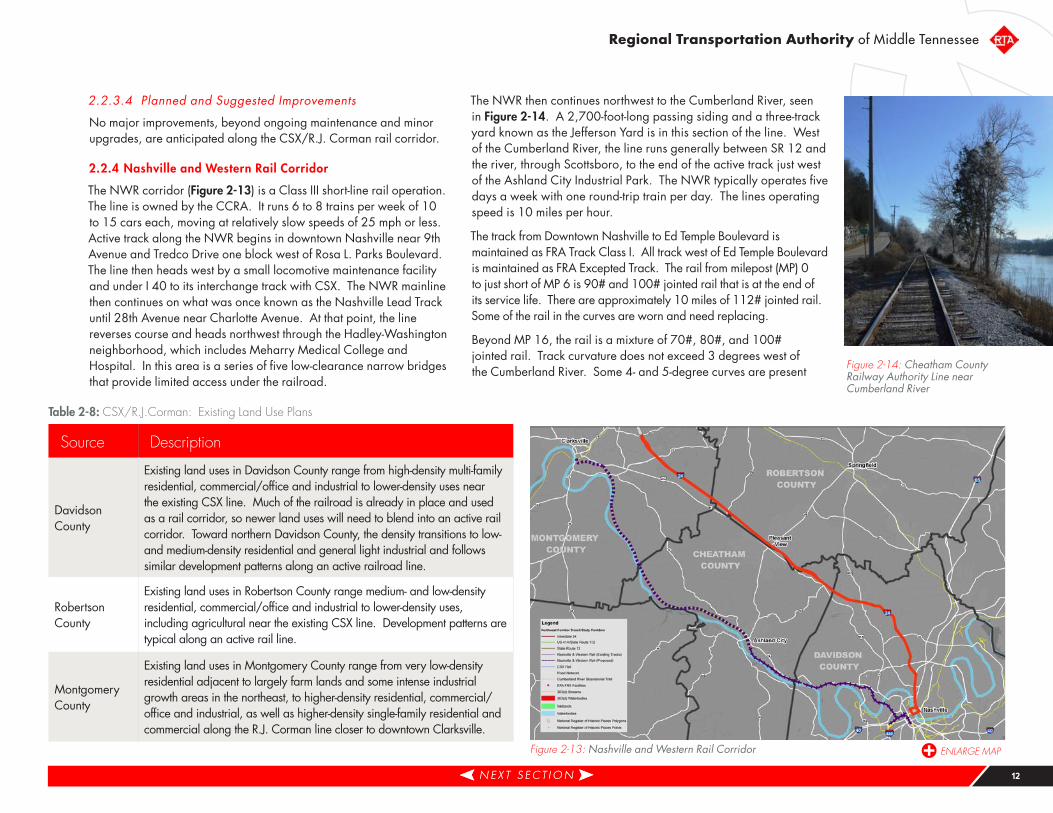
2 .2 .4 Nashville and Western Rail Corridor
The NWR corridor (Figure 2-13) is a Class III short-line rail operation. The line is owned by the CCRA. It runs 6 to 8 trains per week of 10 to 15 cars each, moving at relatively slow speeds of 25 mph or less. Active track along the NWR begins in downtown Nashville near 9th Avenue and Tredco Drive one block west of Rosa L. Parks Boulevard. The line then heads west by a small locomotive maintenance facility and under I 40 to its interchange track with CSX. The NWR mainline then continues on what was once known as the Nashville Lead Track until 28th Avenue near Charlotte Avenue. At that point, the line reverses course and heads northwest through the Hadley-Washington neighborhood, which includes Meharry Medical College and Hospital. In this area is a series of five low-clearance narrow bridges that provide limited access under the railroad.
The NWR then continues northwest to the Cumberland River, seen in Figure 2-14. A 2,700-foot-long passing siding and a three-track yard known as the Jefferson Yard is in this section of the line. West of the Cumberland River, the line runs generally between SR 12 and the river, through Scottsboro, to the end of the active track just west of the Ashland City Industrial Park. The NWR typically operates five days a week with one round-trip train per day. The lines operating speed is 10 miles per hour.
The track from Downtown Nashville to Ed Temple Boulevard is maintained as FRA Track Class I. All track west of Ed Temple Boulevard is maintained as FRA Excepted Track. The rail from milepost (MP) 0 to just short of MP 6 is 90# and 100# jointed rail that is at the end of its service life. There are approximately 10 miles of 112# jointed rail. Some of the rail in the curves are worn and need replacing.
Beyond MP 16, the rail is a mixture of 70#, 80#, and 100# jointed rail. Track curvature does not exceed 3 degrees west of the Cumberland River. Some 4- and 5-degree curves are present
Figure 2-13: Nashville and Western Rail Corridor
Figure 2-14: Cheatham County Railway Authority Line near Cumberland River
Table 2-8: CSX/R.J.Corman: Existing Land Use Plans
Source Description
Davidson County
Existing land uses in Davidson County range from high-density multi-family residential, commercial/office and industrial to lower-density uses near the existing CSX line. Much of the railroad is already in place and used as a rail corridor, so newer land uses will need to blend into an active rail corridor. Toward northern Davidson County, the density transitions to low- and medium-density residential and general light industrial and follows similar development patterns along an active railroad line.
Robertson County
Existing land uses in Robertson County range medium- and low-density residential, commercial/office and industrial to lower-density uses, including agricultural near the existing CSX line. Development patterns are typical along an active rail line.
Montgomery County
Existing land uses in Montgomery County range from very low-density residential adjacent to largely farm lands and some intense industrial growth areas in the northeast, to higher-density residential, commercial/office and industrial, as well as higher-density single-family residential and commercial along the R.J. Corman line closer to downtown Clarksville.
N E X T S E C T I O N N E X T S E C T I O N 12
Northwest Corridor Transit Study | F I N A L R E P O R T | 10.2017
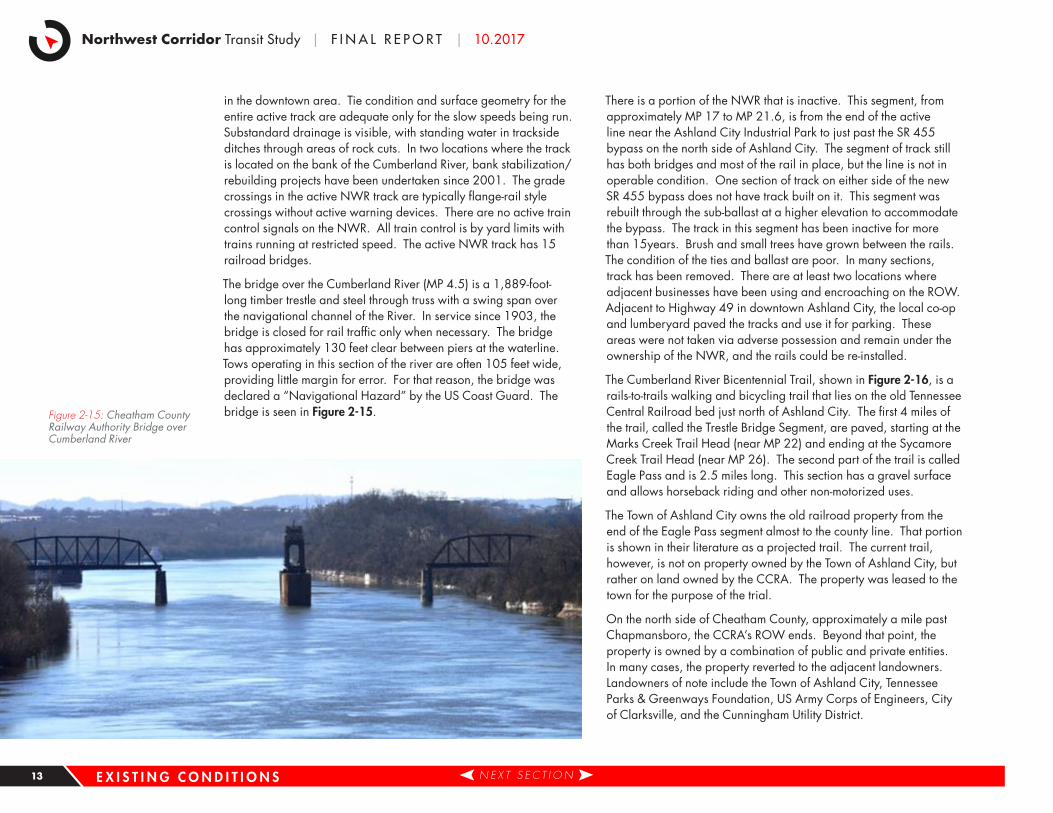
in the downtown area. Tie condition and surface geometry for the entire active track are adequate only for the slow speeds being run. Substandard drainage is visible, with standing water in trackside ditches through areas of rock cuts. In two locations where the track is located on the bank of the Cumberland River, bank stabilization/rebuilding projects have been undertaken since 2001. The grade crossings in the active NWR track are typically flange-rail style crossings without active warning devices. There are no active train control signals on the NWR. All train control is by yard limits with trains running at restricted speed. The active NWR track has 15 railroad bridges.
The bridge over the Cumberland River (MP 4.5) is a 1,889-foot-long timber trestle and steel through truss with a swing span over the navigational channel of the River. In service since 1903, the bridge is closed for rail traffic only when necessary. The bridge has approximately 130 feet clear between piers at the waterline. Tows operating in this section of the river are often 105 feet wide, providing little margin for error. For that reason, the bridge was declared a “Navigational Hazard” by the US Coast Guard. The bridge is seen in Figure 2-15.
There is a portion of the NWR that is inactive. This segment, from approximately MP 17 to MP 21.6, is from the end of the active line near the Ashland City Industrial Park to just past the SR 455 bypass on the north side of Ashland City. The segment of track still has both bridges and most of the rail in place, but the line is not in operable condition. One section of track on either side of the new SR 455 bypass does not have track built on it. This segment was rebuilt through the sub-ballast at a higher elevation to accommodate the bypass. The track in this segment has been inactive for more than 15years. Brush and small trees have grown between the rails. The condition of the ties and ballast are poor. In many sections, track has been removed. There are at least two locations where adjacent businesses have been using and encroaching on the ROW. Adjacent to Highway 49 in downtown Ashland City, the local co-op and lumberyard paved the tracks and use it for parking. These areas were not taken via adverse possession and remain under the ownership of the NWR, and the rails could be re-installed.
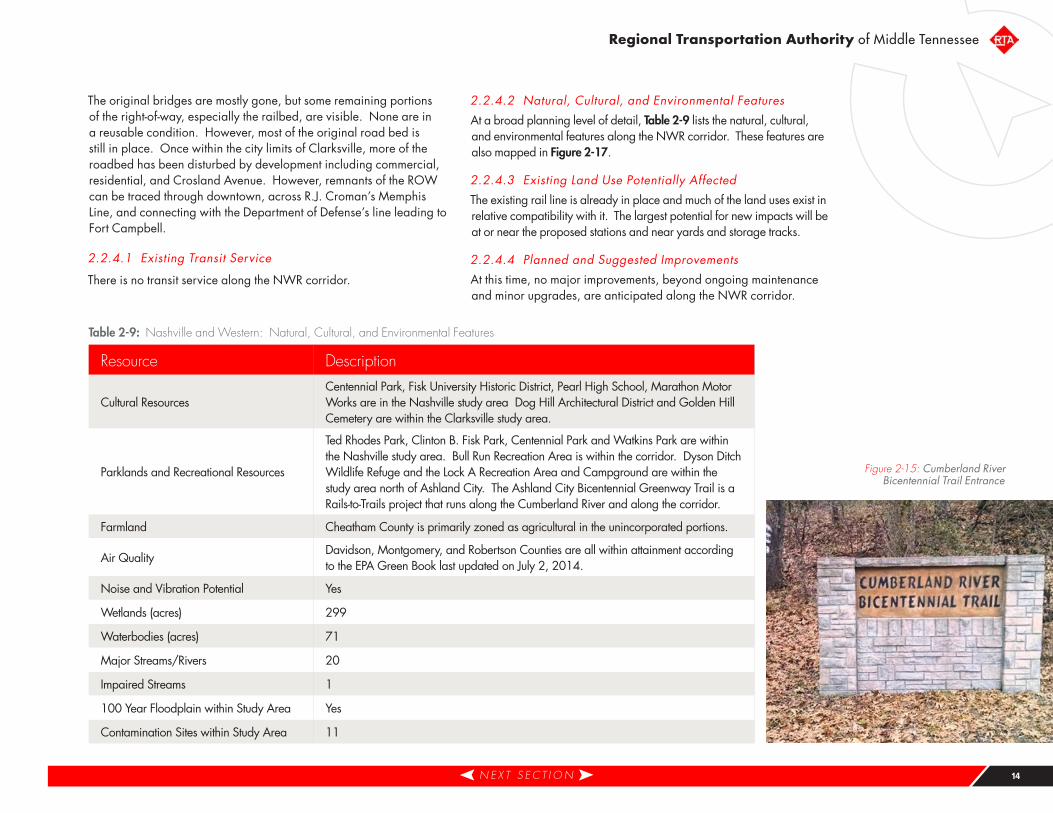
The Cumberland River Bicentennial Trail, shown in Figure 2-16, is a rails-to-trails walking and bicycling trail that lies on the old Tennessee Central Railroad bed just north of Ashland City. The first 4 miles of the trail, called the Trestle Bridge Segment, are paved, starting at the Marks Creek Trail Head (near MP 22) and ending at the Sycamore Creek Trail Head (near MP 26). The second part of the trail is called Eagle Pass and is 2.5 miles long. This section has a gravel surface and allows horseback riding and other non-motorized uses.
The Town of Ashland City owns the old railroad property from the end of the Eagle Pass segment almost to the county line. That portion is shown in their literature as a projected trail. The current trail, however, is not on property owned by the Town of Ashland City, but rather on land owned by the CCRA. The property was leased to the town for the purpose of the trial.
On the north side of Cheatham County, approximately a mile past Chapmansboro, the CCRA’s ROW ends. Beyond that point, the property is owned by a combination of public and private entities. In many cases, the property reverted to the adjacent landowners. Landowners of note include the Town of Ashland City, Tennessee Parks & Greenways Foundation, US Army Corps of Engineers, City of Clarksville, and the Cunningham Utility District.
Figure 2-15: Cheatham County Railway Authority Bridge over Cumberland River
E X I S T I N G C O N D I T I O N S N E X T S E C T I O N 13
Regional Transportation Authority of Middle Tennessee
The original bridges are mostly gone, but some remaining portions of the right-of-way, especially the railbed, are visible. None are in a reusable condition. However, most of the original road bed is still in place. Once within the city limits of Clarksville, more of the roadbed has been disturbed by development including commercial, residential, and Crosland Avenue. However, remnants of the ROW can be traced through downtown, across R.J. Croman’s Memphis Line, and connecting with the Department of Defense’s line leading to Fort Campbell.
2.2.4.1 Existing Transit Service
There is no transit service along the NWR corridor.
2.2.4.2 Natural, Cultural, and Environmental Features
At a broad planning level of detail, Table 2-9 lists the natural, cultural, and environmental features along the NWR corridor. These features are also mapped in Figure 2-17.
2.2.4.3 Existing Land Use Potentially Affected
The existing rail line is already in place and much of the land uses exist in relative compatibility with it. The largest potential for new impacts will be at or near the proposed stations and near yards and storage tracks.
2.2.4.4 Planned and Suggested Improvements
At this time, no major improvements, beyond ongoing maintenance and minor upgrades, are anticipated along the NWR corridor.
Figure 2-15: Cumberland River Bicentennial Trail Entrance
Table 2-9: Nashville and Western: Natural, Cultural, and Environmental Features
Resource Description
Cultural ResourcesCentennial Park, Fisk University Historic District, Pearl High School, Marathon Motor Works are in the Nashville study area Dog Hill Architectural District and Golden Hill Cemetery are within the Clarksville study area.
Parklands and Recreational Resources
Ted Rhodes Park, Clinton B. Fisk Park, Centennial Park and Watkins Park are within the Nashville study area. Bull Run Recreation Area is within the corridor. Dyson Ditch Wildlife Refuge and the Lock A Recreation Area and Campground are within the study area north of Ashland City. The Ashland City Bicentennial Greenway Trail is a Rails-to-Trails project that runs along the Cumberland River and along the corridor.
Farmland Cheatham County is primarily zoned as agricultural in the unincorporated portions.
Air QualityDavidson, Montgomery, and Robertson Counties are all within attainment according to the EPA Green Book last updated on July 2, 2014.
Noise and Vibration Potential Yes
Wetlands (acres) 299
Waterbodies (acres) 71
Major Streams/Rivers 20
Impaired Streams 1
100 Year Floodplain within Study Area Yes
Contamination Sites within Study Area 11
N E X T S E C T I O N 14
Northwest Corridor Transit Study | F I N A L R E P O R T | 10.2017
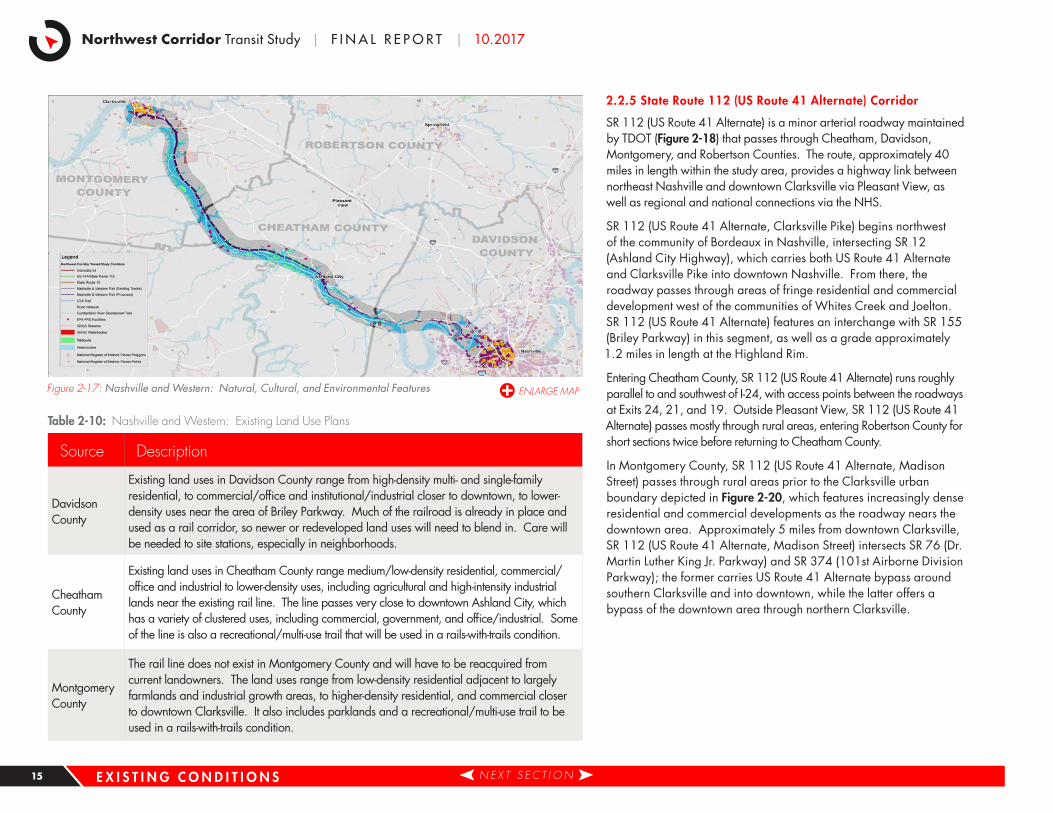
2 .2 .5 State Route 112 (US Route 41 Alternate) Corridor
SR 112 (US Route 41 Alternate) is a minor arterial roadway maintained by TDOT (Figure 2-18) that passes through Cheatham, Davidson, Montgomery, and Robertson Counties. The route, approximately 40 miles in length within the study area, provides a highway link between northeast Nashville and downtown Clarksville via Pleasant View, as well as regional and national connections via the NHS.
SR 112 (US Route 41 Alternate, Clarksville Pike) begins northwest of the community of Bordeaux in Nashville, intersecting SR 12 (Ashland City Highway), which carries both US Route 41 Alternate and Clarksville Pike into downtown Nashville. From there, the roadway passes through areas of fringe residential and commercial development west of the communities of Whites Creek and Joelton. SR 112 (US Route 41 Alternate) features an interchange with SR 155 (Briley Parkway) in this segment, as well as a grade approximately 1.2 miles in length at the Highland Rim.
Entering Cheatham County, SR 112 (US Route 41 Alternate) runs roughly parallel to and southwest of I-24, with access points between the roadways at Exits 24, 21, and 19. Outside Pleasant View, SR 112 (US Route 41 Alternate) passes mostly through rural areas, entering Robertson County for short sections twice before returning to Cheatham County.
In Montgomery County, SR 112 (US Route 41 Alternate, Madison Street) passes through rural areas prior to the Clarksville urban boundary depicted in Figure 2-20, which features increasingly dense residential and commercial developments as the roadway nears the downtown area. Approximately 5 miles from downtown Clarksville, SR 112 (US Route 41 Alternate, Madison Street) intersects SR 76 (Dr. Martin Luther King Jr. Parkway) and SR 374 (101st Airborne Division Parkway); the former carries US Route 41 Alternate bypass around southern Clarksville and into downtown, while the latter offers a bypass of the downtown area through northern Clarksville.
Figure 2-17: Nashville and Western: Natural, Cultural, and Environmental Features
Table 2-10: Nashville and Western: Existing Land Use Plans
Source Description
Davidson County
Existing land uses in Davidson County range from high-density multi- and single-family residential, to commercial/office and institutional/industrial closer to downtown, to lower-density uses near the area of Briley Parkway. Much of the railroad is already in place and used as a rail corridor, so newer or redeveloped land uses will need to blend in. Care will be needed to site stations, especially in neighborhoods.
Cheatham County
Existing land uses in Cheatham County range medium/low-density residential, commercial/office and industrial to lower-density uses, including agricultural and high-intensity industrial lands near the existing rail line. The line passes very close to downtown Ashland City, which has a variety of clustered uses, including commercial, government, and office/industrial. Some of the line is also a recreational/multi-use trail that will be used in a rails-with-trails condition.
Montgomery County
The rail line does not exist in Montgomery County and will have to be reacquired from current landowners. The land uses range from low-density residential adjacent to largely farmlands and industrial growth areas, to higher-density residential, and commercial closer to downtown Clarksville. It also includes parklands and a recreational/multi-use trail to be used in a rails-with-trails condition.
E X I S T I N G C O N D I T I O N S N E X T S E C T I O N 15
Regional Transportation Authority of Middle Tennessee
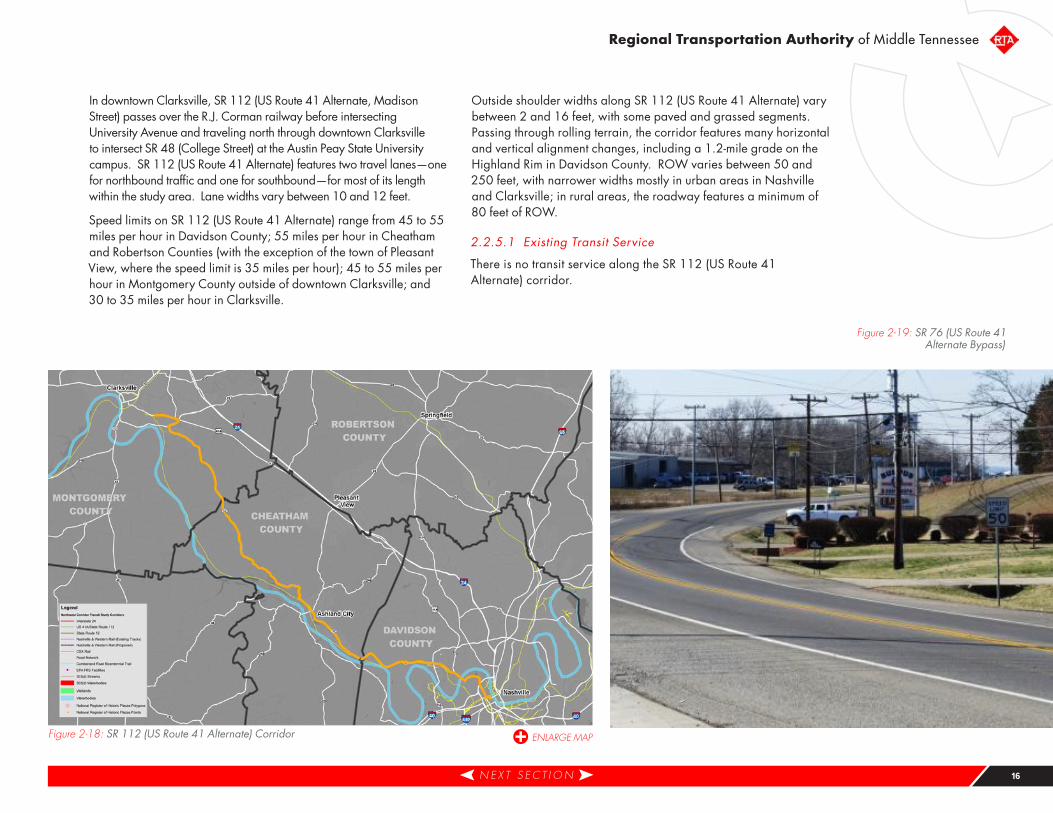
Figure 2-18: SR 112 (US Route 41 Alternate) Corridor
In downtown Clarksville, SR 112 (US Route 41 Alternate, Madison Street) passes over the R.J. Corman railway before intersecting University Avenue and traveling north through downtown Clarksville to intersect SR 48 (College Street) at the Austin Peay State University campus. SR 112 (US Route 41 Alternate) features two travel lanes—one for northbound traffic and one for southbound—for most of its length within the study area. Lane widths vary between 10 and 12 feet.
Speed limits on SR 112 (US Route 41 Alternate) range from 45 to 55 miles per hour in Davidson County; 55 miles per hour in Cheatham and Robertson Counties (with the exception of the town of Pleasant View, where the speed limit is 35 miles per hour); 45 to 55 miles per hour in Montgomery County outside of downtown Clarksville; and 30 to 35 miles per hour in Clarksville.
Outside shoulder widths along SR 112 (US Route 41 Alternate) vary between 2 and 16 feet, with some paved and grassed segments. Passing through rolling terrain, the corridor features many horizontal and vertical alignment changes, including a 1.2-mile grade on the Highland Rim in Davidson County. ROW varies between 50 and 250 feet, with narrower widths mostly in urban areas in Nashville and Clarksville; in rural areas, the roadway features a minimum of 80 feet of ROW.
2.2.5.1 Existing Transit Service
There is no transit service along the SR 112 (US Route 41 Alternate) corridor.
Figure 2-19: SR 76 (US Route 41 Alternate Bypass)
N E X T S E C T I O N 16
Northwest Corridor Transit Study | F I N A L R E P O R T | 10.2017
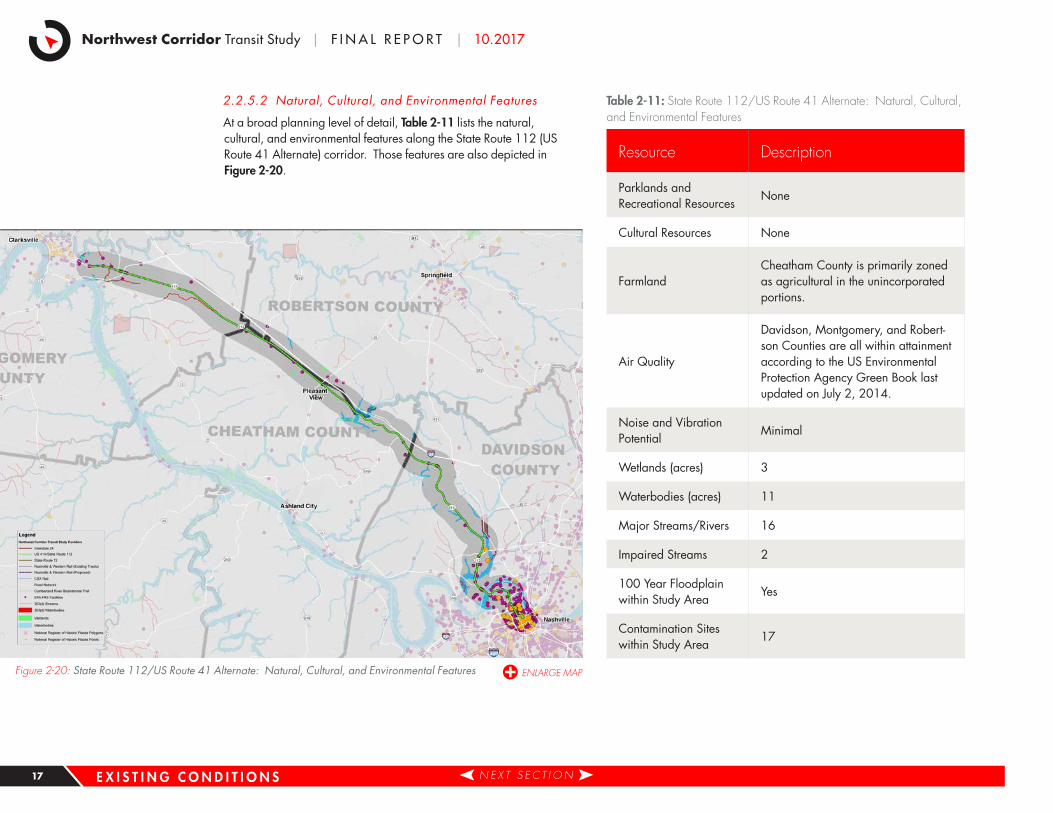
2.2.5.2 Natural, Cultural, and Environmental Features
At a broad planning level of detail, Table 2-11 lists the natural, cultural, and environmental features along the State Route 112 (US Route 41 Alternate) corridor. Those features are also depicted in Figure 2-20.
Figure 2-20: State Route 112/US Route 41 Alternate: Natural, Cultural, and Environmental Features
Table 2-11: State Route 112/US Route 41 Alternate: Natural, Cultural, and Environmental Features
Resource Description
Parklands and Recreational Resources
None
Cultural Resources None
FarmlandCheatham County is primarily zoned as agricultural in the unincorporated portions.
Air Quality
Davidson, Montgomery, and Robert-son Counties are all within attainment according to the US Environmental Protection Agency Green Book last updated on July 2, 2014.
Noise and Vibration Potential
Minimal
Wetlands (acres) 3
Waterbodies (acres) 11
Major Streams/Rivers 16
Impaired Streams 2
100 Year Floodplain within Study Area
Yes
Contamination Sites within Study Area
17
E X I S T I N G C O N D I T I O N S N E X T S E C T I O N 17
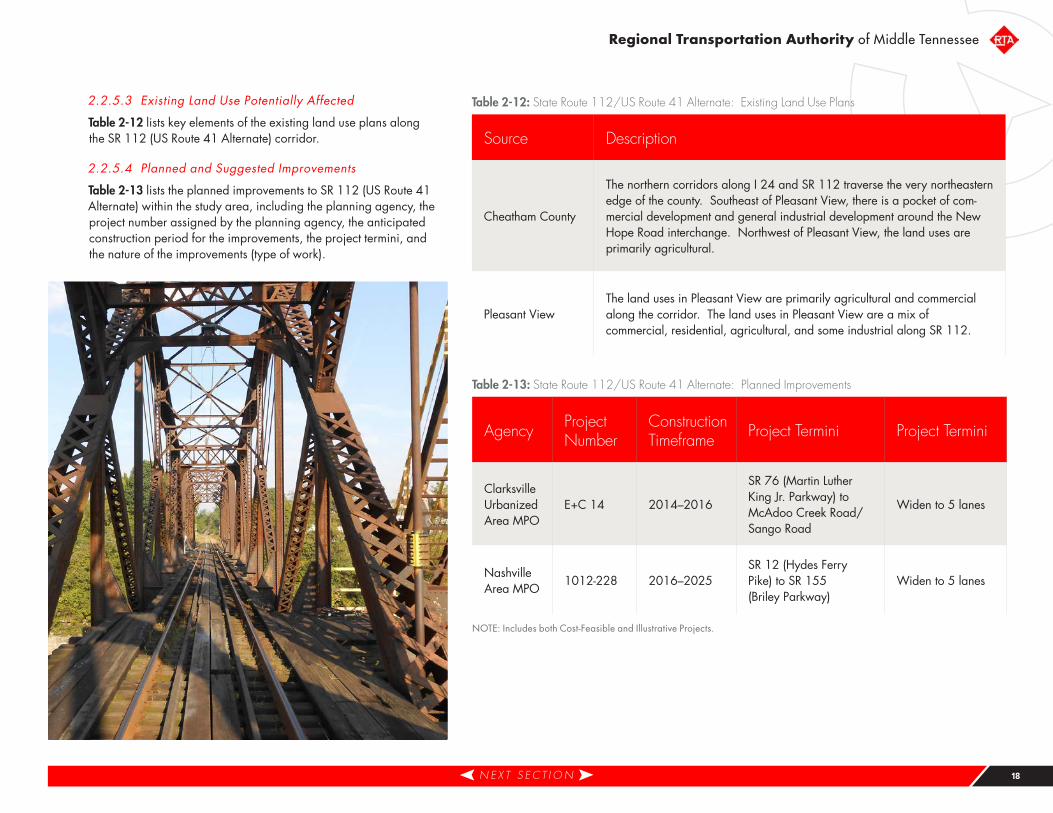
Regional Transportation Authority of Middle Tennessee
2.2.5.3 Existing Land Use Potentially Affected
Table 2-12 lists key elements of the existing land use plans along the SR 112 (US Route 41 Alternate) corridor.
2.2.5.4 Planned and Suggested Improvements
Table 2-13 lists the planned improvements to SR 112 (US Route 41 Alternate) within the study area, including the planning agency, the project number assigned by the planning agency, the anticipated construction period for the improvements, the project termini, and the nature of the improvements (type of work).
Table 2-12: State Route 112/US Route 41 Alternate: Existing Land Use Plans
Source Description
Cheatham County
The northern corridors along I 24 and SR 112 traverse the very northeastern edge of the county. Southeast of Pleasant View, there is a pocket of com-mercial development and general industrial development around the New Hope Road interchange. Northwest of Pleasant View, the land uses are primarily agricultural.
Pleasant ViewThe land uses in Pleasant View are primarily agricultural and commercial along the corridor. The land uses in Pleasant View are a mix of commercial, residential, agricultural, and some industrial along SR 112.
Table 2-13: State Route 112/US Route 41 Alternate: Planned Improvements
Agency Project Number
Construction Timeframe Project Termini Project Termini
Clarksville Urbanized Area MPO
E+C 14 2014–2016
SR 76 (Martin Luther King Jr. Parkway) to McAdoo Creek Road/Sango Road
Widen to 5 lanes
Nashville Area MPO
1012-228 2016–2025SR 12 (Hydes Ferry Pike) to SR 155 (Briley Parkway)
Widen to 5 lanes
NOTE: Includes both Cost-Feasible and Illustrative Projects.
N E X T S E C T I O N 18
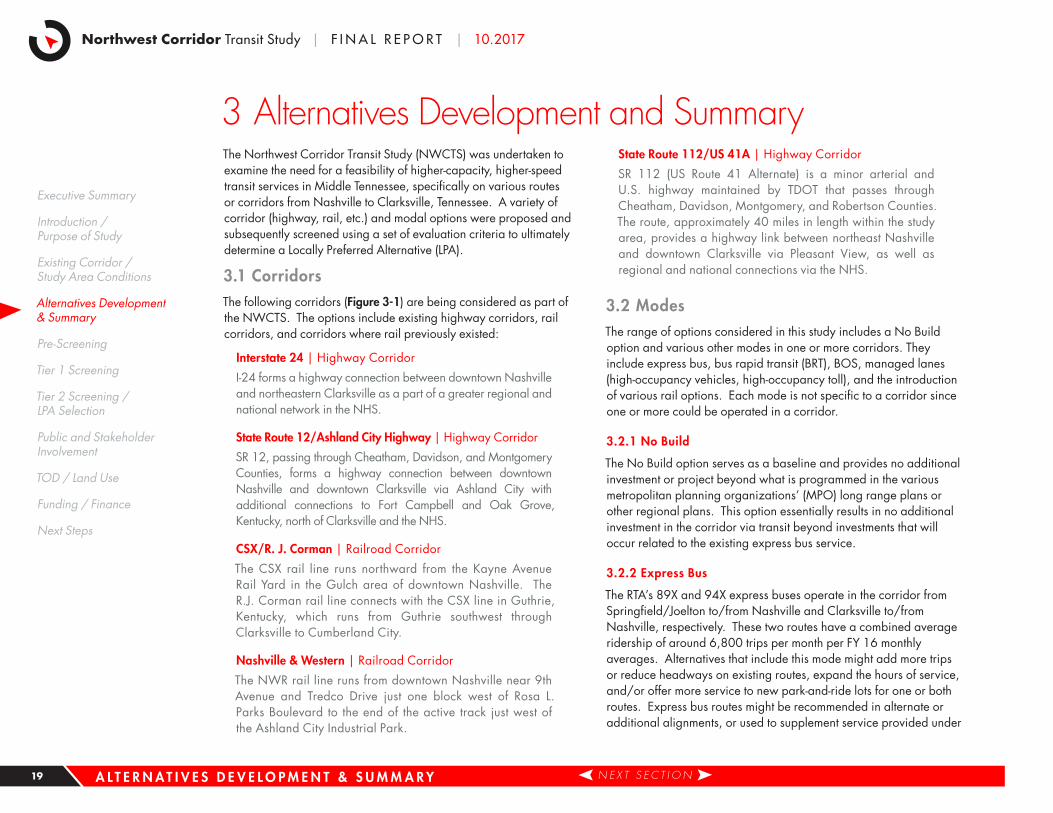
Northwest Corridor Transit Study | F I N A L R E P O R T | 10.2017
3 Alternatives Development and SummaryThe Northwest Corridor Transit Study (NWCTS) was undertaken to examine the need for a feasibility of higher-capacity, higher-speed transit services in Middle Tennessee, specifically on various routes or corridors from Nashville to Clarksville, Tennessee. A variety of corridor (highway, rail, etc.) and modal options were proposed and subsequently screened using a set of evaluation criteria to ultimately determine a Locally Preferred Alternative (LPA).
3 .1 CorridorsThe following corridors (Figure 3-1) are being considered as part of the NWCTS. The options include existing highway corridors, rail corridors, and corridors where rail previously existed:
Interstate 24 | Highway Corridor
I-24 forms a highway connection between downtown Nashville and northeastern Clarksville as a part of a greater regional and national network in the NHS.
State Route 12/Ashland City Highway | Highway Corridor
SR 12, passing through Cheatham, Davidson, and Montgomery Counties, forms a highway connection between downtown Nashville and downtown Clarksville via Ashland City with additional connections to Fort Campbell and Oak Grove, Kentucky, north of Clarksville and the NHS.
CSX/R . J . Corman | Railroad Corridor
The CSX rail line runs northward from the Kayne Avenue Rail Yard in the Gulch area of downtown Nashville. The R.J. Corman rail line connects with the CSX line in Guthrie, Kentucky, which runs from Guthrie southwest through Clarksville to Cumberland City.
Nashville & Western | Railroad Corridor
The NWR rail line runs from downtown Nashville near 9th Avenue and Tredco Drive just one block west of Rosa L. Parks Boulevard to the end of the active track just west of the Ashland City Industrial Park.
State Route 112/US 41A | Highway Corridor
SR 112 (US Route 41 Alternate) is a minor arterial and U.S. highway maintained by TDOT that passes through Cheatham, Davidson, Montgomery, and Robertson Counties. The route, approximately 40 miles in length within the study area, provides a highway link between northeast Nashville and downtown Clarksville via Pleasant View, as well as regional and national connections via the NHS.
3 .2 ModesThe range of options considered in this study includes a No Build option and various other modes in one or more corridors. They include express bus, bus rapid transit (BRT), BOS, managed lanes (high-occupancy vehicles, high-occupancy toll), and the introduction of various rail options. Each mode is not specific to a corridor since one or more could be operated in a corridor.
3 .2 .1 No Build
The No Build option serves as a baseline and provides no additional investment or project beyond what is programmed in the various metropolitan planning organizations’ (MPO) long range plans or other regional plans. This option essentially results in no additional investment in the corridor via transit beyond investments that will occur related to the existing express bus service.
3 .2 .2 Express Bus
The RTA’s 89X and 94X express buses operate in the corridor from Springfield/Joelton to/from Nashville and Clarksville to/from Nashville, respectively. These two routes have a combined average ridership of around 6,800 trips per month per FY 16 monthly averages. Alternatives that include this mode might add more trips or reduce headways on existing routes, expand the hours of service, and/or offer more service to new park-and-ride lots for one or both routes. Express bus routes might be recommended in alternate or additional alignments, or used to supplement service provided under
A L T E R N A T I V E S D E V E L O P M E N T & S U M M A R Y N E X T S E C T I O N
Executive Summary
Introduction / Purpose of Study
Existing Corridor / Study Area Conditions
Alternatives Development & Summary
Pre-Screening
Tier 1 Screening
Tier 2 Screening / LPA Selection
Public and Stakeholder Involvement
TOD / Land Use
Funding / Finance
Next Steps
19
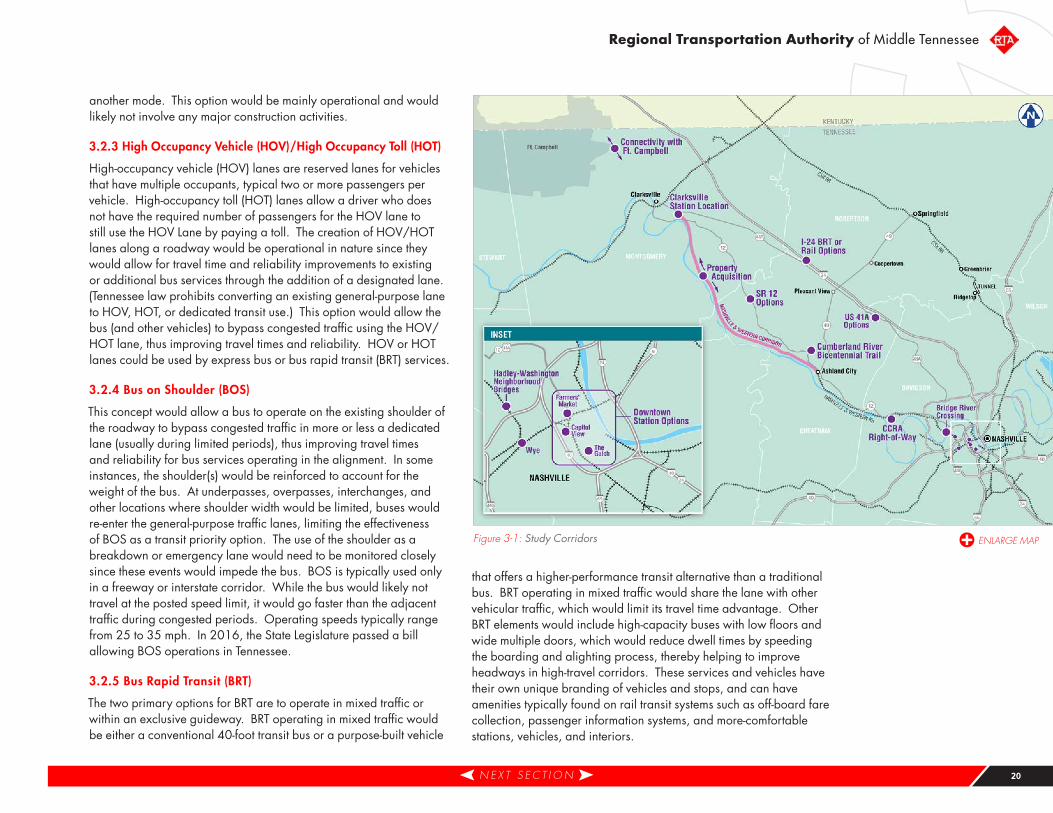
Regional Transportation Authority of Middle Tennessee
another mode. This option would be mainly operational and would likely not involve any major construction activities.
3 .2 .3 High Occupancy Vehicle (HOV)/High Occupancy Toll (HOT)
High-occupancy vehicle (HOV) lanes are reserved lanes for vehicles that have multiple occupants, typical two or more passengers per vehicle. High-occupancy toll (HOT) lanes allow a driver who does not have the required number of passengers for the HOV lane to still use the HOV Lane by paying a toll. The creation of HOV/HOT lanes along a roadway would be operational in nature since they would allow for travel time and reliability improvements to existing or additional bus services through the addition of a designated lane. (Tennessee law prohibits converting an existing general-purpose lane to HOV, HOT, or dedicated transit use.) This option would allow the bus (and other vehicles) to bypass congested traffic using the HOV/HOT lane, thus improving travel times and reliability. HOV or HOT lanes could be used by express bus or bus rapid transit (BRT) services.
3 .2 .4 Bus on Shoulder (BOS)
This concept would allow a bus to operate on the existing shoulder of the roadway to bypass congested traffic in more or less a dedicated lane (usually during limited periods), thus improving travel times and reliability for bus services operating in the alignment. In some instances, the shoulder(s) would be reinforced to account for the weight of the bus. At underpasses, overpasses, interchanges, and other locations where shoulder width would be limited, buses would re-enter the general-purpose traffic lanes, limiting the effectiveness of BOS as a transit priority option. The use of the shoulder as a breakdown or emergency lane would need to be monitored closely since these events would impede the bus. BOS is typically used only in a freeway or interstate corridor. While the bus would likely not travel at the posted speed limit, it would go faster than the adjacent traffic during congested periods. Operating speeds typically range from 25 to 35 mph. In 2016, the State Legislature passed a bill allowing BOS operations in Tennessee.
3 .2 .5 Bus Rapid Transit (BRT)
The two primary options for BRT are to operate in mixed traffic or within an exclusive guideway. BRT operating in mixed traffic would be either a conventional 40-foot transit bus or a purpose-built vehicle
that offers a higher-performance transit alternative than a traditional bus. BRT operating in mixed traffic would share the lane with other vehicular traffic, which would limit its travel time advantage. Other BRT elements would include high-capacity buses with low floors and wide multiple doors, which would reduce dwell times by speeding the boarding and alighting process, thereby helping to improve headways in high-travel corridors. These services and vehicles have their own unique branding of vehicles and stops, and can have amenities typically found on rail transit systems such as off-board fare collection, passenger information systems, and more-comfortable stations, vehicles, and interiors.
Figure 3-1: Study Corridors
N E X T S E C T I O N 20
Northwest Corridor Transit Study | F I N A L R E P O R T | 10.2017
BRT operating in an exclusive guideway would mimic several rail transit characteristics while offering more flexibility to serve destinations with a vehicle that has rubber tires, which would allow the vehicle to operate both on and off the guideway. BRT exclusive guideways range from grade-separated roadways for exclusive bus use, to part- or full-time exclusive lanes running alongside general-purpose lanes. Exclusive-guideway BRT also features low-floor high-capacity vehicles and passenger amenities. To the riding public, BRT in an exclusive guideway can look, feel, and perform like rail transit, with service that is more frequent and faster than auto traffic. BRT stations would be designed to incorporate elements that reflect the unique characteristics of the community and that often become neighborhood focal points, suggesting the potential for transit-oriented development (TOD). BRT vehicles provide smooth, quiet comfort at average speeds of up to twice those of conventional buses or of buses in mixed traffic.
3 .2 .6 Streetcar
Streetcars are a form of an electric railway system that operates single or multiple cars in mixed traffic or in a fixed guideway at ground level. Streetcars are smaller rail vehicles that can operate along narrower streets and have tighter turning capabilities than modern light rail vehicles, which tend to be larger. Streetcars typically operate at the speeds of adjacent traffic and board and discharge passengers at station platforms or at street, track, or car-floor level. Streetcars are normally powered by overhead electrical wires (catenaries), although emerging battery technology allows them to travel short distances “off the wire.” Streetcars typically operate in an urban environment with short-stop spacing similar to that of a local bus route.
3 .2 .7 Light Rail Transit (LRT)
Light rail transit (LRT) is an electric railway system similar to streetcars that uses single or multiple cars along fixed ROWs at ground level, on aerial structures, in subways, or in streets, but typically uses dedicated or semi-dedicated rail alignments and fixed, substantial stations. LRT tends to have higher operating speeds, larger vehicles, and greater passenger capacity than streetcars. Passengers are
able to board and alight at station platforms or at street, track, or car-floor level. LRT is normally powered by overhead electrical wires (catenary). LRT operates in both urban and suburban environments and covers longer distances than streetcars.
3 .2 .8 Commuter Rail
Commuter rail operates single or multiple cars that are either self-propelled (in the case of a diesel multiple units [DMU]), or locomotive-hauled (with either diesel-electric propulsion or electric multiple unit propulsion) and operate on fixed and exclusive rail lines, often sharing them with freight rail. Commuter rail tends to have high operating speeds, widely spaced stations, larger vehicles, and the greatest passenger capacity of rail options. Trains typically board and discharge passengers at high-level station platforms. Commuter rail operates over long distances, typically from suburban areas into downtowns with lines of roughly 20 or more miles.
3 .3 Evaluation FrameworkThe evaluation framework used for the NWCTS consisted of a pre-screening stage followed by a two-tiered screening process (Table 3-1). The pre-screening stage sought to identify the range of mode and corridor options, representing various transit alternatives that may be carried forward for further analysis. Tier 1 Screening evaluated each alignment and technology advanced from pre-screening to assist the project team in determining a smaller set of the most viable transit alternatives. Tier 1 Screening used qualitative information, subjective measures, and quantitative data where available. Tier 2 Screening evaluated the narrowed and shorter list of full corridor alternatives at a level of detail sufficient for local decision-makers to select an LPA in short, medium and long-term time frames.
The following diagram (Figure 3-2) illustrates the process further. As the screening proceeds down the left side from Pre-Screening to Tiers 1 and 2, the number of alternatives decreases from a larger universe of projects to a handful of the most promising or refined, while the depth and breadth of the evaluation data increases and transitions from qualitative Fatal Flaw information and evaluation to more Detailed Analyses that is largely quantitative.
A L T E R N A T I V E S D E V E L O P M E N T & S U M M A R Y N E X T S E C T I O N 21
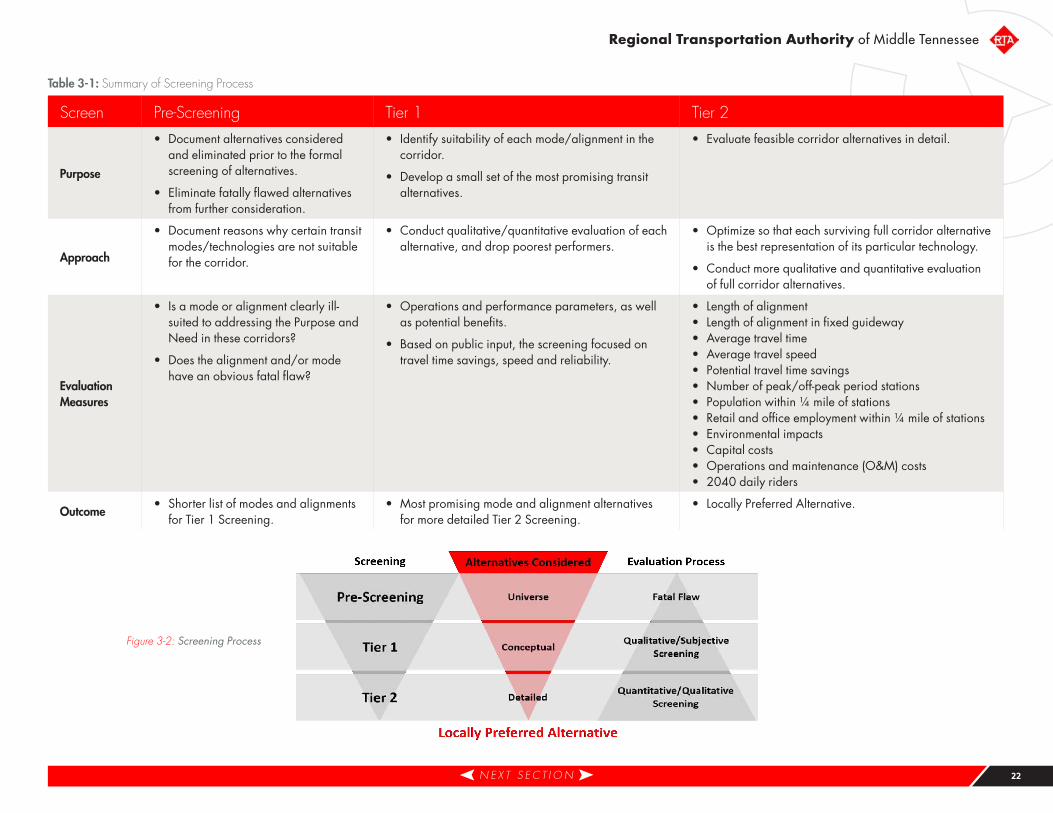
Regional Transportation Authority of Middle Tennessee
Table 3-1: Summary of Screening Process
Screen Pre-Screening Tier 1 Tier 2
Purpose
• Document alternatives considered and eliminated prior to the formal screening of alternatives.
• Eliminate fatally flawed alternatives from further consideration.
• Identify suitability of each mode/alignment in the corridor.
• Develop a small set of the most promising transit alternatives.
• Evaluate feasible corridor alternatives in detail.
Approach
• Document reasons why certain transit modes/technologies are not suitable for the corridor.
• Conduct qualitative/quantitative evaluation of each alternative, and drop poorest performers.
• Optimize so that each surviving full corridor alternative is the best representation of its particular technology.
• Conduct more qualitative and quantitative evaluation of full corridor alternatives.
Evaluation Measures
• Is a mode or alignment clearly ill-suited to addressing the Purpose and Need in these corridors?
• Does the alignment and/or mode have an obvious fatal flaw?
• Operations and performance parameters, as well as potential benefits.
• Based on public input, the screening focused on travel time savings, speed and reliability.
• Length of alignment• Length of alignment in fixed guideway• Average travel time• Average travel speed• Potential travel time savings• Number of peak/off-peak period stations• Population within ¼ mile of stations• Retail and office employment within ¼ mile of stations• Environmental impacts• Capital costs• Operations and maintenance (O&M) costs• 2040 daily riders
Outcome• Shorter list of modes and alignments
for Tier 1 Screening.• Most promising mode and alignment alternatives
for more detailed Tier 2 Screening.• Locally Preferred Alternative.
Figure 3-2: Screening Process
N E X T S E C T I O N 22
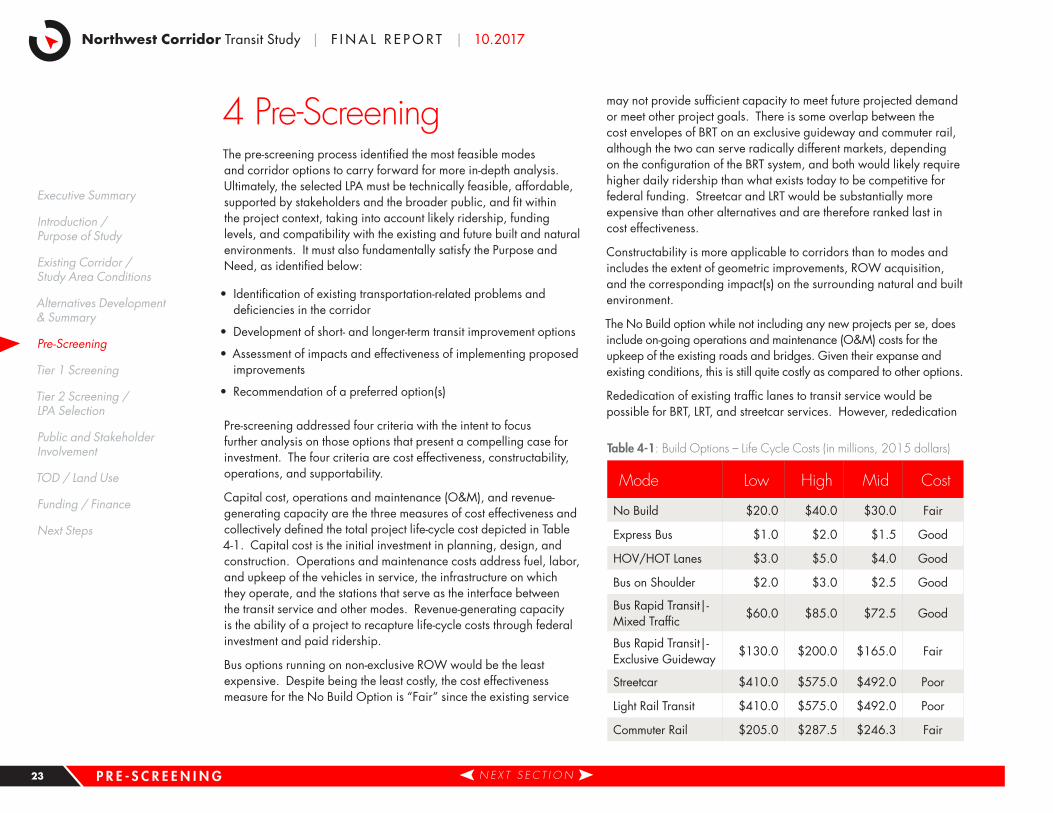
Northwest Corridor Transit Study | F I N A L R E P O R T | 10.2017
4 Pre-ScreeningThe pre-screening process identified the most feasible modes and corridor options to carry forward for more in-depth analysis. Ultimately, the selected LPA must be technically feasible, affordable, supported by stakeholders and the broader public, and fit within the project context, taking into account likely ridership, funding levels, and compatibility with the existing and future built and natural environments. It must also fundamentally satisfy the Purpose and Need, as identified below:
• Identification of existing transportation-related problems and deficiencies in the corridor
• Development of short- and longer-term transit improvement options
• Assessment of impacts and effectiveness of implementing proposed improvements
• Recommendation of a preferred option(s)
Pre-screening addressed four criteria with the intent to focus further analysis on those options that present a compelling case for investment. The four criteria are cost effectiveness, constructability, operations, and supportability.
Capital cost, operations and maintenance (O&M), and revenue-generating capacity are the three measures of cost effectiveness and collectively defined the total project life-cycle cost depicted in Table 4-1. Capital cost is the initial investment in planning, design, and construction. Operations and maintenance costs address fuel, labor, and upkeep of the vehicles in service, the infrastructure on which they operate, and the stations that serve as the interface between the transit service and other modes. Revenue-generating capacity is the ability of a project to recapture life-cycle costs through federal investment and paid ridership.
Bus options running on non-exclusive ROW would be the least expensive. Despite being the least costly, the cost effectiveness measure for the No Build Option is “Fair” since the existing service
may not provide sufficient capacity to meet future projected demand or meet other project goals. There is some overlap between the cost envelopes of BRT on an exclusive guideway and commuter rail, although the two can serve radically different markets, depending on the configuration of the BRT system, and both would likely require higher daily ridership than what exists today to be competitive for federal funding. Streetcar and LRT would be substantially more expensive than other alternatives and are therefore ranked last in cost effectiveness.
Constructability is more applicable to corridors than to modes and includes the extent of geometric improvements, ROW acquisition, and the corresponding impact(s) on the surrounding natural and built environment.
The No Build option while not including any new projects per se, does include on-going operations and maintenance (O&M) costs for the upkeep of the existing roads and bridges. Given their expanse and existing conditions, this is still quite costly as compared to other options.
Rededication of existing traffic lanes to transit service would be possible for BRT, LRT, and streetcar services. However, rededication
Table 4-1: Build Options – Life Cycle Costs (in millions, 2015 dollars)
Mode Low High Mid Cost
No Build $20.0 $40.0 $30.0 Fair
Express Bus $1.0 $2.0 $1.5 Good
HOV/HOT Lanes $3.0 $5.0 $4.0 Good
Bus on Shoulder $2.0 $3.0 $2.5 Good
Bus Rapid Transit|-Mixed Traffic
$60.0 $85.0 $72.5 Good
Bus Rapid Transit|-Exclusive Guideway
$130.0 $200.0 $165.0 Fair
Streetcar $410.0 $575.0 $492.0 Poor
Light Rail Transit $410.0 $575.0 $492.0 Poor
Commuter Rail $205.0 $287.5 $246.3 Fair
P R E - S C R E E N I N G N E X T S E C T I O N
Executive Summary
Introduction / Purpose of Study
Existing Corridor / Study Area Conditions
Alternatives Development & Summary
Pre-Screening
Tier 1 Screening
Tier 2 Screening / LPA Selection
Public and Stakeholder Involvement
TOD / Land Use
Funding / Finance
Next Steps
23
Regional Transportation Authority of Middle Tennessee
of an existing traffic lane would not be a practical option since many of the roadways are at or near capacity during peak hours or will be in future years. Thus, taking a lane for exclusive guideway transit operations would not be feasible because of degraded traffic operations that would result. Mixed-traffic operations for BRT, LRT and streetcar would not be practical since the ability to increase travel speeds and reliability would be severely compromised, and the investment in the guideway diminished.
Considering these limitations, running in the existing roadway for exclusive BRT, LRT, and streetcar alternatives does not appear to be a feasible alternative on highway ROWs for BRT or rail options. As for exclusive mixed-traffic and exclusive BRT, while the impacts would still be significant, it is conceivable that in some segments of some of the corridors, sufficient width exists to provide one lane of widening in each direction to accommodate a dedicated lane.
Commuter rail presents a different set of challenges related to the implementation of the existing CSX/R.J. Corman and NWR rail corridors. The existing rail system along the CSX/R.J. Corman line is heavily used and is at or near capacity. Any expansions in terms of customer base would be problematic for CSX to accommodate within the existing capacity of the rail lines. In addition, recent communications from CSX indicate that they have little interest in accommodating a passenger rail operation on this segment of their rail line.
The NWR corridor is a more lightly used short line rail corridor. It operates only from Nashville to near Ashland City. Speed on this line is restricted because of track condition and configuration, and the line would require upgrades to allow trains to operate at speeds typical of modern passenger rail services. Preliminary indications are that the owners of the line are willing to consider passenger rail service in the corridor.
Operational feasibility is a measure of the ability to generate ridership and operate without significant impacts to existing traffic operations. Bus service in general would offer a great deal of flexibility to provide expanded transit capacity with a minimal impact to existing traffic operations. Expanded Express Bus service and BRT options (either in mixed traffic or on dedicated lanes) would offer advantages in terms of operability.
Due to constructability limitations precluding operations in mixed traffic, LRT and streetcar modes would operate on parallel tracks. Any necessary gating of intersections with cross streets and the resulting access interruptions to residences and businesses fronting SR 12/Ashland City Highway and/or US 41A would represent a significant loss of utility and would likely generate significant opposition to the project.
For the NWR corridor, commuter rail in a rail-only ROW would not affect operations on arterial highways or interstates from Nashville to Ashland City. However, from Ashland City to Clarksville, the rail ROW would need to be reestablished and the existing trail relocated. Commuter trains would operate along with the existing freight traffic and would need temporal separation with caveats in an operating agreement to preclude potential schedule conflicts.
To evaluate the alternatives in terms of public support, open house-style meetings were held in April 2015, in Clarksville, Ashland City, and North Nashville. A total of 106 people participated. The purpose of the NWCTS was explained and participants were asked to comment on display maps during the public meetings and to fill out a comment card. The NWCTS website also gave interested parties an opportunity to make comments on a “crowdsource” map.
As part of the open house meetings, participants were surveyed regarding their corridor preferences. Forty participants selected the NWR corridor, which was the most popular corridor. I 24, for both bus and rail modes, received 30 votes and the CSX/R.J. Corman corridor followed closely with 25 votes. Twelve participants chose the SR 12/Ashland City highway corridor and 5 participants chose the SR 112/US 41A corridor, which proved to be the two least popular corridors.
The rail modes were the most popular transit modes chosen by participants. Thirty-two participants chose the commuter rail mode and 26 participants chose LRT. The Express Bus followed the LRT closely with 23 votes, and BRT received 13 votes. The streetcar was the least favored mode with zero votes.
Lastly, modes such as monorail, people mover and subway were also eliminated as not suitable for the corridor given their costs, operating characteristics and their ability to serve the corridor.
N E X T S E C T I O N 24
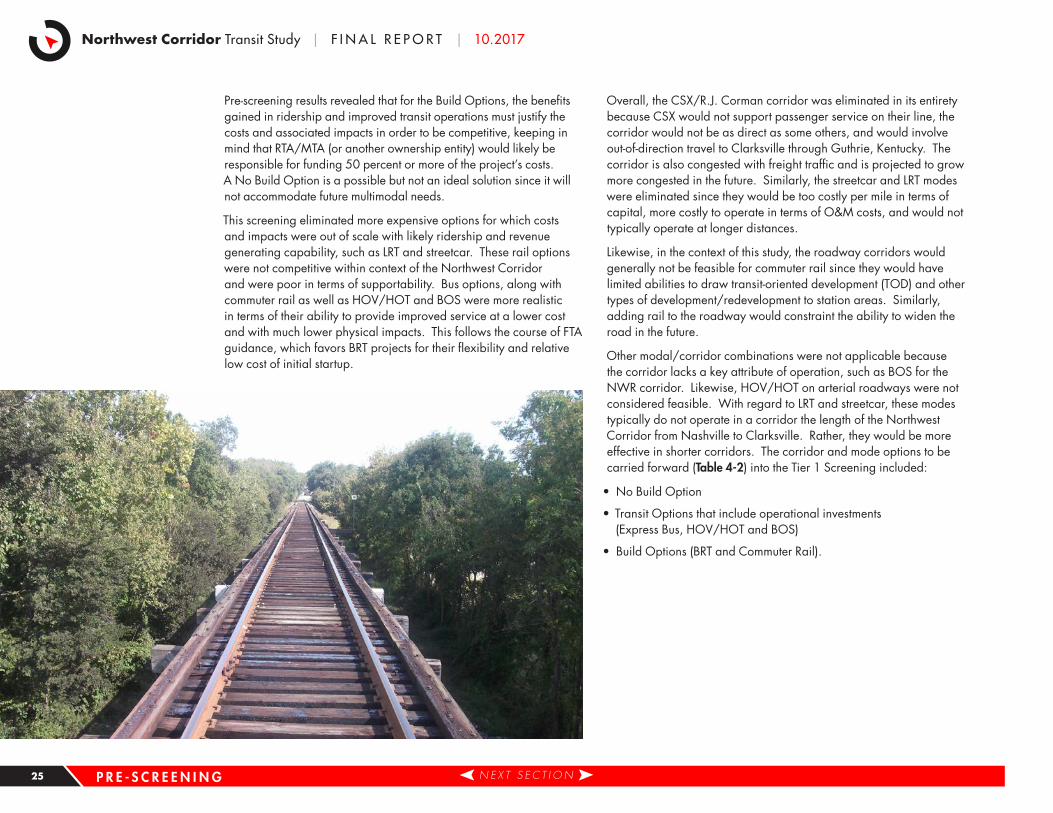
Northwest Corridor Transit Study | F I N A L R E P O R T | 10.2017
Pre-screening results revealed that for the Build Options, the benefits gained in ridership and improved transit operations must justify the costs and associated impacts in order to be competitive, keeping in mind that RTA/MTA (or another ownership entity) would likely be responsible for funding 50 percent or more of the project’s costs. A No Build Option is a possible but not an ideal solution since it will not accommodate future multimodal needs.
This screening eliminated more expensive options for which costs and impacts were out of scale with likely ridership and revenue generating capability, such as LRT and streetcar. These rail options were not competitive within context of the Northwest Corridor and were poor in terms of supportability. Bus options, along with commuter rail as well as HOV/HOT and BOS were more realistic in terms of their ability to provide improved service at a lower cost and with much lower physical impacts. This follows the course of FTA guidance, which favors BRT projects for their flexibility and relative low cost of initial startup.
Overall, the CSX/R.J. Corman corridor was eliminated in its entirety because CSX would not support passenger service on their line, the corridor would not be as direct as some others, and would involve out-of-direction travel to Clarksville through Guthrie, Kentucky. The corridor is also congested with freight traffic and is projected to grow more congested in the future. Similarly, the streetcar and LRT modes were eliminated since they would be too costly per mile in terms of capital, more costly to operate in terms of O&M costs, and would not typically operate at longer distances.
Likewise, in the context of this study, the roadway corridors would generally not be feasible for commuter rail since they would have limited abilities to draw transit-oriented development (TOD) and other types of development/redevelopment to station areas. Similarly, adding rail to the roadway would constraint the ability to widen the road in the future.
Other modal/corridor combinations were not applicable because the corridor lacks a key attribute of operation, such as BOS for the NWR corridor. Likewise, HOV/HOT on arterial roadways were not considered feasible. With regard to LRT and streetcar, these modes typically do not operate in a corridor the length of the Northwest Corridor from Nashville to Clarksville. Rather, they would be more effective in shorter corridors. The corridor and mode options to be carried forward (Table 4-2) into the Tier 1 Screening included:
• No Build Option
• Transit Options that include operational investments (Express Bus, HOV/HOT and BOS)
• Build Options (BRT and Commuter Rail).
P R E - S C R E E N I N G N E X T S E C T I O N 25
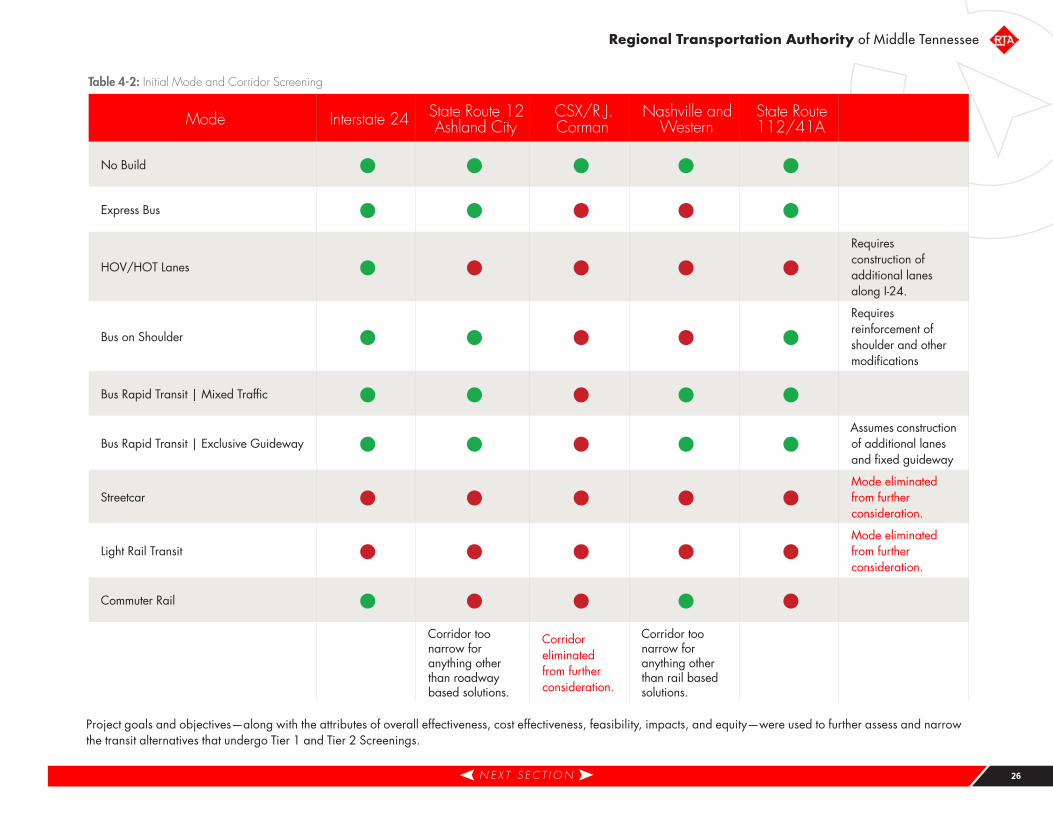
Regional Transportation Authority of Middle Tennessee
Table 4-2: Initial Mode and Corridor Screening
Mode Interstate 24 State Route 12 Ashland City
CSX/R.J. Corman
Nashville and Western
State Route 112/41A
No Build • • • • •Express Bus • • • • •HOV/HOT Lanes • • • • •
Requires construction of additional lanes along I-24.
Bus on Shoulder • • • • •Requires reinforcement of shoulder and other modifications
Bus Rapid Transit | Mixed Traffic • • • • •Bus Rapid Transit | Exclusive Guideway • • • • •
Assumes construction of additional lanes and fixed guideway
Streetcar • • • • •Mode eliminated from further consideration.
Light Rail Transit • • • • •Mode eliminated from further consideration.
Commuter Rail • • • • •Corridor too narrow for anything other than roadway based solutions.
Corridor eliminated from further consideration.
Corridor too narrow for anything other than rail based solutions.
Project goals and objectives—along with the attributes of overall effectiveness, cost effectiveness, feasibility, impacts, and equity—were used to further assess and narrow the transit alternatives that undergo Tier 1 and Tier 2 Screenings.
N E X T S E C T I O N 26
Northwest Corridor Transit Study | F I N A L R E P O R T | 10.2017
5 Tier 1 ScreeningIn the Tier 1 Screening, the project focused on the remaining options that survived from the Pre Screening. Those included:
• No Build Option
• Express Bus
• HOV/HOT
• BOS
• BRT
• Commuter Rail
The screening focused on operations and performance measures at a high level, including:
• Operations
• Environmental Impacts
• Population and Employment
• Costs and Ridership
The screening criteria focused on quantitative data rather than qualitative data. However, where applicable, a mixture of both was used. This round of screening focused on travel time savings, speed, and reliability as measures that most mattered based on stakeholder feedback.
5 .1 OperationsThe length of the alignment is a standard measure used in transit and transportation planning. It helps determine O&M costs, which are based on operating mileage. The length in fixed (exclusive) guideway helps determine travel speed and travel time since exclusive guideway allows the vehicle to travel unimpeded. An exclusive guideway also helps with reliability since no other vehicles are in the alignment competing for capacity. Thus, options that use an exclusive guideway for most or all of their operations are superior to options that share the guideway with other traffic, either freight rail or general-purpose rubber-tired vehicle traffic.
For the options under consideration, the benchmark to measure against is the existing 94X express bus, which uses I-24 in mixed traffic, not on an exclusive guideway. The express bus has an existing (2015) average travel time of about 55 minutes. Options that run in I-24 would offer a slight travel-time advantage compared to options that would operate in an arterial highway alignment, since they would offer higher speeds. The arterial BRT and express bus options along SR 12 and US 41 would not offer any travel-time savings since they would have a longer more circuitous path and have a slower average travel speed and lower speed limit characteristic of an arterial roadway.
The commuter rail option would offer the most potential for reduced travel time since it would operate in an exclusive environment and thus would travel the fastest. While it would have the most stations, the peak-period schedule would have some trips that operate in express mode, with the trains stopping at only four or five of the planned stations on morning and afternoon trips, which are largely commuter-oriented periods, depending on the operating plan.
5 .2 Stations, Environment and EmploymentThe numbers and types of stations helps to determine impacts on the natural and human environments during their construction and operation. The number and type also affects the capital costs and the potential ridership. Most of the bus and rubber-tired options would have only a few stations and thus would have limited potential for producing positive employment impacts. The existing service along I-24 stops at only two to three stations, depending on trip, including the terminal at Music City Central in downtown Nashville. All of the
T I E R 1 S C R E E N I N G N E X T S E C T I O N
Executive Summary
Introduction / Purpose of Study
Existing Corridor / Study Area Conditions
Alternatives Development & Summary
Pre-Screening
Tier 1 Screening
Tier 2 Screening / LPA Selection
Public and Stakeholder Involvement
TOD / Land Use
Funding / Finance
Next Steps
27
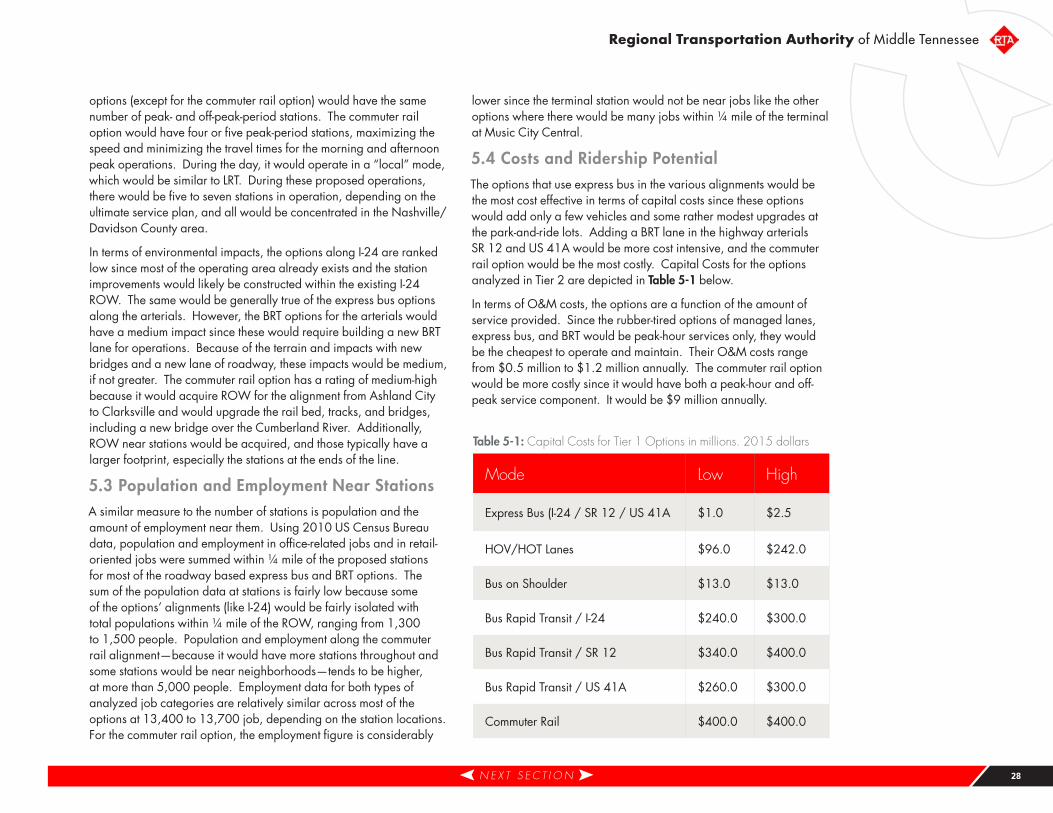
Regional Transportation Authority of Middle Tennessee
options (except for the commuter rail option) would have the same number of peak- and off-peak-period stations. The commuter rail option would have four or five peak-period stations, maximizing the speed and minimizing the travel times for the morning and afternoon peak operations. During the day, it would operate in a “local” mode, which would be similar to LRT. During these proposed operations, there would be five to seven stations in operation, depending on the ultimate service plan, and all would be concentrated in the Nashville/Davidson County area.
In terms of environmental impacts, the options along I-24 are ranked low since most of the operating area already exists and the station improvements would likely be constructed within the existing I-24 ROW. The same would be generally true of the express bus options along the arterials. However, the BRT options for the arterials would have a medium impact since these would require building a new BRT lane for operations. Because of the terrain and impacts with new bridges and a new lane of roadway, these impacts would be medium, if not greater. The commuter rail option has a rating of medium-high because it would acquire ROW for the alignment from Ashland City to Clarksville and would upgrade the rail bed, tracks, and bridges, including a new bridge over the Cumberland River. Additionally, ROW near stations would be acquired, and those typically have a larger footprint, especially the stations at the ends of the line.
5 .3 Population and Employment Near StationsA similar measure to the number of stations is population and the amount of employment near them. Using 2010 US Census Bureau data, population and employment in office-related jobs and in retail-oriented jobs were summed within ¼ mile of the proposed stations for most of the roadway based express bus and BRT options. The sum of the population data at stations is fairly low because some of the options’ alignments (like I-24) would be fairly isolated with total populations within ¼ mile of the ROW, ranging from 1,300 to 1,500 people. Population and employment along the commuter rail alignment—because it would have more stations throughout and some stations would be near neighborhoods—tends to be higher, at more than 5,000 people. Employment data for both types of analyzed job categories are relatively similar across most of the options at 13,400 to 13,700 job, depending on the station locations. For the commuter rail option, the employment figure is considerably
lower since the terminal station would not be near jobs like the other options where there would be many jobs within ¼ mile of the terminal at Music City Central.
5 .4 Costs and Ridership PotentialThe options that use express bus in the various alignments would be the most cost effective in terms of capital costs since these options would add only a few vehicles and some rather modest upgrades at the park-and-ride lots. Adding a BRT lane in the highway arterials SR 12 and US 41A would be more cost intensive, and the commuter rail option would be the most costly. Capital Costs for the options analyzed in Tier 2 are depicted in Table 5-1 below.
In terms of O&M costs, the options are a function of the amount of service provided. Since the rubber-tired options of managed lanes, express bus, and BRT would be peak-hour services only, they would be the cheapest to operate and maintain. Their O&M costs range from $0.5 million to $1.2 million annually. The commuter rail option would be more costly since it would have both a peak-hour and off-peak service component. It would be $9 million annually.
Table 5-1: Capital Costs for Tier 1 Options in millions. 2015 dollars
Mode Low High
Express Bus (I-24 / SR 12 / US 41A $1.0 $2.5
HOV/HOT Lanes $96.0 $242.0
Bus on Shoulder $13.0 $13.0
Bus Rapid Transit / I-24 $240.0 $300.0
Bus Rapid Transit / SR 12 $340.0 $400.0
Bus Rapid Transit / US 41A $260.0 $300.0
Commuter Rail $400.0 $400.0
N E X T S E C T I O N 28
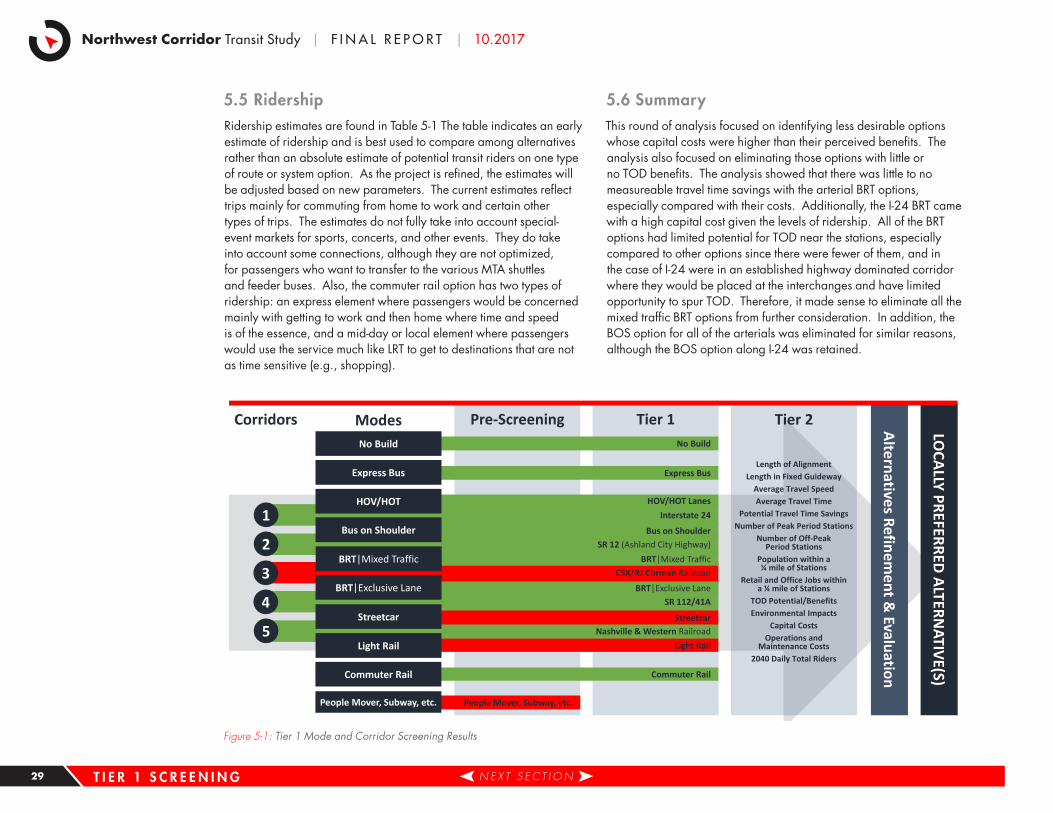
Northwest Corridor Transit Study | F I N A L R E P O R T | 10.2017
5 .5 Ridership Ridership estimates are found in Table 5-1 The table indicates an early estimate of ridership and is best used to compare among alternatives rather than an absolute estimate of potential transit riders on one type of route or system option. As the project is refined, the estimates will be adjusted based on new parameters. The current estimates reflect trips mainly for commuting from home to work and certain other types of trips. The estimates do not fully take into account special-event markets for sports, concerts, and other events. They do take into account some connections, although they are not optimized, for passengers who want to transfer to the various MTA shuttles and feeder buses. Also, the commuter rail option has two types of ridership: an express element where passengers would be concerned mainly with getting to work and then home where time and speed is of the essence, and a mid-day or local element where passengers would use the service much like LRT to get to destinations that are not as time sensitive (e.g., shopping).
5 .6 SummaryThis round of analysis focused on identifying less desirable options whose capital costs were higher than their perceived benefits. The analysis also focused on eliminating those options with little or no TOD benefits. The analysis showed that there was little to no measureable travel time savings with the arterial BRT options, especially compared with their costs. Additionally, the I-24 BRT came with a high capital cost given the levels of ridership. All of the BRT options had limited potential for TOD near the stations, especially compared to other options since there were fewer of them, and in the case of I-24 were in an established highway dominated corridor where they would be placed at the interchanges and have limited opportunity to spur TOD. Therefore, it made sense to eliminate all the mixed traffic BRT options from further consideration. In addition, the BOS option for all of the arterials was eliminated for similar reasons, although the BOS option along I-24 was retained.
Nashville & Western Railroad
SR 112/41A
CSX/RJ Corman Railroad
SR 12 (Ashland City Highway)
Interstate 24
LOCALLY PREFERRED ALTERN
ATIVE(S)
ModesCorridors Pre-Screening Tier 1 Tier 2
Express Bus
1
2
3
4
5
HOV/HOT Lanes
Bus on Shoulder
BRT|Mixed Traffic
BRT|Exclusive Lane
Streetcar
Light Rail
Commuter Rail
People Mover, Subway, etc.
Express Bus
HOV/HOT
Bus on Shoulder
BRT|Mixed Traffic
BRT|Exclusive Lane
Streetcar
Light Rail
Commuter Rail
People Mover, Subway, etc.
Alternatives Refinement &
Evaluation
No BuildNo Build
Length of AlignmentLength in Fixed Guideway
Average Travel SpeedAverage Travel Time
Potential Travel Time SavingsNumber of Peak Period Stations
Number of Off-Peak Period Stations
Population within a ¼ mile of Stations
Retail and Office Jobs within a ¼ mile of Stations
TOD Potential/BenefitsEnvironmental Impacts
Capital CostsOperations and
Maintenance Costs2040 Daily Total Riders
Figure 5-1: Tier 1 Mode and Corridor Screening Results
T I E R 1 S C R E E N I N G N E X T S E C T I O N 29
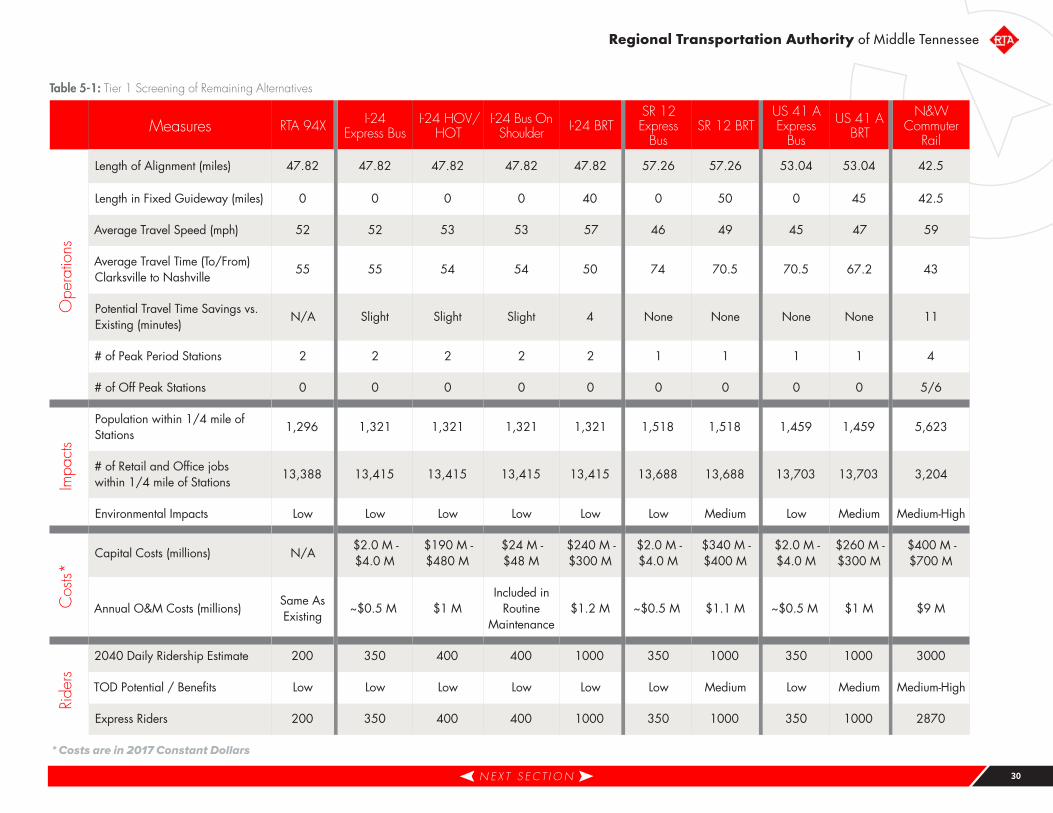
Regional Transportation Authority of Middle Tennessee
N E X T S E C T I O N
Table 5-1: Tier 1 Screening of Remaining Alternatives
Measures RTA 94X I-24 Express Bus
I-24 HOV/HOT
I-24 Bus On Shoulder I-24 BRT
SR 12 Express
BusSR 12 BRT
US 41 A Express
Bus
US 41 A BRT
N&W Commuter
Rail
Length of Alignment (miles) 47.82 47.82 47.82 47.82 47.82 57.26 57.26 53.04 53.04 42.5
Length in Fixed Guideway (miles) 0 0 0 0 40 0 50 0 45 42.5
Average Travel Speed (mph) 52 52 53 53 57 46 49 45 47 59
Average Travel Time (To/From) Clarksville to Nashville
55 55 54 54 50 74 70.5 70.5 67.2 43
Potential Travel Time Savings vs. Existing (minutes)
N/A Slight Slight Slight 4 None None None None 11
# of Peak Period Stations 2 2 2 2 2 1 1 1 1 4
# of Off Peak Stations 0 0 0 0 0 0 0 0 0 5/6
Population within 1/4 mile of Stations
1,296 1,321 1,321 1,321 1,321 1,518 1,518 1,459 1,459 5,623
# of Retail and Office jobs within 1/4 mile of Stations
13,388 13,415 13,415 13,415 13,415 13,688 13,688 13,703 13,703 3,204
Environmental Impacts Low Low Low Low Low Low Medium Low Medium Medium-High
Capital Costs (millions) N/A$2.0 M - $4.0 M
$190 M - $480 M
$24 M - $48 M
$240 M - $300 M
$2.0 M - $4.0 M
$340 M - $400 M
$2.0 M - $4.0 M
$260 M - $300 M
$400 M - $700 M
Annual O&M Costs (millions)Same As Existing
~$0.5 M $1 MIncluded in
Routine Maintenance
$1.2 M ~$0.5 M $1.1 M ~$0.5 M $1 M $9 M
2040 Daily Ridership Estimate 200 350 400 400 1000 350 1000 350 1000 3000
TOD Potential / Benefits Low Low Low Low Low Low Medium Low Medium Medium-High
Express Riders 200 350 400 400 1000 350 1000 350 1000 2870
* Costs are in 2017 Constant Dollars
Ope
ratio
nsIm
pact
sC
osts*
Ride
rs
30
Northwest Corridor Transit Study | F I N A L R E P O R T | 10.2017
6 Tier 2 Screening / LPA SelectionAfter the Pre Screening and the elimination of unfeasible modes (monorail, people mover, subway, etc.), the attention turned to identifying the modes that would be most suitable given the corridor’s characteristics. Tier 1 then further screened out streetcar and light rail transit since these technologies would be better suited for corridors that are shorter in length and not 40 miles plus in length. Additionally, this screening eliminated all the BRT options in mixed traffic.
Early in the evaluation process, it also became clear that some corridors would be more suitable for certain modes. For instance, the I-24 and SR 12 (Ashland City Highway) and SR 112/US 41A would be more suitable for something with rubber tires or wheels (express bus, BRT) than they would be for rail modes. Highway geometry differs from rail related geometry. Similarly, the NWR corridor—because it is an active rail corridor—would be most suited for commuter rail. After clarifying the mode and corridor options, which essentially limited them, the Tier 2 screening proceeded.
6 .1 AlternativesThe remaining options and corridors were therefore subject to further screening in Tier 2 screening:
• No Build• Express Bus (I 24, SR 12, SR 112/US 41A)• HOV/HOT Lanes• Bus on Shoulder • Bus Rapid Transit (Fixed Guideway along I 24, SR 12,
SR 112/US 41A)• Commuter Rail
6 .2 Screening MeasuresIn this tier of screening, more emphasis was placed on determining operating characteristics and the performance, benefits, and impacts of the options, which were quantified. Tier 2 screening measures of effectiveness and evaluation included:
• Length of alignment• Length of alignment in fixed guideway• Average travel time• Average travel speed• Potential travel time savings• Number of peak-/off-peak-period stations• Population within ¼ mile of stations• Retail and office employment within ¼ mile of stations• Environmental impacts• Capital costs• Operations and maintenance (O&M) costs• 2040 daily riders
6 .3 Analysis SummaryTable 6-1 summarizes the results across the remaining options.
Based on the screening criteria and information collected about the remaining options, the BRT options and the express bus options on the arterials (SR 12/US 41A) did not perform well enough to be considered as part of the LPA. Their potential ridership was lower than the other options, and the relative capital costs were high. Also, the potential for TOD and related development was low.
The BRT options as a new build lane or facility had costs that were too high given their ridership numbers. Furthermore, they had limited TOD potential and did not, in the case of the arterials, offer substantial travel time savings. While they did show some ridership gains, they were not typically commensurate with the relative costs.
Similarly, the express bus options on the arterials did not offer travel time savings or potential for TOD, since they would run along more circuitous routes through established areas and would have a more limited number of stations; therefore, they were eliminated from further consideration.
T I E R 2 S C R E E N I N G / L PA S E L E C T I O N N E X T S E C T I O N
Executive Summary
Introduction / Purpose of Study
Existing Corridor / Study Area Conditions
Alternatives Development & Summary
Pre-Screening
Tier 1 Screening
Tier 2 Screening / LPA Selection
Public and Stakeholder Involvement
TOD / Land Use
Funding / Finance
Next Steps
31
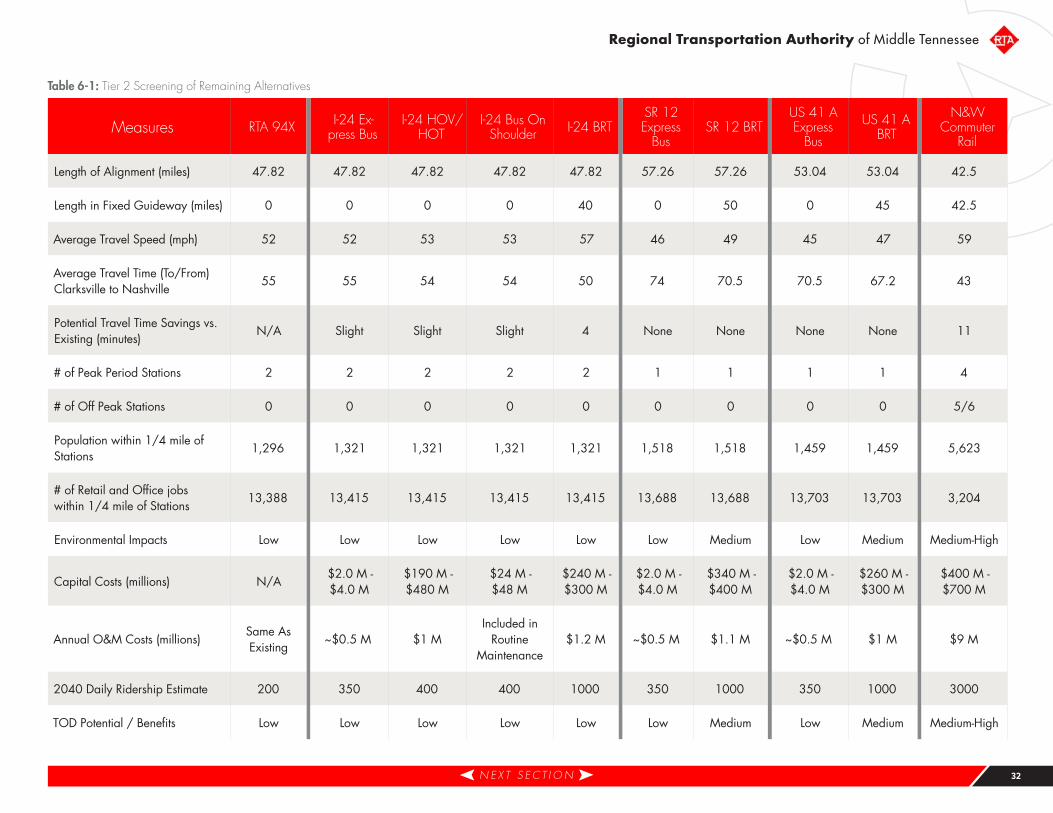
Regional Transportation Authority of Middle Tennessee
Table 6-1: Tier 2 Screening of Remaining Alternatives
Measures RTA 94X I-24 Ex-press Bus
I-24 HOV/HOT
I-24 Bus On Shoulder I-24 BRT
SR 12 Express
BusSR 12 BRT
US 41 A Express
Bus
US 41 A BRT
N&W Commuter
Rail
Length of Alignment (miles) 47.82 47.82 47.82 47.82 47.82 57.26 57.26 53.04 53.04 42.5
Length in Fixed Guideway (miles) 0 0 0 0 40 0 50 0 45 42.5
Average Travel Speed (mph) 52 52 53 53 57 46 49 45 47 59
Average Travel Time (To/From) Clarksville to Nashville
55 55 54 54 50 74 70.5 70.5 67.2 43
Potential Travel Time Savings vs. Existing (minutes)
N/A Slight Slight Slight 4 None None None None 11
# of Peak Period Stations 2 2 2 2 2 1 1 1 1 4
# of Off Peak Stations 0 0 0 0 0 0 0 0 0 5/6
Population within 1/4 mile of Stations
1,296 1,321 1,321 1,321 1,321 1,518 1,518 1,459 1,459 5,623
# of Retail and Office jobs within 1/4 mile of Stations
13,388 13,415 13,415 13,415 13,415 13,688 13,688 13,703 13,703 3,204
Environmental Impacts Low Low Low Low Low Low Medium Low Medium Medium-High
Capital Costs (millions) N/A$2.0 M - $4.0 M
$190 M - $480 M
$24 M - $48 M
$240 M - $300 M
$2.0 M - $4.0 M
$340 M - $400 M
$2.0 M - $4.0 M
$260 M - $300 M
$400 M - $700 M
Annual O&M Costs (millions)Same As Existing
~$0.5 M $1 MIncluded in
Routine Maintenance
$1.2 M ~$0.5 M $1.1 M ~$0.5 M $1 M $9 M
2040 Daily Ridership Estimate 200 350 400 400 1000 350 1000 350 1000 3000
TOD Potential / Benefits Low Low Low Low Low Low Medium Low Medium Medium-High
N E X T S E C T I O N 32
Northwest Corridor Transit Study | F I N A L R E P O R T | 10.2017
The HOV/HOT lanes were also similarly limited in their potential to provide needed benefits given their capital costs. The introduction of a system of managed lanes by taking or utilizing a general-purpose lane for HOVs, as well as transit was generally not publicly supportable. Thus, although the transit vehicles that would utilize the HOV/HOT lanes would produce more transit trips, the costs and limited TOD potential of this option did not make it feasible to implement.
The I-24 express bus (continuation of the 94X) and the build commuter rail option in the NWR ROW show potential for providing travel time savings, improved transit speeds and reliability and the potential to also provide land use and TOD development and redevelopment.
Simply put, the commuter rail option along the Nashville and Western rail corridor has the potential to draw the highest ridership, provides commuter express and local short trip service, provides the best opportunity to spur TOD related development and/or redevelopment, and has the best chance of providing fixed-guideway transit of all the alignments/corridor options in the study area because half of the ROW exists from Nashville to Ashland City.
More information on costs of the preferred commuter rail option can be found in Appendix F, with details of the alignments in Appendix H.
6 .4 Locally Preferred Alternative Selection and ActionsBased on the analysis, the LPA became increasingly clear. The options and analysis were presented to the stakeholders and the public during the third round of public meetings. Although the No Build Option was carried as a baseline for comparison, there does not seem to be a compelling case to pursue it.
What does make sense is for the RTA/MTA to invest in the existing 94X Express Bus and future I-24 Express Bus options in the short-, medium- and long-term time frames. This can be realized by working with TDOT to improve the shoulders along I-24 when it does routine maintenance and/or reconstruction so as to implement BOS and working toward establishing a long-term viable commuter rail service from Nashville to Clarksville via Ashland City.
6 .4 .1 Short Term (0 to 5 years)
Specifically, RTA and MTA should continue investing in the 94X Express Bus service and continue to build that brand and expand the reach and patronage of that service. This includes adding trips in the AM and PM peak-periods’ peak and off-peak directions as funding allows and patronage warrants the additional service. RTA and MTA should continue to work with TDOT and other state and local partners to advertise the service as well as the guaranteed ride home program to other employers, agencies, etc., beyond the core group of riders who typically work for the State of Tennessee. TDOT should also invest in the park-and-ride lots to include paved parking spaces, shelters, security, and perhaps convenience retail.
Local partners should also begin to work on their zoning, land use and development plans, and codes and policies to be ready to embrace TOD once the time is right for major investments in fixed-guideway transit.
RTA/MTA and its state and local partners should also further the development of the LPA by undertaking the appropriate environmental studies and documentation necessary to implement commuter rail. That includes determining what type of environmental action and document is needed given that the corridor and ROW exists from Nashville to Ashland City and that new ROW will need to be acquired from Ashland City to Clarksville. Once the environmental documentation and decision is completed, these entities should work on reserving and/or reacquiring the ROW for a transportation purpose in a rails-with-trails environment.
These same entities should also begin to plan and program needed last-mile/first-mile multimodal bike, pedestrian, and traffic upgrades and investments, especially around the stations that will be needed, including in downtown Nashville. These investments will make it possible for transit passengers to more readily access the stations and get to and from their ultimate destinations. Initial implementation of service improvement recommendations as identified in nMotion for areas along the corridor in Davidson County will also help start laying the groundwork for improved service in the future.
6 .4 .2 Medium Term (5 to 10 years)
In the medium time frame, RTA should work with local agency partners to continue the LPA program advancement, including working on environmental clearance, pursuing preliminary and final design of various parts of the project, programming, prioritizing, funding,
T I E R 2 S C R E E N I N G / L PA S E L E C T I O N N E X T S E C T I O N 33
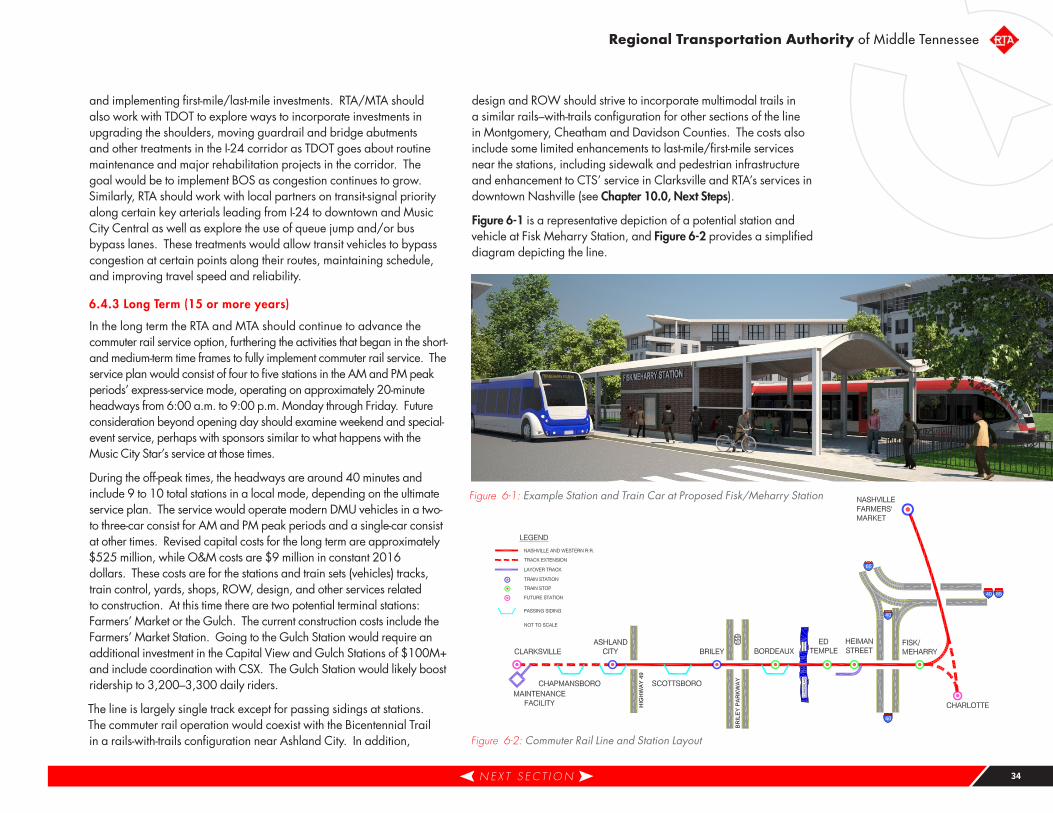
Regional Transportation Authority of Middle Tennessee
and implementing first-mile/last-mile investments. RTA/MTA should also work with TDOT to explore ways to incorporate investments in upgrading the shoulders, moving guardrail and bridge abutments and other treatments in the I-24 corridor as TDOT goes about routine maintenance and major rehabilitation projects in the corridor. The goal would be to implement BOS as congestion continues to grow. Similarly, RTA should work with local partners on transit-signal priority along certain key arterials leading from I-24 to downtown and Music City Central as well as explore the use of queue jump and/or bus bypass lanes. These treatments would allow transit vehicles to bypass congestion at certain points along their routes, maintaining schedule, and improving travel speed and reliability.
6 .4 .3 Long Term (15 or more years)
In the long term the RTA and MTA should continue to advance the commuter rail service option, furthering the activities that began in the short- and medium-term time frames to fully implement commuter rail service. The service plan would consist of four to five stations in the AM and PM peak periods’ express-service mode, operating on approximately 20-minute headways from 6:00 a.m. to 9:00 p.m. Monday through Friday. Future consideration beyond opening day should examine weekend and special-event service, perhaps with sponsors similar to what happens with the Music City Star’s service at those times.
During the off-peak times, the headways are around 40 minutes and include 9 to 10 total stations in a local mode, depending on the ultimate service plan. The service would operate modern DMU vehicles in a two- to three-car consist for AM and PM peak periods and a single-car consist at other times. Revised capital costs for the long term are approximately $525 million, while O&M costs are $9 million in constant 2016 dollars. These costs are for the stations and train sets (vehicles) tracks, train control, yards, shops, ROW, design, and other services related to construction. At this time there are two potential terminal stations: Farmers’ Market or the Gulch. The current construction costs include the Farmers’ Market Station. Going to the Gulch Station would require an additional investment in the Capital View and Gulch Stations of $100M+ and include coordination with CSX. The Gulch Station would likely boost ridership to 3,200–3,300 daily riders.
The line is largely single track except for passing sidings at stations. The commuter rail operation would coexist with the Bicentennial Trail in a rails-with-trails configuration near Ashland City. In addition,
design and ROW should strive to incorporate multimodal trails in a similar rails–with-trails configuration for other sections of the line in Montgomery, Cheatham and Davidson Counties. The costs also include some limited enhancements to last-mile/first-mile services near the stations, including sidewalk and pedestrian infrastructure and enhancement to CTS’ service in Clarksville and RTA’s services in downtown Nashville (see Chapter 10 .0, Next Steps).
Figure 6-1 is a representative depiction of a potential station and vehicle at Fisk Meharry Station, and Figure 6-2 provides a simplified diagram depicting the line.
N E X T S E C T I O N
Figure 6-1: Example Station and Train Car at Proposed Fisk/Meharry Station
Figure 6-2: Commuter Rail Line and Station Layout
34
Northwest Corridor Transit Study | F I N A L R E P O R T | 10.2017
7 Public and Stakeholder InvolvementOne of the key components of the project is input from those who live, work, and travel along this corridor. The project team held three rounds of Open House-style public meetings, at three decision-making junctures for the project, and provided presentations to local community/government groups, and launched website and social media sites (including a Facebook group and Twitter profile).
The public outreach effort provided various ways for the public and/or interested parties to get involved with the project; and they included asking questions or making comments during the public meetings, making comments on the display boards, filling out a poll and/or survey, and providing information and/or comments by the websites, social media, and crowdsource map. More information on Public and Stakeholder involvement can be found in Appendix C.
7 .1 Open House MeetingsOpen house meetings give the public an opportunity to learn about the project and question officials on the study team in a casual setting within their own communities. RTA/MTA and the study team conducted meetings at a number of locations during each of the three rounds of public and stakeholder outreach, providing the public with information on the project and gathering input and opinions regarding the analysis and recommendations.
7 .1 .1 Round 1 - Spring 2016
During Round 1 the project team provided display maps, comment cards, public meeting question and answer sessions, and a project website (crowdsource map)/social media for public comment. The results of the Round 1 comment cards showed that most attendees do not use transit, prefer the NWR corridor, and choose rail as their preferred transit mode. In addition, several comment cards indicated a desire to see a regional transit plan and long-range transit connection. The display/crowdsource map resulted in participants wanting to see stops in every major town or city in the study area. The display/crowdsource maps showed participants’ major destinations were primarily in Nashville, including major hospitals, event centers, and the airport. The display/crowdsource maps also
showed areas of concern, such as the Bicentennial Trail in Ashland City (but in favor of rails with trails), design concerns with the rail corridor, as well as environmental concerns.
7 .1 .2 Round 2 - Fall 2015
During Round 2 the project team provided a poll, a public meeting question-and-answer session, and a project website/social media for public comment. The Round 2 poll showed that most people travel by car, want to see transit to start at 5:00 a.m. and end at midnight, that they would wait 11-15 minutes for transit, and that the most important transit characteristics are dependability and convenience. A majority of the comments received during the Round 2 public meeting display maps were derived from participants using green dots to show they agreed with the proposed stations or stop locations. The questions asked during the Round 2 public meetings were general transit usage or operations type questions.
7 .1 .3 Round 3 - Summer 2016
During Round 3, the project team provided a survey, a public meeting question-and-answer session, and a project website/social media for public comment. The Round 3 survey showed that the highest ranking corridor is the proposed commuter rail corridor; the stations that received the most points were Highway 12, Cumberland Avenue, Briley Parkway, Charlotte Pike, and the Farmers’ Market; the highest ranking transit characteristics included speed/time and first/last mile; and the highest ranking funding sources include public-private partnership and federal funding. The questions asked during the Round 3 public meetings involved general transit usage or operations.
7 .2 Social MediaThe Northwest Corridor Transit Study News & Conversation Facebook group had 100 members. Most of the participating Facebook members support a commuter rail line operating on the NWR corridor. Comments were also made on the need to have bike lanes, a regional (multi-state) transit connection, and a connection to the Nashville International Airport. The Facebook poll concluded
P U B L I C A N D S T A K E H O L D E R I N V O LV E M E N T N E X T S E C T I O N
Executive Summary
Introduction / Purpose of Study
Existing Corridor / Study Area Conditions
Alternatives Development & Summary
Pre-Screening
Tier 1 Screening
Tier 2 Screening / LPA Selection
Public and Stakeholder Involvement
TOD / Land Use
Funding / Finance
Next Steps
35
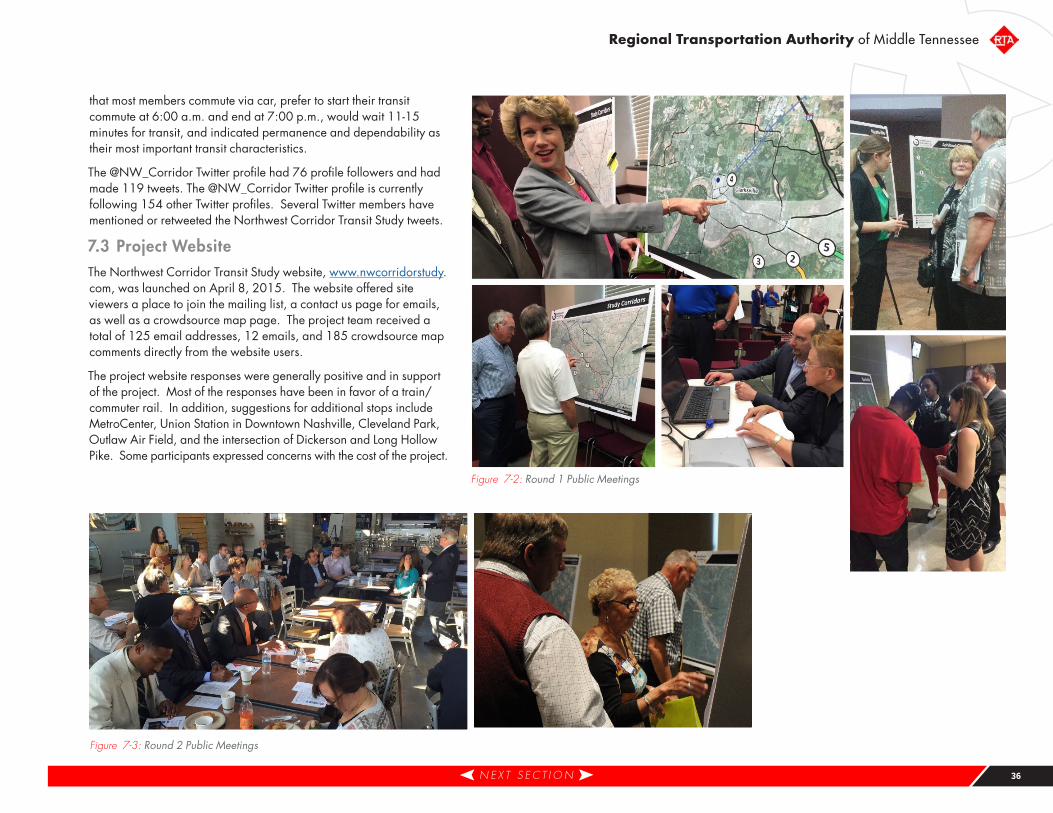
Regional Transportation Authority of Middle Tennessee
that most members commute via car, prefer to start their transit commute at 6:00 a.m. and end at 7:00 p.m., would wait 11-15 minutes for transit, and indicated permanence and dependability as their most important transit characteristics.
The @NW_Corridor Twitter profile had 76 profile followers and had made 119 tweets. The @NW_Corridor Twitter profile is currently following 154 other Twitter profiles. Several Twitter members have mentioned or retweeted the Northwest Corridor Transit Study tweets.
7 .3 Project WebsiteThe Northwest Corridor Transit Study website, www.nwcorridorstudy.com, was launched on April 8, 2015. The website offered site viewers a place to join the mailing list, a contact us page for emails, as well as a crowdsource map page. The project team received a total of 125 email addresses, 12 emails, and 185 crowdsource map comments directly from the website users.
The project website responses were generally positive and in support of the project. Most of the responses have been in favor of a train/commuter rail. In addition, suggestions for additional stops include MetroCenter, Union Station in Downtown Nashville, Cleveland Park, Outlaw Air Field, and the intersection of Dickerson and Long Hollow Pike. Some participants expressed concerns with the cost of the project.
Figure 7-2: Round 1 Public Meetings
Figure 7-3: Round 2 Public Meetings
N E X T S E C T I O N 36
Northwest Corridor Transit Study | F I N A L R E P O R T | 10.2017
8 Transit-Oriented Development and Land UseThis chapter introduces the principles and barriers to Transit-Oriented Development (TOD) and the outreach undertaken to engage the local jurisdictions at this early stage of the planning and project development process. Keys to successfully designing transit-oriented developments are incorporating a mix of uses, creating a walkable/bikeable network, providing open space and encouraging a diversity of housing options. As part of the future of the corridor, there is a critical need to concentrate development density around proposed stations in order to support transit while protecting and strengthening existing community, neighborhood, and environmental/cultural resources. More information can be found in Appendix G.
8 .1 Principles of Transit-Oriented DevelopmentPlanning and implementation of successful Transit-Oriented Development (TOD) involves many small decisions to ensure development is consistent with TOD principles. Some of the key principles needed to create a successful TOD are the following:
• Defined center
• Active, 18-hour place
• Mix of uses
• Pedestrian-oriented design
• Moderate to higher-density development
• Limited, managed parking
• Sustained public leadership
Defined Center
The concept of a TOD is more than providing easy access from home and work to transit. Although transit can be an important anchor for a center, the center must create a destination: a sense of place and community.
Active, 18-hour Place
A mix of land uses promotes activity around the clock, either within the TOD or easily accessible from the TOD. This in turn promotes the most effcient use of the transit system: travel in both directions, throughout the day. A mix of employment, residential, and recreational uses that provides services during the day, evenings, and weekends expands transit ridership beyond the traditional morning and evening commutes to encourage transit use for shopping and entertainment purposes.
Mix of Uses
Creating a mix of land uses provides diversity and variety, helps to define the center, and creates a more active, vibrant place. The diversity in land uses enables people to take care of the majority of their needs within a short walking distance. The mix of uses can be either vertical, in the same building, or horizontal, located next to each other. The key is to locate the various uses close together, make them easily accessible and supportive of each other.
Pedestrian-Oriented Design
Within a TOD, non-auto trips increase when a mix of uses is easily accessible and arranged in a way that emphasizes safe and efficient travel on foot rather than by car. Creating a pedestrian environment requires considering the dimensions of the human body and the scale of the spaces that people use. Subtle factors, focused on a pleasant and interesting environment for the pedestrian, encourage people to walk. Stations should be evaluated for their potential to support existing or form new walkable neighborhood with streets and open spaces that help create a unique identity.
T O D / L A N D U S E N E X T S E C T I O N
Executive Summary
Introduction / Purpose of Study
Existing Corridor / Study Area Conditions
Alternatives Development & Summary
Pre-Screening
Tier 1 Screening
Tier 2 Screening / LPA Selection
Public and Stakeholder Involvement
TOD / Land Use
Funding / Finance
Next Steps
37
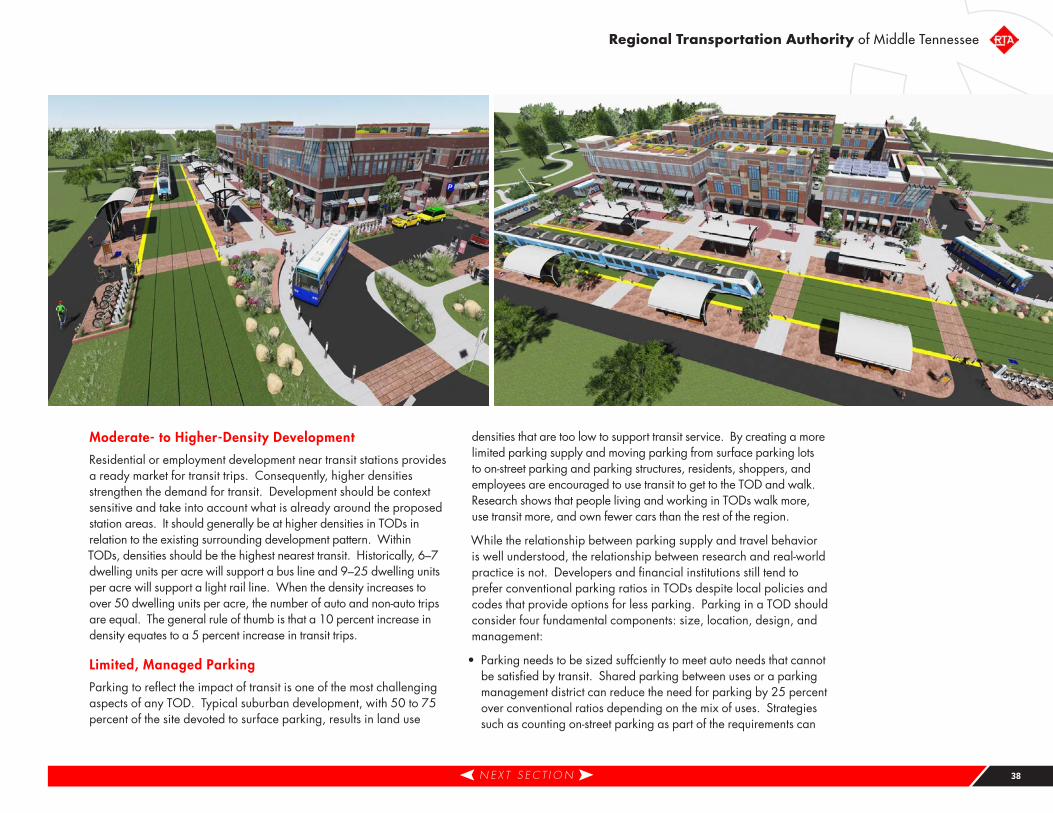
Regional Transportation Authority of Middle Tennessee
Moderate- to Higher-Density Development
Residential or employment development near transit stations provides a ready market for transit trips. Consequently, higher densities strengthen the demand for transit. Development should be context sensitive and take into account what is already around the proposed station areas. It should generally be at higher densities in TODs in relation to the existing surrounding development pattern. Within TODs, densities should be the highest nearest transit. Historically, 6–7 dwelling units per acre will support a bus line and 9–25 dwelling units per acre will support a light rail line. When the density increases to over 50 dwelling units per acre, the number of auto and non-auto trips are equal. The general rule of thumb is that a 10 percent increase in density equates to a 5 percent increase in transit trips.
Limited, Managed Parking
Parking to reflect the impact of transit is one of the most challenging aspects of any TOD. Typical suburban development, with 50 to 75 percent of the site devoted to surface parking, results in land use
densities that are too low to support transit service. By creating a more limited parking supply and moving parking from surface parking lots to on-street parking and parking structures, residents, shoppers, and employees are encouraged to use transit to get to the TOD and walk. Research shows that people living and working in TODs walk more, use transit more, and own fewer cars than the rest of the region.
While the relationship between parking supply and travel behavior is well understood, the relationship between research and real-world practice is not. Developers and financial institutions still tend to prefer conventional parking ratios in TODs despite local policies and codes that provide options for less parking. Parking in a TOD should consider four fundamental components: size, location, design, and management:
• Parking needs to be sized suffciently to meet auto needs that cannot be satisfied by transit. Shared parking between uses or a parking management district can reduce the need for parking by 25 percent over conventional ratios depending on the mix of uses. Strategies such as counting on-street parking as part of the requirements can
N E X T S E C T I O N 38
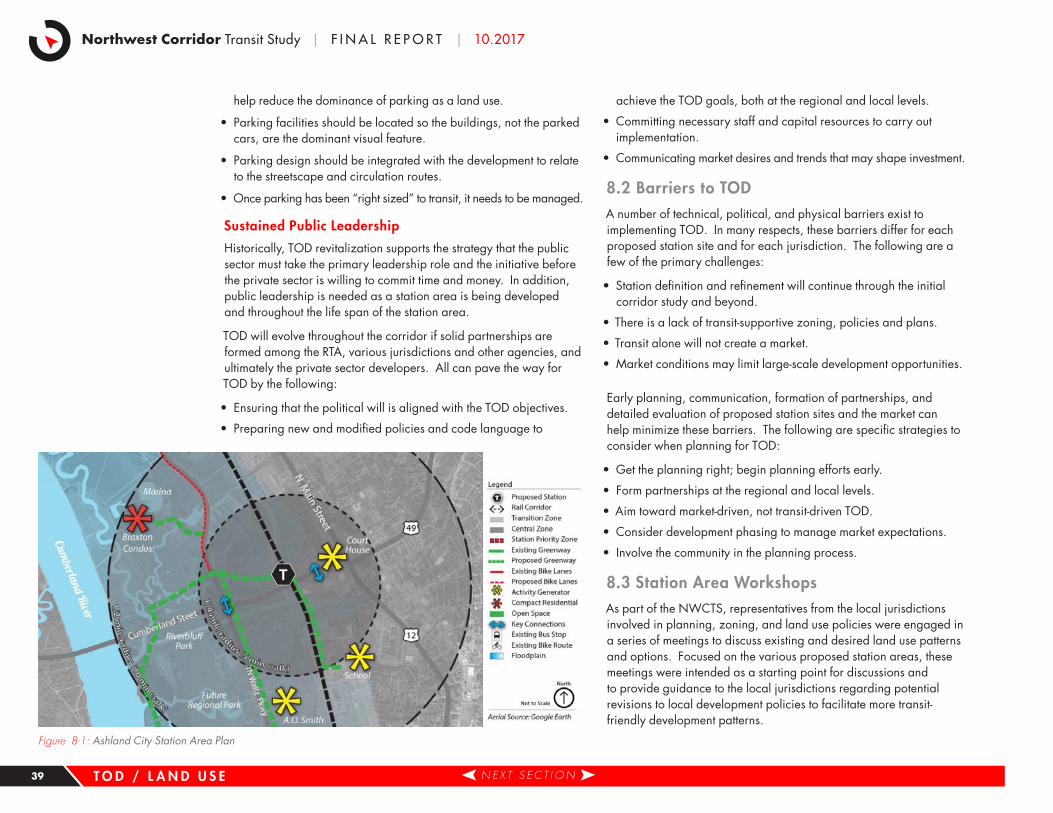
Northwest Corridor Transit Study | F I N A L R E P O R T | 10.2017
help reduce the dominance of parking as a land use.
• Parking facilities should be located so the buildings, not the parked cars, are the dominant visual feature.
• Parking design should be integrated with the development to relate to the streetscape and circulation routes.
• Once parking has been “right sized” to transit, it needs to be managed.
Sustained Public Leadership
Historically, TOD revitalization supports the strategy that the public sector must take the primary leadership role and the initiative before the private sector is willing to commit time and money. In addition, public leadership is needed as a station area is being developed and throughout the life span of the station area.
TOD will evolve throughout the corridor if solid partnerships are formed among the RTA, various jurisdictions and other agencies, and ultimately the private sector developers. All can pave the way for TOD by the following:
• Ensuring that the political will is aligned with the TOD objectives.
• Preparing new and modified policies and code language to
achieve the TOD goals, both at the regional and local levels.
• Committing necessary staff and capital resources to carry out implementation.
• Communicating market desires and trends that may shape investment.
8 .2 Barriers to TODA number of technical, political, and physical barriers exist to implementing TOD. In many respects, these barriers differ for each proposed station site and for each jurisdiction. The following are a few of the primary challenges:
• Station definition and refinement will continue through the initial corridor study and beyond.
• There is a lack of transit-supportive zoning, policies and plans.
• Transit alone will not create a market.
• Market conditions may limit large-scale development opportunities.
Early planning, communication, formation of partnerships, and detailed evaluation of proposed station sites and the market can help minimize these barriers. The following are specific strategies to consider when planning for TOD:
• Get the planning right; begin planning efforts early.
• Form partnerships at the regional and local levels.
• Aim toward market-driven, not transit-driven TOD.
• Consider development phasing to manage market expectations.
• Involve the community in the planning process.
8 .3 Station Area WorkshopsAs part of the NWCTS, representatives from the local jurisdictions involved in planning, zoning, and land use policies were engaged in a series of meetings to discuss existing and desired land use patterns and options. Focused on the various proposed station areas, these meetings were intended as a starting point for discussions and to provide guidance to the local jurisdictions regarding potential revisions to local development policies to facilitate more transit-friendly development patterns.
Figure 8-1: Ashland City Station Area Plan
T O D / L A N D U S E N E X T S E C T I O N 39
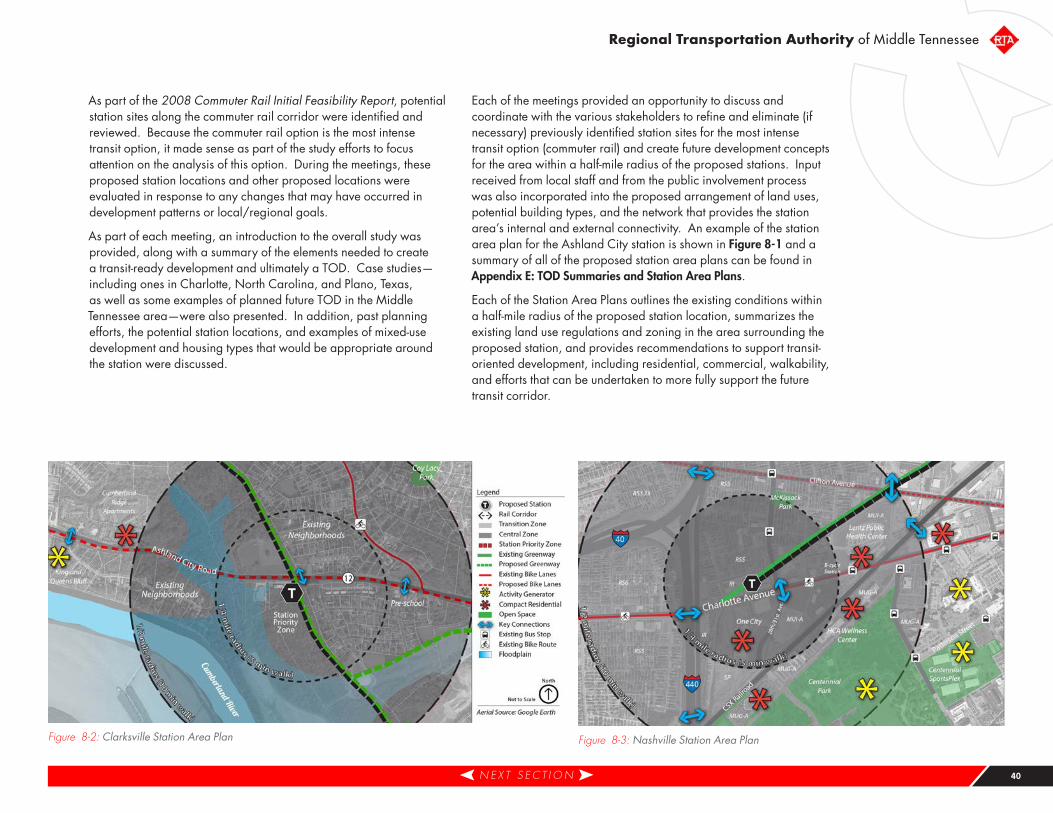
Regional Transportation Authority of Middle Tennessee
Figure 8-2: Clarksville Station Area Plan Figure 8-3: Nashville Station Area Plan
As part of the 2008 Commuter Rail Initial Feasibility Report, potential station sites along the commuter rail corridor were identified and reviewed. Because the commuter rail option is the most intense transit option, it made sense as part of the study efforts to focus attention on the analysis of this option. During the meetings, these proposed station locations and other proposed locations were evaluated in response to any changes that may have occurred in development patterns or local/regional goals.
As part of each meeting, an introduction to the overall study was provided, along with a summary of the elements needed to create a transit-ready development and ultimately a TOD. Case studies—including ones in Charlotte, North Carolina, and Plano, Texas, as well as some examples of planned future TOD in the Middle Tennessee area—were also presented. In addition, past planning efforts, the potential station locations, and examples of mixed-use development and housing types that would be appropriate around the station were discussed.
Each of the meetings provided an opportunity to discuss and coordinate with the various stakeholders to refine and eliminate (if necessary) previously identified station sites for the most intense transit option (commuter rail) and create future development concepts for the area within a half-mile radius of the proposed stations. Input received from local staff and from the public involvement process was also incorporated into the proposed arrangement of land uses, potential building types, and the network that provides the station area’s internal and external connectivity. An example of the station area plan for the Ashland City station is shown in Figure 8-1 and a summary of all of the proposed station area plans can be found in Appendix E: TOD Summaries and Station Area Plans.
Each of the Station Area Plans outlines the existing conditions within a half-mile radius of the proposed station location, summarizes the existing land use regulations and zoning in the area surrounding the proposed station, and provides recommendations to support transit-oriented development, including residential, commercial, walkability, and efforts that can be undertaken to more fully support the future transit corridor.
N E X T S E C T I O N 40
Northwest Corridor Transit Study | F I N A L R E P O R T | 10.2017
9 Funding and FinanceThis chapter introduces and summarizes federal, state, regional, local, and project-specific funding options that could be used to finance the project. The options identify the most promising funding vehicles and then summarizes the next steps in the implementation process. Also discussed, is the funding potential through public-private partnership (P3) legislation, which recently was enacted in Tennessee. In all, a combination of funding from all levels (local, state, and federal) will likely be needed to fully implement the project. More information can be found in Appendix G.
9 .1 Summary of Funding OptionsThe NWCTS identified specific alternative modes of transportation to serve commuters and visitors traveling through Nashville, Ashland City, and Clarksville. The study provided a level of detail that allows the program to advance to implementation with further project development activities. Identifying applicable funding and financing programs for the project is an important step necessary for adoption and creating the roadmap for implementation of the LPA(s).
Funding options are divided into six categories:
1. Discretionary funding for transit
2. Federal formula funding for transit
3. State funding for transit
4. Local funding for transit
5. Other local funding options
6. Project-specific funding options
Each funding option is described in the following sections.
9 .1 .1 Federal Funding
The federal funding falls into two general categories: discretionary (competitive) programs and funding allocated on a formula basis through the state to MPOs and local governments.
9.1.1.1 Federal Discretionary Funding
The RTA is contemplating a phased improvement of public transit in the Northwest Corridor. Specifically, improvements to the I-24 shoulder, which would enable express bus service to bypass congestion during peak periods. As transit demand in the corridor increases, the RTA would construct and operate a commuter rail system along the adjacent NWR ROW. These three phased improvements are summarized in Table 9-1.
There are a number of discretionary federal funding opportunities that might support a transit capital investment in the Northwest Corridor. The FTA and the US Department of Transportation (USDOT) made available nearly $3 billion in discretionary funding in FY 2016 for which transit projects could compete; over 80 percent of this level of annual funding is guaranteed through 2020. The 2016 funding was provided through three programs:
• FTA Section 5309 Capital Investment Grant (CIG) program $2.15 billion, rising to $2.3 billion in FY 2017 through 2020
• FTA Competitive Bus and Bus Facilities (Bus) program $268 million, increasing by 5 percent each year through 2020
• USDOT’s National Infrastructure Investment program, or “TIGER” $500 million, but uncertain if program will continue beyond FY 2017
Table 9-2 aligns program eligibility with each of the identified Northwest Corridor transit improvements.
A full analysis of the discretionary programs, the eligibility and potential competitiveness is provided in Appendix G: Funding and Finance Backup Materials.
The short-term express bus investment is eligible for FTA’s Section 5339 Bus program funding, although because it is a new program it is uncertain how competitive such a project would be in a national competition for funding. While both the medium-term BOS and longer-term commuter rail projects are eligible under USDOT’s multimodal TIGER program, the significant amount of state or local funding that would be required to match TIGER funding for the commuter rail investment makes it a likely poor candidate for funding. On the other hand, if a strong “story” could be crafted to support an application, the BOS project might be a compelling TIGER project.
F U N D I N G / F I N A N C E N E X T S E C T I O N
Executive Summary
Introduction / Purpose of Study
Existing Corridor / Study Area Conditions
Alternatives Development & Summary
Pre-Screening
Tier 1 Screening
Tier 2 Screening / LPA Selection
Public and Stakeholder Involvement
TOD / Land Use
Funding / Finance
Next Steps
41
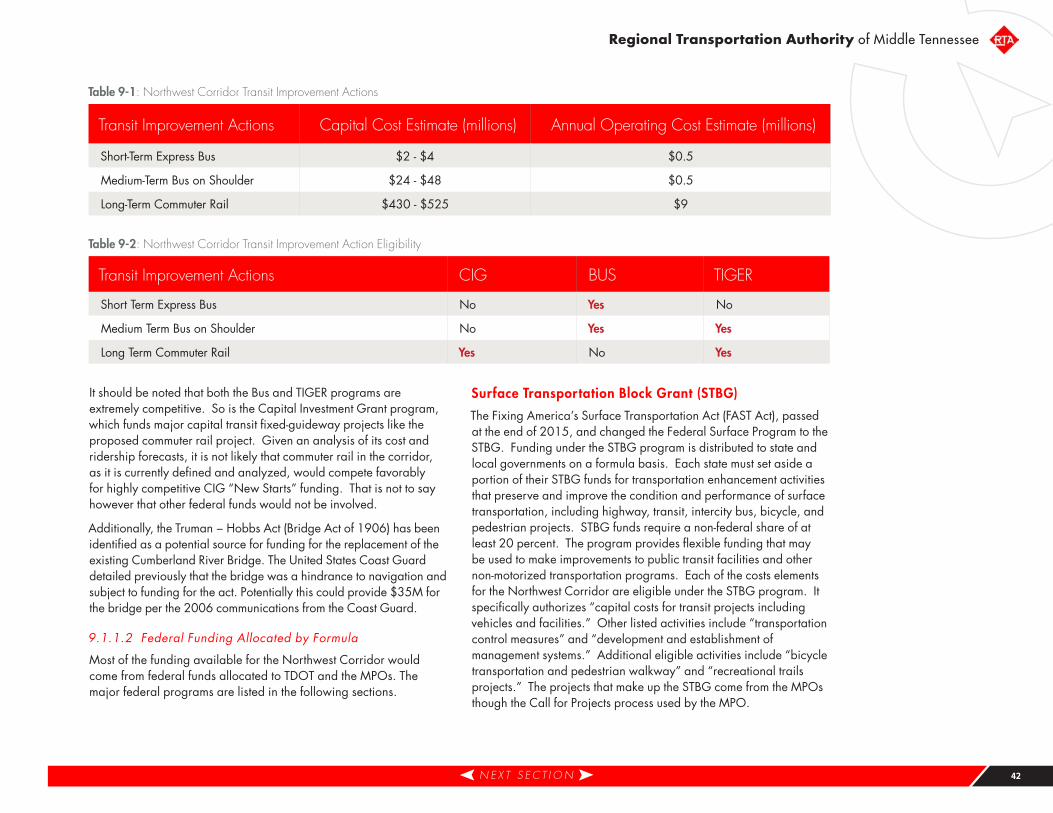
Regional Transportation Authority of Middle Tennessee
It should be noted that both the Bus and TIGER programs are extremely competitive. So is the Capital Investment Grant program, which funds major capital transit fixed-guideway projects like the proposed commuter rail project. Given an analysis of its cost and ridership forecasts, it is not likely that commuter rail in the corridor, as it is currently defined and analyzed, would compete favorably for highly competitive CIG “New Starts” funding. That is not to say however that other federal funds would not be involved.
Additionally, the Truman − Hobbs Act (Bridge Act of 1906) has been identified as a potential source for funding for the replacement of the existing Cumberland River Bridge. The United States Coast Guard detailed previously that the bridge was a hindrance to navigation and subject to funding for the act. Potentially this could provide $35M for the bridge per the 2006 communications from the Coast Guard.
9.1.1.2 Federal Funding Allocated by Formula
Most of the funding available for the Northwest Corridor would come from federal funds allocated to TDOT and the MPOs. The major federal programs are listed in the following sections.
Surface Transportation Block Grant (STBG)
The Fixing America’s Surface Transportation Act (FAST Act), passed at the end of 2015, and changed the Federal Surface Program to the STBG. Funding under the STBG program is distributed to state and local governments on a formula basis. Each state must set aside a portion of their STBG funds for transportation enhancement activities that preserve and improve the condition and performance of surface transportation, including highway, transit, intercity bus, bicycle, and pedestrian projects. STBG funds require a non-federal share of at least 20 percent. The program provides flexible funding that may be used to make improvements to public transit facilities and other non-motorized transportation programs. Each of the costs elements for the Northwest Corridor are eligible under the STBG program. It specifically authorizes “capital costs for transit projects including vehicles and facilities.” Other listed activities include “transportation control measures” and “development and establishment of management systems.” Additional eligible activities include “bicycle transportation and pedestrian walkway” and “recreational trails projects.” The projects that make up the STBG come from the MPOs though the Call for Projects process used by the MPO.
Table 9-1: Northwest Corridor Transit Improvement Actions
Transit Improvement Actions Capital Cost Estimate (millions) Annual Operating Cost Estimate (millions)
Short-Term Express Bus $2 - $4 $0.5
Medium-Term Bus on Shoulder $24 - $48 $0.5
Long-Term Commuter Rail $430 - $525 $9
Table 9-2: Northwest Corridor Transit Improvement Action Eligibility
Transit Improvement Actions CIG BUS TIGER
Short Term Express Bus No Yes No
Medium Term Bus on Shoulder No Yes Yes
Long Term Commuter Rail Yes No Yes
N E X T S E C T I O N 42
Northwest Corridor Transit Study | F I N A L R E P O R T | 10.2017
Highway Safety Improvement Program (HSIP)
The program will only fund intersections and grade separations where there is “a crash history.” Given the current limited use of the freight line portion of the system, none of the grade separations would likely qualify under the HSIP program.
Congestion Mitigation Air Quality Program (CMAQ)
Davidson and Montgomery Counties qualify in Tennessee for CMAQ funding under a “Maintenance of Ozone” classification. Cheatham County does not qualify for CMAQ funding, which would require a decision on where to allocate the funds. Given the level of funding under the program, the state officials suggested a maximum allocation of about $30 million, allocated at $10 million per year for three years. CMAQ funding can be used for the capital costs of transit projects and up to three years of the O&M costs of new transit service. The program requires a 20 percent match.
Transportation Alternatives (TA)
Transportation Alternatives are federally funded, community-based projects that expand travel choices and enhance the transportation experience by integrating modes and improving the cultural, historic, and environmental aspects of our transportation infrastructure. The proposed parallel trails in Davidson County and provisions to allow the commuter line to share additional ROW north of Ashland City in a rails-with-trails environment would qualify under the various eligible categories under the TA program. More than $317 million in grants has been distributed by the USDOT to local communities across the state to build bike and pedestrian facilities and provide streetscape improvements. The TA grants in Tennessee have historically been small in the $1 million range. For that reason, the funding program should also include other federal sources.
Local Parks and Recreation Funds
Local Parks and Recreation Funds are federal funds from the U.S. Department of the Interior administered by the state. The recent funding has been between $7 million and $10 million annually. As with the TA program, the trail system in Davidson County and the improvements to the Cumberland River Bicentennial Trail to accommodate the commuter line would be eligible, including ROW acquisition.
Based on the federal-funding programs identified, each of the cost categories is eligible for one or more of the programs. Table 9-3 summarizes one combination of funding programs to meet the capital costs for the Northwest Corridor. The chart includes the federal program, the state match (20 percent for each federal program), and a conservative level of value capture revenues. The STBG program is the primary program. The STBG program makes up approximately 70 percent of the federal funds that flow through the state to the MPOs. The chart assumes that 9.5 percent of those funds would be allocated to the Northwest Corridor starting in the year the nMotion program designates it as the priority project. No HSIP funds are allocated since there is no crash history to support any of the grade separations. The CMAQ funds are limited to the estimate suggested by the TDOT staff. The allocation of TA funds is estimated at 5 percent since the cost elements of the trails element of the plan are smaller than other cost elements. The state-matching funds are 20 percent as required by the federal programs.
9 .1 .2 State Funding
TDOT oversees the allocation of funding among urbanized and non-urbanized areas. Additionally, a series of limited funding programs for statewide public transit initiatives are administered by the state. These funding/grant programs are included in the following sections.
Urbanized Area Grants
Provides funds to urbanized areas with populations of more than 50,000 for transit operating and capital assistance and for transportation-related planning. For areas under 200,000 in population, funds are apportioned on the basis of population and population density. Clarksville would fall under this category. For areas over 200,000 in population, funds are apportioned based on population, population density, and transit data. Metro Nashville would fall under this category.
Capital Investment Grants
Provides discretionary capital assistance for the purchase of new equipment, acquisition of property, and the construction of public transit facilities.
F U N D I N G / F I N A N C E N E X T S E C T I O N 43
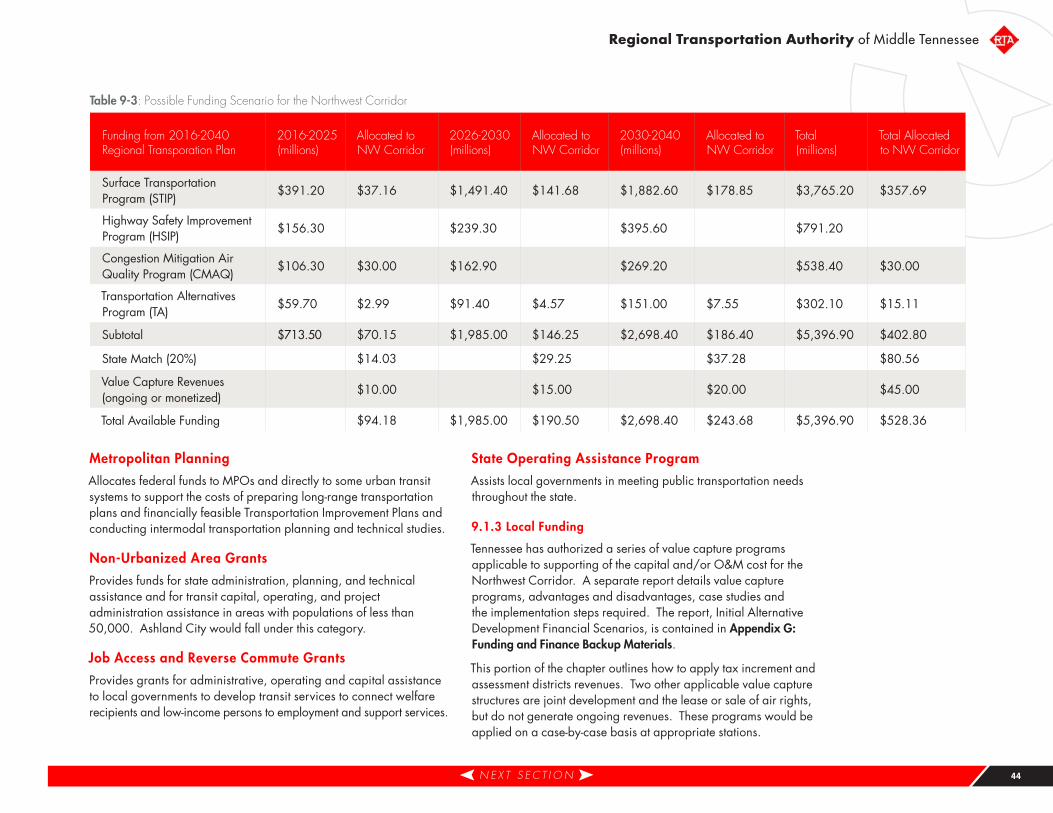
Regional Transportation Authority of Middle Tennessee
Metropolitan Planning
Allocates federal funds to MPOs and directly to some urban transit systems to support the costs of preparing long-range transportation plans and financially feasible Transportation Improvement Plans and conducting intermodal transportation planning and technical studies.
Non-Urbanized Area Grants
Provides funds for state administration, planning, and technical assistance and for transit capital, operating, and project administration assistance in areas with populations of less than 50,000. Ashland City would fall under this category.
Job Access and Reverse Commute Grants
Provides grants for administrative, operating and capital assistance to local governments to develop transit services to connect welfare recipients and low-income persons to employment and support services.
State Operating Assistance Program
Assists local governments in meeting public transportation needs throughout the state.
9 .1 .3 Local Funding
Tennessee has authorized a series of value capture programs applicable to supporting of the capital and/or O&M cost for the Northwest Corridor. A separate report details value capture programs, advantages and disadvantages, case studies and the implementation steps required. The report, Initial Alternative Development Financial Scenarios, is contained in Appendix G: Funding and Finance Backup Materials.
This portion of the chapter outlines how to apply tax increment and assessment districts revenues. Two other applicable value capture structures are joint development and the lease or sale of air rights, but do not generate ongoing revenues. These programs would be applied on a case-by-case basis at appropriate stations.
Table 9-3: Possible Funding Scenario for the Northwest Corridor
Funding from 2016-2040 Regional Transporation Plan
2016-2025 (millions)
Allocated to NW Corridor
2026-2030 (millions)
Allocated to NW Corridor
2030-2040 (millions)
Allocated to NW Corridor
Total (millions)
Total Allocated to NW Corridor
Surface Transportation Program (STIP)
$391.20 $37.16 $1,491.40 $141.68 $1,882.60 $178.85 $3,765.20 $357.69
Highway Safety Improvement Program (HSIP)
$156.30 $239.30 $395.60 $791.20
Congestion Mitigation Air Quality Program (CMAQ)
$106.30 $30.00 $162.90 $269.20 $538.40 $30.00
Transportation Alternatives Program (TA)
$59.70 $2.99 $91.40 $4.57 $151.00 $7.55 $302.10 $15.11
Subtotal $713.50 $70.15 $1,985.00 $146.25 $2,698.40 $186.40 $5,396.90 $402.80
State Match (20%) $14.03 $29.25 $37.28 $80.56
Value Capture Revenues (ongoing or monetized)
$10.00 $15.00 $20.00 $45.00
Total Available Funding $94.18 $1,985.00 $190.50 $2,698.40 $243.68 $5,396.90 $528.36
N E X T S E C T I O N 44
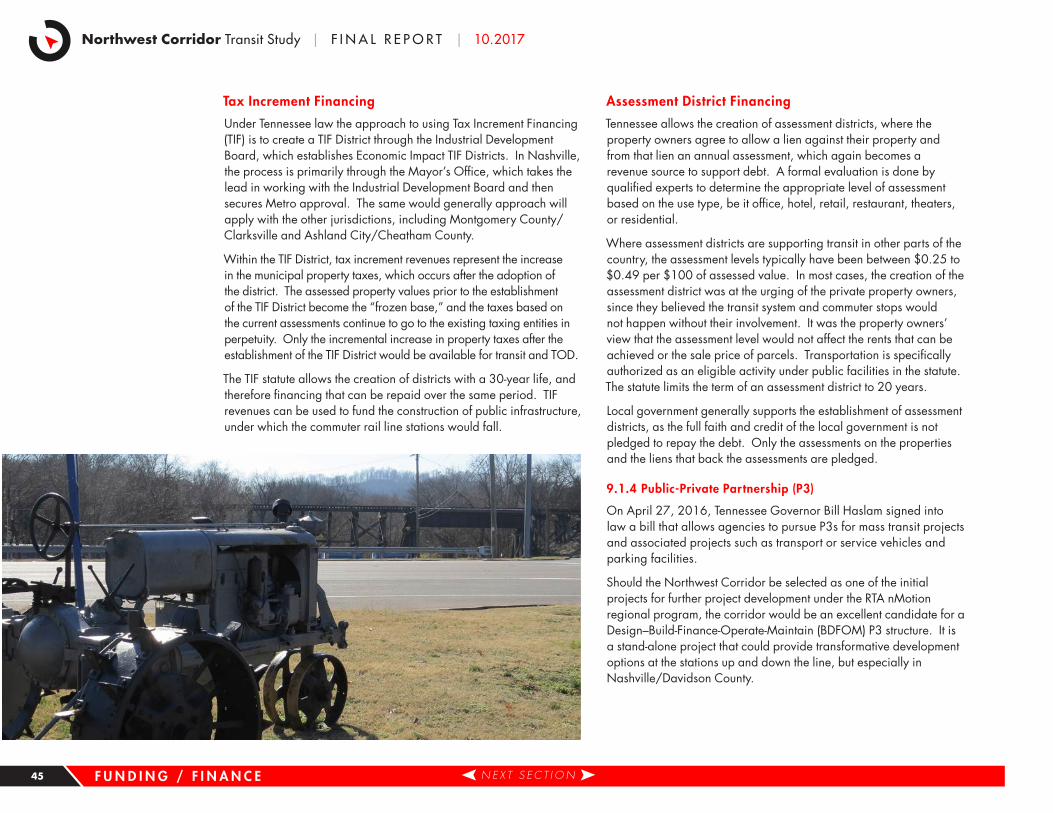
Northwest Corridor Transit Study | F I N A L R E P O R T | 10.2017
Tax Increment Financing
Under Tennessee law the approach to using Tax Increment Financing (TIF) is to create a TIF District through the Industrial Development Board, which establishes Economic Impact TIF Districts. In Nashville, the process is primarily through the Mayor’s Office, which takes the lead in working with the Industrial Development Board and then secures Metro approval. The same would generally approach will apply with the other jurisdictions, including Montgomery County/Clarksville and Ashland City/Cheatham County.
Within the TIF District, tax increment revenues represent the increase in the municipal property taxes, which occurs after the adoption of the district. The assessed property values prior to the establishment of the TIF District become the “frozen base,” and the taxes based on the current assessments continue to go to the existing taxing entities in perpetuity. Only the incremental increase in property taxes after the establishment of the TIF District would be available for transit and TOD.
The TIF statute allows the creation of districts with a 30-year life, and therefore financing that can be repaid over the same period. TIF revenues can be used to fund the construction of public infrastructure, under which the commuter rail line stations would fall.
Assessment District Financing
Tennessee allows the creation of assessment districts, where the property owners agree to allow a lien against their property and from that lien an annual assessment, which again becomes a revenue source to support debt. A formal evaluation is done by qualified experts to determine the appropriate level of assessment based on the use type, be it office, hotel, retail, restaurant, theaters, or residential.
Where assessment districts are supporting transit in other parts of the country, the assessment levels typically have been between $0.25 to $0.49 per $100 of assessed value. In most cases, the creation of the assessment district was at the urging of the private property owners, since they believed the transit system and commuter stops would not happen without their involvement. It was the property owners’ view that the assessment level would not affect the rents that can be achieved or the sale price of parcels. Transportation is specifically authorized as an eligible activity under public facilities in the statute. The statute limits the term of an assessment district to 20 years.
Local government generally supports the establishment of assessment districts, as the full faith and credit of the local government is not pledged to repay the debt. Only the assessments on the properties and the liens that back the assessments are pledged.
9 .1 .4 Public-Private Partnership (P3)
On April 27, 2016, Tennessee Governor Bill Haslam signed into law a bill that allows agencies to pursue P3s for mass transit projects and associated projects such as transport or service vehicles and parking facilities.
Should the Northwest Corridor be selected as one of the initial projects for further project development under the RTA nMotion regional program, the corridor would be an excellent candidate for a Design–Build-Finance-Operate-Maintain (BDFOM) P3 structure. It is a stand-alone project that could provide transformative development options at the stations up and down the line, but especially in Nashville/Davidson County.
F U N D I N G / F I N A N C E N E X T S E C T I O N 45
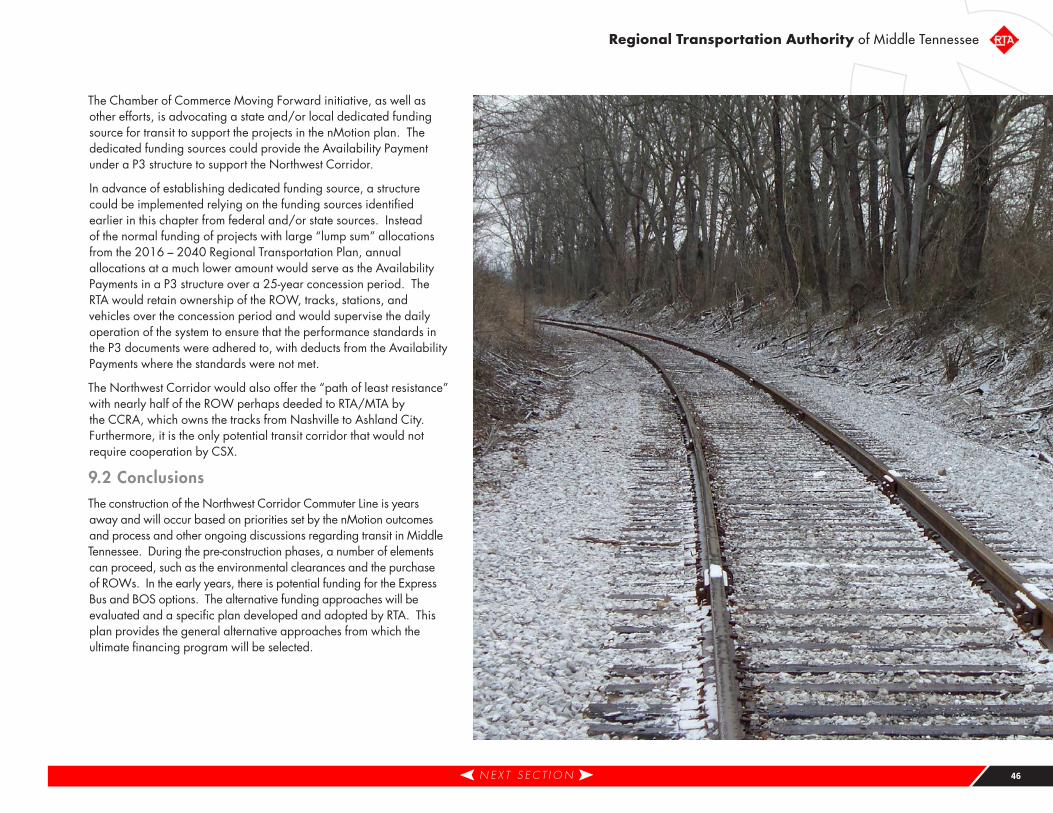
Regional Transportation Authority of Middle Tennessee
The Chamber of Commerce Moving Forward initiative, as well as other efforts, is advocating a state and/or local dedicated funding source for transit to support the projects in the nMotion plan. The dedicated funding sources could provide the Availability Payment under a P3 structure to support the Northwest Corridor.
In advance of establishing dedicated funding source, a structure could be implemented relying on the funding sources identified earlier in this chapter from federal and/or state sources. Instead of the normal funding of projects with large “lump sum” allocations from the 2016 – 2040 Regional Transportation Plan, annual allocations at a much lower amount would serve as the Availability Payments in a P3 structure over a 25-year concession period. The RTA would retain ownership of the ROW, tracks, stations, and vehicles over the concession period and would supervise the daily operation of the system to ensure that the performance standards in the P3 documents were adhered to, with deducts from the Availability Payments where the standards were not met.
The Northwest Corridor would also offer the “path of least resistance” with nearly half of the ROW perhaps deeded to RTA/MTA by the CCRA, which owns the tracks from Nashville to Ashland City. Furthermore, it is the only potential transit corridor that would not require cooperation by CSX.
9 .2 ConclusionsThe construction of the Northwest Corridor Commuter Line is years away and will occur based on priorities set by the nMotion outcomes and process and other ongoing discussions regarding transit in Middle Tennessee. During the pre-construction phases, a number of elements can proceed, such as the environmental clearances and the purchase of ROWs. In the early years, there is potential funding for the Express Bus and BOS options. The alternative funding approaches will be evaluated and a specific plan developed and adopted by RTA. This plan provides the general alternative approaches from which the ultimate financing program will be selected.
N E X T S E C T I O N 46
Northwest Corridor Transit Study | F I N A L R E P O R T | 10.2017
10 Next StepsThe selection of a series of LPAs in the short-, medium- and long-term timeframes represents the conclusion of the NWCTS. However, this is really the first step of a long process toward ultimate project implementation and operation of transit investments in the corridor. Since the investments and future work needed to bring them to fruition are cumulative and build on each other, continuing a concerted strategy with related incremental actions will help achieve the ultimate goal of establishing improved transit services and ultimately fixed-guideway commuter rail transit in the Northwest Corridor in the long term.
This section outlines the next steps for advancing the LPAs through a series of activities needed to build support for and continue the project and program development process. This includes the maturation of the RTA/MTA Strategic Plan nMotion recommendations and establishment of a dedicated revenue source to provide local match to Federal capital and other funding and ensure a reliable stream of revenues to operate and maintain the proposed improvements in the Northwest Corridor and in other parts of Middle Tennessee. The recommended LPAs for the short-, medium- and long-term time frames will need further actions to be fully implemented as outlined below.
10 .1 Short Term (0 to 5 years)The following are the key short-term steps that RTA should plan to take to advance the LPAs and continue the project and program development process in the Short Term.
Continue the Investment and Visibility of the 94X Express Bus Service
One of the key short-term steps is continued investment in and visibility of the 94X Express Bus Service. In the short term, RTA added trips to the 94X in October 2016. It should continue to market the service to any and all customers who seek to use the service, adding trips and expanding the service hours, promoting
the guaranteed ride home program and letting employers and riders know about the benefits of commuting via transit. This includes adding any necessary amenities at the new location including but not limited to additional paved parking, lighting, shelters, security monitoring, and convenience retail.
Start the Environmental Process
Another key short-term step is to start the environmental process for the commuter rail option. Pursuant to the National Environmental Policy Act of 1969 (NEPA), all federally funded capital infrastructure projects must be subject to a review of their impacts on the human, natural, and physical environment. Because it is expected that federal funding will be pursued to fund some portion of the capital costs of a new commuter rail line in the Northwest Corridor, this LPA is therefore subject to NEPA.
NEPA is intended to ensure that federal agencies incorporate environmental values into their decisions and actions. NEPA further provides for a formal process for the public to review and comment on anticipated impacts as an input for determining local political support for the proposed project as well as a federal decision to fund or take any other necessary actions. Transportation project effects on the environment can vary from very minor to very significant. To account for the variability of project impacts, three “classes of action” have been established to determine how compliance with NEPA would be carried out and documented.
An Environmental Impact Statement (EIS) is required for projects where it is known that the action will have a significant effect on the environment. An Environmental Assessment (EA) may be prepared for actions in which the degree of environmental impacts is not clearly established, but is not expected to be significant. Finally, a Categorical Exclusions is an action that does not individually or cumulatively have a significant effect on the environment. The federal lead agency for NEPA analysis and documentation determines the most appropriate class of action.
N E X T S T E P S
Executive Summary
Introduction / Purpose of Study
Existing Corridor / Study Area Conditions
Alternatives Development & Summary
Pre-Screening
Tier 1 Screening
Tier 2 Screening / LPA Selection
Public and Stakeholder Involvement
TOD / Land Use
Funding / Finance
Next Steps
P R E V I O U S S E C T I O N 47
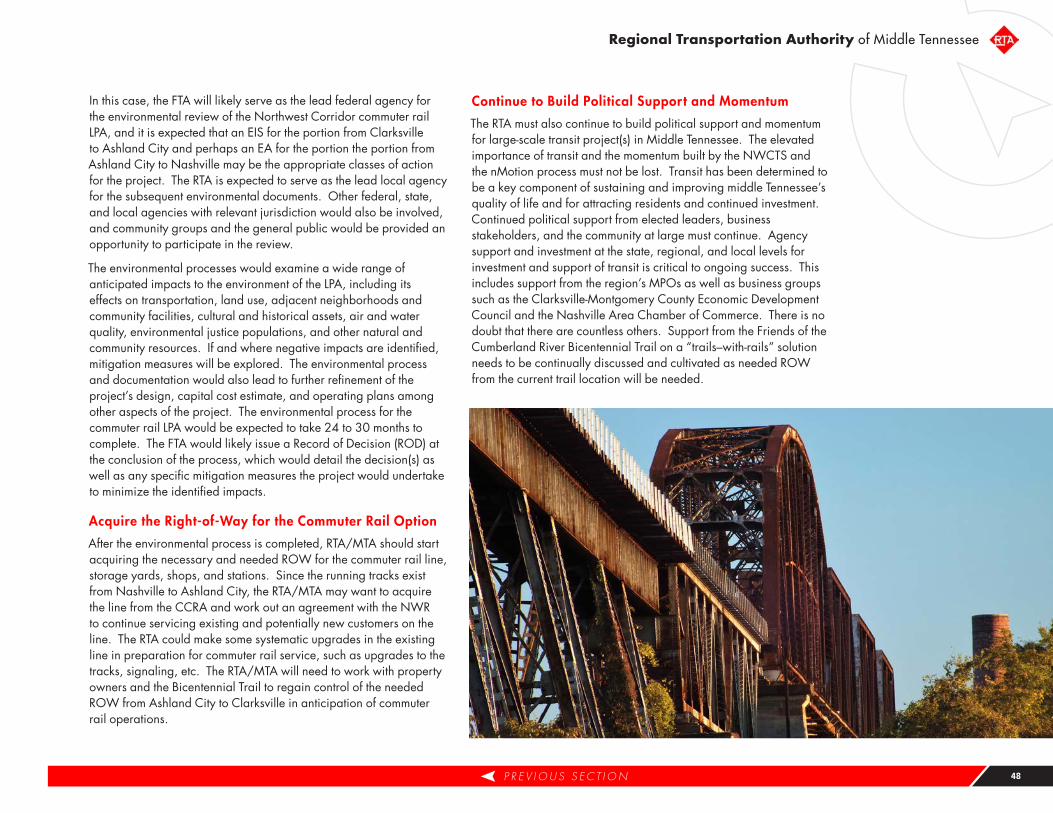
Regional Transportation Authority of Middle Tennessee
In this case, the FTA will likely serve as the lead federal agency for the environmental review of the Northwest Corridor commuter rail LPA, and it is expected that an EIS for the portion from Clarksville to Ashland City and perhaps an EA for the portion the portion from Ashland City to Nashville may be the appropriate classes of action for the project. The RTA is expected to serve as the lead local agency for the subsequent environmental documents. Other federal, state, and local agencies with relevant jurisdiction would also be involved, and community groups and the general public would be provided an opportunity to participate in the review.
The environmental processes would examine a wide range of anticipated impacts to the environment of the LPA, including its effects on transportation, land use, adjacent neighborhoods and community facilities, cultural and historical assets, air and water quality, environmental justice populations, and other natural and community resources. If and where negative impacts are identified, mitigation measures will be explored. The environmental process and documentation would also lead to further refinement of the project’s design, capital cost estimate, and operating plans among other aspects of the project. The environmental process for the commuter rail LPA would be expected to take 24 to 30 months to complete. The FTA would likely issue a Record of Decision (ROD) at the conclusion of the process, which would detail the decision(s) as well as any specific mitigation measures the project would undertake to minimize the identified impacts.
Acquire the Right-of-Way for the Commuter Rail Option
After the environmental process is completed, RTA/MTA should start acquiring the necessary and needed ROW for the commuter rail line, storage yards, shops, and stations. Since the running tracks exist from Nashville to Ashland City, the RTA/MTA may want to acquire the line from the CCRA and work out an agreement with the NWR to continue servicing existing and potentially new customers on the line. The RTA could make some systematic upgrades in the existing line in preparation for commuter rail service, such as upgrades to the tracks, signaling, etc. The RTA/MTA will need to work with property owners and the Bicentennial Trail to regain control of the needed ROW from Ashland City to Clarksville in anticipation of commuter rail operations.
Continue to Build Political Support and Momentum
The RTA must also continue to build political support and momentum for large-scale transit project(s) in Middle Tennessee. The elevated importance of transit and the momentum built by the NWCTS and the nMotion process must not be lost. Transit has been determined to be a key component of sustaining and improving middle Tennessee’s quality of life and for attracting residents and continued investment. Continued political support from elected leaders, business stakeholders, and the community at large must continue. Agency support and investment at the state, regional, and local levels for investment and support of transit is critical to ongoing success. This includes support from the region’s MPOs as well as business groups such as the Clarksville-Montgomery County Economic Development Council and the Nashville Area Chamber of Commerce. There is no doubt that there are countless others. Support from the Friends of the Cumberland River Bicentennial Trail on a “trails–with-rails” solution needs to be continually discussed and cultivated as needed ROW from the current trail location will be needed.
P R E V I O U S S E C T I O N 48
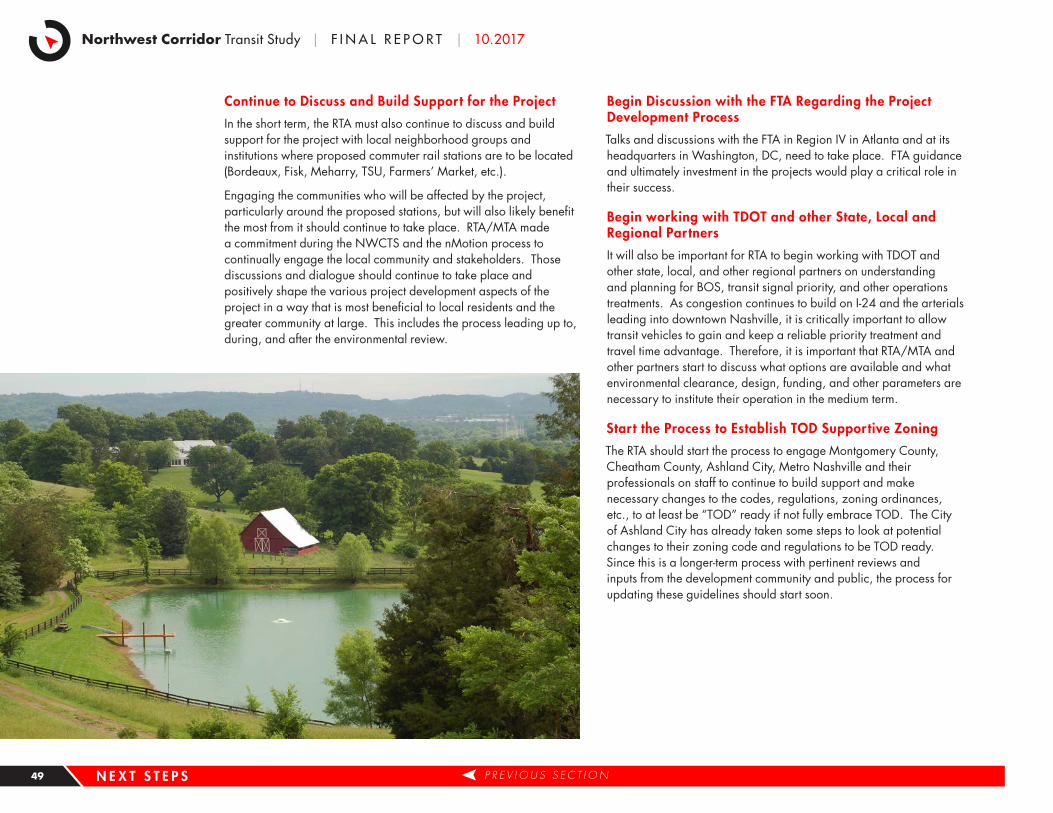
Northwest Corridor Transit Study | F I N A L R E P O R T | 10.2017
Continue to Discuss and Build Support for the Project
In the short term, the RTA must also continue to discuss and build support for the project with local neighborhood groups and institutions where proposed commuter rail stations are to be located (Bordeaux, Fisk, Meharry, TSU, Farmers’ Market, etc.).
Engaging the communities who will be affected by the project, particularly around the proposed stations, but will also likely benefit the most from it should continue to take place. RTA/MTA made a commitment during the NWCTS and the nMotion process to continually engage the local community and stakeholders. Those discussions and dialogue should continue to take place and positively shape the various project development aspects of the project in a way that is most beneficial to local residents and the greater community at large. This includes the process leading up to, during, and after the environmental review.
Begin Discussion with the FTA Regarding the Project Development Process
Talks and discussions with the FTA in Region IV in Atlanta and at its headquarters in Washington, DC, need to take place. FTA guidance and ultimately investment in the projects would play a critical role in their success.
Begin working with TDOT and other State, Local and Regional Partners
It will also be important for RTA to begin working with TDOT and other state, local, and other regional partners on understanding and planning for BOS, transit signal priority, and other operations treatments. As congestion continues to build on I-24 and the arterials leading into downtown Nashville, it is critically important to allow transit vehicles to gain and keep a reliable priority treatment and travel time advantage. Therefore, it is important that RTA/MTA and other partners start to discuss what options are available and what environmental clearance, design, funding, and other parameters are necessary to institute their operation in the medium term.
Start the Process to Establish TOD Supportive Zoning
The RTA should start the process to engage Montgomery County, Cheatham County, Ashland City, Metro Nashville and their professionals on staff to continue to build support and make necessary changes to the codes, regulations, zoning ordinances, etc., to at least be “TOD” ready if not fully embrace TOD. The City of Ashland City has already taken some steps to look at potential changes to their zoning code and regulations to be TOD ready. Since this is a longer-term process with pertinent reviews and inputs from the development community and public, the process for updating these guidelines should start soon.
N E X T S T E P S P R E V I O U S S E C T I O N 49
Regional Transportation Authority of Middle Tennessee
10 .2 Medium Term (5 to 10 years)The following are the key medium-term steps that RTA should plan to take to advance the LPAs and continue the project and program development process in the Medium Term.
Continue to Discuss and Build Support for the Project
Building on the outreach and communication efforts of the short term, engaging the communities who will be affected by the project, particularly around the proposed stations, but will also likely benefit the most from it should continue to take place. RTA/MTA made a commitment during the NWCTS and the nMotion process to continually engage the local community and stakeholders. Those discussions and dialogue should continue to take place and positively shape the various project development aspects of the project in a way that is most beneficial to local residents and the greater community at large.
Continue and Finalize the Environmental Process
If the environmental process is not finished, or needs updated, these activities should take place and come to a logical conclusion, including the issuance of a ROD by the FTA.
Finish Acquiring any Remaining Right-of-Way for the Commuter Rail Option
If the ROW acquisition process is not finished, these activities should take place and come to a logical conclusion.
Establish Partnerships with the Private Sector
During the medium term, the RTA should begin discussions with and gain support and/or partnerships with the private sector concerning TOD development potential and agreements at major stations in Clarksville, Ashland City, and Metro Nashville/Davidson County. Private-sector investment would be important to fully realizing the benefits of an investment in commuter rail in the Northwest Corridor. Once ROW is acquired and environmental clearance is complete, the private sector would know the project is “real” and would be more receptive to discussions on how they can be involved at the stations and potentially with other facets of the project.
Replace the Existing Railroad Bridge over the Cumberland River
RTA/MTA and other partners should work with the US Coast Guard and likely the US Army Corps of Engineers to remove and replace the existing railroad bridge over the Cumberland River. It has been determined that the existing bridge and operations of the same are a hindrance to navigation. As such, there is a US Coast Guard fund and investment program to pay for a new one. The requisite study and determination if this is the appropriate funding source for the undertaking of a replacement bridge needs to happen. Next, all parties should agree on a design, cost parameters, and a timeline for a new bridge. This could be started with the environmental document, but needs to at least begin and end in the medium-term time horizon. This activity should produce a memorandum of understanding (MOU) or other document aimed at replacing the bridge and agreed to by all relevant parties and should include the necessary permits and approvals for construction and operation.
Implement BOS, Signal Priority and Other Investments
If not already completed, activities related to clearances and the purchase of ROW, needed design, etc., should be finished to implement BOS, signal priority, etc., to continue the travel time advantage and reliability for transit vehicles in the corridor.
Implement TOD Supportive Zoning
Montgomery County/Cheatham County/Ashland City/Metro Nashville all should conclude the planning and stakeholder involvement activities needed to establish these TOD embracing mechanisms.
Continue Stakeholder Discussions
The discussion began in the short-term time frame should continue as the project progresses and certain features are determined and /or completed including the ROD and MOU for the bridge, etc. These discussions should take place locally, regionally, and with the regulatory agencies.
P R E V I O U S S E C T I O N 50
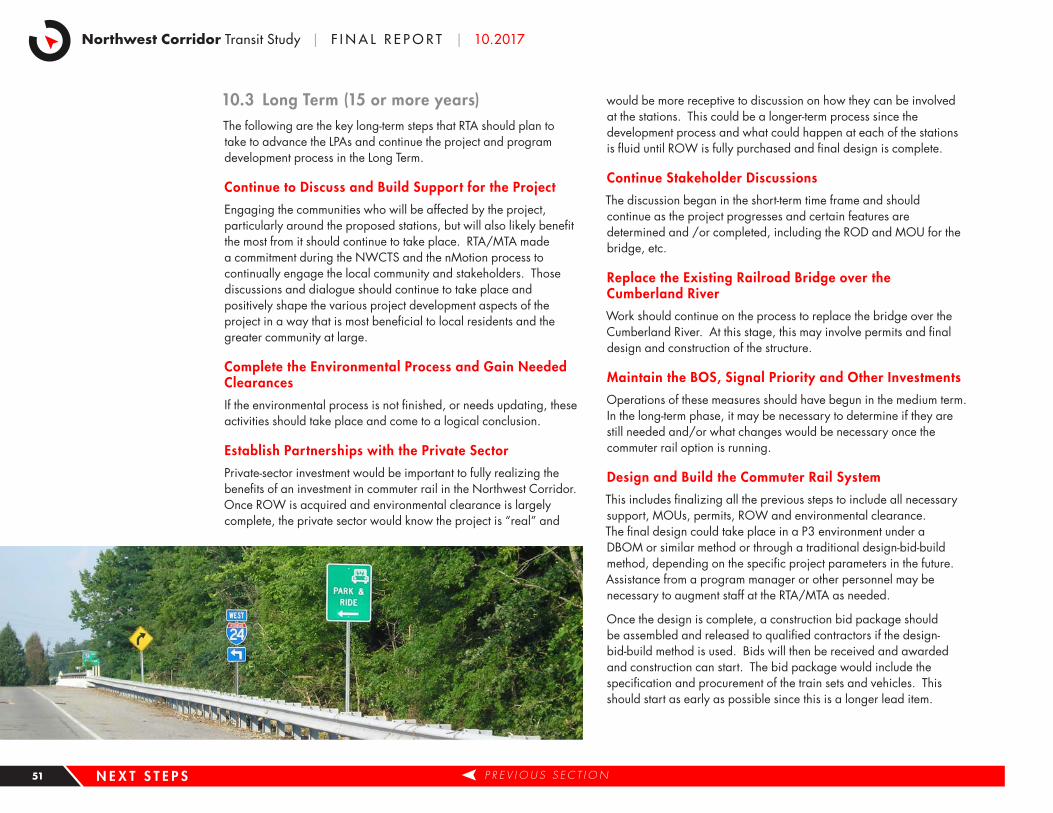
Northwest Corridor Transit Study | F I N A L R E P O R T | 10.2017
10 .3 Long Term (15 or more years)The following are the key long-term steps that RTA should plan to take to advance the LPAs and continue the project and program development process in the Long Term.
Continue to Discuss and Build Support for the Project
Engaging the communities who will be affected by the project, particularly around the proposed stations, but will also likely benefit the most from it should continue to take place. RTA/MTA made a commitment during the NWCTS and the nMotion process to continually engage the local community and stakeholders. Those discussions and dialogue should continue to take place and positively shape the various project development aspects of the project in a way that is most beneficial to local residents and the greater community at large.
Complete the Environmental Process and Gain Needed Clearances
If the environmental process is not finished, or needs updating, these activities should take place and come to a logical conclusion.
Establish Partnerships with the Private Sector
Private-sector investment would be important to fully realizing the benefits of an investment in commuter rail in the Northwest Corridor. Once ROW is acquired and environmental clearance is largely complete, the private sector would know the project is “real” and
would be more receptive to discussion on how they can be involved at the stations. This could be a longer-term process since the development process and what could happen at each of the stations is fluid until ROW is fully purchased and final design is complete.
Continue Stakeholder Discussions
The discussion began in the short-term time frame and should continue as the project progresses and certain features are determined and /or completed, including the ROD and MOU for the bridge, etc.
Replace the Existing Railroad Bridge over the Cumberland River
Work should continue on the process to replace the bridge over the Cumberland River. At this stage, this may involve permits and final design and construction of the structure.
Maintain the BOS, Signal Priority and Other Investments
Operations of these measures should have begun in the medium term. In the long-term phase, it may be necessary to determine if they are still needed and/or what changes would be necessary once the commuter rail option is running.
Design and Build the Commuter Rail System
This includes finalizing all the previous steps to include all necessary support, MOUs, permits, ROW and environmental clearance. The final design could take place in a P3 environment under a DBOM or similar method or through a traditional design-bid-build method, depending on the specific project parameters in the future. Assistance from a program manager or other personnel may be necessary to augment staff at the RTA/MTA as needed.
Once the design is complete, a construction bid package should be assembled and released to qualified contractors if the design-bid-build method is used. Bids will then be received and awarded and construction can start. The bid package would include the specification and procurement of the train sets and vehicles. This should start as early as possible since this is a longer lead item.
N E X T S T E P S P R E V I O U S S E C T I O N 51
Regional Transportation Authority of Middle Tennessee
R E TU R N
Northwest Corridor Transit StudySUMMARY OF FINDINGS AND RECOMMENDATIONS | 2017
Regional Transportation Authority of Middle Tennessee
© 2017 Northwest Corridor Transit Study. All rights reserved.