northwestern oklahoma state university annual reporting
TRANSCRIPT

2021 Report
(Academic Year 2019-2020)
Northwestern Oklahoma State UniversityAnnual Reporting Measures

Education Preparation Provider Mission Statement:
“We enlighten and empower our graduates through program excellence to educate those whom they serve.”

Education Preparation Provider Goals Graduates will:
Apply content and pedagogical skills to activate learning. (InTASC #1, #2, #3,
#4, #8; CAEP A.1, CAEP A.3)
Establish collaborative relationships with students, families, colleagues, and
stakeholders. (InTASC #10; CAEP A.3)
Respond to the needs of diverse learners. (InTASC #2; CAEP A.3)
Engage in continuous learning. (InTASC #9; CAEP A.4)
Employ reflective practices. (InTASC #10; CAEP A.4)

The following education programs at Northwestern Oklahoma State University are accredited by Specialized Professional
Associations through CAEP and by the Oklahoma Office for Educational Quality and Accountability:
Accreditation
Program Name Review by Status
Agriculture Education State Recognized until Fall 2023
Early Childhood Education NAEYC Recognized until 8/1/2026
Educational Leadership ELCC Recognized until 2/1/2026
Elementary Education ACEI Recognized until 2/1/2026
Health and Physical Education NASPE Recognized until 2/1/2026
Instrumental Music Education State Recognized until Fall 2023
Math Education State Recognized until Fall 2023
Mild/Moderate Disabilities CEC Recognized until 2/1/2026
Reading Specialist ILA/IRA Recognized until 8/1/2027
School Counseling State Recognized until Fall 2023
Science-Natural NSTA Recognized until 8/1/2027
Science-Chemistry NSTA Recognized w/conditions (data)
Science-Physics NSTA Recognized w/conditions (data)
Social Science Education NCSS Recognized until 8/1/2027
Vocal Music Education State Recognized until Fall 2023

Impact on P-12 Student Learning and
Development

P-12 Benchmark Data: Provided by Partner Schools
RIT Score - MAPS Benchmark Data
Program Completer Subject
Beginning Average
RIT Ending Average RIT Net Gain or Loss
Teacher 1-Early ChildhoodEarly Childhood 44.0 77.0 32.0
Teacher 2-ElementaryReading 182.0 188.0 6.0
Teacher 3-SecondaryChemistry 31.2
Teacher 4-ElementaryReading 50.0 66.0 16.0
Teacher 5-Early ChildhoodMath 614.0 666.0 52.0
Reading 509.0 597.0 88.0

P-12 Benchmark Data
The EPP partnered with area schools to obtain student benchmark data as assessed from Measures of
Academic Progress (MAPS) for completers of the EPP. The data show a gain for each program completer’s
P-12 student average except for chemistry. That teacher was unable to complete benchmark testing due to
the pandemic.
The largest gain was in early childhood reading with a gain of 88. The smallest gain was in elementary
reading with a gain of 6. Overall, the average gain was 38.8.

Indicators of Teaching Effectiveness

Teacher Leader Effectiveness (TLE) aggregate data are submitted as evidence that program completers
effectively apply professional knowledge, skills and dispositions. The TLE instruments are approved by the
Oklahoma State Department of Education (OSDE), and the Office of Educational Quality and Accountability
(OEQA).
The Tulsa TLE Rubric uses the scale 1=ineffective, 2=needs improvement, 3=effective, 4=highly effective,
5=superior. The Tulsa TLE measures five domains: Classroom Management, Instructional Effectiveness,
Professional Growth and Improvement, Interpersonal Skills, and Leadership. A score of 3 is the expected
rating for teachers; a score of M=3 is the EPP’s expected target score for completers.
Teacher Leader Effectiveness

Teacher Leader Effectiveness
No data were provided from the Oklahoma State Department of Education for the TLE for 2019-2020.

Satisfaction of Employers and Employment
Milestones

Administrator/Mentor Survey
The Oklahoma Office of Educational Quality and Accountability (OEQA) creates and administers the
First Year Teacher Mentor/Administrator Survey to mentors/administrators within the state who have
hired the EPP’s graduates as first year teachers. The survey is aligned to InTASC standards and seeks
information from mentors/administrators about the EPP’s program completer’s preparedness and
overall satisfaction with NWOSU graduates.

Administrator/Mentor Survey

Administrator/Mentor Survey

Administrator/Mentor Survey

Administrator/Mentor Survey

Analysis of Data:
• The survey consists of statements aligned with the InTASC standards to which respondents indicate the extent
to which they agree using a Likert rating scale of 1-4 with 1=Strongly Disagree; 2-Disagree; 3=Agree;
4=Strongly Agree to each of the statements.
• The results of the survey of mentors/administrator show responses of “Strongly Agree” and “Agree” in all
areas by a large majority.
• Nine out of the ten mentors/administrators responding to the survey indicated they “Strongly Agree” or
“Agree” that the EPP’s program effectively prepares completers to have a positive impact on P-12 student
learning and development.
• Qualitative data show mentors/administrators recommend more preparation in classroom management,
differentiated instruction, and working with students from diverse backgrounds.

Satisfaction of Completers

The Office of Educational Quality and Accountability creates and administers a survey to all first year
teachers every spring. The survey is aligned to the InTASC standards and seeks information from
program completers about the preparation provided by the EPP.
First Year Teacher Survey
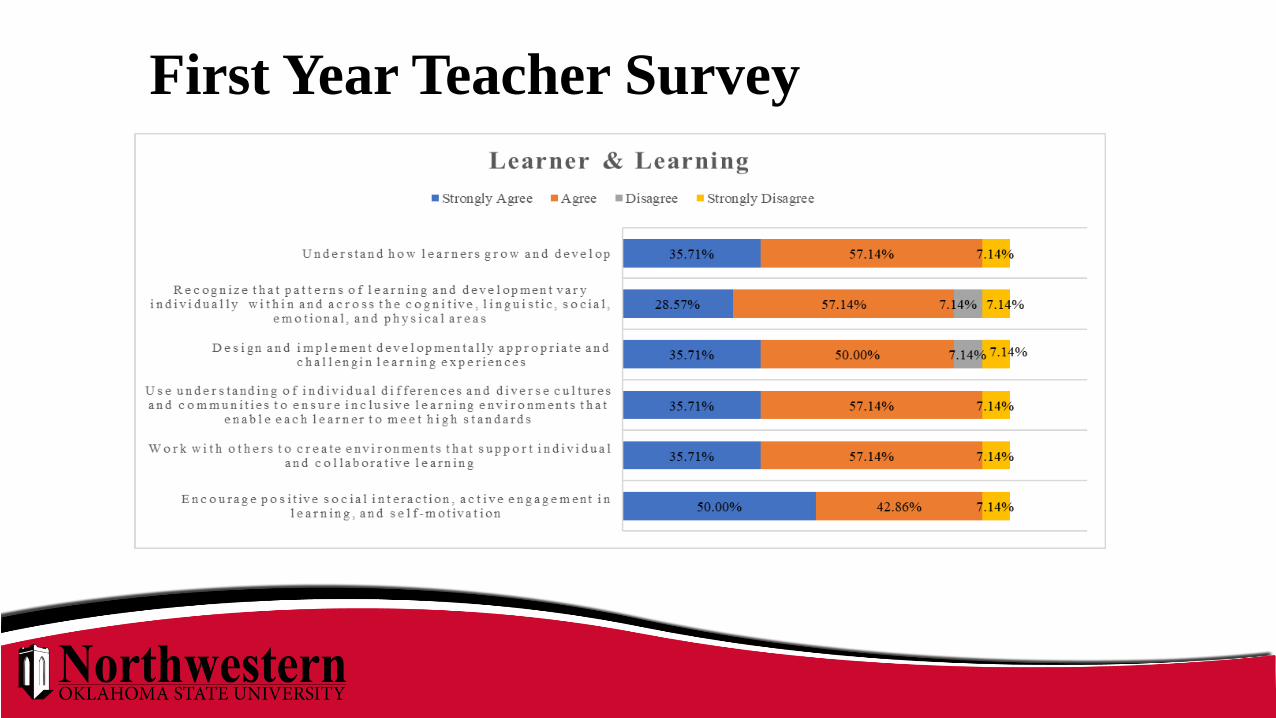
First Year Teacher Survey

First Year Teacher Survey

First Year Teacher Survey

First Year Teacher Survey

Analysis of Data:
• The survey consists of statements aligned with the InTASC standards to which respondents indicate the extent to which
they agree using a Likert rating scale of 1-4 with 1=Strongly Disagree; 2-Disagree; 3=Agree; 4=Strongly Agree to each of
the statements.
• The results of the survey of mentors/administrator show responses of “Strongly Agree” and “Agree” in all areas by a large
majority.
• Eleven of 13 first year teachers “Strongly Agree” or “Agree” the EPP’s program effectively prepares them to have a
positive impact on P-12 student learning and development.
• Qualitative data show that classroom management, using technology in the classroom, and working with English language
learners are the areas in which completers believe they need more preparation.

Advanced Employers

Analysis of Data: Employer
• Focus groups of employers of advanced completers were not held due to the pandemic.
• Formal survey forthcoming, delayed due to pandemic.

Advanced Completers

Analysis of Data: Completers
• Focus groups of advanced completers were not held due to the pandemic.
• Formal survey forthcoming, delayed due to pandemic.

Graduation Rates

In 2019-2020, Northwestern
Oklahoma State University
had 36 completers in 8 content
areas.
Initial Level Graduation RatesSPED
11%
ENGL
3%
ELEM
47%
ECE
11%
NATURAL SCIENCE
3%
HSSE
8%
HIST
11%
MUSIC
6%

Advanced Level Graduation Rates
In 2019-2020, Northwestern Oklahoma State
University had 11 completers in 2 content
areas.
Educational
Leadership
91%
School Counseling
9%

Ability to Meet Licensing Requirements

Certification Exams
In addition to completing an accredited university program, Oklahoma requires three tests with passing scores in
order to receive a teaching certificate. The tests are the Oklahoma General Education Test (OGET), the Oklahoma
Subject Area Test (OSAT), and the Oklahoma Professional Teaching Examination (OPTE).
The Office of Educational Quality and Accountability (OEQA) is responsible for the development and
implementation of the competency-based assessment system for educator licensure/certification in the state of
Oklahoma.
• The Oklahoma General Education Test (OGET) designed to assess state core general education knowledge
and skills, including critical thinking, computation, and communications (initial level).
• The Oklahoma Subject Area Tests (OSAT) designed to assess subject matter knowledge and skills (initial &
advanced).
• The Oklahoma Professional Teaching Examination (OPTE) designed to assess professional knowledge and
skills needed by entry-level Oklahoma educators (initial).

Oklahoma General Education Test (OGET)
Year NWOSU N = NWOSU % Pass State N = State % Pass2019-2020 11 63.6 2801 74
Candidates must have a passing score of 240 or higher in order to be admitted to the Teacher Education Program.

Oklahoma Subject Area Test
(OSAT)
2019-2020 OSAT SCORES
NWOSU STATE
TEST N %Pass N %Pass
Advanced Math - 25 60.0%
Agric Educ - 38 81.6%
Biological Sciences - 16 62.5%
Chemistry - 4 100.0%
Early Childhood 4 100.0% 219 67.6%
Elem Subtest 1 10 100.0% 391 93.1%
Elem Subtest 2 9 88.9% 395 80.8%
English 1 0.0% 80 60.8%
Instr/Gen Music - 51 90.2%
Mid/Interm. Math 1 100.0% 20 50.0%
Mild/Moderate 4 25.0% 75 77.3%
Physical Science - 1 100.0%
Physical
Ed/Health/Safety 6 66.7% 71 70.4%
US/OK Hist./Econ/Gov 2 100.0% 77 85.7%
World Hist/Geog - 32 78.1%
Vocal/Gen Music - 33 63.6%
Principal, Elementary 5 80.0% 174 69.0%
Principal, Secondary 5 60.0% 185 62.7%
Reading Specialist - 29 100.0%
School Counselor 2 100.0% 100 90.0%

Oklahoma Professional Teaching Examination Subject Area
Test (OPTE)
NWOSU State
Taken Pass Rate Taken Pass Rate
OPTE PK-8 25 74% 506 89.3%
OPTE 6-12 18 100.0% 294 94.9%

Ability of Completers to be Hired

NWOSU Completers Hired in Education Positions
HSSE
7%
ECE
15%
ELEM
45%
SPED
15%
NATURAL
SCIENCE
4%
MUSIC
7%
HIST
7%
Initial Level Completers
Educational
Leadership
40%
Reading
Specialist
40%
School
Counseling
20%
Advanced Completers

Consumer Information

Institutional Loan Default Rate
Initial/Advanced
3 Year Cohort
13.3
14.6
11.3
10.110.7
0
2
4
6
8
10
12
14
16
AY 2016 AY 2017 AY 2018 AY 2019 AY 2020 (draft)

Northwestern Oklahoma State University provides additional consumer information on its website:
Title II Report
CAEP Annual Report
Assessment and Institutional Effectiveness
Factbook for Northwestern Oklahoma State University

Dr. Christee Jenlink
Associate Dean of Education
Professor of Education
Northwestern - Alva
Education Center 205C
Phone: (580) 327-8450
For further information contact: