not just for ej anymore? may 2009. trb national transportation planning applications conference...
TRANSCRIPT

Not Just for EJ Anymore?
May 2009.
TRB National Transportation Planning Applications Conference
Bruce Kaplan
Central Transportation Planning Staff

Environmental Justice Legislation
• Title VI of Civil Rights Act of 1964• Executive Order 12898 (1994)
Identify and address disproportionately high and adverse human health or environmental effects on minority and low-income populations
Travel Forecasting – The Forgotten Tool for EJ Analysis
• EJ focus is often on:– Planning process of enfranchisement,
outreach, goal setting, definitions, needs assessment
– Public participation– Current equity, not future equity
• Identifying communities of concern• Present-day problems and empirical data• The magic of GIS overlays
– Evaluation of future projects not usually done

Benefit-vs.-Burden Evaluation of Future Projects
• Few MPOs appear to have used future-year regional model results for EJ evaluation
• Mostly done at the level of the whole Regional Transportation Plan, not for individual projects
• Yet there is a growing body of “how-to” literature– NCHRP 8-36(11) (2002)
– NCHRP 532 (2004)
– EJ and Transportation Toolkit – www.brejtp.com

Who Has Done It at Least Once?
• Atlanta• Baltimore• Bay Area (MTC)• Boston• Chicago• Columbus, OH
• Hartford• Greater LA
(SCAG)• Milwaukee• Seattle• San Antonio• Washington, DC

Recent Application for Boston Region MPO – Green Line Extension

Step 1: Locating Residential Target Populations in the Study Area
• Identify Cambridge, Medford, and Somerville Transportation Analysis Zones (TAZs) that are low income or minority:– Low income – Median household income at
or below 80% of the 2000 MPO median ($44,640)
– Minority – Minority population share greater than the 2000 MPO average (21.4%)

Performance Measures
• Accessibility to Jobs and Services– Within a 20-minute Auto or 40-minute
Transit trip (unweighted travel times) :• Basic, retail, and service employment
• Health care and higher education
• Averaged by number of TAZs in each category
– Average unweighted travel times to accessible jobs and services

Performance Measures
• Mobility, Congestion, and Environmental– Average Highway and Transit door-to-
door unweighted travel times for trips Produced in and Attracted to TAZ
– Vehicle-Miles Traveled per square mile
– CO emissions per square mile

Scenarios Studied
• 2030 No-Build Scenario Preferred Alternative for 2030 from Regional Transportation Plan without Green Line Extension
• Representative 2030 Build Scenario2030 No-Build Scenario with D Branch extended to Mystic Valley Parkway (with 300 parking spaces) and E Branch extended to Union Square

Transit Accessibility to Jobs
Using Unweighted Total Travel Times
Average Number of Jobs within 40 Minutes via TransitBasic Retail Service
EJ Non-EJ EJ Non-EJ EJ Non-EJNo-Build Scenario 57,953 45,652 51,617 40,824 384,920 301,423Build Scenario 61,485 48,140 55,085 43,789 407,592 320,678Build vs No-Build 6.1% 5.5% 6.7% 7.3% 5.9% 6.4%
Average Transit Travel Time (minutes) to Transit-Accessible JobsNo-Build Scenario 32.9 34.4 32.1 34.0 32.0 34.1Build Scenario 32.5 34.2 31.6 33.8 31.3 33.7Build vs No-Build -1.2% -0.7% -1.5% -0.5% -2.1% -1.0%

Highway Accessibility to Jobs
Using Unweighted Total Travel Times
Average Number of Jobs within 20 Minutes via HighwayBasic Retail Service
EJ Non-EJ EJ Non-EJ EJ Non-EJAll Scenarios 151,055 155,007 116,377 116,692 702,381 695,968
Average Highway Travel Time (minutes) to Highway-Accessible JobsAll Scenarios 13.1 14.3 12.3 13.6 12.0 13.7

Transit Accessibility to Services
Using Unweighted Total Travel Times
College Enrollment Hospital BedsEJ Non-EJ EJ Non-EJ
No-Build Scenario 51,875 34,333 3,039 2,337Build Scenario 55,808 36,450 3,337 2,553Build vs No-Build 7.6% 6.2% 9.8% 9.3%
No-Build Scenario 32.1 33.5 32.5 34.3Build Scenario 31.9 33.4 32.0 33.9Build vs No-Build -0.5% -0.2% -1.5% -1.0%
Average Number of Services within 40 Minutes via Transit
Average Transit Travel Times (minutes) to Transit-Accessible Services

Highway Accessibility to Services
Using Unweighted Total Travel Times
College Enrollment Hospital BedsEJ Non-EJ EJ Non-EJ
All Scenarios 98,994 91,081 8,957 8,183
All Scenarios 11.8 13.6 12.7 13.2
Average Number of Services within 20 Minutes via Highway
Average Highway Travel Times (minutes) to Highway-Accessible Services

Changes in Mobility
Using Unweighted Total Travel Times
Average Transit Door-to-Door Travel Times (minutes)Trips Produced Trips Attracted
EJ Non-EJ EJ Non-EJNo-Build Scenario 35.8 38.3 40.5 40.6Build Scenario 35.1 37.9 40.0 40.4Build vs No-Build -2.0% -1.1% -1.2% -0.5%
Average Highway Door-to-Door Travel Times (minutes)All Scenarios 11.8 11.5 15.3 12.6

Changes in Congestionand Air Quality
Using Unweighted Total Travel Times
VMT per Sq Mi CO per Sq miEJ Non-EJ EJ Non-EJ
No-Build Scenario 189,606 142,358 1,623,838 1,225,150Build Scenario 188,488 141,870 1,614,202 1,220,942Build vs No-Build -0.6% -0.3% -0.6% -0.3%

Step 1 Again, but for Disability
Identify Disability Population TAZs in Cambridge, Medford, and Somerville:
TAZs in which the percentage of population with a disability (persons over 5 yrs. old reporting themselves as having a disability) is greater than the eastern Massachusetts average (17.6%).

Disability TAZs
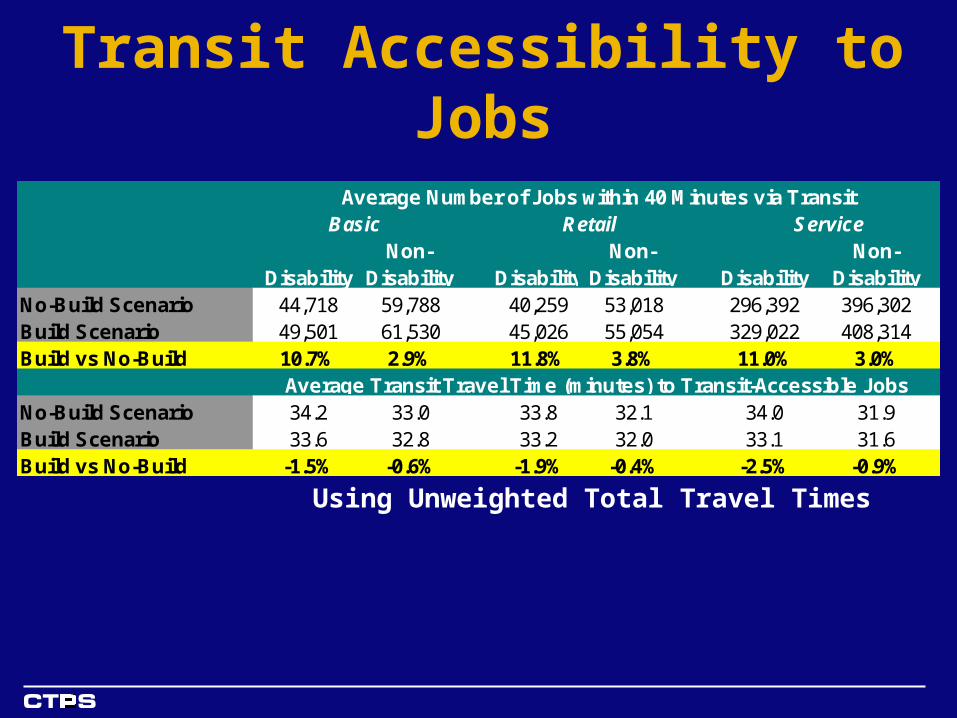
Transit Accessibility to Jobs
Using Unweighted Total Travel Times
Average Number of Jobs within 40 Minutes via TransitBasic Retail Service
DisabilityNon-
Disability DisabilityNon-
Disability DisabilityNon-
DisabilityNo-Build Scenario 44,718 59,788 40,259 53,018 296,392 396,302Build Scenario 49,501 61,530 45,026 55,054 329,022 408,314Build vs No-Build 10.7% 2.9% 11.8% 3.8% 11.0% 3.0%
Average Transit Travel Time (minutes) to Transit-Accessible JobsNo-Build Scenario 34.2 33.0 33.8 32.1 34.0 31.9Build Scenario 33.6 32.8 33.2 32.0 33.1 31.6Build vs No-Build -1.5% -0.6% -1.9% -0.4% -2.5% -0.9%

Highway Accessibility to Jobs
Using Unweighted Total Travel Times
Average Number of Jobs within 20 Minutes via HighwayBasic Retail Service
DisabilityNon-
Disability DisabilityNon-
Disability DisabilityNon-
DisabilityAll Scenarios 159,161 147,308 119,085 114,389 697,522 701,665
Average Highway Travel Time (minutes) to Highway-Accessible JobsAll Scenarios 13.6 13.5 12.9 12.7 12.7 12.7
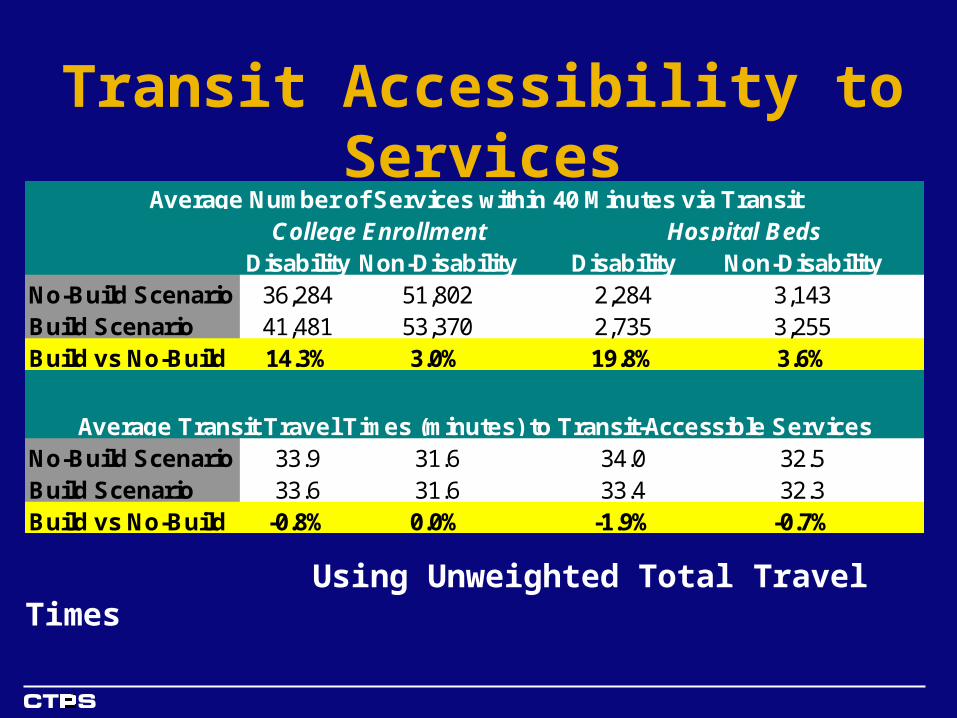
Transit Accessibility to Services
Using Unweighted Total Travel Times
Disability Non-Disability Disability Non-DisabilityNo-Build Scenario 36,284 51,802 2,284 3,143Build Scenario 41,481 53,370 2,735 3,255Build vs No-Build 14.3% 3.0% 19.8% 3.6%
No-Build Scenario 33.9 31.6 34.0 32.5Build Scenario 33.6 31.6 33.4 32.3Build vs No-Build -0.8% 0.0% -1.9% -0.7%
Average Number of Services within 40 Minutes via Transit
Average Transit Travel Times (minutes) to Transit-Accessible Services
College Enrollment Hospital Beds

Highway Accessibility to Services
Using Unweighted Total Travel Times
College Enrollment Hospital BedsDisability Non-Disability Disability Non-Disability
All Scenarios 91,767 99,120 8,439 8,814
All Scenarios 13.0 12.1 12.6 13.1
Average Number of Services within 20 Minutes via Highway
Average Highway Travel Times (minutes) to Highway-Accessible Services

Changes in Mobility
Using Unweighted Total Travel Times
Average Transit Door-to-Door Travel Times (minutes)Trips Produced Trips Attracted
Disability Non-Disability Disability Non-DisabilityNo-Build Scenario 39.2 34.9 41.6 39.7Build Scenario 38.2 34.6 41.0 39.5Build vs No-Build -2.6% -0.7% -1.4% -0.5%
Average Highway Door-to-Door Travel Times (minutes)All Scenarios 12.0 11.5 14.0 14.5

Changes in Congestionand Air Quality
Using Unweighted Total Travel Times
VMT per Sq Mi CO per Sq miDisability Non-Disability Disability Non-Disability
No-Build Scenario 185,946 158,003 1,598,700 1,352,455Build Scenario 184,891 157,294 1,589,598 1,346,358Build vs No-Build -0.6% -0.4% -0.6% -0.5%

Summary of Findings
• In all cases measured, Green Line Extension will benefit Environmental Justice and Disability Population TAZs
• In most cases measured, benefits are greater for the Environmental Justice and Disability Population TAZs than for other TAZs

Methodological Issues/Problems Specific
to the CTPS Model• Use of current target population geography
and definitions for future assessment (for example, ethnicity stays constant)
• Geographic mismatch between census geography and TAZs
• Health care = hospital beds• Income not a mode choice parameter• Mismatch between employment needs of
low-income populations and “accessible” jobs
• Room for expansion of air quality analysis

General Methodological Issues/Problems
• Severe demographic uncertainty, especially at TAZ level
• Getting around using current-year definitions and geography for future-year work
• Defining “Disabled” and/or other “non-EJ” communities of concern
• Difficulty associated with Project/Study Area level vs. RTP level
• Weighted time vs. unweighted time vs. impedance
• Benefit/Burden threshold

Further Thoughts
More dialogue needed between modelers and others involved in EJ process/analysis– Others unaware of how model outputs can
be used for evaluation and assessment– Modeling community needs to take
proactive stance

Further Thoughts
• Room for methodological refinement• Room for expansion of slate of
performance measures• When model-related work is done for EJ
or other “community” analysis, make sure it sees the light of day and is incorporated into documents

Contact InformationBruce Kaplan
[email protected] Transportation Planner
Chief Transportation Planner
Scott [email protected]
Manager of Transportation Systems Analysis
Central Transportation Planning Staffto the
Boston Region Metropolitan Planning Organization www.bostonmpo.org