notice this document is disseminated under the … · 2011-09-26 · for pratt and whitney jt8d·7a...
TRANSCRIPT

i
Report No. FAA·CT·79·53
t"'/EXHAUST EMISSIONS CHARACTERISTICS AND VARIABILITY FOR PRATT AND WHITNEY JT8D·7A GAS l'URBINE
ENGINES SUBJECTED TO MAJOR OVERHAUL AND REPAIR
, j ERIC E. BECKER •
GARY FRINGS WILLIAM C. CAYAGE
•
:~ . • •
FINAL REPORT
SEPTEMBER 1980
Document IS available to the U S publiC through
the National Technical Information Service,
Spcrngfleld, Vrrglnla 22161.
Prepared for
U. S. DEPARTMENT OF TRANSPORTATION FEDERAL AVIATION ADMINISTRATION
TECHNiCAl CENTER Atlantic City Airport, New Jersey 08405
NOTICE
This document is disseminated under the sponsorship of the Department of Transportation in the interest of information exchange. The United States Government assumes no liability for the contents or use thereof.
The United States Government does not endorse products or manufacturers. Trade or manufacturer's names appear herein solely because they are considered essential to the object of this report.

Technical Repart Oacumentatian Page
I. Report No. 2. Government Acce.lion No.
FAA-CT-79-53 4. Titl. and Subtitle
EXHAUST EMISSIONS CHARACTERISTICS AND VARIABILITY FOR PRATT AND WHITNEY JT8D-7A GAS TURBINE ENGINES SUBJECTED TO MAJOR OVERHAUL AND REPAIR
7. Author' ,} Eric E. Becker. Gary Frings, and William C. CavaJl:e
9. Performing Orgoni zolion Nome and Address
Federal Aviation Administration Technical Center Atlantic City Airport, New Jersey 08405
12. Sponloring Agency Nome and Addreu
U.S. Department of Transportation Federal Aviation Administration Technical Center Atlantic City Airport, New Jersey 08405 15. Supplementary Note.
16. Ab,troc'
Seven Pratt and Whitney Aircraft (PWA) JT8D-7A turbofan engines were tested at Kennedy International Airport, New York, to evaluate exhaust emissions characteristics and data variability after overhaul. The measured data show that the engines tested did not meet the Environmental Protection Agency (EPA) emission standards. A comparison of the measured data, obtained from the seven overhauled engines evaluated under this program. with new engine data obtained from PWA show that there is a great deal of similarity between the two sets of data. Differences shown in this report between new engine and overhauled engine data are due to the quantity of the engines sampled; the new engine data represent a larger sample size. Satisfactory data can be measured by using the test procedures. instrumentation, and equipment defined in this report.
17. Key Word.
Exhaust Emissions Air Pollution Oxides of Nitrogen Turbine Engines Carbon Monoxide Hydrocarbons
3. Recipient', ell,olag No.
5. Report Oat.
Seotember 1980 6. Performing Organization Code
8. P.rforming Orgonization Repor' No.
FAA-CT-79-53 10. Work Unit No. lTRAIS)
II. Contrac' or Grant No.
201-521-100 13. Type of Report and Period Covered
Final November 78-Februarv 79
14. Sponloring Agency Code
18. Di.tribution State,"ent
Document is available to the U.S. public through the National Technical Information Service, Springf ie ld, Virginia 22161
21. No. of Page. 22. Pric.e20. Security Clanif. (of thi. page)19. Sec.lJrity Claud. (af 'his report)
Unciass Hied 50Unci as. ified
Farm DOT F 1700.7 18_72) ""roduction of completed poge outhodaed
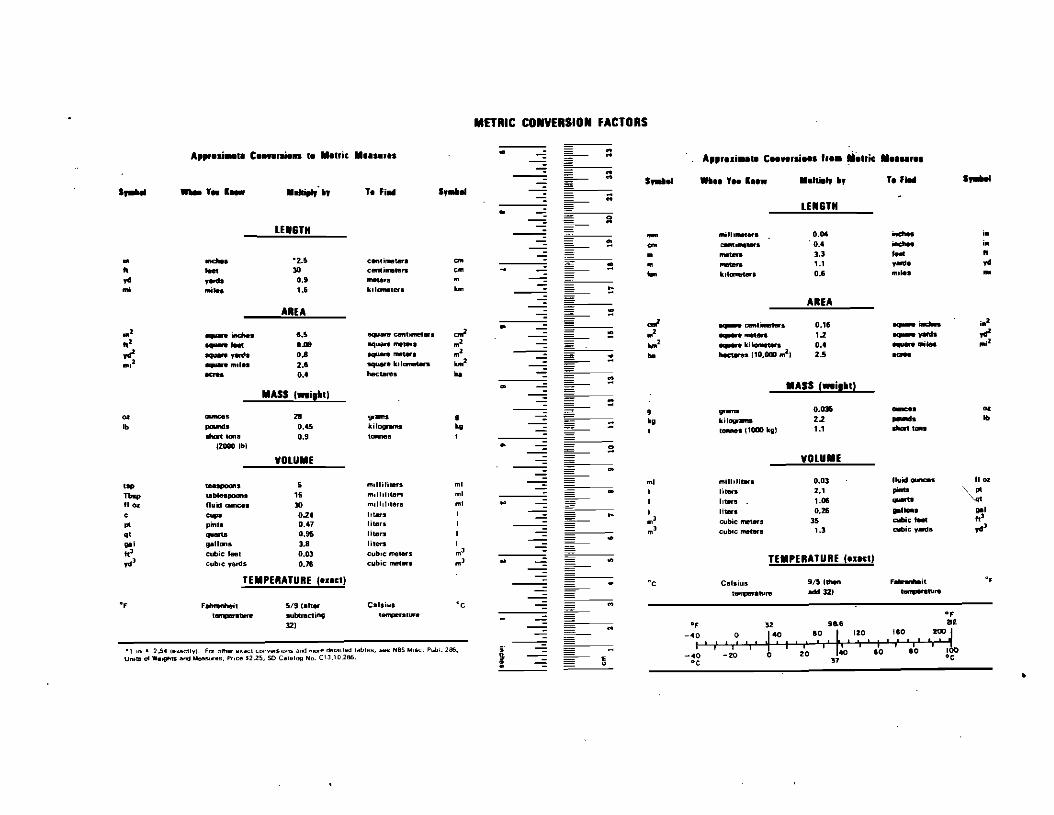
MfTRIC COIIVERSIOII FACTORS
A"r.Ii_.1 C r e lIe.,ic II....... .: _::: A"r• .ri c h •• ~.tric ,••
_ :: s,.... ... ,•• I... ..Itie., ~, r. f. .,.... ..... .... y_ 1_ ......,:~, r. fi.. I,.... ...
• - - " LEISTH
LEISTH = ~
_ ...11,_.... ..dies0.04 in
~ em CIIM''''-ll ' 0.4 inchMI i.. _ _ '" IIIetfIq ].] _ It
OIl • l.r. eM' imeter. em =- ~ • III IIIet8r& 1.1 ,_. yd
.. .... JO centi.....rs ell! -- ....... k,'--' 0.& III,Ie. 1111 yd ,.... .-ce.. 0.1 III
ftIi _'-to 1.& 1"lonelerll Iun ~
- AREA WA ~
.. - = oJ ..... cenl...... 0.1' ~ ill2
..2 indte. ..r. -.._ cent.""".. enil ::,;.............. ,.2. Y8fds ".i',,2: 0.09 sq Inll'..... JfI2 _ .....2 ...... ki'-Un 0.. ......._ lIIi2
..,.r yatll 0.8 mew. ~ ... IilII heeWes (10,0lIl ~l 2.5 .... ",,2 "'.... 2.' square k.l........ ~ _
__ 0.. hecUlRlll ... _ CIS
• - _ - MASS f..i'~ll MASS (..i,~ll - " _.1= 9 .,...,... O.Q3IIj 01:
01' c.mcell 21 ~ II 1111 kil~ 2.2 .......-I. III Ib pcuods 0.45 a,I._ 1111 1 1__ 1'000 kill 1.1 ...... 1...1
...... Ions 0.9 tannes I - ",,~_---,: 12000 Ibl • - = <:>
VOLUME - - VOLUME. t .. 5 1II,IIilil8l'1I 1111 - 1111 ",illllibtra 0.03 lIuid QllllC85 1102 SIt spoons _. 2 1 pt.... " III
Tt.p U1blespoans 15 ""llIlIte... ml - I llten. '41 II OlE fluid monc:.. 30 ",,1I11uers ml" _ I II_s 1.. ...... c c.... 0.2. liter'll I t- I J 11-:. 0.5 ..l~. ~I III pint. 0.47 liters I InJ cubIc Inll't..., 35 ~C .... J ql qIIIIrU 0.95 liter'll I - m c ...b,c Inll'btrs 1.3 cubIC ,-.ds yd
~I gall~s 3.8 liter'll 1
tr cubic feel 0.03 c ...b~c me_s mJ
: - ... TEMPERATURE (.IICI)JydJ c ...b,c yards 0.76 cubIC rnlI1.... m .. •
TEMPERATURE (....CI) -... °c Cel.i s illithen Fe......it OF
_ t 11.1'" add 12, .,...,..,.'" OF Fehrlftheil 5/9 (.hlll" C.lsi.... "c _ ...
IlIftIPIII"IturII .....,.,..eting Ulfnper.IUfIl _ _ DF J2J c<l DF '2 i&6 212
_. _ -4~" 'l~ '14~1 'lll~l' li,I~O, I ,1;°'11 !lr;'~'I' 'lor•• 2,54 le.actlyl. For olher "X;Jet conve<$,ons and "lOfe demded t"bles...........85 1II.6C. P""I. 286. :2 -... ( 20 f40 10 10 100 Un,b>'" W.,gh1S arG Measures, Pt,ce 52.25. SO CatalOll "'0. CIJ.l0.286. g. 'E -:0 - 20 0'1 °c
: _ - u C:.... ~-------------------•

PREFACE
The authors wish to acknowledge the cooperat ion which was extended them by the management and personnel of Pan American World Airways, JFK International Airport, New York. Their assistance to the FAA personnel during the time period of this work is gratefully appreciated.
iii
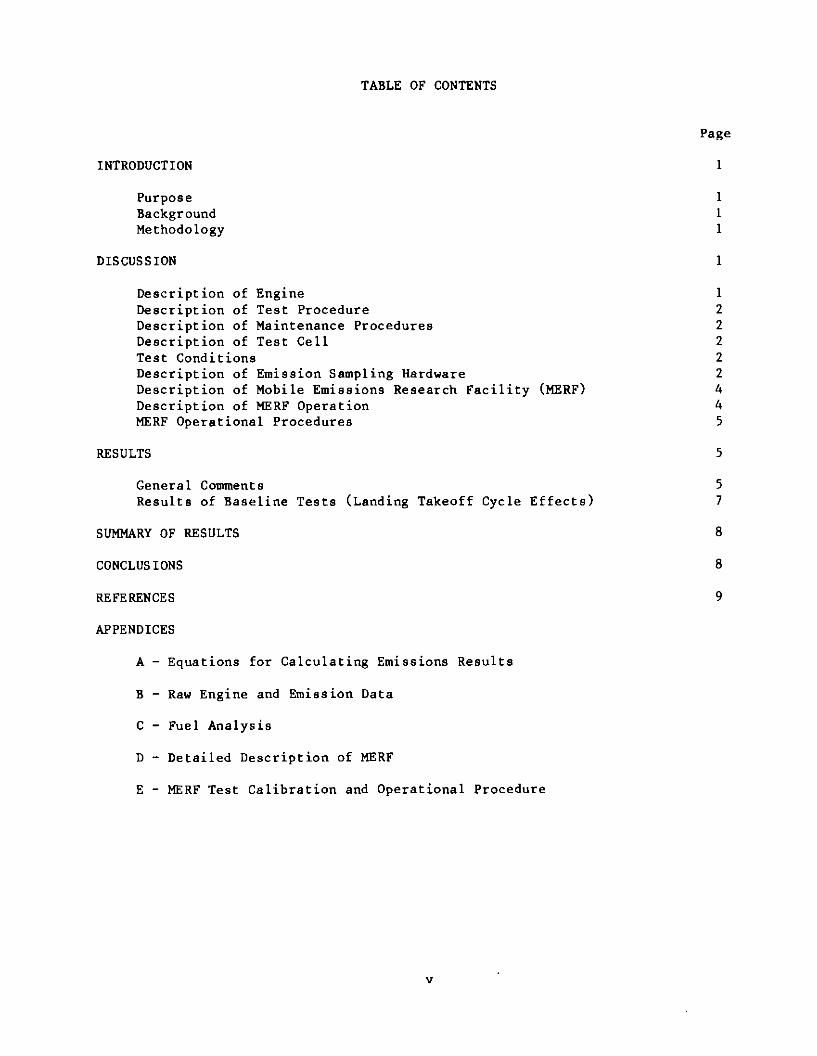
TABLE OF CONTENTS
Page
INTRODUCTION I
APPENDICES
A - Equations for Calculating Emissions Results
B - Raw Engine and Emission Data
C - Fuel Analysis
D - Detailed Description of HERF
E - HERF Test Calibration and Operational Procedure
Purpose I Background I Methodology I
DISCUSSION I
Description of Engine I Description of Test Procedure 2 Description of Maintenance Procedures 2 Description of Test Cell 2 Test Conditions 2 Description of Emission Sampling Hardware 2 Description of Mobile Emissions Research Facility (HERF) 4 Description of HERF Operation 4 HERF Operational Procedures 5
RESULTS 5
General Comments 5 Results of Baseline Tests (Landing Takeoff Cycle Effects) 7
SUMMARY OF RESULTS 8
CONCLUS IONS 8
REFERENCES 9
v
Figure
1
2
3
4
5
6
7
8
9
10
11
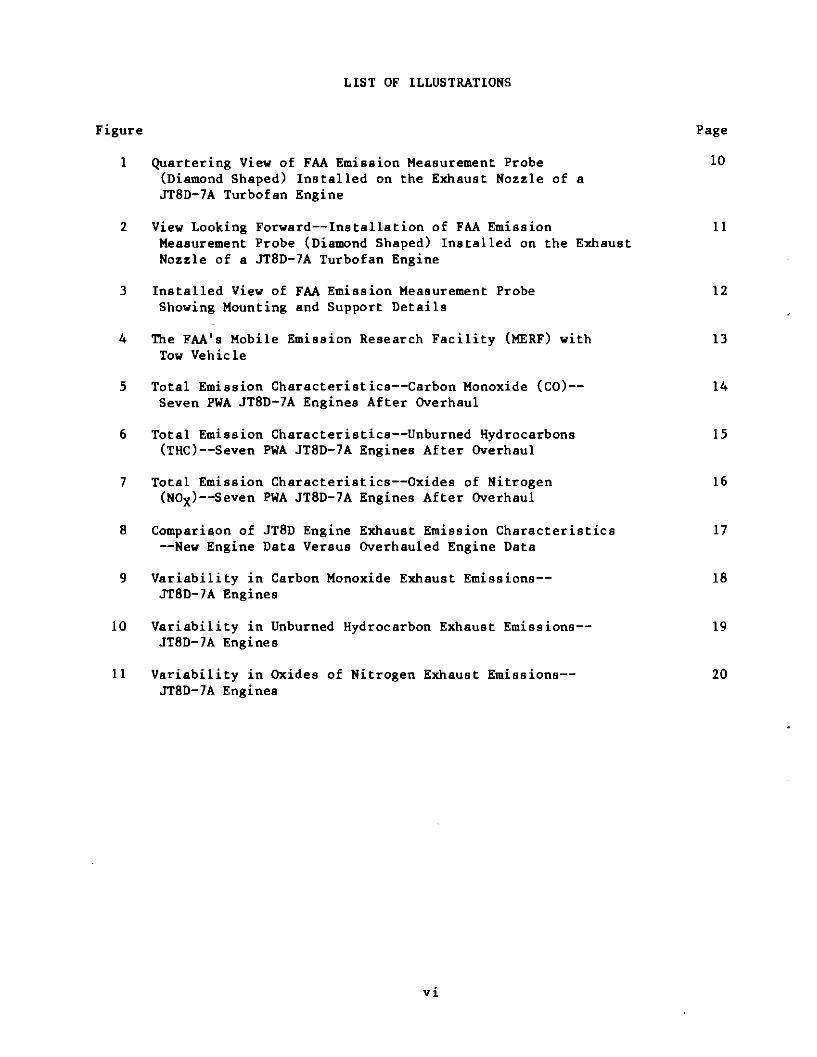
LIST OF ILLUSTRATIONS
Page
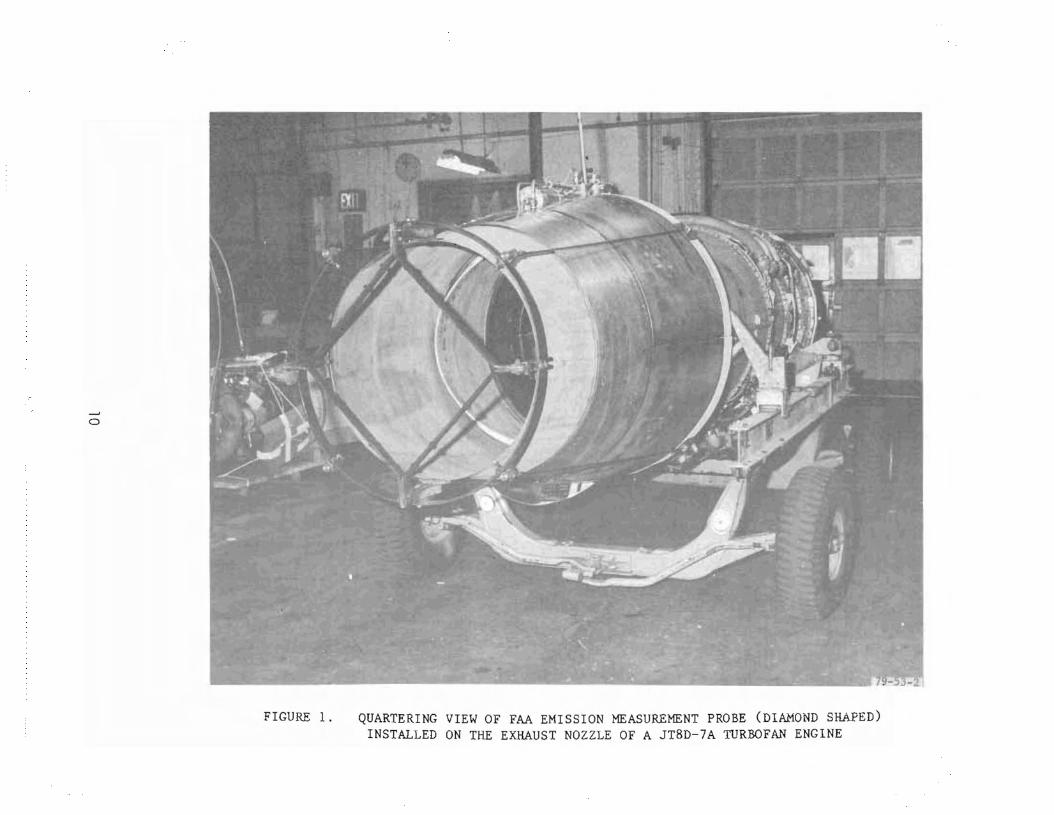
Quartering View of FAA Emission Measurement Probe (Diamond Shaped) Installed on the Exhaust Nozzle JT8D-7A Turbofan Engine
of a 10
View Looking Forward--Installation of FAA Emission Measurement Probe (Diamond Shaped) Installed on the Exhaust Nozzle of a JT8D-7A Turbofan Engine
11
Installed View of FAA Emission Measurement Probe Showing Mounting and Support Details
12
The FAA's Mobile Emission Research Facility (HERF) Tow Vehicle
with 13
Total Emission Characteristics--Carbon Monoxide Seven PWA JT8D-7A Engines After Overhaul
(CO)- 14
Total Emission Characteristics--Unburned Hydrocarbons (THC)--Seven PWA JT8D-7A Engines After Overhaul
15
Total Emission Characteristics--Oxides of Nitrogen (NOX)--Seven PWA JT8D-7A Engines After Overhaul
16
Comparison of JT8D Engine Exhaust Emission Characteristics --New Engine Data Versus Overhauled Engine Data
17
Variability in Carbon Monoxide Exhaust Emissions-JT8D-7A Engines
18
Variability in Unburned JT8D-7A Engines
Hydrocarbon Exhaust Emissions- 19
Vsriability in Oxides JT8D-7A Engines
of Nitrogen Exhaust Emissions- 20
vi
LIST OF TABLES
Table Page
1 Average Corrected Parameters for Seven Engines 3
2 Test Sequence for JT8D-7A Engines 5
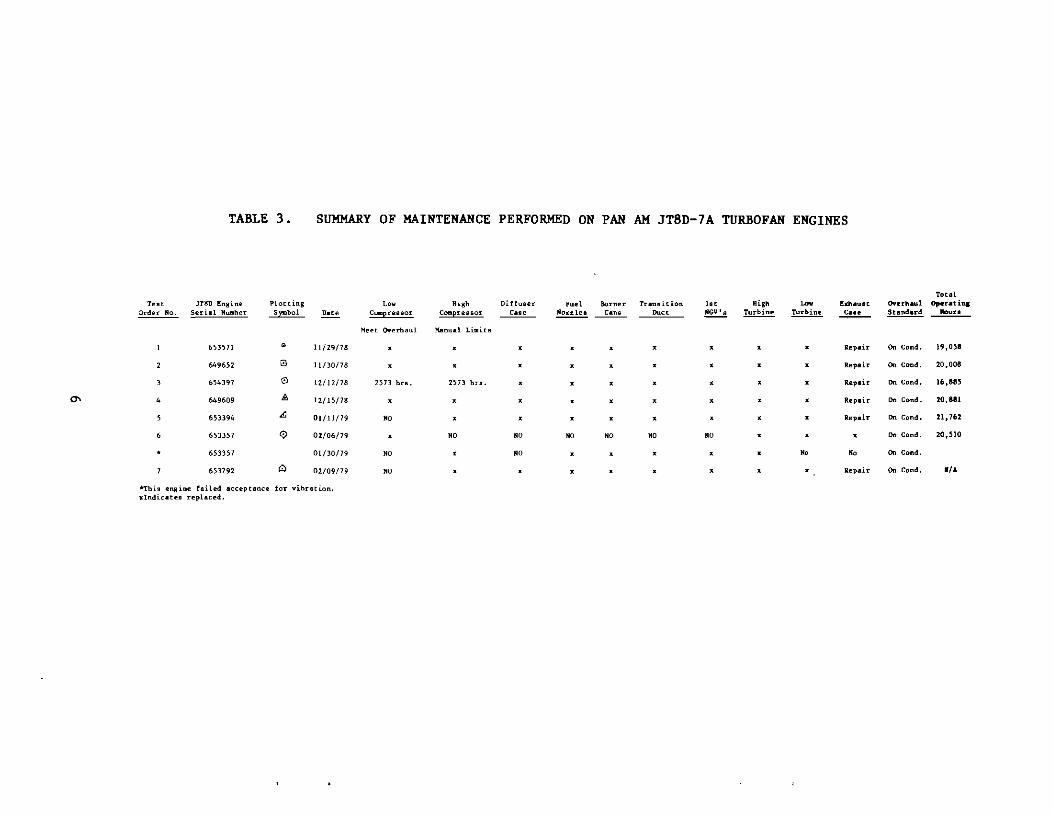
3 Summary of Maintenance Performed on Pan Am 6 JT8D-7A Turbofan Engines
4 Summary of Ambient Test Conditions 7
5 Average Emiaaion Rate Levels Measured 7
vii

INTRODUCTION
PURPOSE.
The objectives of this investigation were to quantify exhaust emission levels of aircraft turbine engines which had undergone ext ens ive maintenance J determine the variability of these emission levels, and evaluate to what extent these emission levels were affected by various types of maintenance.
BACKGROUND.
In accordance with the Clean Air Act and the Clean Air Amendments of 1970 (reference 1), the Environmental Protection Agency (EPA) in 1973 established aircraft turbine engine emission standards. The Department of Transportation and, specifically the Federal Aviation Administration (FAA). were charged with promulgating regulations enforcing these standards. Changes to these standards (40 CFR. Part 87) (reference 2) have been drafted and are being evaluated. but there remains a requirement to quantify the emission levels of turbine engines throughout their operational life. To meet this requirement) the emission leve Is of newly manufactured engines have been and still are being investigated. Present data on the effects of "heavy" and "on condition" maintenance on turbine engine emiss ion leve Is are limi ted. In order to formulate regulations for control of aircraft exhaust emissions and to establish the requirements for redemonstration of compliance with EPA standards after initial certification, the FAA must have a firm indication of the effects of such maintenance on turbine engine emission levels.
This report provides emission data from Pratt and Whitney (PWA) JT8D engines tested at the Pan American World Airways (Pan Am) facilities located at John F. Kennedy International Airport (JFK). New York. The data herein will further
enhance that data base required by the FAA so that reasonable and appropriate standards and retest requirements can be prepared.
METHODOLOGY.
The turbine engine exhaust constituents which were measured included carbon monoxide (CO), carbon dioxide (C02), hydrocarbons (THC). oxides of nitrogen (NO x ). and oxygen (02)' It was determined that three engine types would be tested: the PWA JT8D-7A, JT9D-7A, and the General Electric CF6-50. These engines were selected on the bas is of their high in-use rate, expected longterm service. and availability of new engine emission data. This document will report the JT8D-7A test results.
A contractual effort with Pan Am was initiated wherein they supplied the engine. test cell facilities, support personnel, and necessary engine documentat ion. The FAA provided the emission measuring equipment and support personnel for its operation. Seven JT8D-7A engine tests were conducted at the main Pan Am maintenance facility located at JFK. Jamaica. New York. These engines were shipped to JFK for normal lion condition ll maintenance from Pan Am's Internal German Service Division fleet of B727 aircraft located in Europe.
DISCUSSION
DESCRIPTION OF ENGINE.
The PWA JT8D-7A is an axial flow. front turbofan, two-spool engine rated at 14, 000 pounds thrus to A s ix-s tage low-pressure compressor (Nl) is driven by the second-. third-, and fourth-stage turbines, While a seven-stage highpressure compressor (N2) is driven by the first-stage turbine. The two-stage fan discharges into a full length annular duct which permits mixing of the
1
secondary air and primary gas flows in a common exhaust nozzle. The combustion section consists of nine individual can-annular combustion chambers which incorporate individual dual orifice type fuel nozzles (reference 3). Table 1 lists average corrected engine parameters encountered during testing.
All Pan Am JT8D engines are operated to JT8D-l specifications. The primary difference between the two models is: the -7A is thrust rated to 84" F while the -I is thrust rated to 59" F. The engines tested included four JT8D-I mode Is and three JT8D-7 mode Is on the data plates. These engines have been hardware reconfigured to JT8D-7A requirements and specifications.
DESCRIPTION OF TEST PROCEDURE.
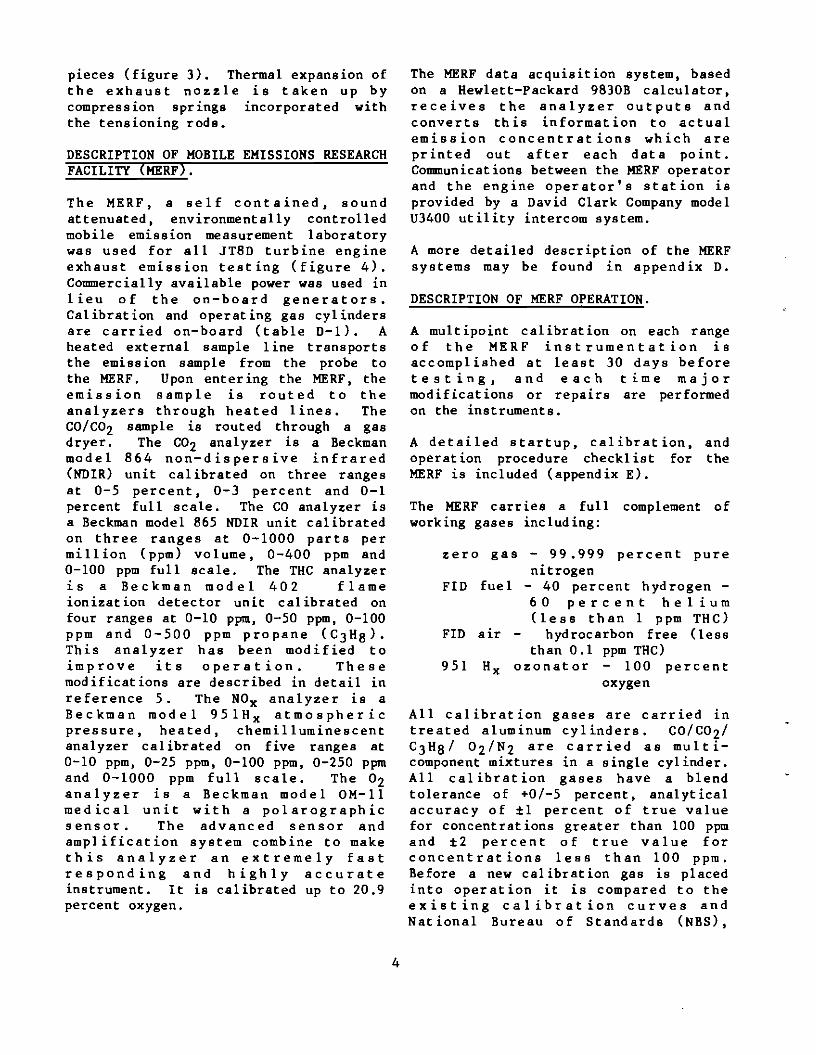
Since engine performance acceptance testing and emission sample testing were conducted concurrently, a modified test sequence was adopted which would satisfy both requirements (table 2).
Prior to testin.g for emissions, the engine was trimmed in accordance with specified PWA!Pan Am trim procedures.
After the engine was triDDDed, the power was sequentual1y increased in steps as shown in table 2. The stabilization times listed in table 2 were required for the engine emissions to achieve equilibrium.
DESCRIPTION OF MAINTENANCE PROCEDURES.
The Pan Am JT8D-7A engines were maintained "on condition. 1I The term "on condi tion" refers to a general industry wide maintenance practice which dictates an engine is removed from service only on the condition that maintenance is required. This differs from the older policy of removing an engine from service due to the accumulation of time on various rotating components (disc restrictions). "On condition" maintenance also implies doing the
repair or replacement of any other parts found to be faulty during a maintenance tear-down. Table 3 lists the maintenance performed on the engines prior to testing. Note that most of the major components have been replaced. These engines were airlifted to JFK for major maintenance (overhaul) from Germany.
DESCRIPTION OF TEST CELL.
Pan Am's test cell number 1 at JFK was used for all JT8D-7A exhaust emission testing. This is a sea level test cell incorporating inlet and exhaust sound suppression. The only modification to the test cell was the drilling of a 4-inch diameter hole in one wall through which the emission sample line was routed. The engine was mounted on a thrust measuring stand. Engine instrumentation was typical of that required for production engine performance testing. All engine data were manually recorded and processed.
TEST CONDITIONS.
All JT8D-7A engine tests were conducted between November 29, 1978, and February 9, 1979. Table 4 lists the minimum and maximum ambient conditions encountered during testing.
DESCRIPTION OF EMISSION SAMPLING HARDWARE.
The emission sampling probe utilized for JT8D-7A testing is an FAA developed design (reference 4, and figures 1 and 2). Generally, the probe consists of a tube in the shape of a diamond. Each leg of the diamond contains three equally spaced sampling holes of equal diameter. The sampling tube was secured to a backup structure and positioned on the exhaust nozzle rim with four equi-spaced clevis mounting pads. The entire structure was secured to the engine using four tensioning rods between the engine frame and a torsional support ring attached to the clevis
2

TABLE 1. AVERAGE CORRECTED PARAMETERS FOR SEVEN ENGINES
Power
Thrust Net
(lbs)
Fuel Flow
(lbs!hr)
Thrust Specific Fuel
Consumption (lbs!hr!lb)
N1 (rpm)
N2 (rpm)
Exhaust Gas Temp(G C)
Engine Pressure Ratio
Idle Out 1197 998 0.834 2945 7095 374 1.085
w
Takeoff
85%
13692
11577
8156
6630
0.596
0.573
8088
7558
11532
11144
544
498
1.98
1. 78
30% 4429 2499 0.564 5395 9506 349 1.25
Idle 1122 959 .855 2889 7018 373 1.085
pieces (figure 3). Thermal expansion of the exhaust nozzle is taken up by compression springs incorporated with the tensioning rods.
DESCRIPTION OF MOBILE EMISSIONS RESEARCH FACILITY (MERF).
The MERF, a self contained, sound attenuated, environmentally controlled mobile emission measurement laboratory was used for all JT8D turbine engine exhaust emission testing (figure 4). Commercially available power was used in 1 ieu of the on-board generators. Cal ibrat ion and operat ing gas cyl inders are carried on-board (table D-l). A heated external sample 1 ine transports the emiss ion sample from the probe to the MERF. Upon enter ing the MERF, the emission sample is routed to the analyzers through heated lines. The CO/C02 sample is routed through a gas dryer. The C02 analyzer is a Beckman model 864 non-dispersive infrared (NDIR) unit calibrated on three ranges at 0-5 percent, 0-3 percent and 0-1 percent full scale. The CO analyzer is a Beckman model 865 NDIR unit calibrated on three ranges at 0-1000 parts per mi 11 ion (ppm) vo 1 ume, 0-400 ppm and 0-100 ppm full scale. The THC analyzer is a Beckman model 402 flame ionizat ion detector unit cal ibrated on four ranges at 0-10 ppm, 0-50 ppm, 0-100 ppm and 0-500 ppm propane (C3H8)' This analyzer has been modified to improve its operation. These modifications are described in detail in reference 5. The NOx analyzer is a Beckman model 95lH x atmospheric pressure, heated, chemil1uminescent analyzer calibrated on five ranges at 0-10 ppm, 0-25 ppm, 0-100 ppm, 0-250 ppm and 0-1000 ppm full scale. The 02 analyzer is a Beckman model OM-II medical unit with a polarographic sensor. The advanced sensor and amplification system combine to make this analyzer an extremely fast responding and highly accurate instrument. It is calibrated up to 20.9 percent oxygen.
The MERF data acquisition system, based on a Hewlett-Packard 9830B calculator, receives the analyzer outputs and converts th is informat ion to actual emission concentrations which are pr inted out after each dat a po int. Communications between the MERF operator and the engine operator's station is provided by a David Clark Company model U3400 utility intercom system.
A more detailed description of the MERF systems may be found in appendix D.
DESCRIPTION OF MERF OPERATION.
A multipoint calibration on each range of the MERF inst rumentat ion is accomplished at least 30 days before testing, and each time major modifications or repairs are performed on the instruments.
A detailed startup, calibration, and operation procedure checklist for the MERF is included (appendix E).
The MERF carries a full complement of working gases including:
zero gas - 99.999 percent pure nitrogen
FID fue 1 - 40 percent hyd rogen 60 percent helium (less than 1 ppm THC)
FID air - hydrocarbon free (less than 0.1 ppm THC)
951 Hx ozonator 100 percent oxygen
All calibration gases are carried in treated aluminum cyl inders. CO/C02/ C3H8/ 02/N2 are carried as multi component mixtures in a single cylinder. All cal ibration gases have a blend tolerance of +0/-5 percent. analytical accuracy of ±l percent of true value for concentrations greater than 100 ppm and ±2 percent of true value for concentrations less than 100 ppm. Before a new cal ibrat ion gas is placed into operation it is compared to the existing calibration curves and Nat ional Bureau of Standards (NBS),
4
TABLE 2. TEST SEQUENCE FOR JT8D-7A ENGINES
Engine Pressure
Mode Power Ratio
1 Id Ie Out
2 Approach 1. 25
3 Intermediate 1.50
4 Maximum Cruise 1.65
5 Maximum Exe. 1. 79 Takeoff
6 Takeoff 1.98
7 Idle In
Standard Reference Material (SRM) gases. All NBS/SRM bottles are less than 1 year old.
MERF OPERATIONAL PROCEDURES.
Prior to the start of actual testing for emissions on the JT8D-7A engine, concern was expressed by the contractor that the installation of the 'sample probe on the engine exhaust nozzle would create performance shifts. The magnitude of this performance shift was examined by the FAA (r e fer e n c e 4). It was determined that apart from the actual probe size (frontal area exposed to the airstream), the axial downstream probe location was a primary factor affect ing the magnitude of the performance shift. The axial probe location, 7 inches downstream of the vertical plane of the nozzle. was chosen prior to testing. It has been shown that this probe location provides a representative emission sample for all species and has a minimal effect on engine performance. Two calibration engine runs were conducted with and without the probe. The performance shift was minima 1 and acceptable to the contractor. Subsequently, all engine acceptance and
Stabilization %Power Time (min)
20
30 10
60 5
70 5
85 5
100 5
20
emission sampling runs were conducted concurrently.
The sample probe was attached to the exhaust nozzle before the engine was mounted in the test cell. After mounting, the sample line was connected between the probe and the MERF and allowed to Come up to 300°F. The MERF instrumentation was calibrated prior to engine start and again at the conclusion of the test. During all engine starts and shutdowns, the sample line was reverse flushed with nitrogen gas to preclude any fuel from entering the sample train.
RESULTS
GENERAL COMMENTS.
Aircraft gas turbine engine emission tests were conducted to provide the following categories of data:
1. Baseline data for each power mode specified in the Landing Takeoff (LTO) test cycle.
5
• •
••
TABLE 3. SUMMARY OF MAINTENANCE PERFORMED ON PAN AM JT8D-7A TURBOFAN ENGINES
Total Teat JTllD Engine Plotting High Diffuser Fuel Ilurner T....nsition ,,, High I.ov EUUluit OYertlaul Oper.tiq".
" ..de... flo. Serial !lumber Date Comprenor Compressor !lGV'. Turbine Turbine Standard ~
Meet OYerhs111 Kanual Limita
653571 • 11/29/78 • • Repair On Condo 19,058
~ ~ ~~ "0' ~
· · · · · · · 649652 G 11/30/78 Repair On COndo 20,008· · · · · · · &54397 12/12/78 2573 hn. 2573 bu. Repair On. Cond. 16,885" • •· · · · ·
Ii> • • • •'" 4 649609 12/l5/7g Repair On. Gond. ZO,881· · · · · 653394 01III/79 • • • Repair On. Cond. 21,762'" · · · · · 653357 0 02/06/79 On. Cond. 20,510· "' "' "' •• "' "' · · 653351 01/30/79 On Condo•• • '0"' · · · · · "'
•
./.653792 02./09/79 • lI.epair On Condo'" "' · · · · · · · ..-rh1.6 engine failed acceptance for vibration. llindicatea replaced.

TABLE 4. SUMMARY OF AMBIENT TEST CONDITIONS
Compressor Compressor Inlet Temperature Inlet Pressure
TTr'F) (P t 2- in/ Hg) Dew Point (Grains H2 0 / lbair)
Minumum 17 29.60 5
Maximum 42 30.56 20
TABLE 5. AVERAGE EMISSION RATE LEVELS MEASURED
Idle Out (at> tak.eof f o DO%) (0' ) C1i.b (85%) (0') Approach 00%) fu) Idle In (0 t> co (LB/oa) 30.99 0.66) 9.74 <2.0 9.49 <2.5) 19.69 (5.22) 32.25 (2.85)
TIIC (LB/1I8) 8.92 0.27> 3.17 (0.71) 3.42 (0.76) 3.80 0.57> 8.80 0.00
.Ox (LB/oa) 3.84 0.29) 156.81 01.06) 111.03 01.90 16.79 0.97> 3.27 0.33 )
where 0. - mtandard deviation.
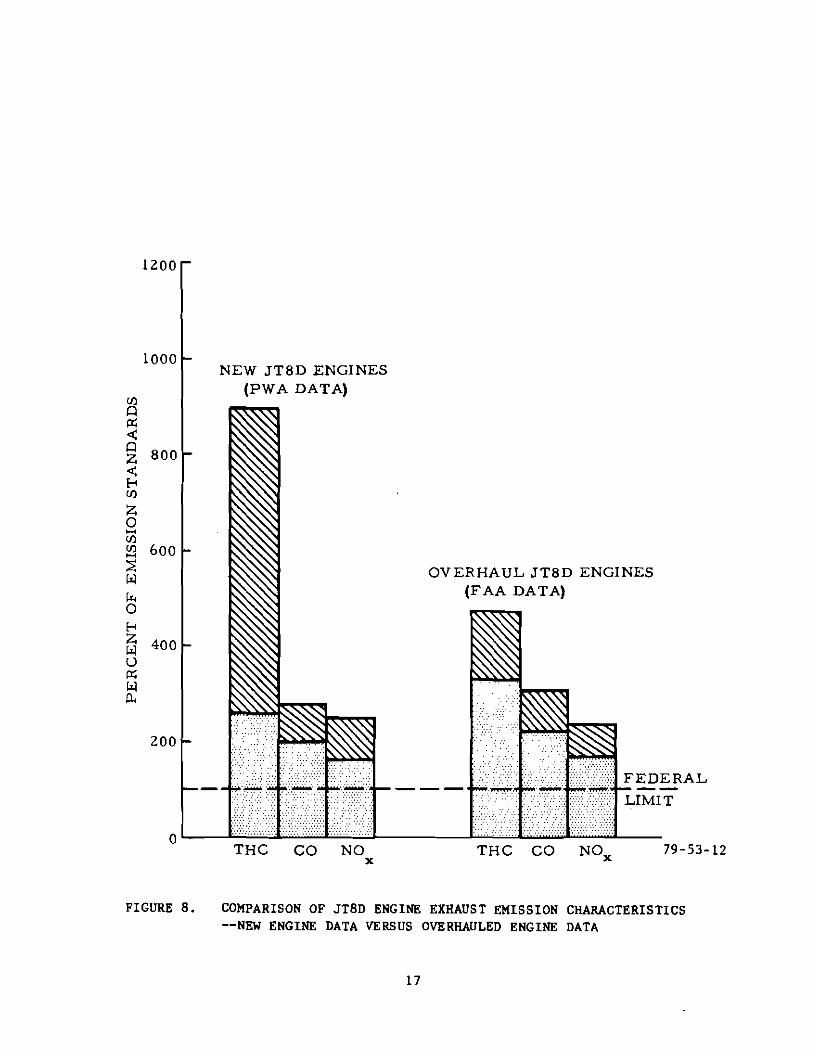
2. Maintenance and overhaul data to the Pan Am JT8D-7A engines tested as a evaluate the effects of engine recon function of the EPA standard in terms of ditioning work on exhaust emission percent of standard. The average levels. emission rate (ER) data that were
utilized to develop the "average of RESULTS OF BASE LINE TESTS (LTO CYCLE seven engines" in figures 5, 6, and 7 EFFECTS) • are tabulated in summary form in
table 5. Based on an analysis of the factors affecting gas turbine engine emissions The data from the overhauled engines are (i.e., time in mode, ambient conditions, also compared to new JT8D-9 engine data exhaust fuel/air ratio), it can be shown (reference 6) which were obtained by the that the mode condit ions having the FAA from the EPA. The new data were greatest influence on the gross provided to the EPA by PWA. Both the pollutant levels produced by the new engine data and the overhauled combustion process are idle and approach engine data were measured using JT8D with regard to carbon monoxide (CO) and engines. The comparison of the total hydrocarbons THC while the takeoff emissions characteristics is shown and climb modes produce the highest in figure 8. From the figure it can be NOx (table 5). seen that the mid-points of the maximum
and minimum values for each emission Figures 5, 6, and 7 present baseline species (i.e., new engine CO mid-point data in bargraph form. These figures versus overhauled engine CO mid-point) compare the total emission are approximately the same. The data characteristics (EPA parameter) of all scatter was generally uniform between
7
the maximum and minimum values. Maximum and minimum values were shown in this figure (in lieu of one standard deviation variability) because the Federal Register states that all engines must meet the standard. It can be seen that the mid-points of all the species exceed the Federal 1 imi to THC exceeds the Federal limit by over 500 percent, CO by over 225 percent, and NOx by 200 percent. Both sets of bargraphs show an overlapping trend which indicates that the two sets of da ta are genera lly similar and exhibit output levels which are in reasonable agreement. The new engine data show a greater spread in the total hydrocarbon pollutant because (1) the PWA engine test data represent a data base measured from a greater number of engines, and (2) THC measurement technology was not as well developed (as it is currently) when the data for the new engines, that were utilized in this report, were collected. The FAA data measured at the Pan Am, New York facili ty, and using Pan Am overhauled engines represent a data base derived from seven engines.
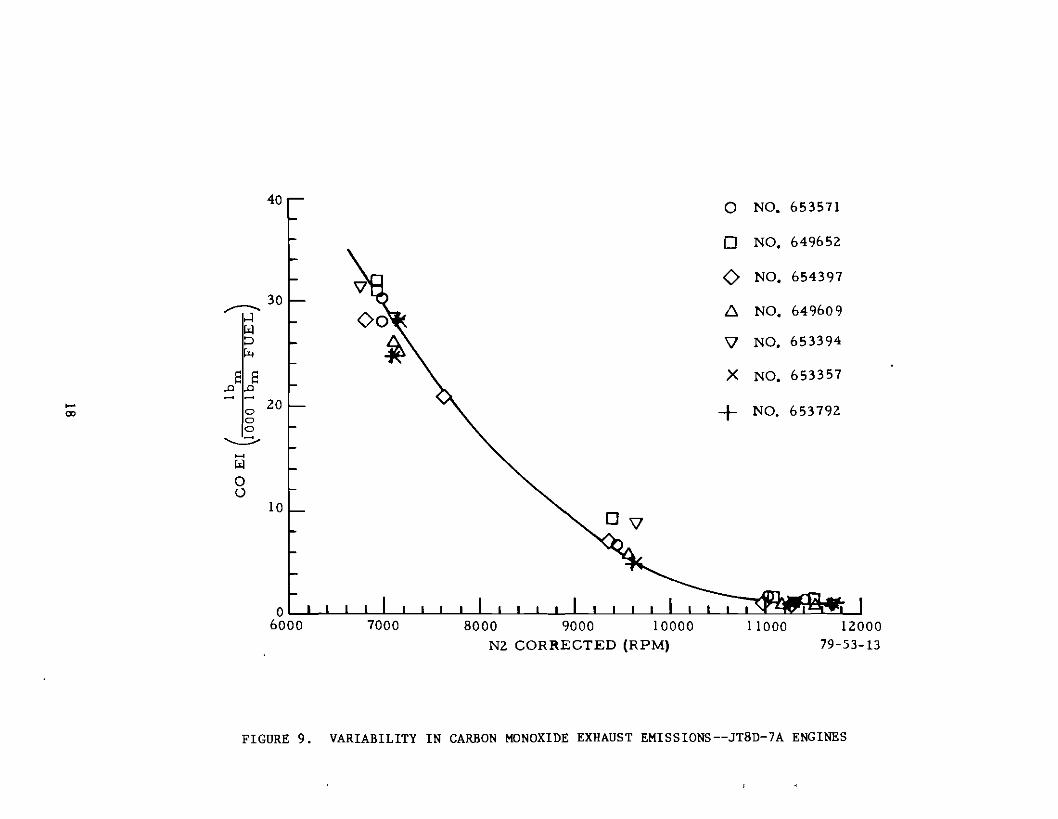
Figures 9, 10, and 11 provide additional data presentations in terms of Emission Indices (EI). They also illustrate the considerable data scatter at the idle power condition (approximately 7,000 rpm on N2) for the CO and THC species.
In conclusion, it can be noted that the seven Pan Am JT8D-7A engines tested and evaluated under this project work effort did not meet the EPA engine standard (reference 1). However, the data do show that overhauled engines of the type tested produce emission levels which are similar and comparable to the emission levels of new engines. Spot checks could readily be made at periodic intervals using equipment, instrumentat ion, and tes t procedures de fined and described in this report. A spot check test of an engine should not take more than 2 to 3 hours (maximum). This would
include the time required to install and remove the test probe and make the necessary hook-up of the probe sample line to the KERF. The test run, itself, should not take more than one to one and a half hours and should follow the basic format of the landing take off (LTO) cycle described herein.
SUMMARY OF RESULTS
1. The seven JT8D-7A aircraft gas turbine engines tested under this project did not meet the EPA standards.
2. The variability of the CO and NOx emission data produced by the seven JT8D engines under this project is similar to the variabili ty measured by PWA in new product ion engines. However, the new engine THC variability was significantly greater than the overhauled engines.
3. Satisfactory data can be measured by using the test procedures, instrumentation, and equipment defined by this report.
CONCLUSIONS
The following conclusions are based on the testing accomplished with the Pan Am owned JT8D-7A aircraft gas turbine engines.
1. Data variability in the measurement of aircraft gas turbine engine exhaust emissions between new production and overhauled engines appears to be very similar.
2. If an engine is properly overhauled the emission levels produced by that engine should be at an output level that is comparable to a newly manufactured engine.
8
REFERENCES
1. Clean Air Amendments of 1970, Public Law 91-604, 9lst Congress, H.R. 17255, December 31, 1970.
2. Control of Air Pollution from Aircraft and Aircraft Engines, Federal Register, Volume 38, Number 136, Part II, July 17, 1973.
3. JT8D Commercial Turbofan En~ine
Installation Handbook, Pratt and Wh1tney Aircraft, December 1960, Revised September 1971.
4. Slusher, G. R., Emission Sample Probe Investigation of a Mixed Flow JT8D-ll Turbofan Engine, FAA Technical Report FAA-RD-77-l75 , July 1978.
5. Aircraft Piston Engine Exhaust Emissions Symposium, National Aeronautics and Space Administration Publicat ion NASA CP-2005, September 1976.
6. Letter of Transmittal from Pratt and Whitney Aircraft to Environmental Protection Agency, May 20, 1972, Attachments I, 2, and 3.
9
o
FIGURE 1. QUARTERING VIEW OF FAA EMISSION MEASUREMENT PROBE (DIAMOND SHAPED) INSTALLED ON THE EXHAUST NOZZLE OF A JT8D-7A TURBOFAN ENGINE
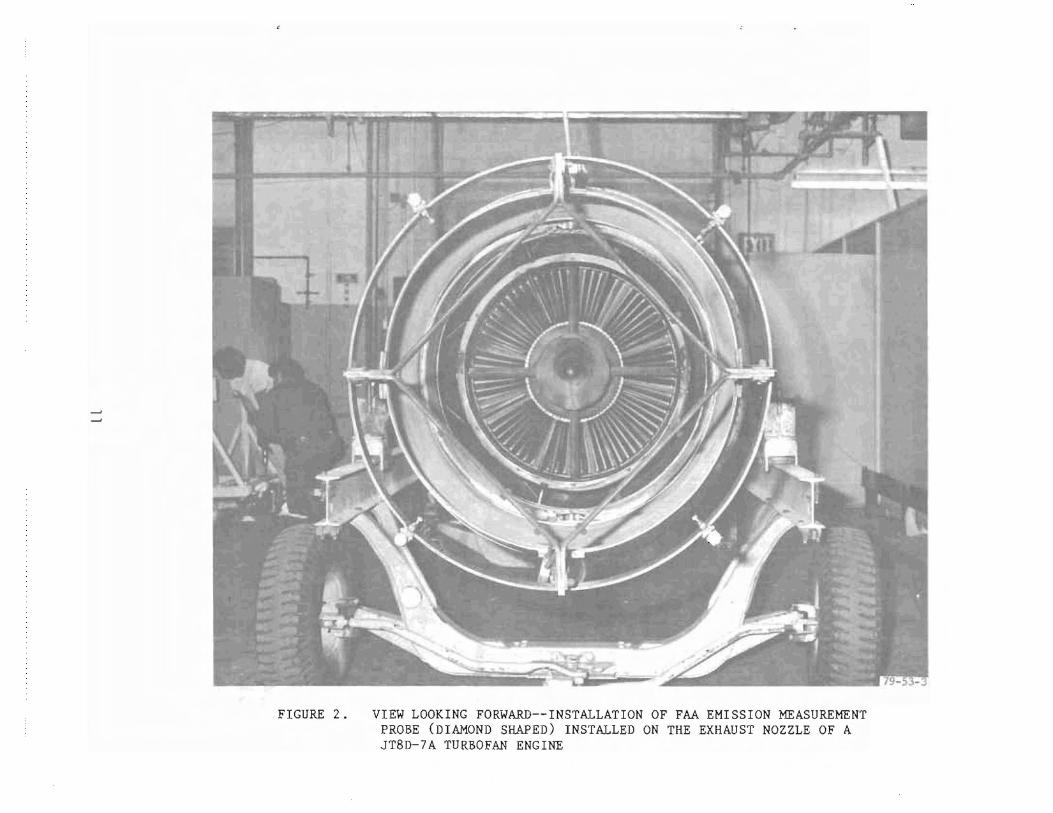
FIGURE 2. VIEW LOOKING FORWARD--INSTALLATION OF FAA EMISSION MEASUREMENT PROBE (DIAMOND SHAPED) INSTALLED ON THE EXHAUST NOZZLE OF A JT8D-7A TURBOFAN ENGINE
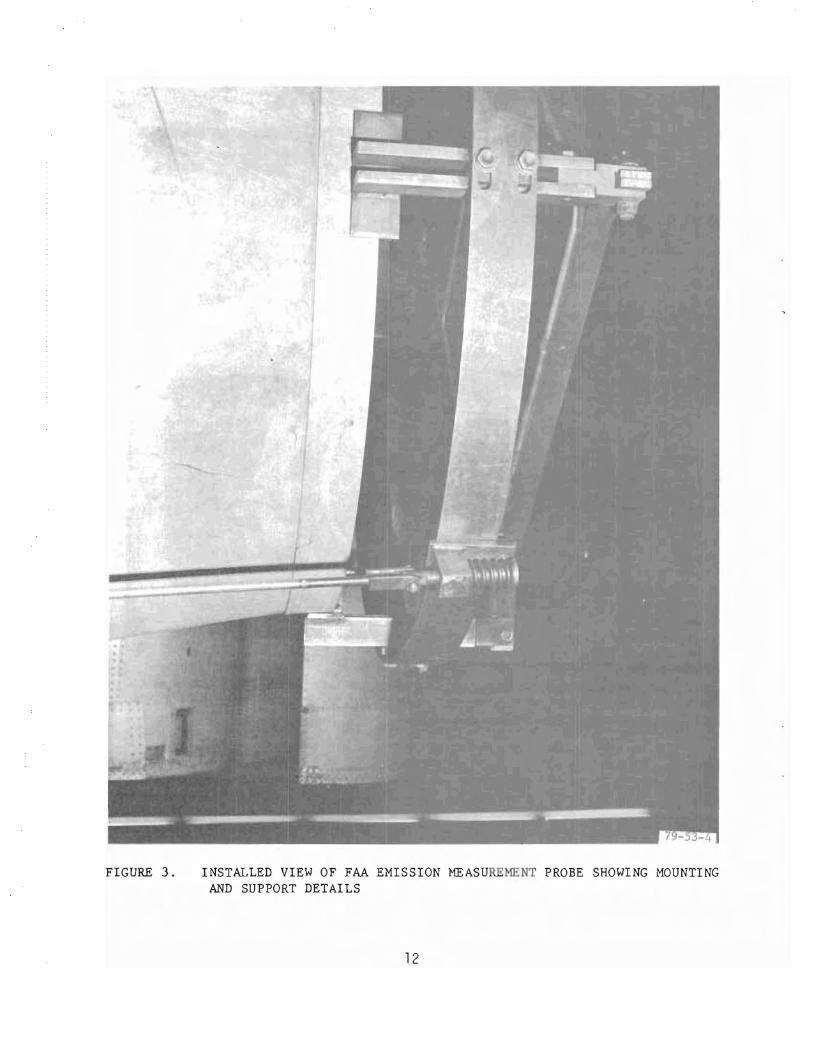
FIGURE 3. INSTALLED VIEW OF FAA EMISSION MEASUME T PROBE SHOWING MOUNTING AND SUPPORT DETAILS
12
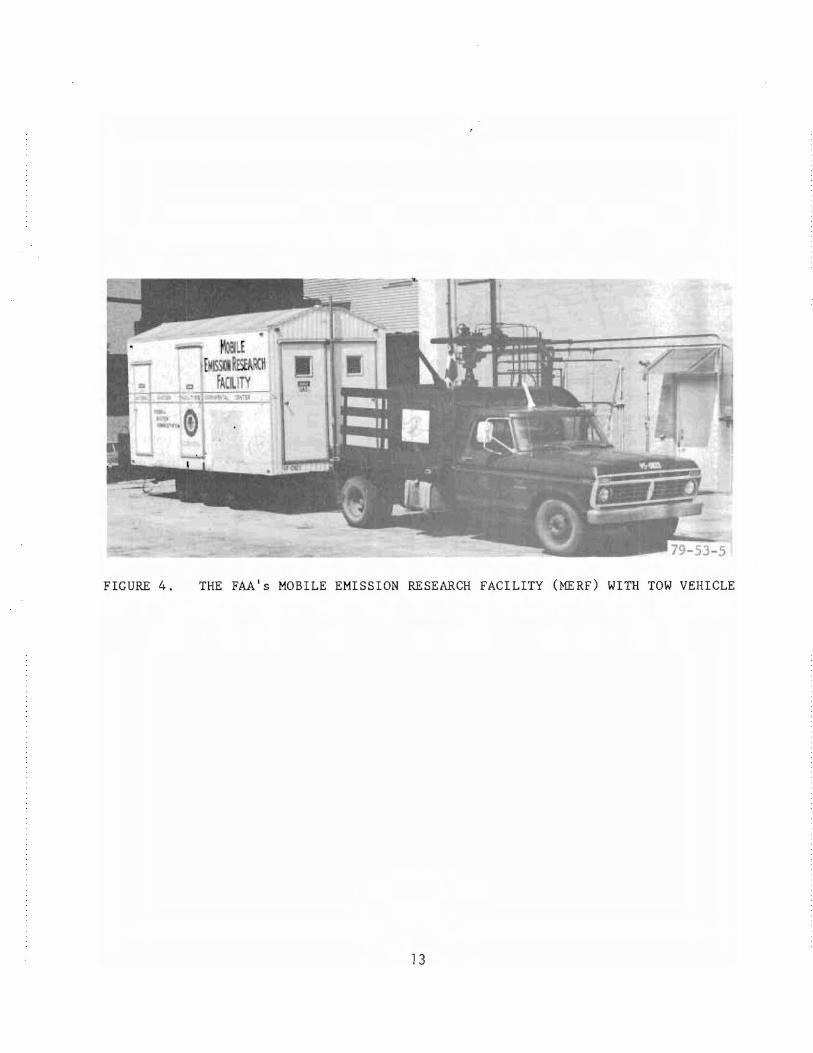
FIGURE 4. THE FAA I s MOBILE EMISSION RESEARCH FACILITY (MERF) WITH TOW VEHICLE
13

300
NOTES: 1. ENGINE NO. 3 WAS
OPERATED WITH A HIGH IDLE SETTING.
2. THE AVERAGE TOTAL TIME "I DEVIATION (36.0) PER ENGINE WAS
19.000 HRS. AVERAGE OF SEVEN ENGINES -G)THROUGHCD
(258)~~"f-L
FEDERAL
LIMIT
0'-----''''
FIGURE 5. TOTAL EMISSION CHARACTERISTICS--CARBON MONOXIDE (CO)-SEVEN PWA JT8D-7A ENGINES AFTER OVERHAUL
14

NOTES: 1. ENGINE NO.3 WAS OPERATED
WITH A HIGH IDLE SETTING.
2. THE AVERAGE TOTAL TIME PER ENGINE WAS 19,000 HRS.
600 0'1 DEVIATION (47.0)
VERAGE OF SEVEN ENGINES -Q)THROUGHG)
CD
CD
FEDERAL ....::"'.....+"'""".:"""l~"""'": .."""··........l"'""" .....+.........+ -
LIMIT
oL_JIIL_JIIIIII~~~~~2IR][~l..27~9~-53-10
FIGURE 6. TOTAL EMISSION CHARACTERISTICS--UNBURNED HYDROCARBONS (THC)--SEVEN PWA JT8D-7A ENGINES AFTER OVERHAUL
15
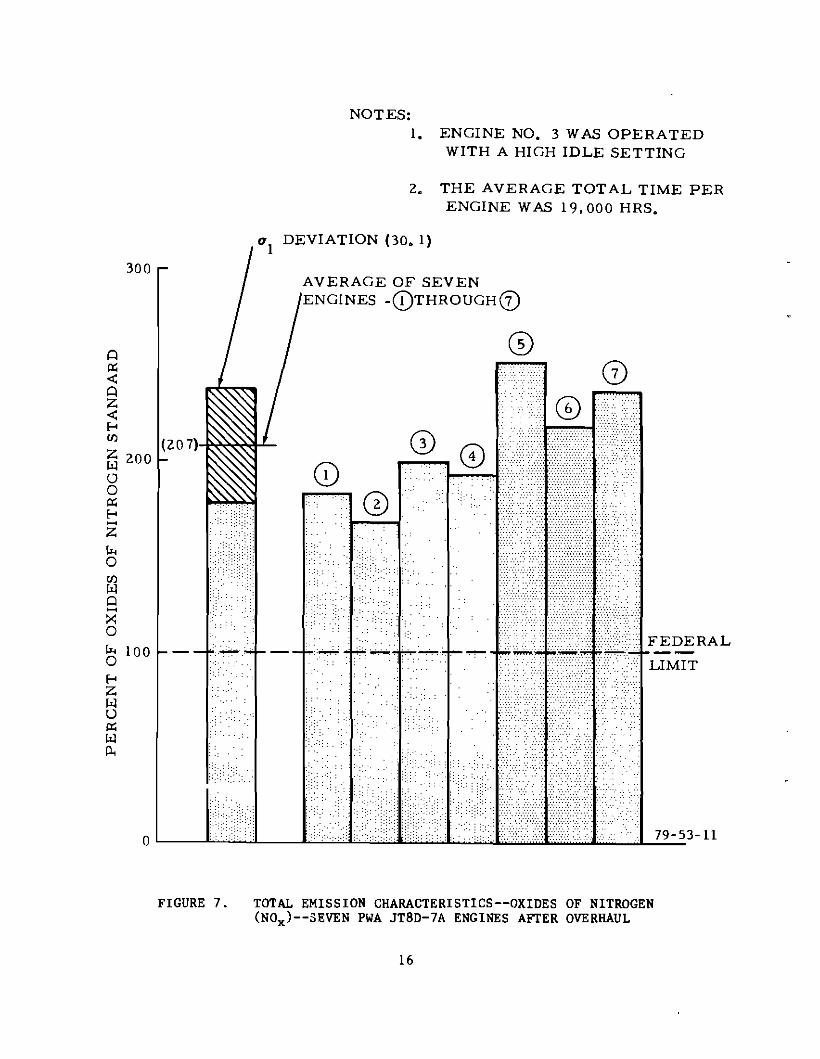
NOTES: 1. ENGINE NO.3 WAS OPERATED
WITH A HIGH IDLE SETTING
2. THE AVERAGE TOTAL TIME PER ENGINE WAS 19.000 HRS.
01 DEVIATION (30.1)
AVERAGE OF SEVEN ENGINES -(DTHROUGHG)
79- 53-11
FEDERAL+''....""F,.;,,,;;g~if.;;';4 - -... LIMIT
_··2.···_.._....:
(20 7)1-N~~~
300
Cl ~
-< Cl ;Z; -<f-< Cfl
;Z; 200W o o ~ f-<-;Z;
~ o Cfl W Cl-><; o ~ 100 o f-< ;Z; W U ~ W P,
FIGURE 7. TOTAL EMISSION CHARACTERISTICS--OXIDES OF NITROGEN (NOx)--SEVEN PWA JT8D-7A ENGINES AFTER OVERHAUL
16
1200
1000 NEW JT8D ENGINES
(PWA DATA)
OVERHAUL JT8D ENGINES (FAA DATA)
200
oL----.JL±~;.;l.:±d;.;l.:£J.. ___.L~LL~;J2~:;;L_
THC CO NO THC CO NO 79-53-12 xx
FIGURE 8. COMPARISON OF JT8D ENGINE EXHAUST EMISSION CHARACTERISTICS --NEW ENGINE DATA VERSUS OVERHAULED ENGINE DATA
17
:~
40 I 0 NO. 653571
0 NO. 649652
<> NO. 654397
----:? 30 r [:,. NO. 649609 W ::J NO. 653394
"" ~\ 'V
S S ~ X NO. 653357 ..Cl ..Cl--00 g20r -\. NO. 653792+
0
......:::.-w 0 U
10
01 I I I I 1 I I I I I I I I I I I I I I I I I ~~., 6000 7000 8000 9000 10000 11000 12000
N2 CORRECTED (RPM) 79-53-13
FIGURE 9. VARIABILITY IN CARBON MONOXIDE EXHAUST EMISSIONS--JT8D-7A ENGINES

\H
"~~
15 I
0 NO, 653571
0 NO, 649652
NO, 6543970 ~ 6. NO, 649609
W 10 1 ::> ~ \1 NO, 653394
.aSI .aE L
... - I X NO, 653357 0
0 0... r + NO, 653792-e
... '" '" W U 5 :r: f-<
o I I I I I I I I I I I I f I II I I I I I I I I~
6000 7000 11000 12000 79-53-14
FIGURE 10. VARIABILITY IN UNBURNED HYDROCARBON EXHAUST EMISSIONS--JT8D-7A ENGINES

- -
30 0 NO. 653571
0 NO. 649652
<> NO. 654397
6. NO. 649609
~ 20~~ ~ ::> ~ \7 NO. 653394
6' 6 .0 .0 I X NO. 653357
N 00
0
0 l- + NO. 653792
~ -~
X 10 0 Z;
oI I I I I I I I I I I I I 1.0 1.2 1.4 1.6 1.8 2.0 2.2
ENGlNE PRESSURE RATIO (EPR)
FIGURE 11. VARIABILITY IN OXIDES OF NITROGEN EXHAUST EMISSIONS--JT8D-7A ENGINES
APPENDIX A
EQUATIONS FOR CALCULATING EMISSIONS RESULTS
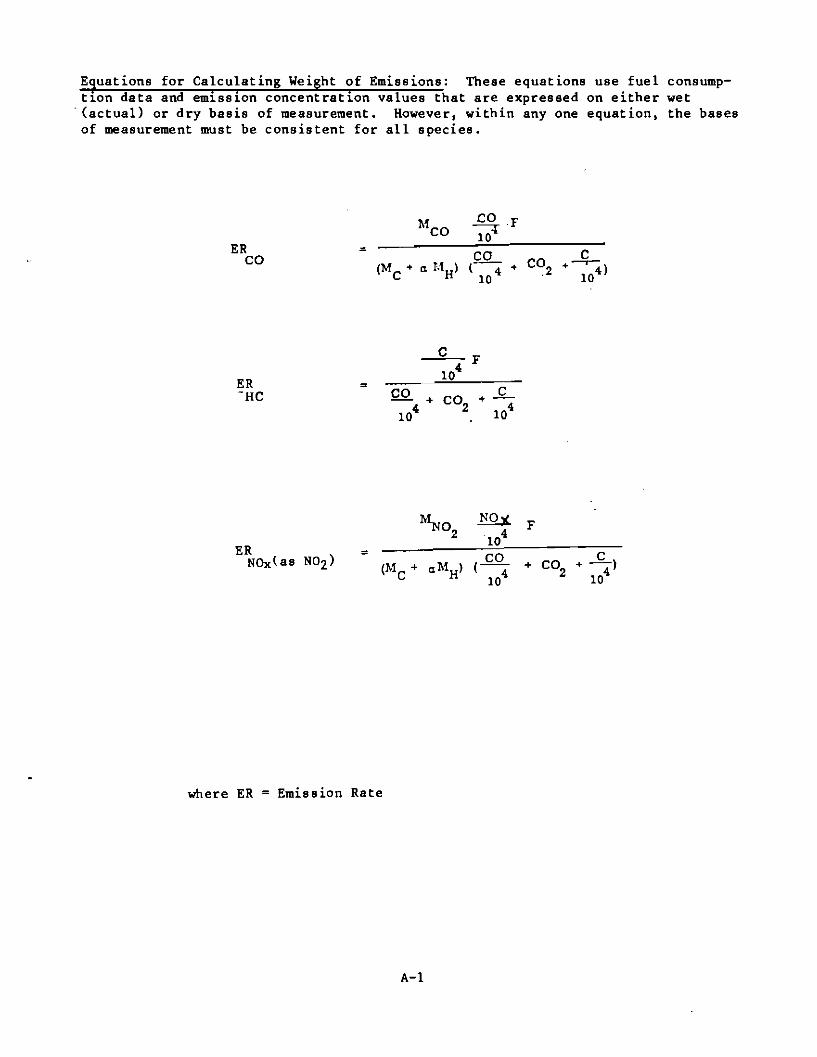
Equations for Calculating Weight of Emissions: These equations use fuel consumption data and emission concentration values that are expressed on either wet
. (actual) or dry basis of measurement. However, within anyone equation, the bases of measurement must be consistent for all species.
coM ·F eo ~ ER = CO e
MH) 1- + CO2 +---'-)eo (Me + " 4 4
10 10
C F 10'
ER = -HC CO .£..+ eo +
2 410' 10
F
ER = NOxlas NOz) + eo +--f....) 2 104
where ER = Emission Rate
A-I

APPENDIX B
RAW ENGINE AND EMISSION DATA

TABLE B-1. ESN
MODE 1 2
POWER IDLE OUT APPROACH
'" I I-'
EPR Tt2 Pt2 N1 N2 Wf Fn EGT
of
in. /HgA RPM RPM
Lbs/Hr Lbs
°c
- 36
30.36 2818 6834 1030 1011 340
1.25 35
30.35 5252 9213 2535 4230
328
% CO2 (DRY) CO - PPM (DRY) THC - PPM (WET) NOx - PPM (WET)
0.38 61.5 34.2
2.9
0.37 15
10.66 5.58
653571
3 INTERMEDIATE
1. 51 35
30.33 6595
10163 4495 7860
398
0.64 10
7.38 16.07
TEST DATE- 11-29-78
4 5 MAXIMUM MAXIMUM CRUISE EXCEPT T.O.
1.66 1. 78 35 35
30.31 30.30 7083 7391
10550 10775 5695 6535
10026 11328 443 469
0.92 1.18 12.6 13 7.21 6.23
28.55 41.15
6 7
TAKE OFF IDLE IN
1.98 35
30.30 7897
11134 7975
13443 513
1.58 12.6 5.88 69.6
0.38 66.5
33.66 1. 51

MODE
POWER
'" I N
EPR Tt2 Pt2 N1 N2 Wf Fn EGT
% CO2 CO -THC -NOx -
'F in./HgA
RPM RPM
Lbs/Hr Lbs
·c
(DRY) PPM (DRY)
PPM (WET) PPM (WET)
TABLE B-2.
1
IDLE OUT
1.085 42
29.95 2857 6830 1145
993 366
0.28 50
28.84 1.03
ESN
2
APPROACH
1.25 41
29.92 5273 9229 2580 4107
346
0.25 13.2 8.87 2.51
649652
3 INTERMEDIATE
1.505 41
29.91 6619
10206 4525 7734 419
0.58 11.5 5.99
14.13
TEST DATE- 11-30-78
4 5 MAXIMUM MAXIMUM CRUISE EXCEPT T.O.
1.625 1. 78 41 41
29.91 29.90 7097 7456
10605 10878 5640 6600 9624 11091 460 490
0.84 1.12 11. 2 11.4 5.16 4.59 26.5 41. 25
6
TAKE OFF
1.98 41
29.89 8006
11304 8155
13224 536
1.53 12
4.92 71.02
7
IDLE IN
0.27 47
26.89 1.03
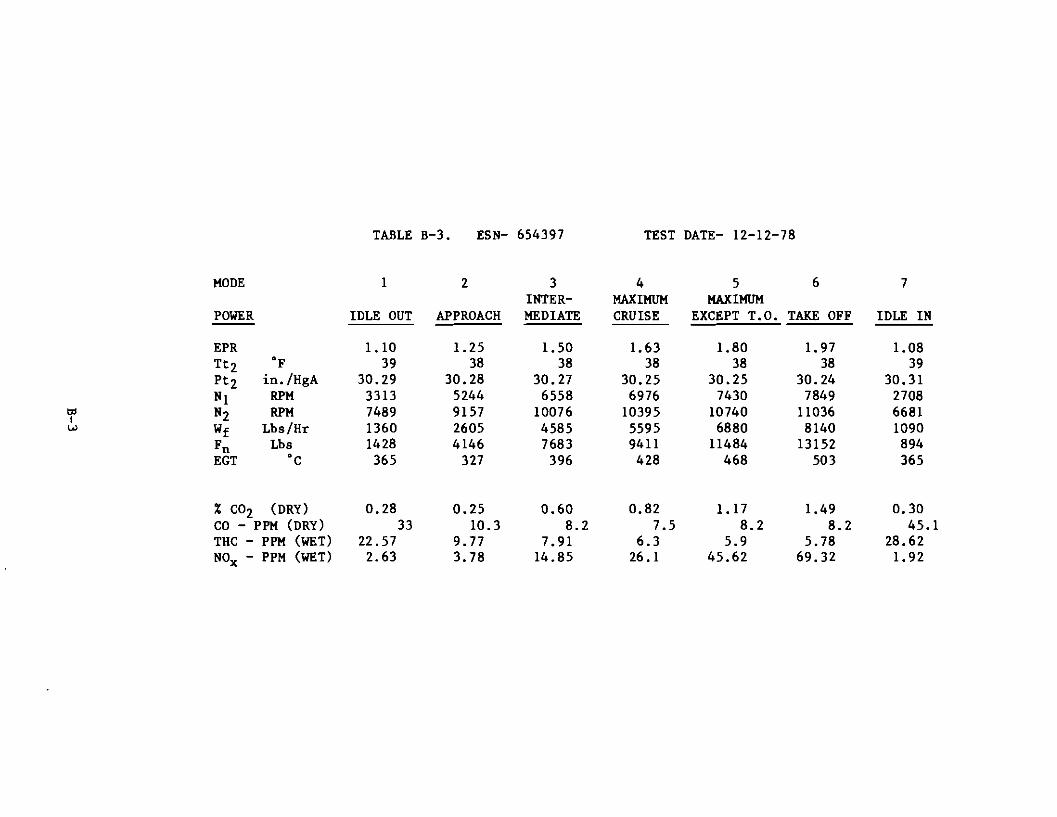
TABLE B-3. ESN 654397 TEST DATE 12-12-78
MODE
POWER
1
IDLE OUT
2
APPROACH
3 INTERMEDIATE
4 MAXIMUM CRUISE
5 MAXIMUM
EXCEPT T.O.
6
TAKE OFF
7
IDLE IN
ttl I w
EPR Tt2 Pt2 N1 N2 Wf Fn EGT
of
in./HgA RPM RPM
Lbs/Hr Lbs
°c
1.10 39
30.29 3313 7489 1360 1428 365
1.25 38
30.28 5244 9157 2605 4146
327
1.50 38
30.27 6558
10076 4585 7683
396
1.63 38
30.25 6976
10395 5595 9411 428
1.80 38
30.25 7430
10740 6880
11484 468
1.97 38
30.24 7849
11036 8140
13152 503
1.08 39
30.31 2708 6681 1090 894 365
% CO2 (DRY) CO - PPM (DRY) THC - PPM (WET) NOx - PPM (WET)
0.28 33
22.57 2.63
0.25 10.3
9.77 3.78
0.60 8.2
7.91 14.85
0.82 7.5
6.3 26.1
1.17 8.2
5.9 45.62
1.49 8.2
5.78 69.32
0.30 45.1
28.62 1.92
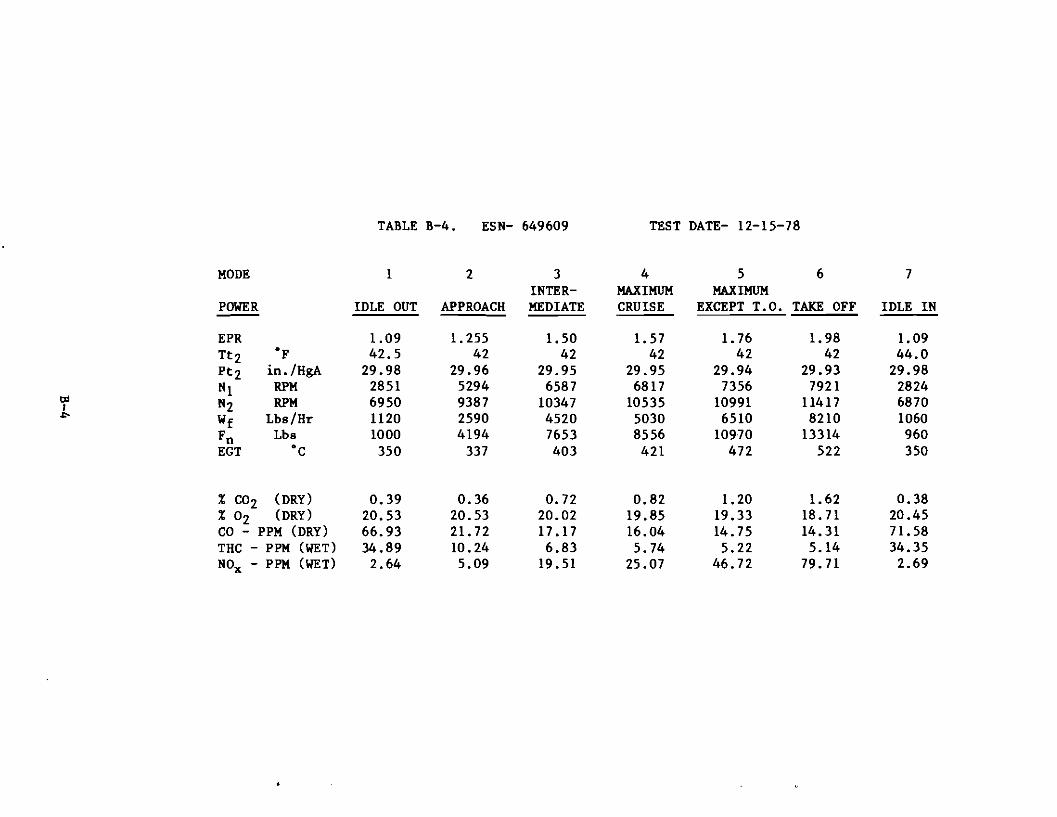
TABLE B-4. ESN 649609 TEST DATE 12-15-78
MODE
POWER
1
IDLE OUT
2
APPROACH
3 INTERMEDIATE
4 MAXIMUM CRUISE
5 MAXIMUM
EXCEPT T.O.
6
TAKE OFF
7
IDLE IN
'" I .0
EPR Tt2 Pt2 HI N2 Wf Fn EGT
of
in. /HgA RPM RPM
Lbs/Hr Lbs
°c
1.09 42.5
29.98 2851 6950 1120 1000 350
1.255 42
29.96 5294 9387 2590 4194
337
1.50 42
29.95 6587
10347 4520 7653 403
1. 57 42
29.95 6817
10535 5030 8556
421
1. 76 42
29.94 7356
10991 6510
10970 472
1. 98 42
29.93 7921
11417 8210
13314 522
1.09 44.0
29.98 2824 6870 1060 960 350
% CO2 (DRY) % °2 (DRY) CO - PPM (DRY) THC - PPM (WET) HOx - PPM (WET)
0.39 20.53 66.93 34.89
2.64
0.36 20.53 21. 72 10.24 5.09
0.72 20.02 17 .17 6.83
19.51
0.82 19.85 16.04 5.74
25.07
1.20 19.33 14.75 5.22
46.72
1.62 18.71 14.31 5.14
79.71
0.38 20.45 71.58 34.35
2.69

TABLE B-5. ESN 653394 TEST DATE 1-11-79
MODE
POWER
1
IDLE OUT
2
APPROACH
3 INTERMEDIATE
4 MAXIMUM CRUISE
5 MAXIMUM
EXCEPT T.O.
6
TAKE OFF
7
IDLE IN
til I
'"
EPR Tt2 Pt2 N1 N2 Wf Fn EGT
"F in./HgA
RPM RPM
Lbs/Hr Lbs
"C
1.08 23
30.45 2874 6900 1090 1041 318
1. 25 23
30.52 5273 9224 2595 4323
312
1.50 23
30.51 6519
10113 4455 7812 375
1.64 22
30.50 6922
10433 5455 9567 406
1.80 22
30.49 7347
10772 6645
11535 445
1.98 22
30.47 7821
11108 8020
13467 483
1.08 23
30.54 2841 6862 1075 996 316
% CO2 (DRY) % 02 (DRY) CO - PPM (DRY) THC - PPM (WET) NOx - PPM (WET)
0.29 20.7
44.92 34.35
3.05
0.30 21.01 11.53 10 .32 5.86
0.62 20.28 8.97 7.71
18.91
0.75 20.27 7.96 6.46
32.79
1.09 19.70 7.67 6.32
46.56
1.41 18.99
7.93 6.17
71.65
0.28 20.71 44.98 33.74
2.83
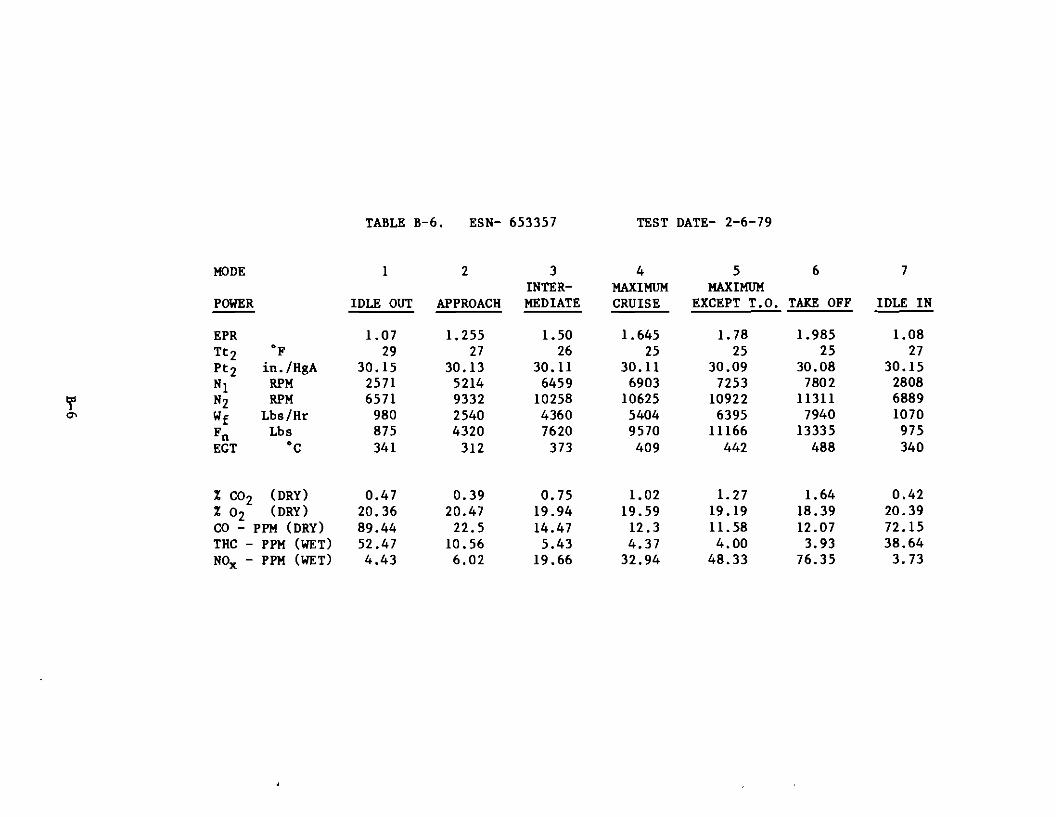
TABLE B-6. ESN- 653357 TEST DATE 2-6-79
MODE
POWER
1
IDLE OUT
2
APPROACH
3 INTERMEDIATE
4 MAXIMUM CRUISE
5 MAXIMUM
EXCEPT T.O.
6
TAKE OFF
7
IDLE IN
If a-
EPR Tt2 Pt2 N1 N2 Wf Fn EGT
of
in. /HgA RPM RPM
Lb./Hr Lb.
°c
1.07 29
30.15 2571 6571
980 875 341
1.255 27
30.13 5214 9332 2540 4320
312
1.50 26
30.11 6459
10258 4360 7620
373
1.645 25
30.11 6903
10625 5404 9570 409
1. 78 25
30.09 7253
10922 6395
11166 442
1.985 25
30.08 7802
11311 7940
13335 488
1.08 27
30.15 2808 6889 1070 975 340
% CO2 (DRY) % °2 (DRY) CO - PPM (DRY) THe - PPM (WET) NOx - PPM (WET)
0.47 20.36 89.44 52.47 4.43
0.39 20.47
22.5 10.56 6.02
0.75 19.94 14.47 5.43
19.66
1.02 19.59
12.3 4.37
32.94
1.27 19.19 11.58 4.00
48.33
1.64 18.39 12.07
3.93 76.35
0.42 20.39 72.15 38.64
3.73
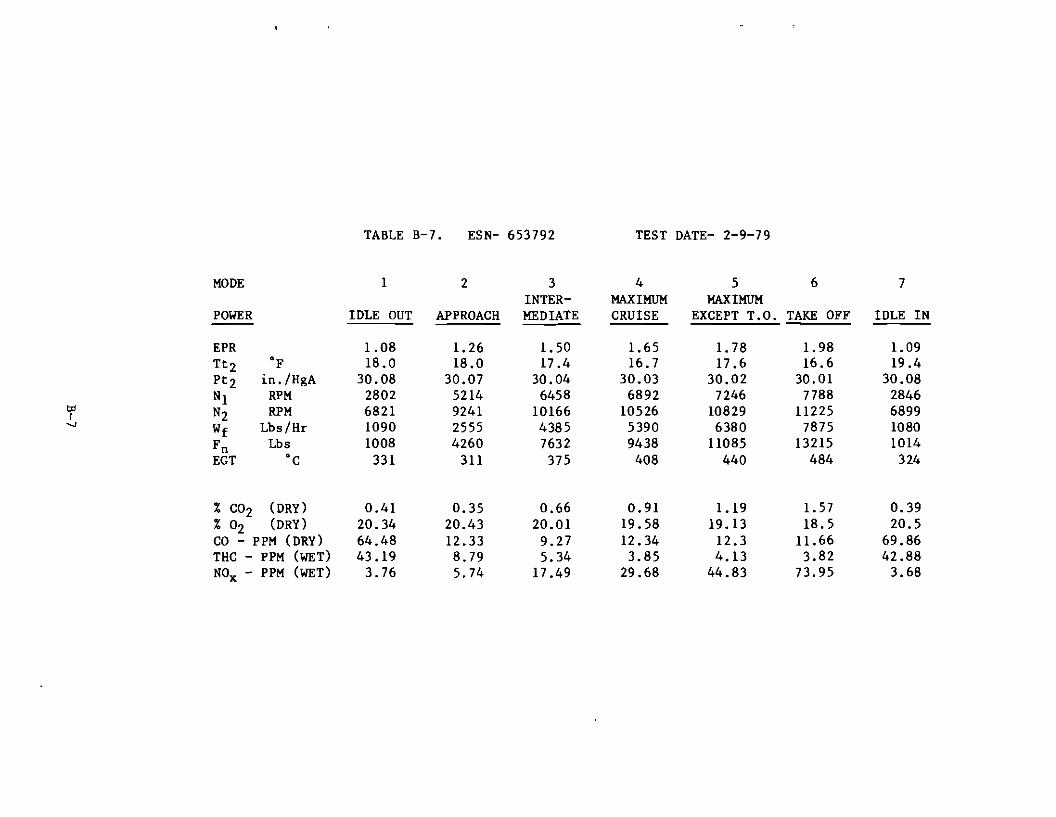
TABLE B-7. ESN 653792 TEST DATE 2-9-79
MODE
POWER
1
IDLE OUT ~
2
APPROACH
3 INTERMEDIATE
4 MAXIMUM CRUISE
5 MAXIMUM
EXCEPT T.O.
6
TAKE OFF
7
IDLE IN
to r "
EPR Tt2 Pt2 til N2 Wf Fn EGT
of
in. /HgA RPM RPM
Lbs/Hr Lbs
°c
1.08 18.0
30.08 2802 6821 1090 1008
331
1. 26 18.0
30.07 5214 9241 2555 4260
311
1.50 17 .4
30.04 6458
10166 4385 7632 375
1.65 16.7
30.03 6892
10526 5390 9438
408
1. 78 17.6
30.02 7246
10829 6380
11085 440
1.98 16.6
30.01 7788
11225 7875
13215 484
1.09 19.4
30.08 2846 6899 1080 1014 324
% CO2 (DRY) % 02 (DRY) CO - PPM (DRY) THC - PPM (WET) NOx - PPM (WET)
0.41 20.34 64.48 43.19
3.76
0.35 20.43 12.33 8.79 5.74
0.66 20.01 9.27 5.34
17.49
0.91 19.58 12.34 3.85
29.68
1.19 19.13 12.3 4.13
44.83
1. 57 18.5
11.66 3.82
73.95
0.39 20.5
69.86 42.88
3.68
APPENDIX C
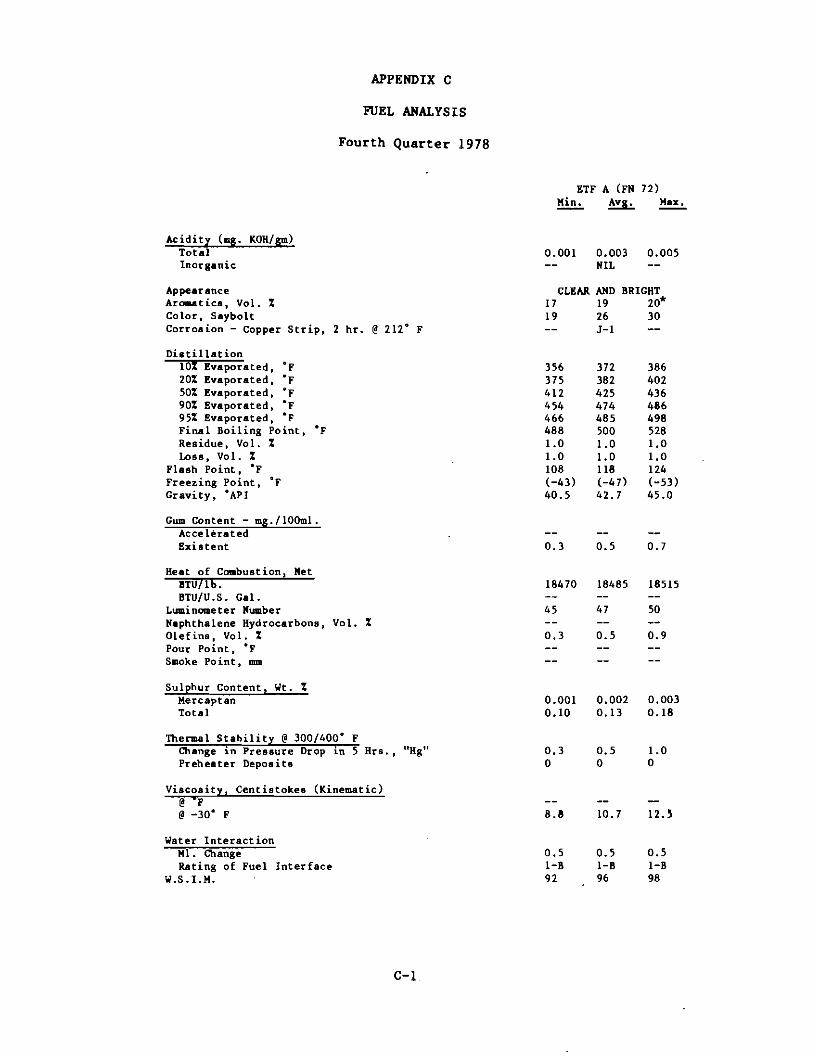
FUEL ANALYSIS
Fourth Quarter 1978
ETF A (FN 72) Min. Avg. ~
Acidity (mg. KOH/gm) Tot.l 0.001 0.003 0.005 Inorganic NIL
Appearance CLEAR AND BRIGHT Ara.atic8, Vol. % 17 19 20* Color I Saybolt 19 26 30 Corrosion - Copper Strip, 2 hr. @ 212 0 F J-I
Diltillation lOt Evaporated, of 356 372 386 20% Evaporated, of 375 382 402 50% Evaporated, of 412 425 436 90% Evaporated, of 454 474 486 95% Evaporated, of 466 485 498 Final Boiling Point. of 488 500 528 Residue, Vol. % 1.0 1.0 1.0 Los8. Vol. % 1.0 1.0 1.0
Flash Point, of 108 118 124 Freezing Point, of (-43) (-47> (-53) Gravity, ·API 40.5 42.7 45.0
Gum Content - mg./lOOmI. Accelerated Existent 0.3 0.5 0.7
Heat of Combustion, Met BTU/lb. 18470 18485 18515 BTU/U.S. Gal.
Luminometer Number 45 47 50 Naphthalene Hydrocarbons, Vol. % Olefins, Vol. % 0.3 0.5 0.9 Pour Point. OF Smoke Point, mm
Sulphur Content. Wt. % Mercaptan 0.001 0.002 0.003 Total 0.10 0.13 0.18
Thermal Stability @300/400· F Change in Pressure Drop in 5 Hrs., "Hg" 0.3 0.5 1.0 Preheater Deposits a a a
Viscosity. Centistokes (Kinematic) @ 'p @-30· F 8.B 10.7 12.5
Water Interaction HI. Change 0.5 0.5 0.5 Rating of Fuel Interface I-B I-B I-B
W.S.I.H. 92 96 98
C-1
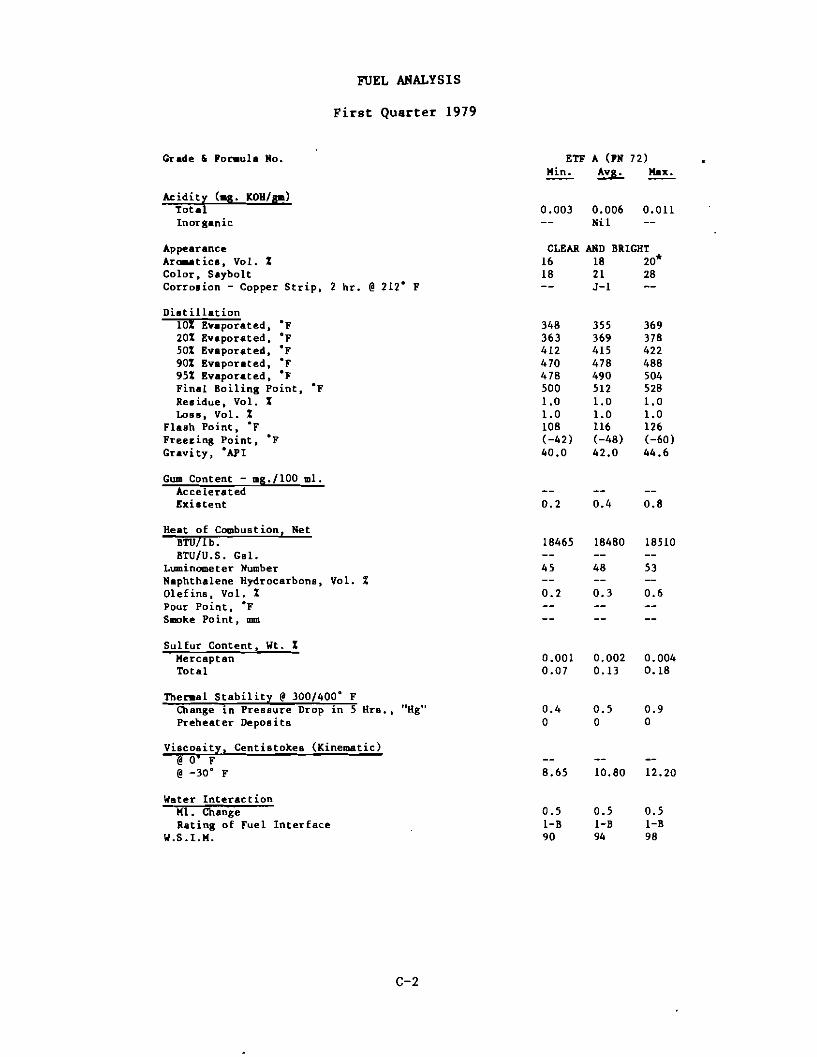
FUEL ANALYSIS
First Quarter 1979
Grade & Por-ula No. ETF A (Pll 72) Min. Avg. Max,
Acidit{ (5. KOH/e) Tote 0.003 0.006 0.011 Inorganic Nil
Appearance CLEAR AllD BRIGHT Ara.atiClI, Vol. % 16 18 20* Color. Saybolt 18 21 28 Carro. ion - Copper Strip, 2 hr. @212· F J-I
Di.tillation lOt Evaporated. ·F 348 355 369 20% Evaporated. ·F 363 369 378 50% Evaporated, ·F 412 415 422 90% Evaporated, ·F 470 478 488 95% Evaporated, of 478 490 504 Final Boiling Point. ·F 500 512 528 Residue, Vol. % 1.0 1.0 1.0 Los II , Vol. % 1.0 1.0 1.0
Flash Point, ·F 108 116 126 Free~ing Point, ·F (-42) (-48) (-60) Gravi ty, •API 40.0 42.0 44.6
Gum Content - ma./IOO mI. Accelerated Existent 0.2 0.4 0.8
Heat of Combustion, Net BTU/lb. 18465 18480 18510 BTU/U.S. Go1.
Luminometer Number 45 48 53 Naphthalene Hydrocarbons, Vol. % Olefins. Vol. % 0.2 0.3 0.6 Pour Point I ·F Smoke Point, mID
Sulfur Content. Wt. % Mercaptan 0.001 0.002 0.004 Total 0.07 0.13 0.18
Ther.al Stability @ 300/400· F Change in Pressure Drop in S Hrs. I "Hg" 0.4 0.5 0.9 Preheater Deposits o o o
Viscosity. Centistokes (Kinematic)@O· F @-30' F 8.65 10.80 12.20
Water Interaction MI. Change 0.5 0.5 0.5 Rating of Fuel Interface I-B I-B I-B
W.S.I.H. 90 94 98
C-2
APPENDIX D
DETAILED DESCRIPTION OF MERF
LIST OF ILLUSTRATIONS
APPENDIX D
Figure Page
D-l Rear of MERF Panel D-5
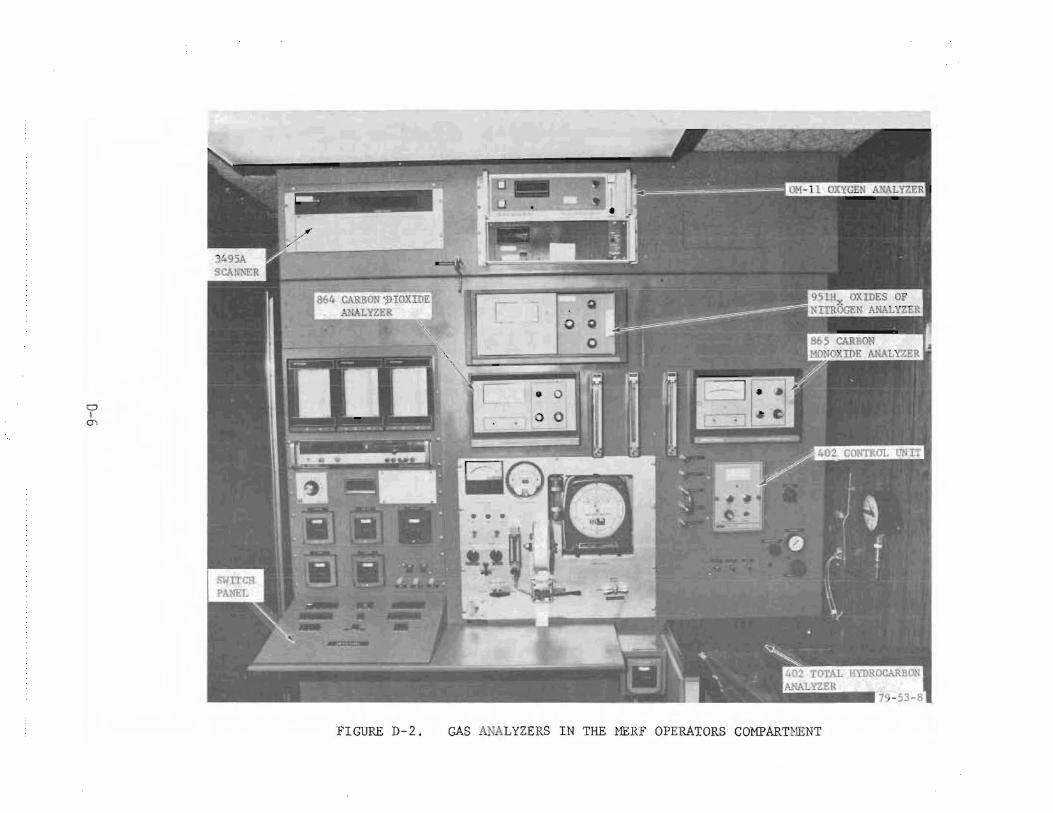
D-2 Gas Analyzers in the MERF Operators Compartment D-6
D-3 MERF Bottle Compartment --Operating/Reference Gas D-7
D-4 Part of MERF Data Acquisition System D-8
D-i
DETAILED DESCRIPTION OF KERF.
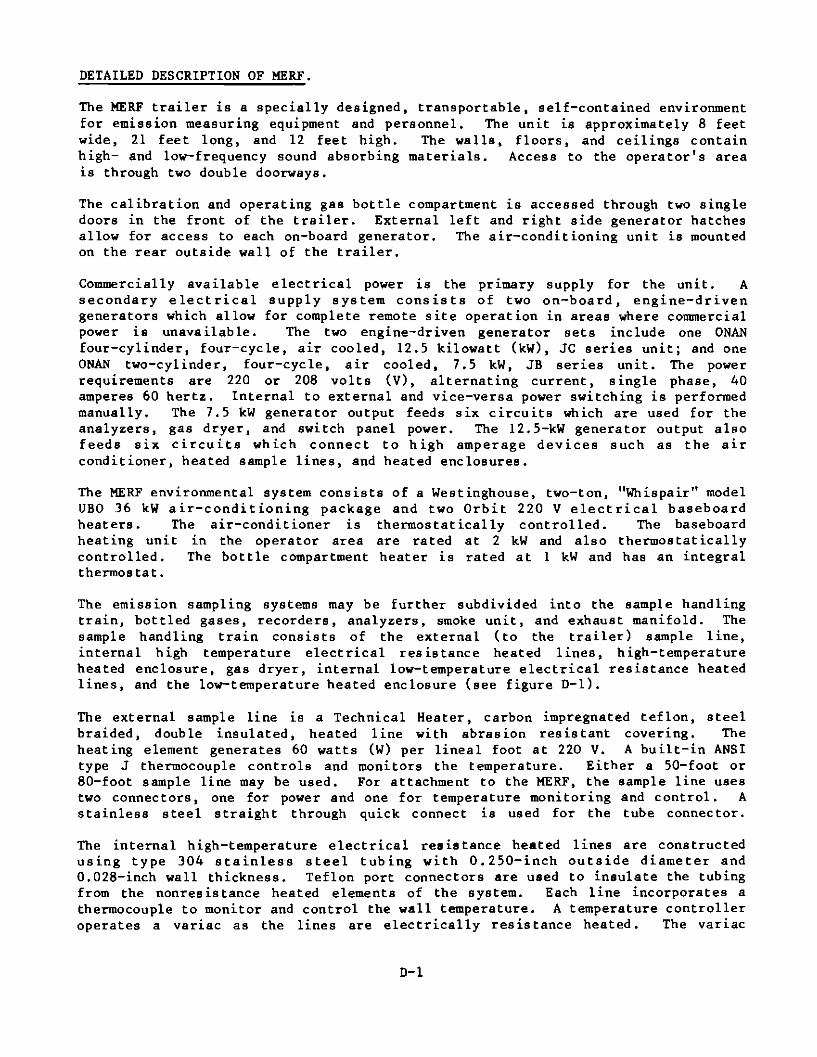
The KERF trailer is a specially designed, transportable, self-contained environment for emission measuring equipment and personnel. The unit is approximately 8 feet wide, 21 feet long, and 12 feet high. The walls, floors, and ceilings contain high- and low-frequency sound absorbing materials. Access to the operator's area is through two double doorways.
The calibration and operating gas bottle compartment is accessed through two single doors in the front of the trailer. External left and right side generator hatches allow for access to each on-board generator. The air-conditioning unit is mounted on the rear outside wall of the trailer.
Commercially available electrical power is the primary supply for the unit. A secondary electrical supply system consists of two on-board, engine-driven generators which allow for complete remote site operation in areas where commercial power is unavailable. The two engine-driven generator sets include one ONAN four-cylinder, four-cycle, air cooled, 12.5 kilowatt (kW), JC series unit; and one ONAN two-cylinder, four-cycle, air cooled, 7.5 kW, JB series unit. The power requirements are 220 or 208 volts (V), alternating current, single phase, 40 amperes 60 hertz. Internal to external and vice-versa power switching is performed manually. The 7.5 kW generator output feeds six circuits which are used for the analyzers, gas dryer, and switch panel power. The 12.5-kW generator output also feeds six circuits which connect to high amperage devices such as the air conditioner, heated sample lines, and heated enclosures.
The MERF environmental system consists of a Westinghouse, two-too, "Whispair" model UBO 36 kW air-conditioning package and two Orbit 220 V electrical baseboard heaters. The air-conditioner is thermostatically controlled. The baseboard heating unit in the operator area are rated at 2 kW and also thermostatically controlled. The bottle compartment heater is rated at 1 kW and has an integral thermostat.
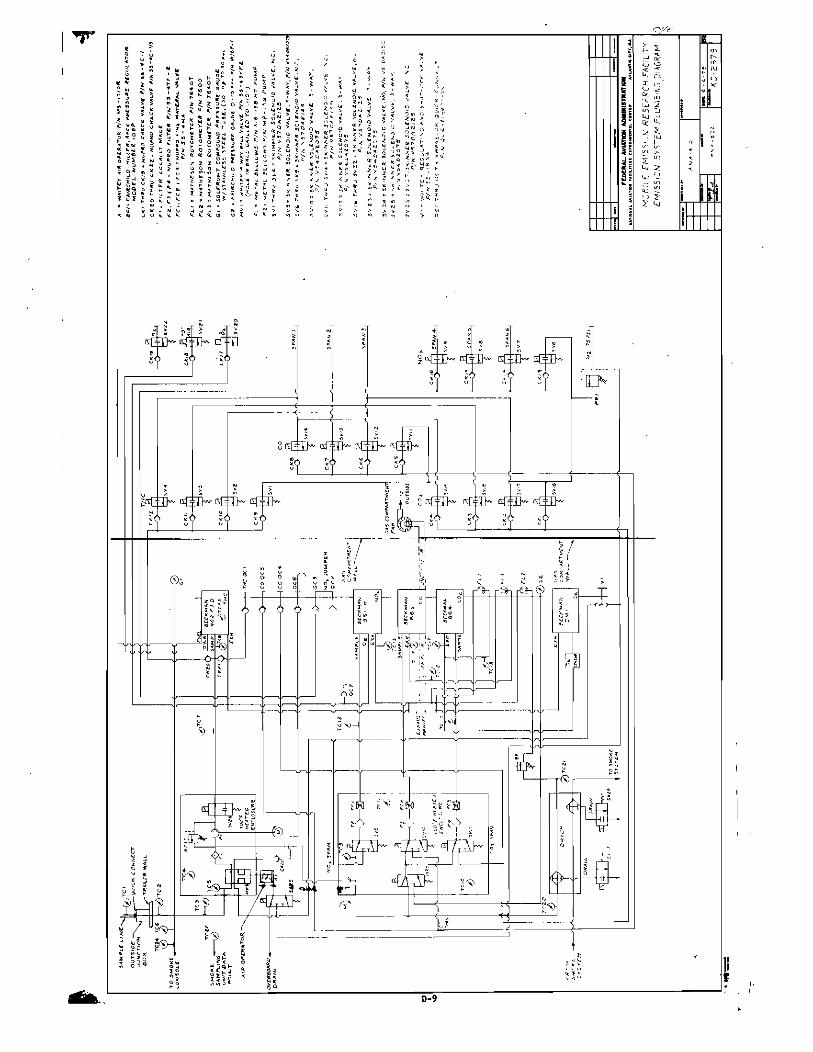
The emission sampling systems may be further subdivided into the sample handling train, bottled gases, recorders, analyzers, smoke unit, and exhaust manifold. The sample handling train consists of the external (to the trailer) sample line, internal high temperature electrical res is tance heated 1 ines, high-temperature heated enclosure, gas dryer, internal low-temperature electrical resistance heated lines, and the low-temperature heated enclosure (see figure D-l).
The external sample line is a Technical Heater, carbon impregnated teflon, steel braided, doub Ie insulated, heated 1 ine with abras ion res is tant covering. The heating element generates 60 watts (W) per lineal foot at 220 V. A built-in ANSI type J thermocouple controls and monitors the temperature. Either a 50-foot or 80-foot sample line may be used. For attachment to the KERF, the sample line uses two connectors, one for power and one for temperature monitoring and control. A stainless steel straight through quick connect is used for the tube connector.
The internal high-temperature electrical resistance heated lines are constructed using type 304 stainless steel tubing with 0.250-inch outside diameter and 0.028-inch wall thickness. Teflon port connectors are used to insulate the tubing from the nonresistance heated elements of the system. Each line incorporates a thermocouple to monitor and control the wall temperature. A temperature controller operates a variac as the lines are electrically resistance heated. The variac
D-l
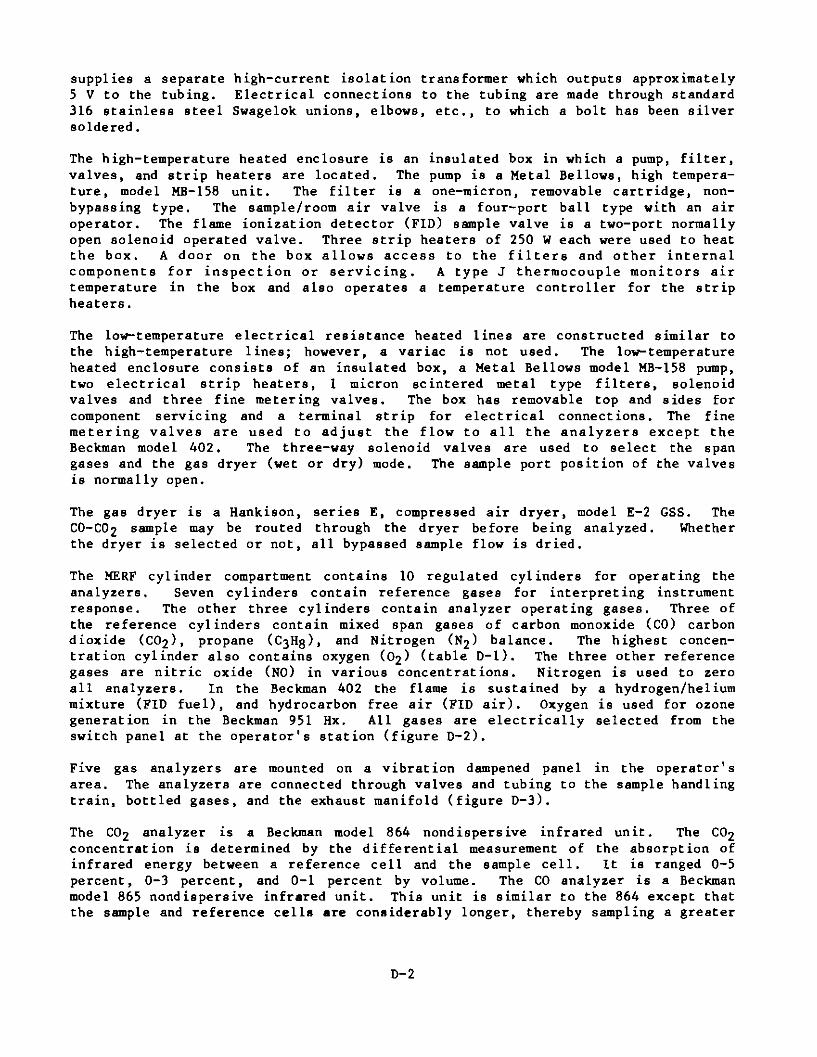
supplies a separate high-current isolation transformer which outputs approximately 5 V to the tubing. Electrical connections to the tubing are made through standard 316 stainless steel Swage 10k unions, elbows, etc., to which a bolt has been silver soldered.
The high-temperature heated enclosure is an insulated box in which a pump, filter, valves, and strip heaters are located. The pump is a Metal Bellows, high temperature, model MB-158 unit. The filter is a one-micron, removable cartridge, nonbypassing type. The sample/room air valve is a four-port ball type with an air operator. The flame ionization detector (FID) sample valve is a two-port normally open solenoid operated valve. Three strip heaters of 250 W each were used to heat the box. A door on the box allows access to the filters and other internal components for inspection or servicing. A type J thermocouple monitors air temperature in the box and also operates a temperature controller for the strip heaters.
The low-temperature electrical resistance heated lines are constructed similar to the high-temperature lines; however, a variac is not used. The low-temperature heated enclosure consists of an insulated box, a Metal Bellows model MB-158 pump, two electrical strip heaters, 1 micron scintered metal type filters, solenoid valves and three fine metering valves. The box has removable top and sides for component servicmg and a terminal strip for electrical connections. The fine metering valves are used to adjust the flow to all the analyzers except the Beckman model 402. The three-way solenoid valves are used to select the span gases and the gas dryer (wet or dry) mode. The sample port position of the valves is normally open.
The gas dryer is a Hankison, series E, compressed air dryer, model E-2 GSS. The CO-C02 sample may be routed through the dryer before being analyzed. Whether the dryer is selected or not, all bypassed sample flow is dried.
The MERF cyl inder compartment contains 10 regulated cyl inders for operat ing the analyzers. Seven cyl inders contain reference gases for interpret ing instrument response. The other three cyl inders contain analyzer operat ing gases. Three of the reference cyl inders contain mixed span gases of carbon monoxide (CO) carbon dioxide (C02), propane (C3H8), and Nitrogen (N2) balance. The highest concentration cylinder also contains oxygen (02) (table D-l). The three other reference gases are nitric oxide (NO) in various concentrations. Nitrogen is used to zero all analyzers. In the Beckman 402 the flame is sustained by a hydrogen/hel ium mixture (FID fuel), and hydrocarbon free air (FID air). Oxygen is used for ozone generation in the Beckman 951 Hx. All gases are electrically selected from the switch panel at the operator's station (figure D-2).
Five gas analyzers are mounted on a vibration dampened panel in the operator's area. The analyzers are connected through valves and tubing to the sample handling train, bottled gases, and the exhaust manifold (figure D-3).
The C02 analyzer is a Beckman model 864 nond ispers ive infrared un it. The C02 concentrat ion is determined by the different ial measurement of the absorpt ion of infrared energy between a reference cell and the sample cell. It is ranged 0-5 percent, 0-3 percent, and 0-1 percent by volume. The CO analyzer is a Beckman model 865 nondispersive infrared unit. This unit is similar to the 864 except that the sample and reference cells are considerably longer, thereby sampling a greater
D-2
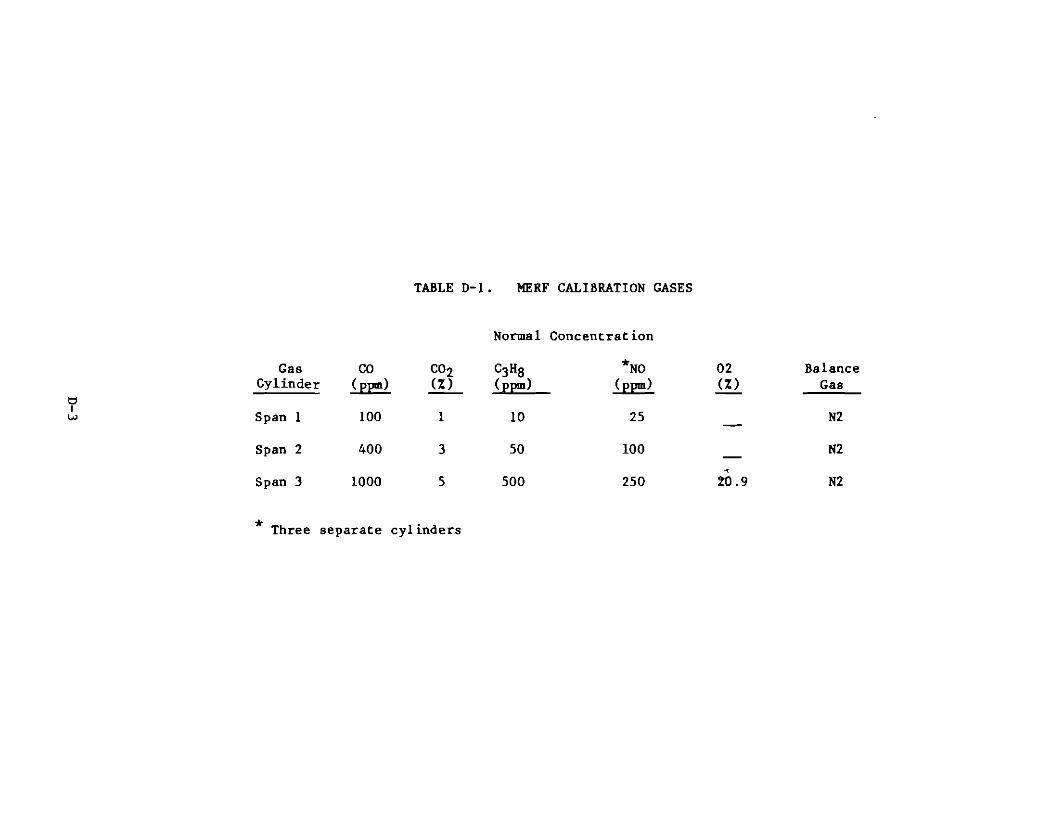
TABLE 0-1. KERF CALIBRATION GASES
Normal Concentration
t:l I w
Gas Cylinder
Span 1
CO (ppm)
100
CO2 (%)
1
C3 Ha (ppm)
10
*NO ~)
25
02 (%)
-
Balance Gas
N2
Span 2
Span 3
400
1000
3
5
50
500
100
250
-<
:!D.9
N2
N2
* Three separate cylinders
volume and increasing the sensitivity to much lower concentrations. It is ranged 0-1000 parts per million (ppm), 0-400 ppm, and 0-100 ppm by volume.
The total hydrocarbon (THC) analyzer 1S a Beckman model 402 FlO. The THC concentration is determined by passing a sample through a hydrogen flame in which a complex ionization process charges polarized electrodes proportional to the rate at which carbon atoms enter the burner. For the purposes of this testing, it is ranged 0-10 ppm, 0-50 ppm, 0-100 ppm, and 0-500 ppm propane by volume. The model 402 is modified for linear operation at very high THC concentrations to improve its repeatability. Modifications to this analyzer are described in detail in reference 5. A metering valve was also installed downstream of the filter to control all flow in the analyzer from the front panel. A replacement temperature controller and thermocouple were also installed to decrease its temperature cycling characteristics.
The oxides of nitrogen NOx are measured by a Beckman model 951 Hx, atmospheric pressure, hea ted, chemi lluminescent analyzer. The NO concentrat ion is determined by the reaction of nitric oxide and ozone. The light emitted is proportional to the NO concentration. The NOx can be measured by converting nitrogen dioxide (N02) to NO in a thermal converter then routing it to the reaction chamber. The analyzer is ranged 0-10 ppm, 0-25 ppm, 0-100 ppm, 0-250 ppm, and 0-1000 ppm by volume.
The 02 analyzer is a Beckman model OM-II with a polarographic sensor. An advanced sensor and amplification system combine to make this analyzer an extremely fast responding and highly accurate instrument. The 02 concentration is determined by a polarized voltage applied between two electrodes behind a permeable meml1rane which allows the diffusion of oxygen. This produces a current flow directly proportional to the oxygen partial pressure to which the sensor is exposed. The 02 pick-up head receives the sample from the outlet of the C02 analyzer.
The emission system exhaust manifold provides a slightly lower than atmospheric pressure environment into which is routed the analyzer exhausts and the bypassed sample flow. The manifold routes the flow under the floor into the bottle compartment exhaust fan where dilution and discharge into the air occur.
Three Beckman model 8720-2-03, dual channel, dry stylus strip chart recorders are used to continuously monitor CO, C02' THC, NOx ' and 02 outputs. The recorders are used only as a visual assurance of stabilized emission levels pr ior to da ta acquisition.
The MERF data acqu1s1t1on system includes a H-P 9830A calculator, 9866A thermal printer, 3495A scanner, 3490A multimeter, 9865A cassette memory, and a 9868A input/output expander. The analyzer outputs, ranges and gas solenoid valve positions are electrically routed to the scanner. The data acquisition program uses this information to compute concentrations, store the data on tape, and output hard copy for each data point taken (figure 0-4).
The communications system is a Oavid Clark model U3400 utility intercom system. It consists of an amplifier/power supply, junction boxes, extension cords, belt stations and headsets. Inside the MERF are connections for three belt stations/ headsets. An additional connection is reserved for external hookup to the MERF, but with junction boxes and extension cords, one may place as many as 30 headsets on the line at distances of up to 2,000 feet. All headsets attenuate outside noise up to 90 dB and are wired for 600 ohm operation.
0-4

FIGURE D-l. REAR OF ME p
o ~
0)
FIGURE D-2. GAS ANALYZERS IN THE MERF OPERATORS COMPARTHENT
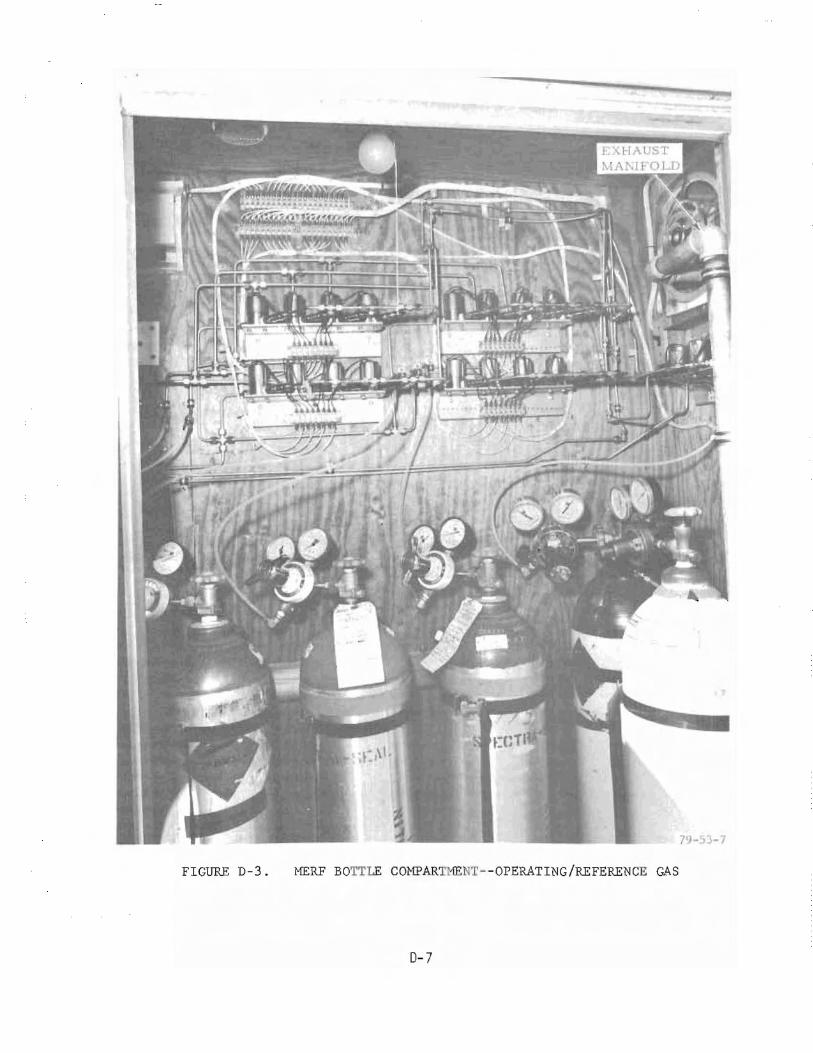
FIGURE D-3. MERE BOTTLE COMPAR ffiN~--OPERATING/REFERENCE GAS
0-7
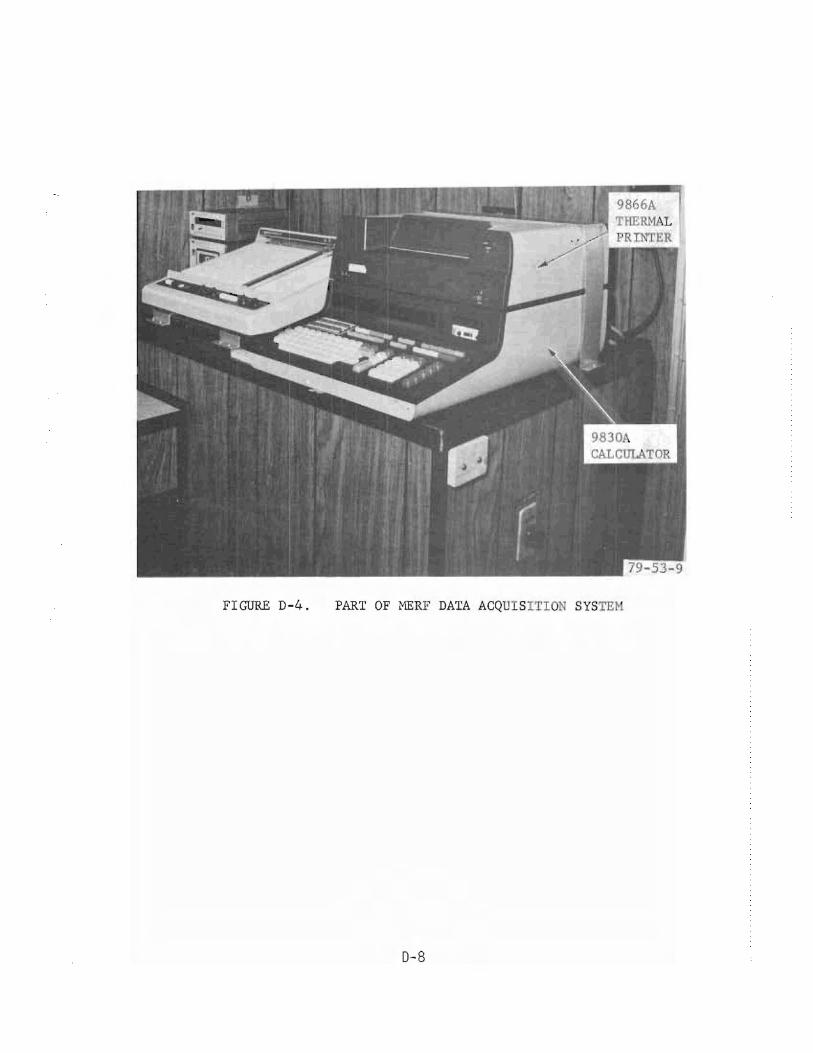
FIGURE D-4. PART OF ivlERF DATA ACQUISITIO SYSTE
0-8
Ih~l ~
, 10
I
iH-
I 11
I
APPENDIX E
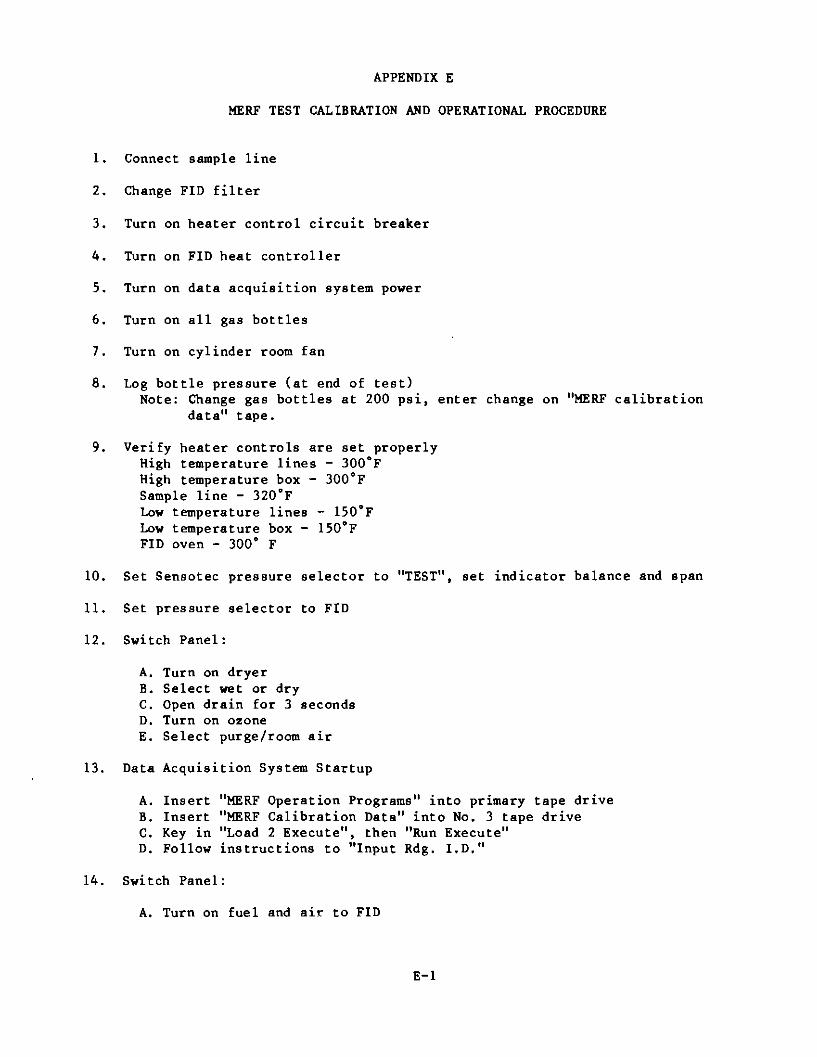
MERF TEST CALIBRATION AND OPERATIONAL PROCEDURE
1. Connect sample line
2. Change FID filter
3. Turn on heater control circuit breaker
4. Turn on FID heat controller
5. Turn on data acquisition system power
6. Turn on all gas bottles
7. Turn on cylinder room fan
8. Log bottle pressure (at end of test) Note: Change gas bottles at 200 psi, enter change on "MERF calibration
data" tape.
9. Verify heater controls are set properly High temperature lines - 300°F High temperature box - 300°F Sample line - 320°F Low temperature lines - 150°F Low temperature box - 150°F FID oven - 300° F
10. Set Sensotec pressure selector to "TEST", set indicator balance and span
11. Set pressure selector to FID
12. Switch Panel:
A. Turn on dryer B. Select wet or dry C. Open drain for 3 seconds D. Turn on ozone E. Select purge/room air
13. Data Acquisition System Startup
A. Insert "MERF Operation Programs" into primary tape drive B. Insert "MERF Calibration Data" into No. 3 tape drive c. Key in "Load 2 Execute", then "Run Execute" D. Follow instructions to "Input Rdg. 1.D."
14. Switch Panel:
A. Turn on fuel and air to FID
E-l
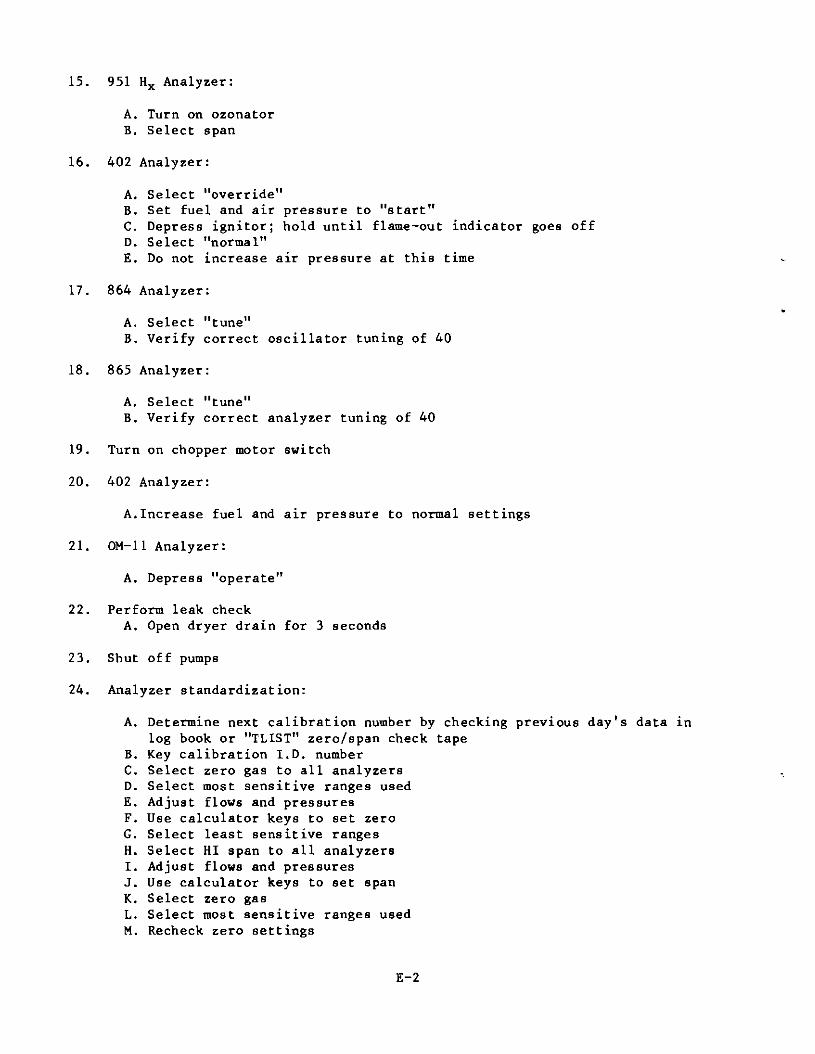
15. 951 Hx Analyzer:
A. Turn on ozonator B. Select span
16. 402 Analyzer:
A. Select "override II
Bw Set fuel and air pressure to "startll C. Depress ignitor; hold until flame-out indicator D. Select "normal" E. Do not increase air pressure at this time
goes off
17. 864 Analyzer:
A. Select I'tune" B. Verify correct
18. 865 Analyzer:
A. Select "tune ll
B. Verify correct
oscillator tuning of 40
analyzer tuning of 40
19. Turn on chopper motor switch
20. 402 Analyzer:
A.lncrease fuel and air pressure to normal settings
21. OM-II Analyzer:
A. Depress "operate"
22. Perform leak check A. Open dryer drain for 3 seconds
23. Shut off pumps
24. Analyzer standardization:
A. Determine next calibration number by checking previous day's data in log book or "ILIST" zero/span check tape
B. Key calibration 1.0. number C. Select zero gas to all analyzers D. Select most sensitive ranges used E. Adjust flows and pressures F. Use calculator keys to set zero G. Select least sensitive ranges H. Select HI span to all analyzers I. Adjust flows and pressures J. Use calculator keys to set span K. Select zero gas L. Select most sensitive ranges used M. Recheck zero settings
E-2

N. Record zero data (continue program) O. Select least sensitive range P. Record data Q. Select HI span R. Stabilize S. Record data T. Select MID span U. Stabilize V. Record data W. Select MID range X. Stabil ize Y. Record data Z. Select LO span
AA. Stabilize BB. Record data ee. Select LO range DD. Stabilize EE. Record data FF. Select room air/probe purge GG. Stabilize HH. Record data
25. Prior to engine start:
A. Pumps off B. Select probe purge/room air e. Turn on nitrogen gas purge and adjust to 5 psi
26. After engine start:
A. Turn off purge B. Pump on e. Select proper range for engine power (response greater than 40 percent
full-scale on all analyzers, if possible) D. Select sample E. Verify correct flows and pressures F. Verify proper system operation G. Check temperatures H. Select room air
27. Sampling:
A. Select sample 1 minute before end of engine stabilization period B. Select proper ranges for engine power e. Key in proper "Reading I.D." D. Verify correct analyzer flow and pressure E. Verify correct 402 analyzer auxiliary range setting F. Verify correct 951 Hx analyzer mode G. Verify data acquisition system is flashing "STAND BY" H. At test engineer's signal select sample on data acquisition system
for 1 minute
E-3

I. Switch off data acquisition J. Allow time for data to store 00 tape. K. Select room air
28. Analyzer Restandardization: (At least once per test sequence or every 30 minutes, whichever is sooner, all analyzers must be restandardized.)
A. Key in next calibration I.D. number B. Select zero gas to all analyzers C. Select most sensitive range used D. Adjust flows and pressures E. Record data F. If any data is greater than 2 percent off of target, use keys to reset
zero • G. Key in next calibration I.D. number H. Record adjusted data I. Select least sensitive range J. Select HI span gas K. Adjust flows and pressures L. Record data M. If any data is greater than 2 percent off of target, use keys to reset
span N. Key in calibration 1.0. number O. Record adjusted data P. Set up for sampling (see step 27)
E-4