novel energy management system for a dc · pdf filealternative electricity generation sources....
TRANSCRIPT

International Journal on Recent and Innovation Trends in Computing and Communication ISSN: 2321-8169 Volume: 5 Issue: 10 141 – 152
_______________________________________________________________________________________________
142 IJRITCC | October 2017, Available @ http://www.ijritcc.org _______________________________________________________________________________________
Novel Energy Management System for a DC MicroGrid
Ashan Imantha Bandara1, Prabath Binduhewa
2, Lilantha Samaranayake
3, Janaka Ekanayake
4
Dept. of Electrical Eng.
University of Peradeniya
Peradeniya, Sri Lanka
e-mail: 1. [email protected]; 2. [email protected]; 3. [email protected]; 4. [email protected]
Abstract—This paper presents a design and simulation of a rule based energy management system for a dc MicroGrid that considers a cost
function to reflect the battery degradation and that relates to the actual battery parameters.The derivation of the battery cost function and the
utilization of that to ensure an optimum utilization of the battery energy storage were presented. The detailed description of the algorithms used
to implement the EMS was presented. Simulation on PSCAD/EMTDC software was used to demonstrate the operation of the EMS both under
grid connected and islanded modes. Further, the inertia support provided by the super-capacitor to avoid the collapseof the dc link of the
MicroGrid was demonstrated.
Keywords - MicroGrid; EMS; battery; super-capacitor
__________________________________________________*****_________________________________________________
I. INTRODUCTION
The adverse effects to the environment caused by burning
of fossil fuel and depletion of fossil fuel triggered to search for
alternative electricity generation sources. As an alternative,
renewable energy sources such as photovoltaics and wind are
now emerged as main stream power generation sources. As the
renewable energy resource is intermittent and variable, they
have introduced challenges in terms of maintaining voltages,
line flows and stability of utility networks. In order to
overcome some of these challenges MicroGrids have been
considered. A MicroGrid is a low-voltage power system,
smaller in capacity, consisting local generation and local loads
with ability to operate autonomously or grid connected modes
[1]-[4]. Customer point of view, MicroGrid improves the
reliability of power whereas from the utility point of view,
MicroGrid enables to connect higher percentage of renewables
without destabilizing the existing utility network. In order to
facilitate the stable operation of a MicroGrid under autonomous
mode, energy storage within the MicroGrid is essential.
Even though early MicroGrids consist of ac feeders, only dc
MicroGrids and hybrid MicroGrids are emerging [1]-[4]. There
are two main reasons to attract interest for dc MicroGrids [1],
[5]-[7]. Renewable energy sources such as PV and energy
storage produce dc voltages. In order to integrate them to ac
MicroGrid, a dc-dc-ac conversion stage is essential. Further,
many loads such as ICT equipment, entertaining equipment,
portable appliances, etc. operates on dc internally thus
requiring ac-dc(-dc) conversion stages when connecting to the
ac MicroGrid.
A dc MicroGrid consists of number of microsources (<500
kW) such as PV systems, wind turbines, and fuel cells [8], [9].
These microsources integrated to the MicroGrid through
single-stage power conversion stage (often dc-dc). The utility
interconnection should allow bi-directional power flow thus
requiring a bi-directional ac-dc converter. The dc MicroGrid
also requires energy storage to overcome the transient in the
system and to negate medium or long term demand-supply
mismatches. Supercapacitors and flywheels are used to
overcome the transients within the MicroGrid while battery
storage is used for medium or long term demand supply
matching [10]-[14].
Hierarchical control that incorporates tertiary, secondary
and primary control stages are usually employed for a dc
MicroGrid. Primary control, which refers to the droop-control,
responds to the parameters set by the secondary control such
that the voltage is maintained within the acceptable values.
Secondary control ensures that the power shared by each source
is in accordance with the values scheduled by the tertiary
control. Tertiary control refers to the Energy Management
System (EMS) that uses a rule-based system or an optimization
routine based on cost or loss optimization to schedule different
constituent parts of the MicroGrid.
Different EMSs are discussed in the literature. In [15] an
EMS for an ac MicroGrid is presented. Six operating modes
were defined based on the grid voltage and frequency. A rule
based EMS was used to select the most appropriate operating
mode that schedules the utility power exchange, energy
storage, and renewable energy sources. In [16] an EMS
application fora dc MicroGrid established in an office building
is presented. The power balance is used as the decision making
variable and the carbon emission is optimized. In [17] an EMS
based on a rule based decision making system is implemented
for an isolated dc MicroGrid. An EMS with layered
architecture is presented in [18]. The topmost layer is the
human machine interface. The next layer, the prediction layer,
used metadata to predict the load and source profiles. Then the
energy management layer defines the schedules and the

International Journal on Recent and Innovation Trends in Computing and Communication ISSN: 2321-8169 Volume: 5 Issue: 10 141 – 152
_______________________________________________________________________________________________
143 IJRITCC | October 2017, Available @ http://www.ijritcc.org _______________________________________________________________________________________
operating layer sends the commands according to the schedule
given by the energy management layer. The operating layer is
developed as a rule based system. Considering two types of dc
MicroGrid configurations, distributed energy resources with
lumped loads and distributed energy resources with distributed
loads, reference [19] presents a rule based EMS. An EMS with
fuzzy control for a dc MicroGrid is presented in [20]. Here in
order to improve the life cycle of the battery, the fuzzy
controller manages the desired state of charge of the battery. A
complex EMS considering a multi-objective optimization with
forecasting of resources is presented in [21]. Except in [21],
none of the other EMS implementations considered the detail
model for the degradation of the energy storage device due to
constant charging and discharging. Even though [21]
considered a cost function to reflect battery degradation, it is
depending on a number of unknown constants which are not
related to the actual battery parameters. Considering the
simplicity of the rule based system, in this paper an EMS was
developed using a rule based system while considering a cost
function that reflects the battery degradation and that related to
the actual battery parameters. Further a super-capacitor was
used for inertia support.
A
B
DC Link
IL*(s)
IL(s)
HV(s)+-
VMPPT*(s)
Vin(s)
+- HI(s) d_Slr
VDC(t)
Id*(s)
Id(s)
GV(s)+-
VDC*(s)
VDC(s)
+-
GI(s)mdq
Controller of solar pv converter
Controller of Controlled Rectifier
C
ILb*(s)
ILb(s)
HV_Bat(s)+-
VDC_Link*(s)
VDC(s)
+- HI_Bat(s)
d_Bat
Controller of Battery Storage converter
DIL_SC(s)
+- HI_SC(s)
d_SC
Controller of Super-Capacitor converter
AC Utility
Connection
Super
Capacitors
CBSC
CBBat
CBSLR
CBAC
(PCC)
Energy
Management
System
MicroGrid Controller
HV Feeder
380 V
LV Feeder 1 & 2
48 V
IL_48*(s)
IL(s)
HV_48(s)+-
V48*(s)
V48(s)
+- HI_48(s)
d_48
Controller of LV Feeder
E F
VDC_Ref(s)
VDC(s)
Cp(s)+-
Figure 1. Proposed dc MicroGrid topology
II. MICROGRID PLATFORM
The proposed MicroGrid is shown in Fig. 1. It has solar
photovoltaic (PV) as local generation, connected to the utility
ac grid, a battery and a super-capacitor as energy storage
system (ESS) elements and two feeders to local loads.
The utility interface determines the power exchange
between the MicroGrid and the ac utility network. Thus
when there is a deficit power in the MicroGrid the controller
will use converter A to import power from the ac utility
network. Conversely when there is excess power, controller
of converter A will export power from MicroGrid to ac
utility. This is done by a reference, GridRf , received from
the EMS to the power regulation controller (this is not shown
in Fig. 1).
As Solar PV is a non-conventional renewable energy
source, the controller of the PV system extracts the
maximum available power at a given instance and rarely
reduces the output from the available maximum.Occasionally
PV output is shed through a reference, PVRf , received from
the EMS.
The battery storage is assigned to supply steady state
power requirement as scheduled by the EMS in both grid
connected and islanded modes. Converter C charges the
battery when there is excess power and discharges when
there is a power shortage in the dc MicroGrid. This is done
by a reference, BatRf , received from the EMS.
Thus super-capacitor is assigned to supply the rapid
power demands of the MicroGrid. Due to the variations in
loads and sources dc link voltage varies. This voltage
variation includes both transient and steady state
components. However, when the EMS maintaining the
power balance the variation of the dc link is mainly transient
variations and the super-capacitor is controlled by an outer
loop that maintains the dc link voltage to a reference.As
energy can be extracted from the super-capacitor relatively
International Journal on Recent and Innovation Trends in Computing and Communication ISSN: 2321-8169 Volume: 5 Issue: 10 141 – 152
_______________________________________________________________________________________________
144 IJRITCC | October 2017, Available @ http://www.ijritcc.org _______________________________________________________________________________________
fast, the above control action also provides inertia support to
the dc MicroGrid.
III. COST FUNCTION OF THE BATTERY
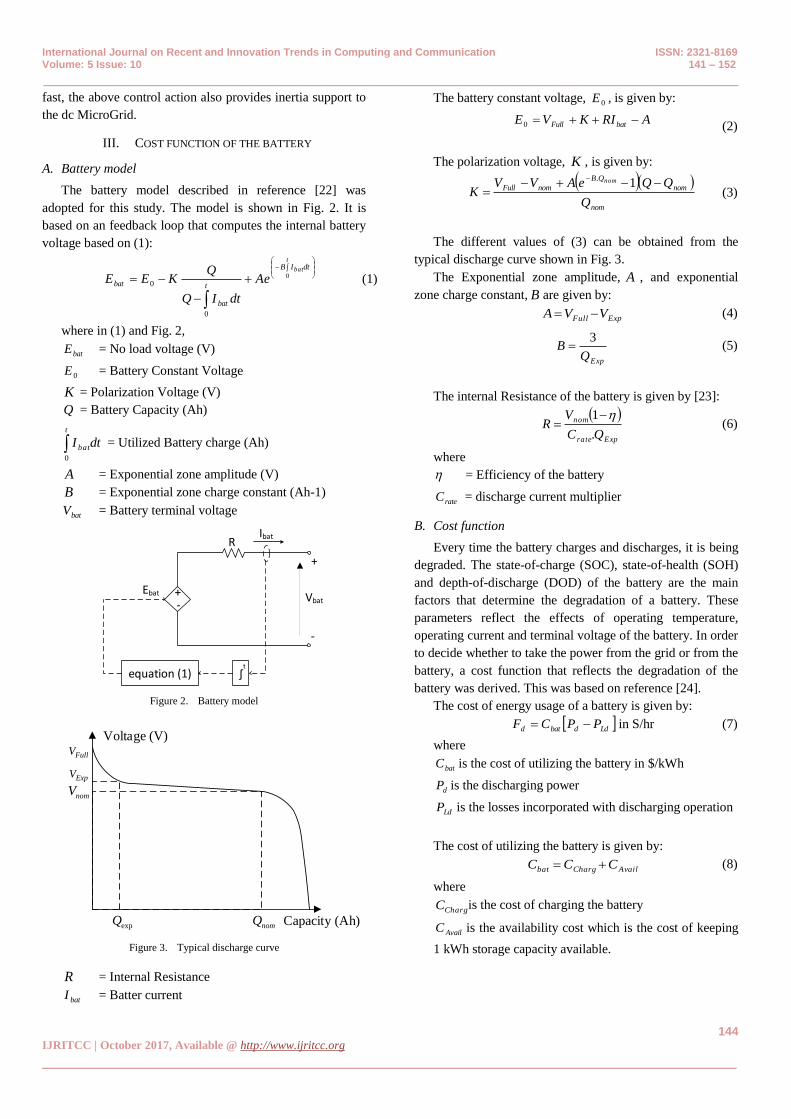
A. Battery model
The battery model described in reference [22] was
adopted for this study. The model is shown in Fig. 2. It is
based on an feedback loop that computes the internal battery
voltage based on (1):
t
batdtIB
t
bat
bat Ae
dtIQ
QKEE 0
0
0 (1)
where in (1) and Fig. 2,
batE = No load voltage (V)
0E = Battery Constant Voltage
K = Polarization Voltage (V)
Q = Battery Capacity (Ah)
t
batdtI0
= Utilized Battery charge (Ah)
A = Exponential zone amplitude (V)
B = Exponential zone charge constant (Ah-1)
batV = Battery terminal voltage
+-
equation (1)
Ibat
Ebat Vbat
+
-
R
t
Figure 2. Battery model
expQ
nomV
nomQ Capacity (Ah)
Voltage (V)
ExpV
FullV
Figure 3. Typical discharge curve
R = Internal Resistance
batI = Batter current
The battery constant voltage, 0E , is given by:
ARIKVE batFull 0 (2)
The polarization voltage, K , is given by:
nom
nom
QB
nomFull
Q
QQeAVVK
nom
1
.
(3)
The different values of (3) can be obtained from the
typical discharge curve shown in Fig. 3.
The Exponential zone amplitude, A , and exponential
zone charge constant, B are given by:
ExpFull VVA (4)
ExpQ
B3
(5)
The internal Resistance of the battery is given by [23]:
Exprate
nom
QC
VR
.
1 (6)
where
= Efficiency of the battery
rateC = discharge current multiplier
B. Cost function
Every time the battery charges and discharges, it is being
degraded. The state-of-charge (SOC), state-of-health (SOH)
and depth-of-discharge (DOD) of the battery are the main
factors that determine the degradation of a battery. These
parameters reflect the effects of operating temperature,
operating current and terminal voltage of the battery. In order
to decide whether to take the power from the grid or from the
battery, a cost function that reflects the degradation of the
battery was derived. This was based on reference [24].
The cost of energy usage of a battery is given by:
Lddbatd PPCF in S/hr (7)
where
batC is the cost of utilizing the battery in $/kWh
dP is the discharging power
LdP is the losses incorporated with discharging operation
The cost of utilizing the battery is given by:
AvailChargbat CCC (8)
where
ChargC is the cost of charging the battery
AvailC is the availability cost which is the cost of keeping
1 kWh storage capacity available.

International Journal on Recent and Innovation Trends in Computing and Communication ISSN: 2321-8169 Volume: 5 Issue: 10 141 – 152
_______________________________________________________________________________________________
145 IJRITCC | October 2017, Available @ http://www.ijritcc.org _______________________________________________________________________________________
If renewable energy is purely used for charging the
battery ChargC can be considered as zero. Thus AvailC is the
cost incorporated with the battery usage and is given by:
C
Cost tReplacemenCAvail (9)
where
C is the total life time cycling capacity of the battery
The total life time cycling capacity, C , of the battery
depends on the rated capacity of the battery (rC ), rated
depth-of-discharge ( rDOD ) and life time in terms of cycles
( rL ). For a Li-Ion battery C is given by (10).
0.9 0.1) `r r rC C DOD L (10)
The number of cycles for Li-Ion batteries is given as a
curve in [25]. From curve fitting (11) was obtained to
represent rL .
685.0
ln98.4exp r
r
DODL (11)
The losses associated with the discharging the battery
(shown in (7)) is given by
ddLd PPP 2
(12)
where
2
1
rVtSOC
KR
tSOCV
tSOCKC
r
r
2
1.
K and R are as defined in equations (3) and (6)
rV is the rated voltage of the battery
IV. PROPOSED EMS SYSTEM
The proposed EMS system is implemented as a real time
operating algorithm. Before commencing the algorithm a set
of variables are initiated inside the EMS.
Prior to selecting the most suitable operating mode, the
EMS algorithm first check the status of the utility grid
(GridSts) to determine whether the MicroGrid is in grid
connected mode (GridSts =1) or in islanded mode (GridSts
=0). Next it checks the power balance ( BalP ) between solar
PV ( PVP ) and Load ( LdP ) using equation (13):
LdPVBal PPP (13)
Depending on the power balance and availability of the
utility the EMS decides four operating modes as shown in
Fig. 4. Inputs shown in Fig. 4 are described under each
operating mode.
Read Inputs
PGrid, PPV, PBat, PSC, PLd
GridSts, SOCBt, PriEsell, PriEbuy, PriBat
SOCMin, SOCMid, SOCMax, P_BMax, P_GMax
RfGrid, RfPV, RfBat, RfSC, RfLd
Start
GridSts == 1PBal =
PPV – PLd
PBal =
PPV – PLd
Yes No
PBal>= 0 PBal>= 0
Mode 1
Export Priority
Mode 2
Import Priority
Mode 3
ESS Priority
Mode 4
Demand Priority
Yes No Yes No
Return
Figure 4. The block diagram of the Proposed EMS
A. Export Priority Mode
The algorithm used for this mode is shown in Fig. 5. The
EMS will first evaluate the state-of-charge of the battery (
BatSOC ). If BatSOC is less than the maximum allowable SOC
level, MaxSOC , then the excess power is used to charge the
battery. The condition Bat MaxSOC SOC is referred to as
SOC constraint in subsequent sections. While maintaining
the rated depth-of-discharge the MaxSOC limit can be adjusted
to shift the charging profile of the battery. Before scheduling
the charging power of the battery, EMS checks the power
rating of the converter C (Fig. 1). If the excess power is more
than the rated power ( MaxBP _ ) of the battery interface
converter, the EMS will schedule the battery charging power
reference ( BatRf ) to maximum. Otherwise it will schedule
the battery to charge using the available power. Once the
battery is fully charged then the battery interface converter
goes into idle state. Then the EMS checks the possibility of
exporting available power to the ac utility. If the excess
power is more than the rating of the ac utility interface
converter (A), MaxGP _ , the EMS schedules the export
power ( GridRf ) to be the maximum and initiate a PV
shedding scheme in order to keep the power balance within
the MicroGrid. The amount of PV to be shed was calculated
using (14).
PV Grid LdRf P P (14)
B. Import Priority Mode
In the grid connected mode if the total local load is more
than PV generation, the EMS shifts to the import priority
mode. The controlled rectifier is scheduled to import power
from the ac utility or battery interface converter is scheduled
to discharge and supply the power to keep the power balance

International Journal on Recent and Innovation Trends in Computing and Communication ISSN: 2321-8169 Volume: 5 Issue: 10 141 – 152
_______________________________________________________________________________________________
146 IJRITCC | October 2017, Available @ http://www.ijritcc.org _______________________________________________________________________________________
inside the dc MicroGrid. Further in this mode battery is
charged if the utility Time of Use (ToU) price is minimum.
In this mode the scheduling is primarily done according
to the cost of importing power from the ac utility ( UtilityC ),
and the cost involved in discharging the battery ( _bat dC ).
The ac utility price, UtilityC , is the selling price of the energy
from service providers to the MicroGrid and assumed as a
ToU tariff. The cost of discharging the battery was computed
using (7) by multiplying dF with the time step of each
iteration.
Mode 1
Export Priority
PBal < P_BMax
Yes
Set Charging
RfBat = PBal
Set Max power Charging
RfBat = P_BMax
NoYes
Balance Power Exports to
the grid
PBal < P_GMax
No
Set Battery converter off
RfBat = 0
Set Max power export
RfGrid = P_GMax
No
PV Shedding
Return
SOCBat< SOCMax
Yes
Figure 5. The Export Priority mode operating block diagram
Mode 2
Cost Priority
Cbat_d > CUtility
PBal < P_GMax
Set Charging
RfBat = k*(P_GMax - PBat)
Turn Off
RfBat = 0
Yes
SOCBat<SOCMax
Yes
No
SOCMin < SOCBat
No
Set Discharging
RfBat = P_GMax - PBat
Yes
Turn Off
RfBat = 0
No
Demand Side
Management
Balance Power Import from the grid
SOCMin < SOCBat
No
PBal < P_BMax
Set Discharging
RfBat = PBat
Set Max power Discharging
RfBat = P_BMax
YesGridReq == 1 Yes
Set Discharging
RfBat = k*(P_BMax - PBat)
Yes
No
No
Turn Off
RfBat = 0
No
Return
PBal < P_GMax
CUtility = CUtility_Min
Yes
Yes
No
Maximum Power
Import from the
grid
No
Yes
Figure 6. Block diagram of Import Priority Mode
The algorithm used for this mode is shown in Fig. 6.
Initially algorithm checks whether _Bat d UtilityC C ; in other
wards whether the cost of importing power from the grid is
less than the discharging the battery. If the battery energy
cost _( )bat dC is more than )Utility(C , the EMS will import
power from the ac utility. To proceed further the EMS
checks whether the power balance is less than the rating of
the controlled rectifier )Max(P_G . Then EMS checks
whether the utility energy price is the minimum price of ToU
( _Utility MinC ). Also it checks the SOC constraint. The desired
charging power of the battery is set according to (15) where
k is a constant used to ensure that the total import power is
within MaxP_G .
10_ cBalMaxcBat k ; PGPkRf (15)
Further, the balance power is imported from the ac utility
through the utility interface converter.On the other hand if
the BalP is more than MaxP_G , the algorithm examines
whether the battery has sufficient charge, i.e. Min BatS SOC OC
, to supply the demand that cannot be supplied solely by
importing power from the ac utility. Then the battery
converter is scheduled to discharge mode according to (16).
However if batter doesn’t have enough charge then the
demand side management (DSM) is initiated to maintain
power balance.
BalMaxBat PGPRf _ (16)
Conversely when the extracting energy from the battery
_bat dC is cheaper than utility price, UtilityC , the EMS will
schedule the battery storage to supply the demand instead of
utility interface. However the dc link control is handled by
the utility interface converter.
Firstly the controller checks whether Min BatS SOC OC . If
the battery has sufficient SOC, then the converter rating is
checked against BalP . If the rating is adequate then BalP is
supplied by discharging the battery.However in an instance
where the ac utility operator requests support from the
MicroGrid, it is going to act as a good citizen. So in Import
priority mode when the battery energy is cheaper it checks
whether ac utility request support (GridReq = 1). In such
situation the battery is scheduled according to (17)in order to
increase the rate of discharge and sell electricity to the ac
utility.
10_ dBalMaxdBat k ; PBPkRf (17)
Further, in import priority mode the utility interface
converter is primarily importing power from the utility or
keep in idle while controlling the dc link. However if ac
International Journal on Recent and Innovation Trends in Computing and Communication ISSN: 2321-8169 Volume: 5 Issue: 10 141 – 152
_______________________________________________________________________________________________
147 IJRITCC | October 2017, Available @ http://www.ijritcc.org _______________________________________________________________________________________
utility require support then it exports the required amount of
power from dc MicroGrid to ac utility.
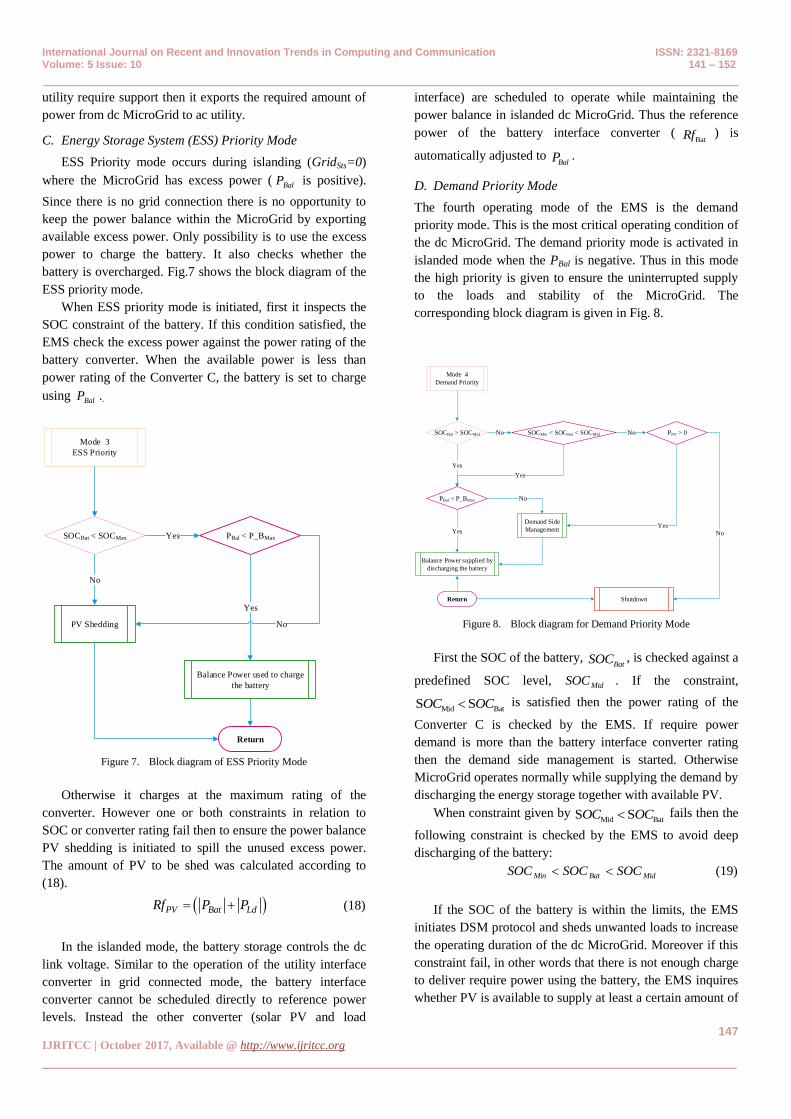
C. Energy Storage System (ESS) Priority Mode
ESS Priority mode occurs during islanding (GridSts=0)
where the MicroGrid has excess power ( BalP is positive).
Since there is no grid connection there is no opportunity to
keep the power balance within the MicroGrid by exporting
available excess power. Only possibility is to use the excess
power to charge the battery. It also checks whether the
battery is overcharged. Fig.7 shows the block diagram of the
ESS priority mode.
When ESS priority mode is initiated, first it inspects the
SOC constraint of the battery. If this condition satisfied, the
EMS check the excess power against the power rating of the
battery converter. When the available power is less than
power rating of the Converter C, the battery is set to charge
using BalP ..
Mode 3
ESS Priority
SOCBat < SOCMax
Balance Power used to charge
the battery
Return
PV Shedding
No
PBal < P_BMaxYes
Yes
No
Figure 7. Block diagram of ESS Priority Mode
Otherwise it charges at the maximum rating of the
converter. However one or both constraints in relation to
SOC or converter rating fail then to ensure the power balance
PV shedding is initiated to spill the unused excess power.
The amount of PV to be shed was calculated according to
(18).
PV Bat LdRf P P (18)
In the islanded mode, the battery storage controls the dc
link voltage. Similar to the operation of the utility interface
converter in grid connected mode, the battery interface
converter cannot be scheduled directly to reference power
levels. Instead the other converter (solar PV and load
interface) are scheduled to operate while maintaining the
power balance in islanded dc MicroGrid. Thus the reference
power of the battery interface converter (BatRf ) is
automatically adjusted to BalP .
D. Demand Priority Mode
The fourth operating mode of the EMS is the demand
priority mode. This is the most critical operating condition of
the dc MicroGrid. The demand priority mode is activated in
islanded mode when the PBal is negative. Thus in this mode
the high priority is given to ensure the uninterrupted supply
to the loads and stability of the MicroGrid. The
corresponding block diagram is given in Fig. 8.
Mode 4
Demand Priority
SOCBat > SOCMid
Return
Balance Power supplied by
discharging the battery
PBal < P_BMax
Yes
Yes
Demand Side
Management
No
SOCMin < SOCBat < SOCMid No
Yes
PPV > 0No
Yes
Shutdown
No
Figure 8. Block diagram for Demand Priority Mode
First the SOC of the battery, BatSOC , is checked against a
predefined SOC level, MidSOC . If the constraint,
Mid BatS SOC OC is satisfied then the power rating of the
Converter C is checked by the EMS. If require power
demand is more than the battery interface converter rating
then the demand side management is started. Otherwise
MicroGrid operates normally while supplying the demand by
discharging the energy storage together with available PV.
When constraint given by Mid BatS SOC OC fails then the
following constraint is checked by the EMS to avoid deep
discharging of the battery:
MidBatMin SOCSOCSOC (19)
If the SOC of the battery is within the limits, the EMS
initiates DSM protocol and sheds unwanted loads to increase
the operating duration of the dc MicroGrid. Moreover if this
constraint fail, in other words that there is not enough charge
to deliver require power using the battery, the EMS inquires
whether PV is available to supply at least a certain amount of
International Journal on Recent and Innovation Trends in Computing and Communication ISSN: 2321-8169 Volume: 5 Issue: 10 141 – 152
_______________________________________________________________________________________________
148 IJRITCC | October 2017, Available @ http://www.ijritcc.org _______________________________________________________________________________________
loads. Depending upon the amount of PV availability the
DSM algorithm adjusts the loads of the MicroGrid.
Eventually if there is neither PV nor SOC available EMS
send a shutdown signal and MicroGrid controller initiates the
shutdown sequence to halt the operations of the dc
MicroGrid.
E. Demand Side Management (DSM)
As explain before in import priority mode and demand
priority mode the Demand Side management is used to
schedule available power in the dc MicroGrid. Five DSM
protocols were defined and they were activated according to
the EMS decisions. The amount need to reduce from loads
are calculated in grid priority mode using (21) and in
islanded mode using (22). The new power reference value for
load feeders is set according to (23).
PVBatGridLdShd PPPPLd (21)
PVBatLdShd PPPLd (22)
ShdLdLd LdPRf (23)
The DSM modes are given in Table 1.
TABLE I. DSM GUIDELINES
DSM
Mode
Description
1 The load feeder converter will be scheduled
using (21) and (23).
2 The load feeder converter will be scheduled
using (22) and (23).
3 The total load will be reduced to 75% of the
predicted.
4 The total load will be reduced to 50% of the
predicted.
5 The total load will be reduced to 25% of the
predicted.
V. CASE STUDY
Two case studies have been conducted to investigate the
performance of the dc MicroGrid with the same PV and load
profiles. First case study was done for a grid connected
MicroGrid and the second case study was done with grid
failure scenario. Using the case studies performance of the dc
MicroGrid with EMS was evaluated.
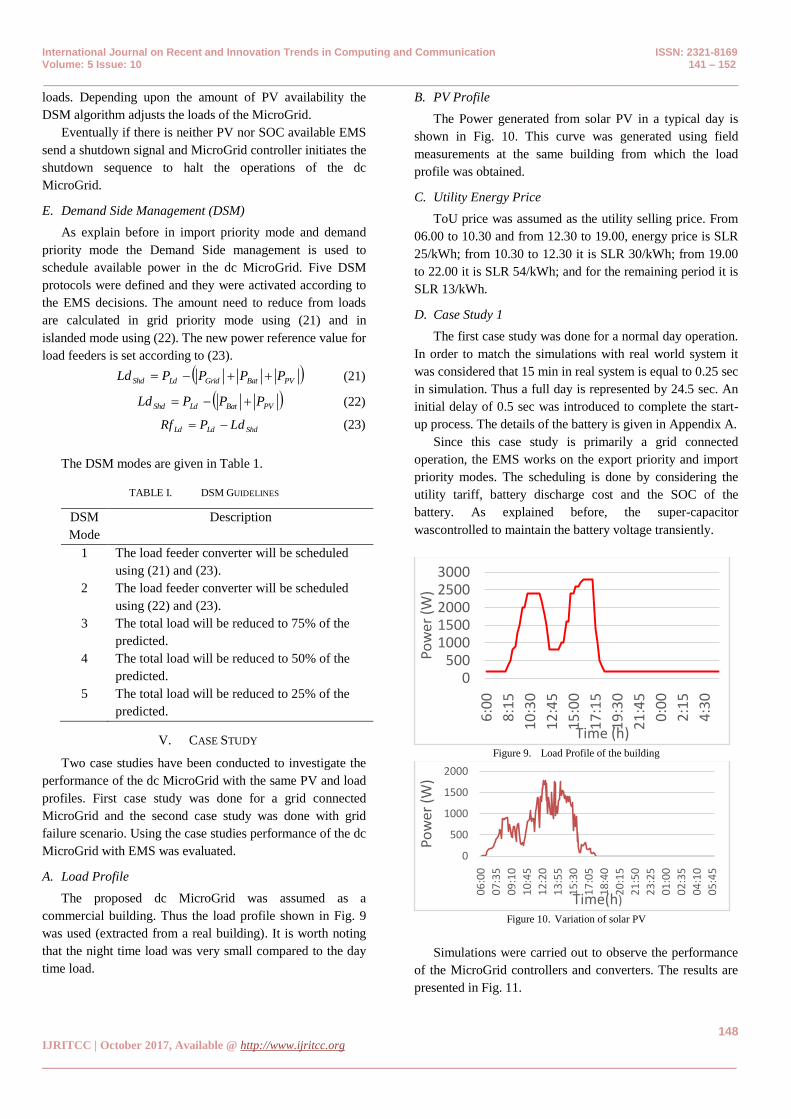
A. Load Profile
The proposed dc MicroGrid was assumed as a
commercial building. Thus the load profile shown in Fig. 9
was used (extracted from a real building). It is worth noting
that the night time load was very small compared to the day
time load.
B. PV Profile
The Power generated from solar PV in a typical day is
shown in Fig. 10. This curve was generated using field
measurements at the same building from which the load
profile was obtained.
C. Utility Energy Price
ToU price was assumed as the utility selling price. From
06.00 to 10.30 and from 12.30 to 19.00, energy price is SLR
25/kWh; from 10.30 to 12.30 it is SLR 30/kWh; from 19.00
to 22.00 it is SLR 54/kWh; and for the remaining period it is
SLR 13/kWh.
D. Case Study 1
The first case study was done for a normal day operation.
In order to match the simulations with real world system it
was considered that 15 min in real system is equal to 0.25 sec
in simulation. Thus a full day is represented by 24.5 sec. An
initial delay of 0.5 sec was introduced to complete the start-
up process. The details of the battery is given in Appendix A.
Since this case study is primarily a grid connected
operation, the EMS works on the export priority and import
priority modes. The scheduling is done by considering the
utility tariff, battery discharge cost and the SOC of the
battery. As explained before, the super-capacitor
wascontrolled to maintain the battery voltage transiently.
Figure 9. Load Profile of the building
Figure 10. Variation of solar PV
Simulations were carried out to observe the performance
of the MicroGrid controllers and converters. The results are
presented in Fig. 11.
0500
10001500200025003000
6:0
0
8:1
5
10
:30
12
:45
15
:00
17
:15
19
:30
21
:45
0:0
0
2:1
5
4:3
0
Pow
er (
W)
Time (h)
0
500
1000
1500
2000
06
:00
07
:35
09
:10
10
:45
12
:20
13
:55
15
:30
17
:05
18
:40
20
:15
21
:50
23
:25
01
:00
02
:35
04
:10
05
:45
Pow
er (
W)
Time(h)

International Journal on Recent and Innovation Trends in Computing and Communication ISSN: 2321-8169 Volume: 5 Issue: 10 141 – 152
_______________________________________________________________________________________________
149 IJRITCC | October 2017, Available @ http://www.ijritcc.org _______________________________________________________________________________________
Fig. 11 (a) and (b) shows the variation of load and PV
generation. Both followed, the profiles presented in Fig. 9
and 10.
The variation of power supplied from controlled rectifier
and battery interface converter are presented in Fig.11 (c)
and (d) respectively. As shown in Fig. 11 (c) during 0.5 sec
to 5 sec period, most of the power was imported from the ac
utility to the dc MicroGrid through the controlled rectifier.
This period is equal to 6:00 h to 10:30 h in real time. The
solar PV generation was less than the total load in this
duration. After that from 5 sec to 6.75 sec (i.e. from 10:30 h
to 12:15 h) the utility tariff increased more than the battery
energy cost. Therefore the battery converter was activated
and supplied majority of required power demand. The power
imported from the ac utility is reduced by the utility interface
converter in order to maintain the power balance. However
after 6.75 sec (i.e. after 12:15 h) again utility energy price
decreases compare to battery energy price. Also the solar
irradiance increased more than the total load. Hence the EMS
schedules the battery to charge mode. So the MicroGrid
controller switched the battery interface converter to the
charge mode and the SOC of the battery reaches to its
maximum limit (not shown in Fig 11) at 9.00 sec (i.e. at
14.30h). After that the battery converter is put into idle and
the utility interface converter and the PV converter supplied
the demand. At 13.50 sec (i.e. at 19.00 h) another tariff
increment appears in the ac utility energy price. Hence the
MicroGrid controller sets the controlled rectifier to export
power since the EMS schedules the battery interface
converter to discharge the battery and support the utility grid
during its peak demand. After battery reached to its critical
SOC level this operation stopped (15.25 sec, i.e.at 21.00 h)
and the controlled rectifier import power from the ac utility
to supply the base load. At 17 sec (i.e. at 22:15 h) the
imported power increased because EMS scheduled the
battery converter to charge the battery to ready for the next
day.
Fig. 11 (d)shows the power variation of the battery
interface converter. With reference to the aforementioned
discussion, in 5 sec to 6.75 sec (i.e. from 10:30 h – 12.15 h)
period the battery converter started to supply power by
discharging the battery. From 6.75 sec to 9 sec because of the
reduction of load, the battery converter sets back to charging
mode and charge the battery using the excess solar power
without exporting to the ac utility. In between 9 – 13.50 sec
(a) Variation of solar PV output power
(b) Variation of Load
(c) Variation of power supplied from controlled rectifier
(d) Variation of power supplied from battery
(e) Variation of power supplied from Super-capacitor
Pow
er (
W)
Pow
er (
W)
Pow
er (
W)
Pow
er (
W)
Pow
er (
W)
Time (s)
Time (s)
Time (s)
Time (s)
Time (s)
Figure 11. Variations of the utility tariff and output power in case study 1
(i.e. from 14.30 h to 19.00 h), the batteryconverter set into
idle mode by the controller since most of the demand was
supplied from the controlled rectifier. From 13.50 sec (i.e. at
19:00 h) onwards the battery converter scheduled to be in the
grid support mode.
The role of the super-capacitor is to supply the power
deficit and absorbs excess by looking at the variation of the

International Journal on Recent and Innovation Trends in Computing and Communication ISSN: 2321-8169 Volume: 5 Issue: 10 141 – 152
_______________________________________________________________________________________________
150 IJRITCC | October 2017, Available @ http://www.ijritcc.org _______________________________________________________________________________________
dc link voltage. At every instance it charges and discharges
by supplying required power difference. This variation is
presented in Fig. 11 (e). Because of this the stresses of the
controlled rectifier which controls the dc link voltage is
reduced and the dc link voltage becomes more stable.
E. Case Study 2
In the second case study, a scenario when grid failure
occurred was analyzed. The grid failure condition was
simulated by disconnecting the MicroGrid from the ac utility
and the controlled rectifier was put into a current controlled
mode with zero current reference. Two grid failures, one at
08.36 h and restored at 09.12 h, and the other at 11.12 h and
restored at 13.18 h, were considered.
The same PV profile as shown in Fig 10 was considered
in this case study as well. Even though the same loading
pattern shown in Fig. 9 was used, during the period of the
grid failure, the load was reduced through DSM. Fig. 12
shows the resulted power profiles of the dc MicroGrid.
By comparing Fig. 9 and 10, it can be noticed that, at the
first grid failure (at 3.1 sec (08.36 h)) the PV generation is
more than the load. Thus EMS switched to the ESS priority
mode and used the excess energy to charge the battery. Once
grid is available after 0.6 s (18 min) the EMS switched back
to the grid connected mode. In the second grid failure at 5.7
sec (i.e. at 11.12h) since the total load is more than the
available PV generation, EMS switched back to islanded
mode with the demand priority mode. Hence when SOC
reaches its mid-level, the DSM scheme is activated and
reduced the load. This load reduction can be observed by
comparing Fig. 9 and Fig 12 (a).
Fig 12 (b)shows the variation of power supplied by the
controlled rectifier. According to the figure from 3.1 sec to
3.7 sec (i.e. from 08:36 h to 09:12 h) and from 5.7 sec to 7.8
sec (i.e. from 11:12 h to 13:18 h), the controlled rectifier
doesnot exchange power due to the grid failure. At this
instant where the MicroGrid lost utility power, the super-
capacitor converter is activated and it supplied power to the
MicroGriduntil the battery converter was activated and
started to supply power to stabilize the dc MicroGrid.
Furthermore, by looking at Fig 12 (c) at 3.1 sec (i.e. at
08:36 h) and at 5.7 sec (i.e. at 11:12 h), it can be seen that the
battery converter took the control of dc link stability and
started to supply power. During these intervals the EMS
operated in the ESS priority mode and demand priority
mode.In demand priority mode, the EMS used SOC as one of
the decision making variable. Once the SOC of the battery
storage started to reduce below SOCMid the EMS initiates the
DSM algorithms. At 6.10 sec (i.e. at 11:36 h) SOC reached
to SOCMidand DSM schedule is activated by the EMS thus
reducing the load. When the grid came back at 7.8 sec (i.e. at
13:18 h), loads are restored and the dc link control was
handed over to the controlled rectifier.
During the islanding process, the dc link voltage control
of the MicroGrid is transferred to the battery converter from
the controlled rectifier. However the EMS signals were
(b) Variation of power supplied from controlled rectifier
(c) Variation of power supplied from battery
(d) Variation of power supplied from Super-capacitor
Pow
er (
W)
Pow
er (
W)
Pow
er
(W)
Time (s)
Time (s)
Time (s)
(a) Variation of Load power
Pow
er
(W)
Time (s)
Time (s)
Time (s)
Time (s)
Figure 12. Variation of the utility tariff and output power in case study 2
dispatched in 0.5 sec (at 15 min) intervals and in this case the
grid failures occurred at the middle of EMS dispatching
intervals. Until such time the EMS sends the command to the
battery converter, the stability of the dc link was maintained
by the super-capacitor converter. This inertia action can be
clearly seen in Fig. 12 (d).
VI. CONCLUSIONS
From case studies it was observed that the proposed EMS
was capable of handling the power sharing of different
energy sources in relation to the demand, under grid
connected and islanded modes.
As can be seen from Case study 1, when there is excess
power, the EMS scheduled the battery converter either to
International Journal on Recent and Innovation Trends in Computing and Communication ISSN: 2321-8169 Volume: 5 Issue: 10 141 – 152
_______________________________________________________________________________________________
151 IJRITCC | October 2017, Available @ http://www.ijritcc.org _______________________________________________________________________________________
utilize its energy storage within the MicroGrid or export it to
the utility. On the other hand when there is power shortage
the EMS scheduled to import power from the ac utility to
keep the power balance in more cost effective manner.
Case study 2 demonstrated the operation of the dc
MicroGrid under all operating modes of the EMS. The key
feature to note here is that the transition of the controls
between grid connection and islanding operations. Power
sharing between each converter and loads was done
seamlessly and MicroGrid controllers handle the power set
points according to the schedule dispatched by the EMS. The
DSM was effectively utilized to maintain the health of the
battery based on a pre-defined SOC level.
The operation of the super-capacitor interface converter
helped to minimize the dc link ripples. Also during islanding,
it provided the inertia support to the MicroGrid to avoid the
collapse.
More importantly the constantly monitoring the
degradation of the battery through the discharge cost function
is a unique contribution of this piece of work. As the EMS
continuously monitors the cost associated with discharging
the battery with the utility price, this ensures an optimum
utilization of the battery energy storage.
VII. APPENDIX A
Battery Specification [16] from the data sheet of the smart
battery, “SB 100”
Parameter Data
Technology Class LiFePO4
Nominal Voltage 36.0 V
Rated Capacity 3.3 kWh
Rated DOD 80 %
SOC Max 90%
SOC Min 10%
Number of Cycles 1500
Replacement Cost Rs.200,000/=
ACKNOWLEDGMENT
Authors wishes to acknowledge the National Research
Council of Sri Lanka (Grant No: NRC 14-15) and
Sustainable Energy Authority of Sri Lanka for providing
financial support for this work.
REFERENCES
[1] J.-D. Park and J. Candelaria, “Fault Detection and Isolation in
Low-Voltage dc-Bus Microgrid System,” IEEE Trans. Power
Deliv., vol. 28, no. 2, pp. 779–787, 2013
[2] J. M. Guerrero, J. C. Vasquez, J. Matas, L. G. de Vicuña, and
M. Castilla, “Hierarchical Control of Droop-Controlled ac and
dc Microgrids #x2014;A General Approach Toward
Standardization,” IEEE Trans. Ind. Electron., vol. 58, no. 1,
pp. 158–172, Jan.
[3] C.-M. Lai, C.-T. Pan, and M.-C. Cheng, “High-Efficiency
Modular High Step-Up Interleaved Boost Converter for dc-
Microgrid Applications,” IEEE Trans. Ind. Appl., vol. 48, no.
1, pp. 161–171, 2012.
[4] D. Chen and L. Xu, “Autonomous dc Voltage Control of a dc
Microgrid With Multiple Slack Terminals,” IEEE Trans.
Power Syst., vol. 27, no. 4, pp. 1897–1905, 2012.
[5] Y. Ito, Y. Ito, Y. Zhongqing, and H. Akagi, “dc microgrid
based distribution power generation system dc microgrid
based distribution power generation system,” in Power
Electronics and Motion Control Conference, 2004. IPEMC
2004. The 4th International, 2004, vol. 3, pp. 1740–1745
Vol.3.
[6] Y.-K. Chen, Y.-C. Wu, C.-C. Song, and Y.-S. Chen, “Design
and Implementation of Energy Management System With
Fuzzy Control for dc Microgrid Systems,” IEEE Trans. Power
Electron., vol. 28, no. 4, pp. 1563–1570, 2013.
[7] H. Kakigano, Y. Miura, and T. Ise, “Distribution Voltage
Control for dc Microgrids Using Fuzzy Control and Gain-
Scheduling Technique,” IEEE Trans. Power Electron., vol.
28, no. 5, pp. 2246–2258, 2013.
[8] J.A.P. Lopes, C.L. Moreira, and A.G. Madureira, “Defining
control strategies for MicroGrids islanded operation,” IEEE
Transactions on Power Systems,, vol. 21, 2006, pp. 916-924.
[9] C.L. Moreira, F.O. Resende, and J.A.P. Lopes, “Using Low
Voltage MicroGrids for Service Restoration,” IEEE
Transactions on Power Systems, vol. 22, 2007, pp. 395-403.
[10] B. Kroposki, R. Lasseter, T. Ise, S. Morozumi, S.
Papatlianassiou, and N. Hatziargyriou, “Making microgrids
work,” IEEE Power and Energy Magazine, vol. 6, 2008, pp.
40-53.
[11] Y. Kojima, M. Koshio, S. Nakamura, H.A.M.H. Maejima,
Y.A.F.Y. Fujioka, and T.A.G.T. Goda, “A Demonstration
Project in Hachinohe: Microgrid with Private Distribution
Line,” IEEE International Conference on System of Systems
Engineering, SoSE, 2007, pp. 1-6.
[12] A. Yokoyama, “Overview of Microgrid R&D in Japan,”
Symposium on MicroGrids, University of California, San
Diego: 2009.
[13] T. Tsukada, T. Tokumoto, T. Ogata, and S. Tagami,
“DEMONSTRATION OF MICROGRID THROUGH THE
ACTIVITIES TOWARD HOLONIC ENERGY SYSTEMS,”
6th International Conference on Indoor Air Quality,
Ventilation & Energy Conservation in Buildings - IAQVEC,
Sendai, Japan, 2007:
http://www.inive.org/members_area/medias/pdf/Inive%5CIA
QVEC2007%5CTsukada.pdf accessed on 2010.02.11, .
[14] A. Denda, “Shimizu’s Microgrid Research Activities,”
Symposium on Microgrids, Canada, 2006:
http://der.lbl.gov/new_site/2006microgrids_files/Japan/Presen
tation_6_Atsushi_denda.pdf access on 2010.02.11, .
[15] N. Korada and M. K. Mishra, “Grid Adaptive Power
Management Strategy for an Integrated Microgrid With
Hybrid Energy Storage,” IEEE Trans. Ind. Electron., vol. 64,
no. 4, pp. 2884–2892, Apr. 2017.

International Journal on Recent and Innovation Trends in Computing and Communication ISSN: 2321-8169 Volume: 5 Issue: 10 141 – 152
_______________________________________________________________________________________________
152 IJRITCC | October 2017, Available @ http://www.ijritcc.org _______________________________________________________________________________________
[16] K. Shimomachi, R. Hara, H. Kita, M. Noritake, H. Hoshi, and
K. Hirose, “Development of energy management system for
DC microgrid for office building:-Day Ahead operation
scheduling considering weather scenarios-,” in 2014 Power
Systems Computation Conference, 2014, pp. 1–6.
[17] I. Tank and S. Mali, “Renewable based DC microgrid with
energy management system,” in 2015 IEEE International
Conference on Signal Processing, Informatics,
Communication and Energy Systems (SPICES), 2015, pp. 1–
5.
[18] B. Wang, M. Sechilariu, and F. Locment, “Intelligent DC
microgrid with smart grid communications: Control strategy
consideration and design,” in 2013 IEEE Power & Energy
Society General Meeting, 2013, pp. 1–1.
[19] R.K. Chauhan, B.S. Rajpurohit, F.M. Gonzalez-Longstt and
S.N. Singh, “Intelligent Energy Management System for PV-
battery-based Microgrids in future dc homes”, International
Journal of Emerging Electric Power Systems, Vol 17(3),
2016, pp 339-350.
[20] Yu-Kai Chen, Yung-Chun Wu, Chau-Chung Song, Yu-Syun
Chen, “Design and implementation of Energy Management
System with fuzy conrol for dc Microgrid system”, IEEE
Transactions on Power Electronics, Vol 28(4), 2013, pp 1563-
1570.
[21] Eun-Kyu Lee, W. Shi, R. Gadh and W. Kim, “Design and
implementation of a Microgird Energy Management System”,
Sustainability. Vol 8, 2016, pp 1-19.
[22] O. Tremblay, “Experimental Validation of a Battery Dynamic
Model for EV Applications,” World Electr. Veh. J., vol. 3,
2009.
[23] O. Tremblay, L.-A. Dessaint, and A.-I. Dekkiche, “A generic
battery model for the dynamic simulation of hybrid electric
vehicles,” in Proceedings IEEE Vehicle Power and Propulsion
Conference, VPPC 2007. Sep. 2007, pp. 284–289.
[24] T. A. Nguyen and M. L. Crow, “Stochastic Optimization of
Renewable-Based Microgrid Operation Incorporating Battery
Operating Cost,” IEEE Trans. Power Syst., vol. 31, no. 3, pp.
2289–2296, May 2016.
[25] Tony Markel and Andrew Simpson, “Plug-in Hybrid Electric
Vehicle Energy Storage System Design,” presented at the
Advanced Automotive Battery Conference, Baltimore,
Maryland, 19-May-2006.