november 6, 2009
DESCRIPTION
CCIM. November 6, 2009. Dr. Loren C. Scott Loren C. Scott & Associates, Inc. www.lorencscottassociates.com. The National Economy. Recession (NOT Depression) Environment. RGDP Forecasts(10/09). Quarter Moody’s Consensus 08-I -0.7 -0.7 08-II 1.5% 1.5% - PowerPoint PPT PresentationTRANSCRIPT

November 6, 2009
Dr. Loren C. ScottLoren C. Scott & Associates, Inc.www.lorencscottassociates.com

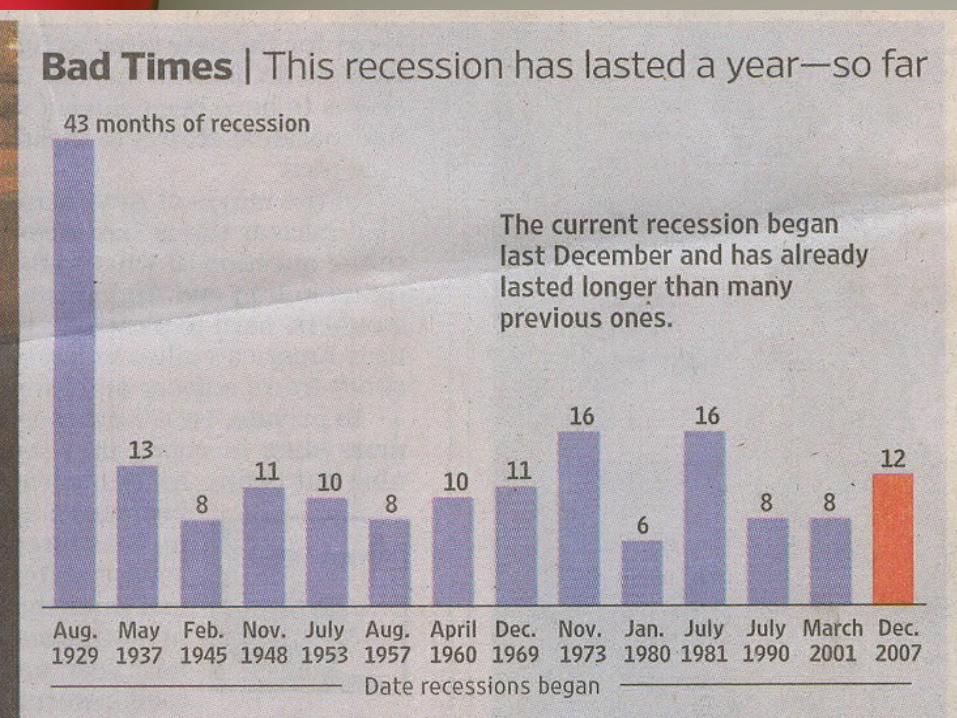
The National Economy
Recession (NOT Depression) Environment

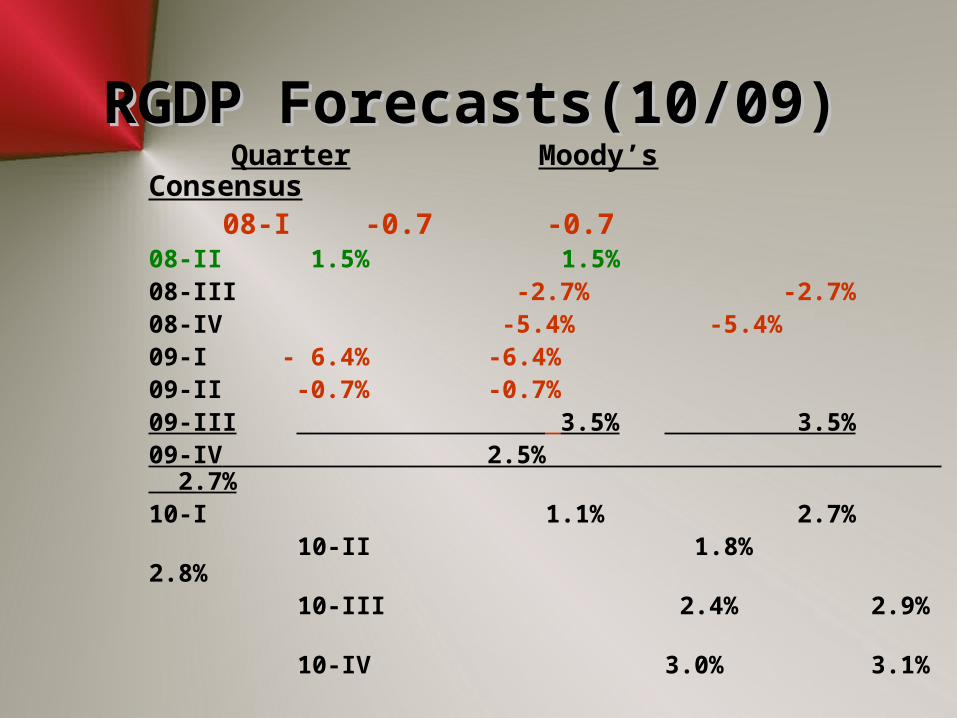
RGDP Forecasts(10/09)RGDP Forecasts(10/09) Quarter Moody’s Consensus
08-I -0.7 -0.708-II 1.5% 1.5%08-III -2.7% -2.7% 08-IV -5.4% -5.4%09-I - 6.4% -6.4%09-II -0.7% -0.7%09-III 3.5% 3.5%09-IV 2.5% 2.7%10-I 1.1% 2.7%
10-II 1.8% 2.8% 10-III 2.4% 2.9% 10-IV 3.0% 3.1%
RGDP Forecasts(10/09)RGDP Forecasts(10/09) Quarter Moody’s Consensus
08-I -0.7 -0.708-II 1.5% 1.5%08-III -2.7% -2.7% 08-IV -5.4% -5.4%09-I - 6.4% -6.4%09-II -0.7% -0.7%09-III 3.5% 3.5%09-IV 2.5% 2.7%10-I 1.1% 2.7%
10-II 1.8% 2.8% 10-III 2.4% 2.9% 10-IV 3.0% 3.1%
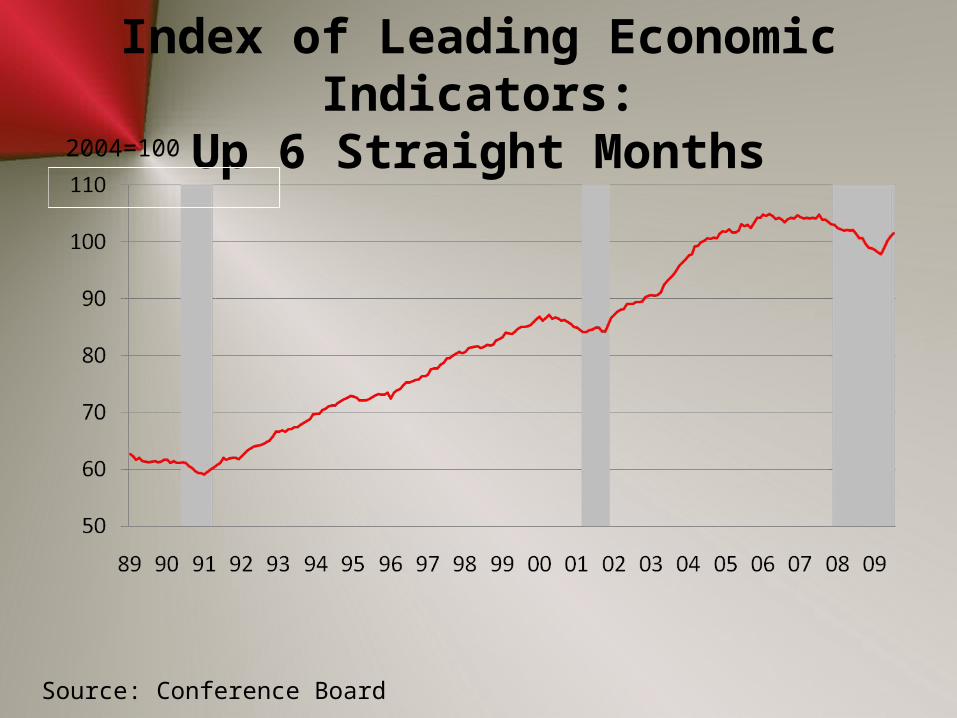
Index of Leading Economic Indicators:Up 6 Straight Months
Source: Conference Board
2004=100
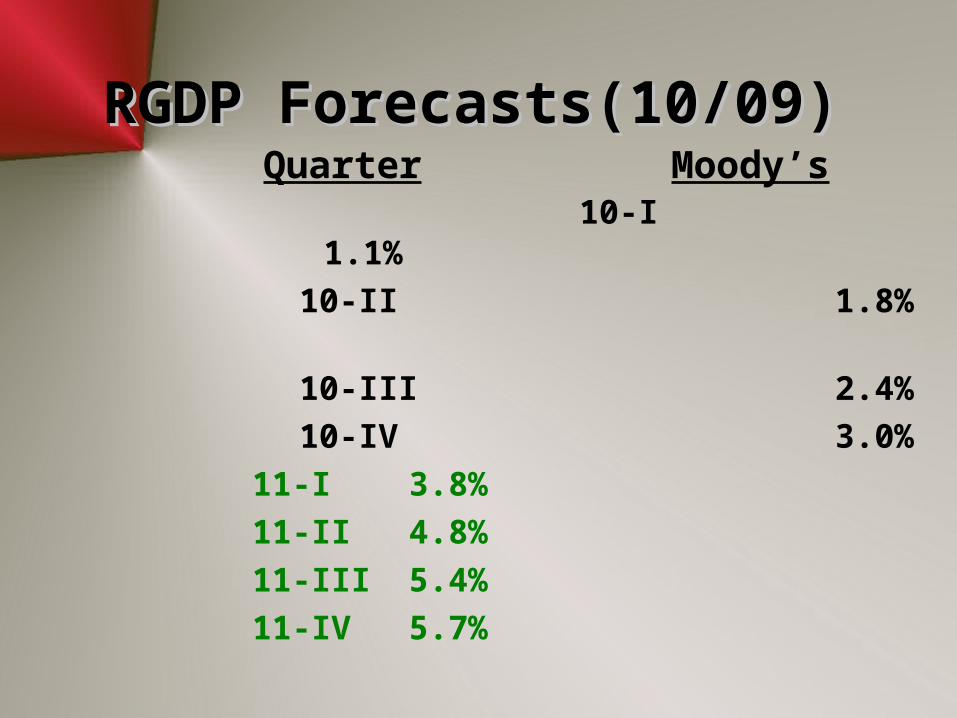
RGDP Forecasts(10/09)RGDP Forecasts(10/09) Quarter Moody’s
10-I 1.1%
10-II 1.8%
10-III 2.4%
10-IV 3.0%
11-I 3.8%
11-II 4.8%
11-III 5.4%
11-IV 5.7%
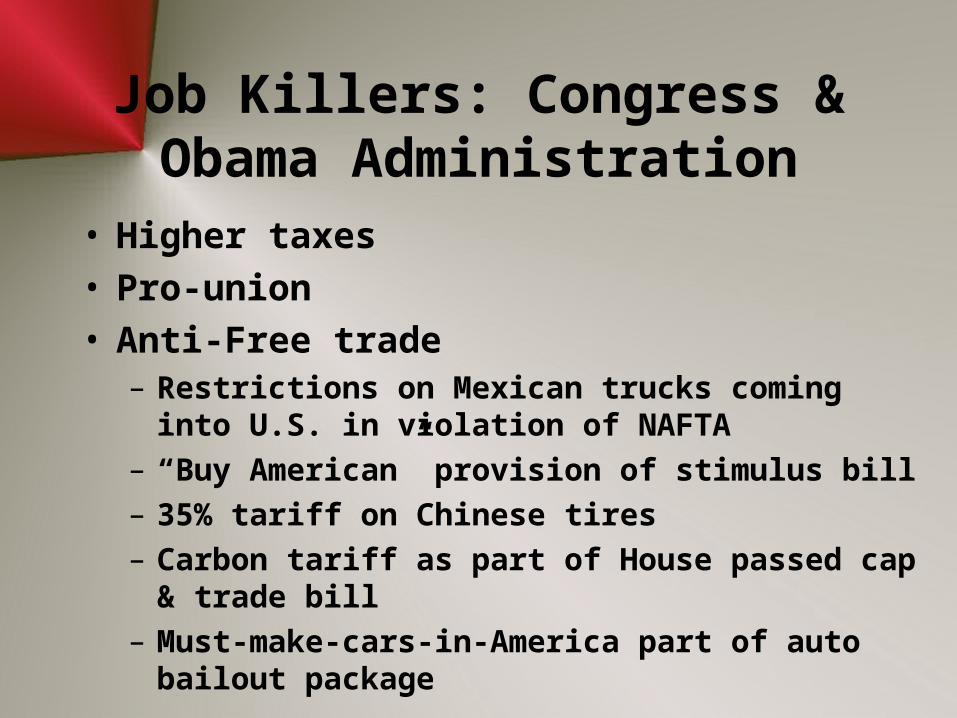
Job Killers: Congress & Obama Administration
• Higher taxes• Pro-union• Anti-Free trade
– Restrictions on Mexican trucks coming into U.S. in violation of NAFTA
– “Buy American” provision of stimulus bill
– 35% tariff on Chinese tires
– Carbon tariff as part of House passed cap & trade bill
– Must-make-cars-in-America part of auto bailout package

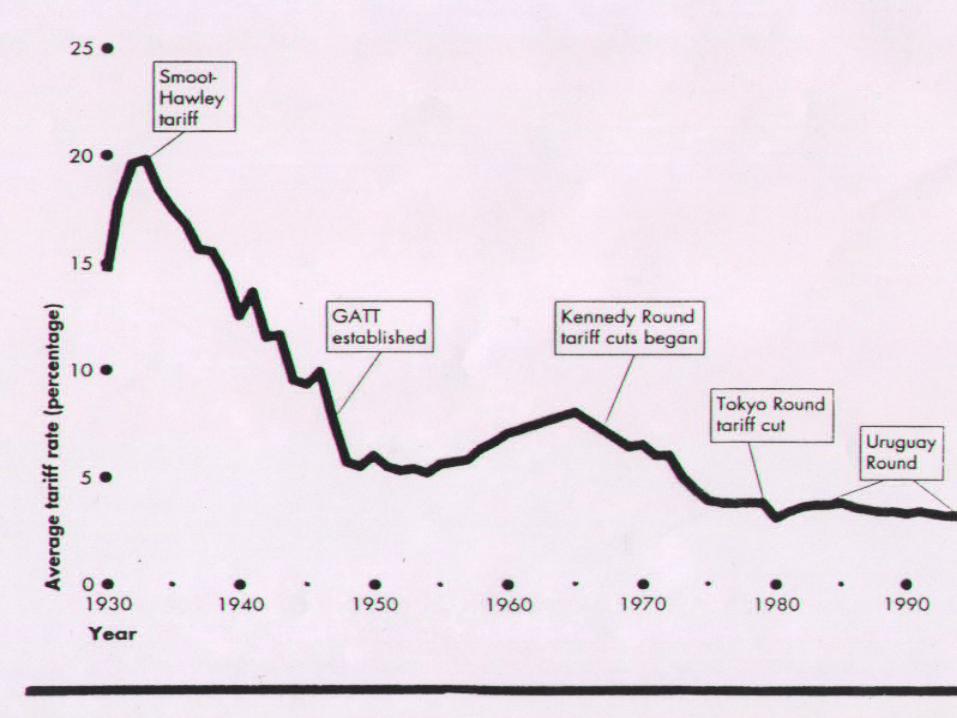
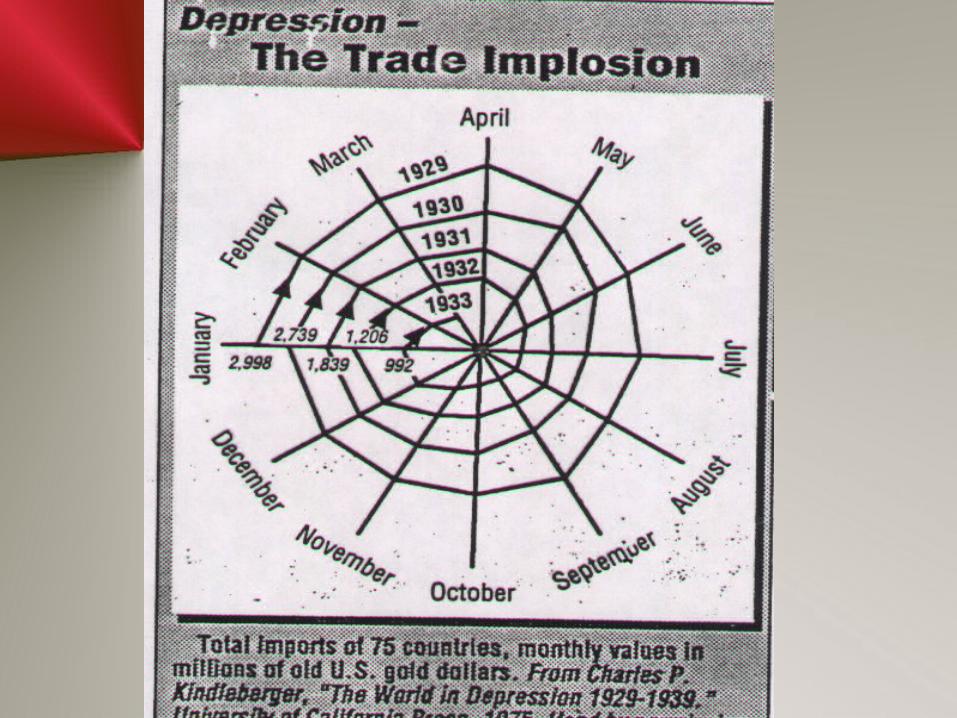
Add tariffs: Guess what always happens?
Retaliation!

Job Killers:Congress & Obama
Administration
• Higher taxes
• Pro-union
• Anti-Free trade
• Extreme pro-green
• More regulation
• Government-run health care

Wait Times? What Will America Tolerate?
AVERAGE WAIT TIMES: U.S. versus Canada
Type of Appointment
U.S. Wait Times Canada Wait
Times (requires referral)
Cardiologist 15.5 Days 51.1 Days
Orthopedic Surgeon
16.8 Days 256.9 Days
Family Practice Visit
20.5 Days 31.7 Days
Dermatology 22.1 Days 121.1 Days
OB-GYN 27.5 Days 112.7 Days
NOTE:
English National Health Service
(NHS) and Department of
Health (DH) have set TARGETED
WAIT TIMES of 18 weeks (126 days) for all specialist
appointments and hospital
treatments.
As of 1/1/2009, they were well
short of this goal.


Four NBER Indicators
-800
-400
0
400
800
1200
1980 1985 1990 1995 2000 2005
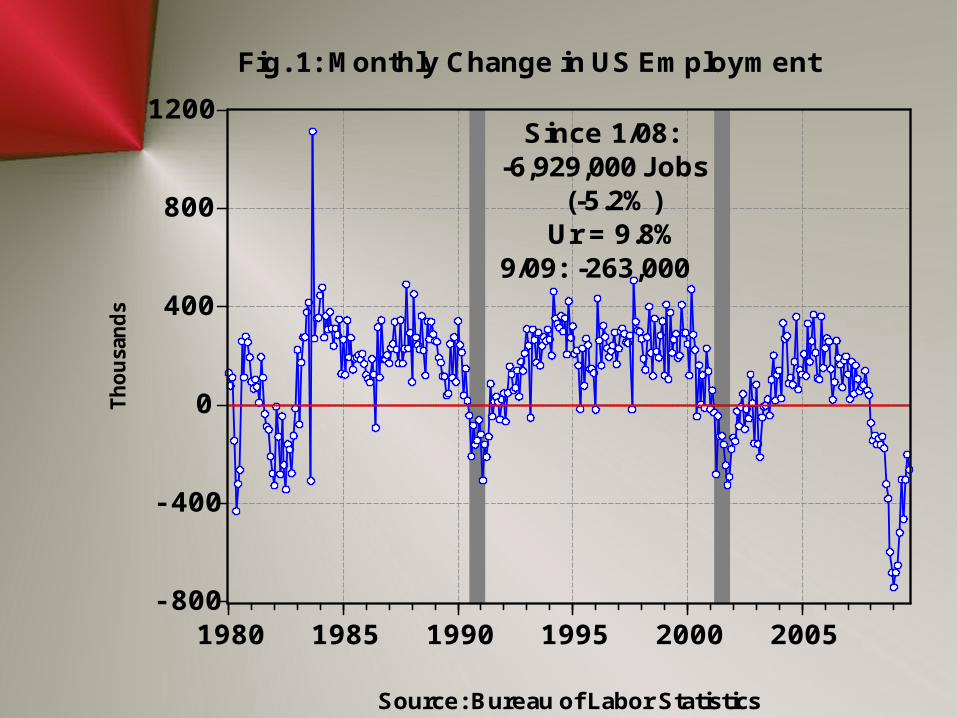
Fig. 1: Monthly Change in US Employment
Source: Bureau of Labor Statistics
Since 1/08:-6,929,000 Jobs (-5.2%) Ur = 9.8%9/09: -263,000
Th
ou
san
ds

50
60
70
80
90
100
110
120
1980 1985 1990 1995 2000 2005
U.S. Industrial Production Index20
02=
100
Up last 3 months
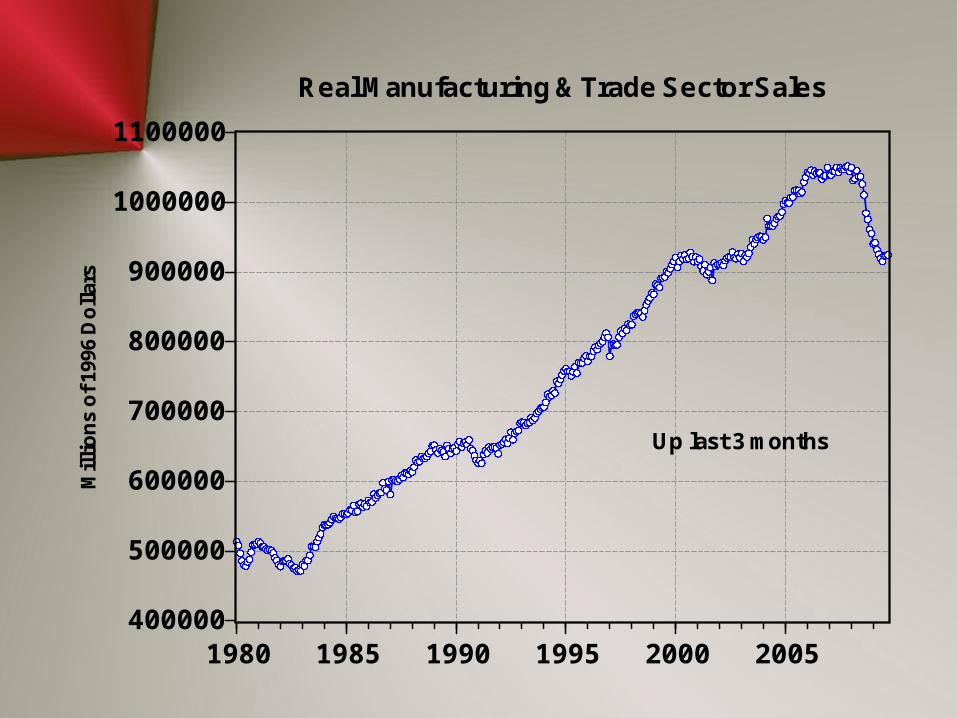
400000
500000
600000
700000
800000
900000
1000000
1100000
1980 1985 1990 1995 2000 2005
Real Manufacturing & Trade Sector SalesM
illi
on
s o
f 199
6 D
oll
ars
Up last 3 months

4000
5000
6000
7000
8000
9000
10000
1980 1985 1990 1995 2000 2005
Fig. 5: Real Personal Income Minus Transfer PaymentsB
illi
on
s o
f 20
00 D
oll
ars
Up 2 of last 3 months

Another Big Problem
The credit crunch
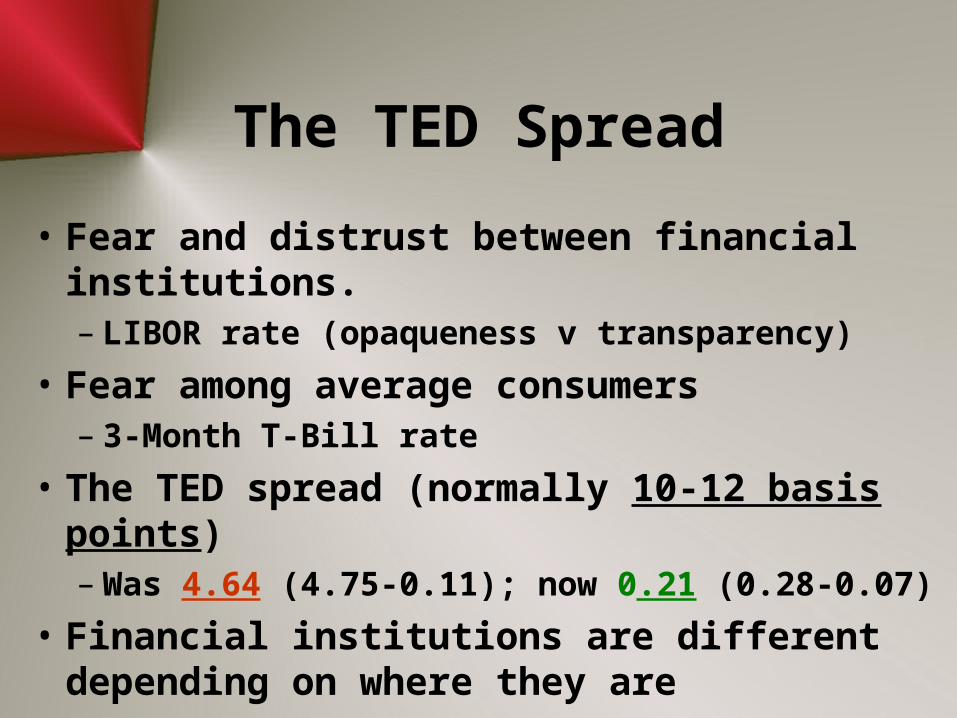
The TED Spread
• Fear and distrust between financial institutions.– LIBOR rate (opaqueness v transparency)
• Fear among average consumers– 3-Month T-Bill rate
• The TED spread (normally 10-12 basis points)– Was 4.64 (4.75-0.11); now 0.21 (0.28-0.07)
• Financial institutions are different depending on where they are

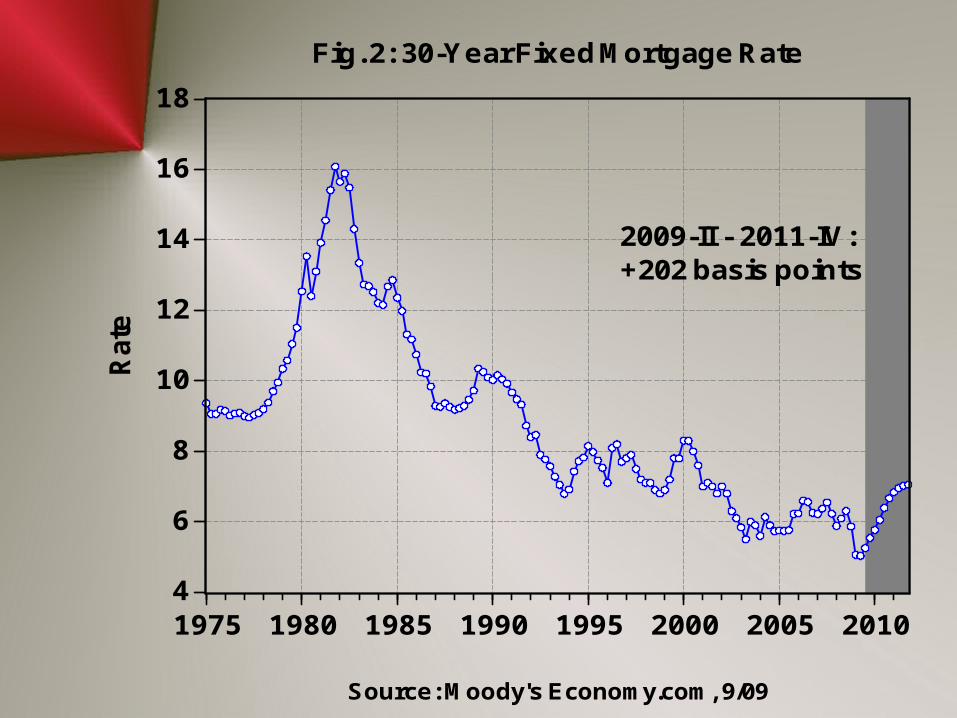
Interest Rates Still Favorable
4
6
8
10
12
14
16
18
1975 1980 1985 1990 1995 2000 2005 2010
Fig. 2: 30-Year Fixed Mortgage Rate
2009-II - 2011-IV:+202 basis points
Source: Moody's Economy.com, 9/09
Rate

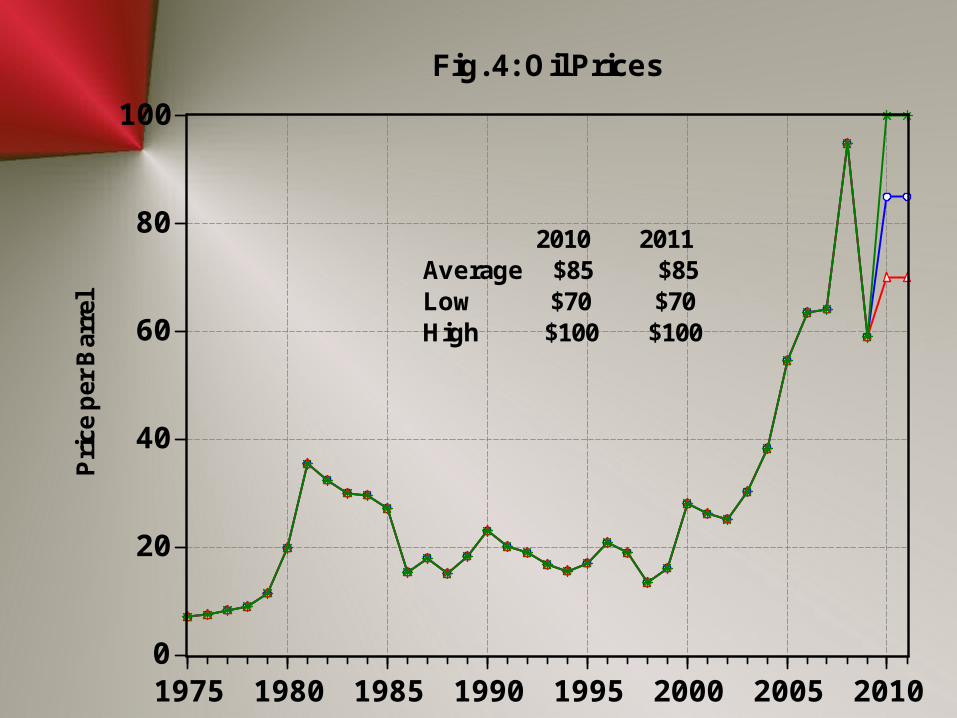
Oil Price Forecasts
The “Onagistic” Approach
0
20
40
60
80
100
1975 1980 1985 1990 1995 2000 2005 2010
Fig. 4: Oil PricesP
rice
per
Bar
rel
2010 2011Average $85 $85Low $70 $70High $100 $100
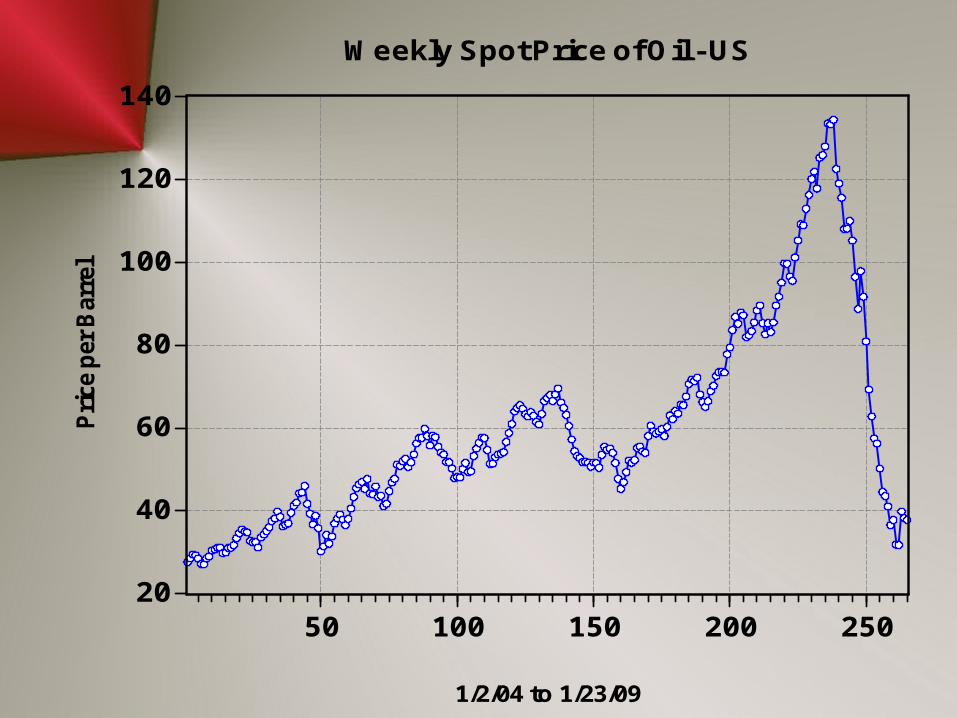
20
40
60
80
100
120
140
50 100 150 200 250
Pri
ce p
er B
arre
l
1/2/04 to 1/23/09
Weekly Spot Price of Oil - US
0
2
4
6
8
10
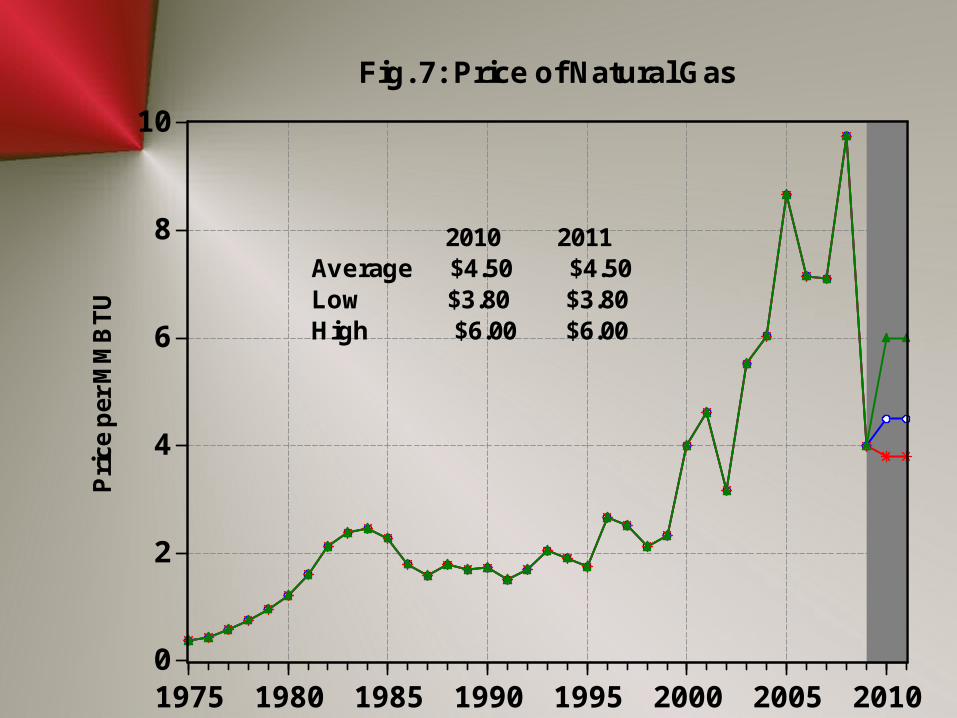
1975 1980 1985 1990 1995 2000 2005 2010
Fig. 7: Price of Natural GasP
rice
per
MM
BT
U
2010 2011Average $4.50 $4.50Low $3.80 $3.80High $6.00 $6.00
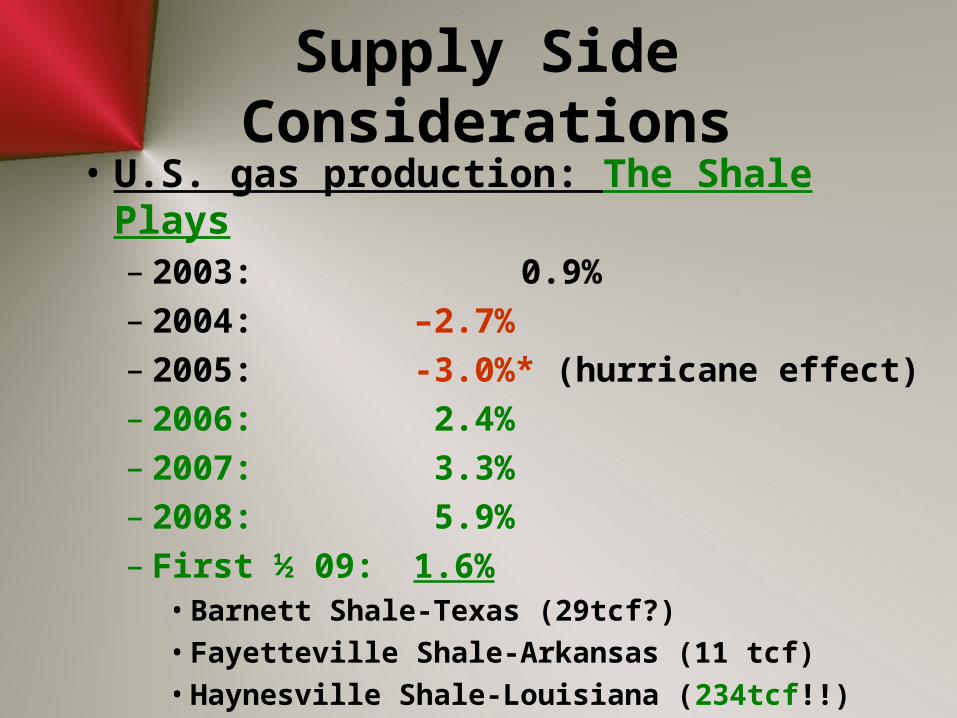
Supply Side Considerations
• U.S. gas production: The Shale Plays– 2003: 0.9%– 2004: –2.7%– 2005: -3.0%* (hurricane effect)– 2006: 2.4%– 2007: 3.3%– 2008: 5.9%– First ½ 09: 1.6%
• Barnett Shale-Texas (29tcf?)
• Fayetteville Shale-Arkansas (11 tcf)
• Haynesville Shale-Louisiana (234tcf!!)
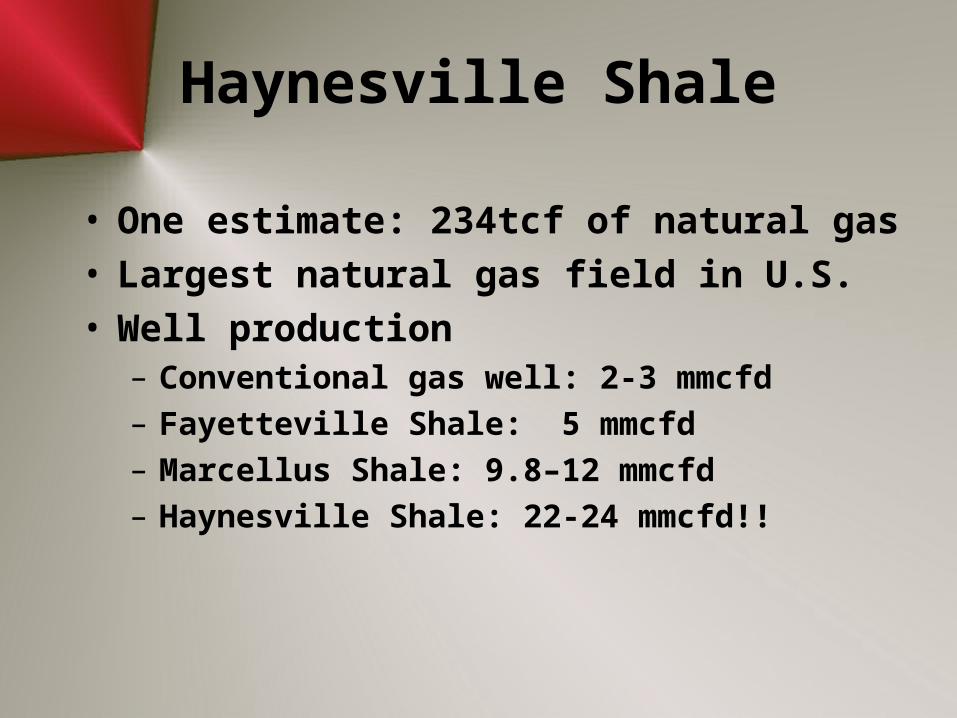
Haynesville Shale
• One estimate: 234tcf of natural gas• Largest natural gas field in U.S.• Well production
– Conventional gas well: 2-3 mmcfd
– Fayetteville Shale: 5 mmcfd
– Marcellus Shale: 9.8–12 mmcfd
– Haynesville Shale: 22-24 mmcfd!!
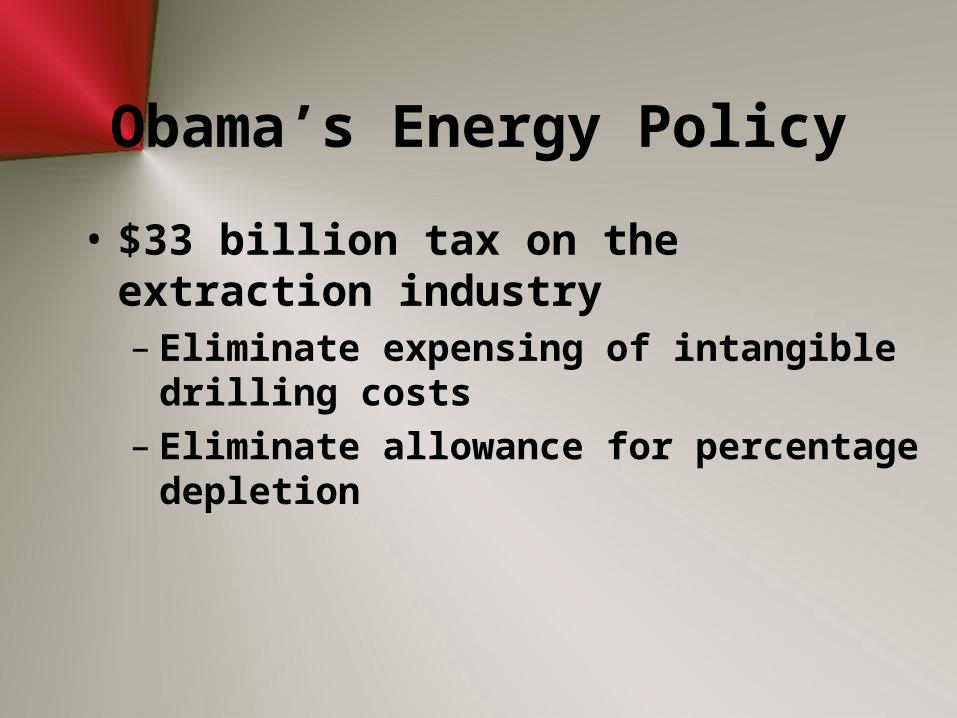
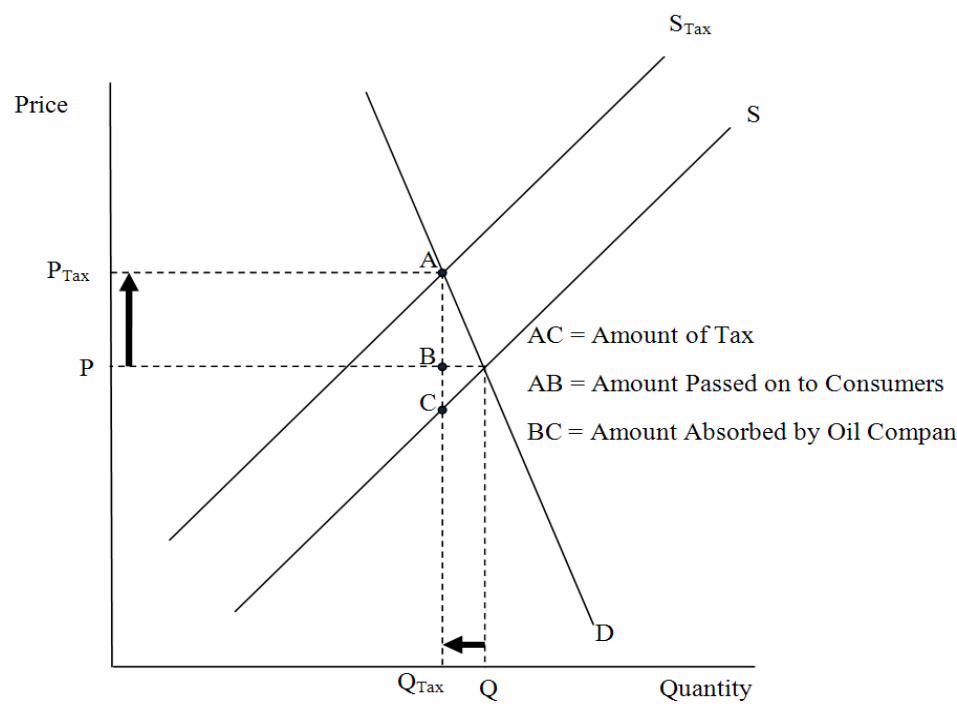
Obama’s Energy Policy
• $33 billion tax on the extraction industry– Eliminate expensing of intangible drilling costs– Eliminate allowance for percentage depletion

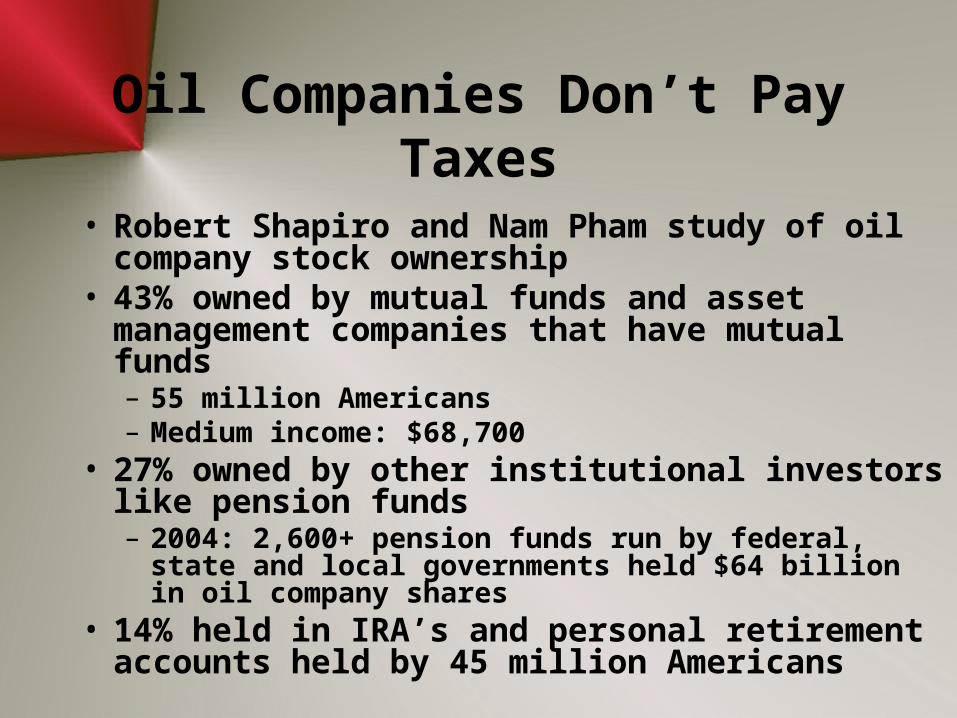
Oil Companies Don’t Pay Taxes
• Robert Shapiro and Nam Pham study of oil company stock ownership
• 43% owned by mutual funds and asset management companies that have mutual funds– 55 million Americans– Medium income: $68,700
• 27% owned by other institutional investors like pension funds– 2004: 2,600+ pension funds run by federal, state and local
governments held $64 billion in oil company shares• 14% held in IRA’s and personal retirement
accounts held by 45 million Americans
120
130
140
150
160
170
180
190
200
5 10 15 20 25 30 35 40 45 50
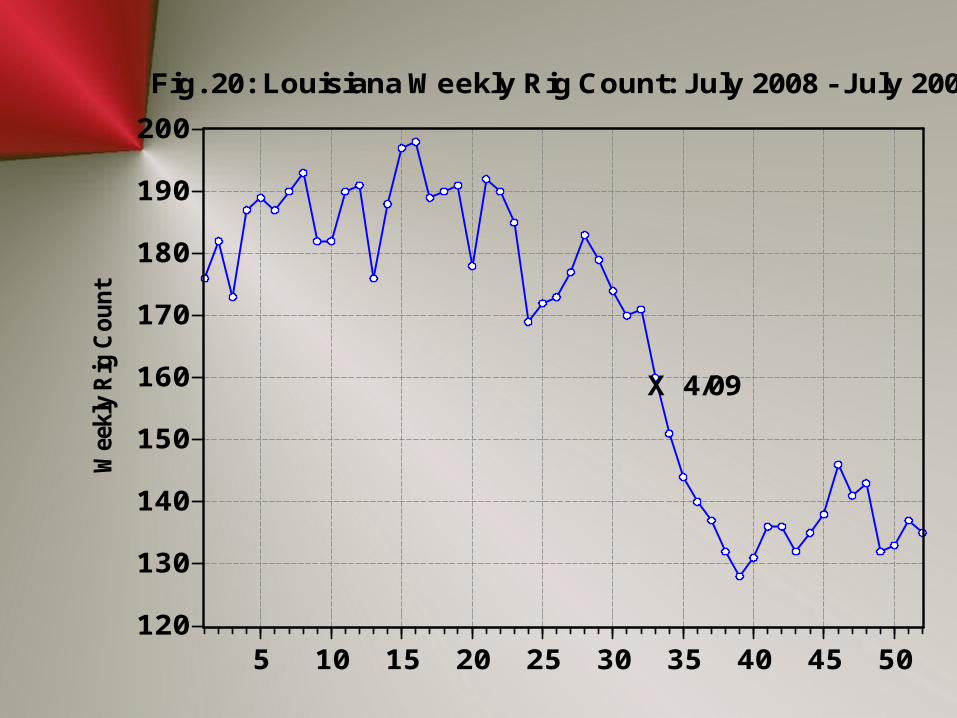
X 4/09
Fig. 20: Louisiana Weekly Rig Count: July 2008 - July 2009W
eekl
y R
ig C
ount
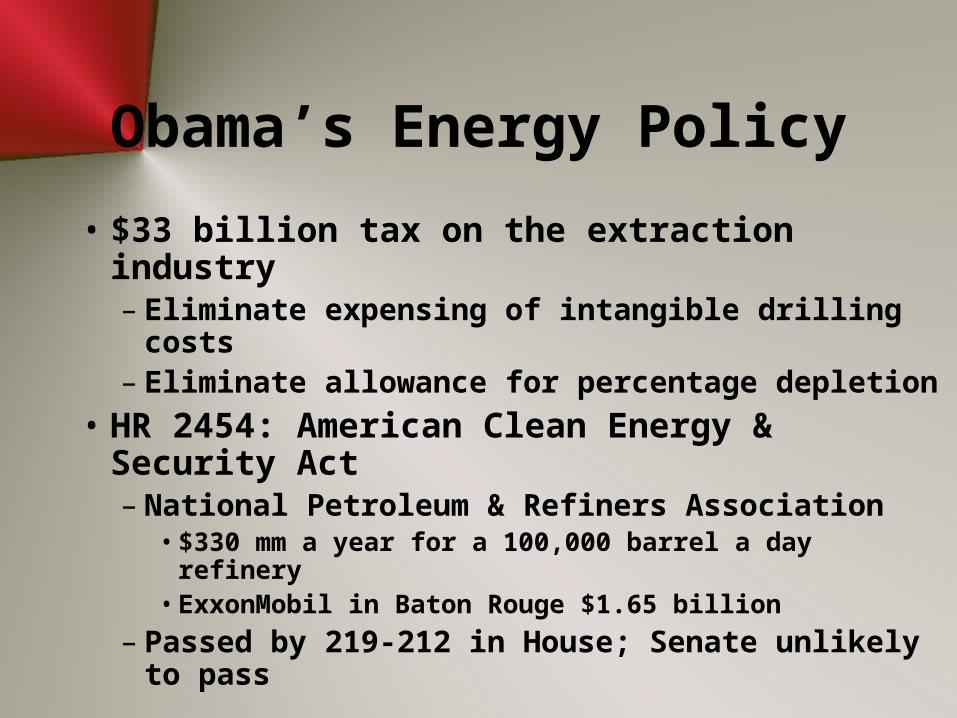
Obama’s Energy Policy
• $33 billion tax on the extraction industry– Eliminate expensing of intangible drilling costs– Eliminate allowance for percentage depletion
• HR 2454: American Clean Energy & Security Act– National Petroleum & Refiners Association
• $330 mm a year for a 100,000 barrel a day refinery• ExxonMobil in Baton Rouge $1.65 billion
– Passed by 219-212 in House; Senate unlikely to pass

New Orleans
460
480
500
520
540
560
580
600
620
1980 1985 1990 1995 2000 2005 2010
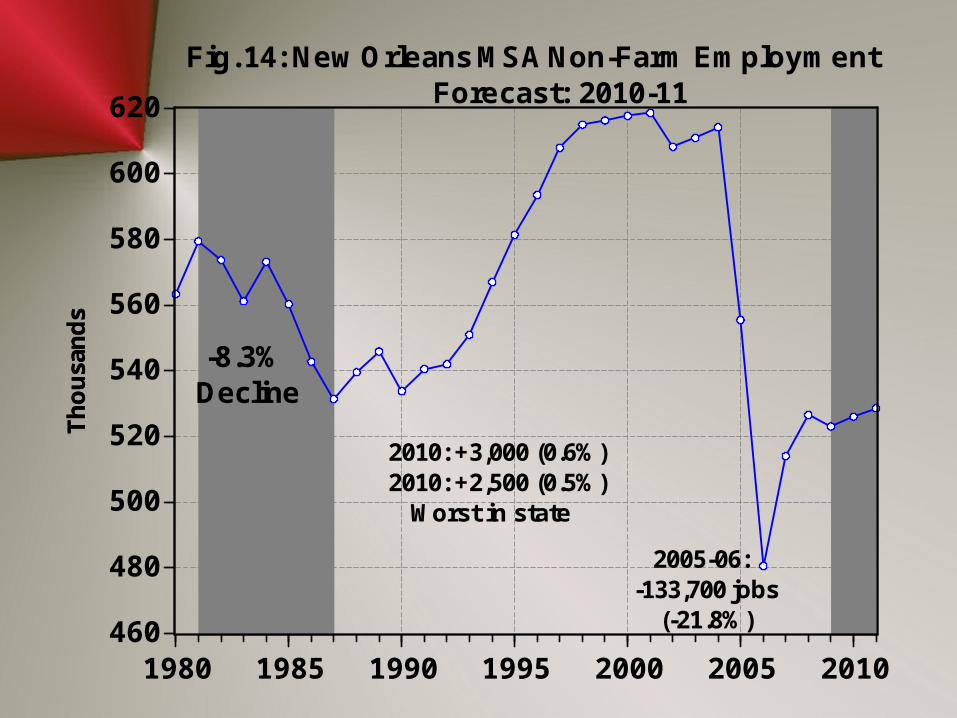
Fig. 14: New Orleans MSA Non-Farm Employment Forecast: 2010-11
Th
ou
san
ds
Th
ou
san
ds
-8.3%Decline
2005-06:-133,700 jobs (-21.8%)
2010: +3,000 (0.6%) 2010: +2,500 (0.5%) Worst in state
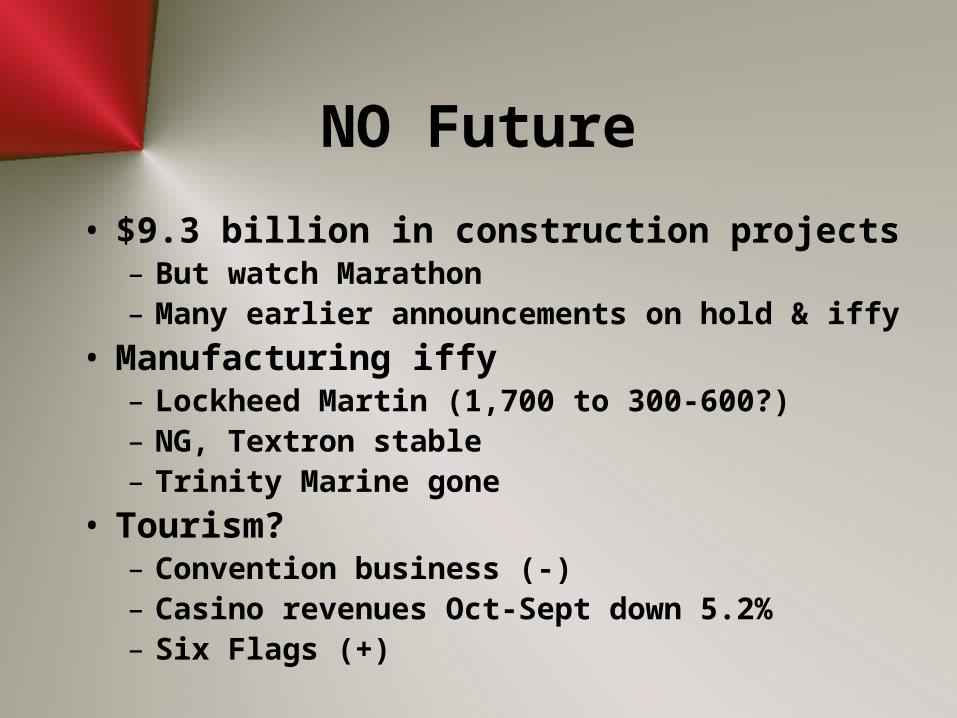
NO Future
• $9.3 billion in construction projects– But watch Marathon– Many earlier announcements on hold & iffy
• Manufacturing iffy– Lockheed Martin (1,700 to 300-600?)– NG, Textron stable– Trinity Marine gone
• Tourism?– Convention business (-)– Casino revenues Oct-Sept down 5.2%– Six Flags (+)
200
240
280
320
360
400
1980 1985 1990 1995 2000 2005 2010
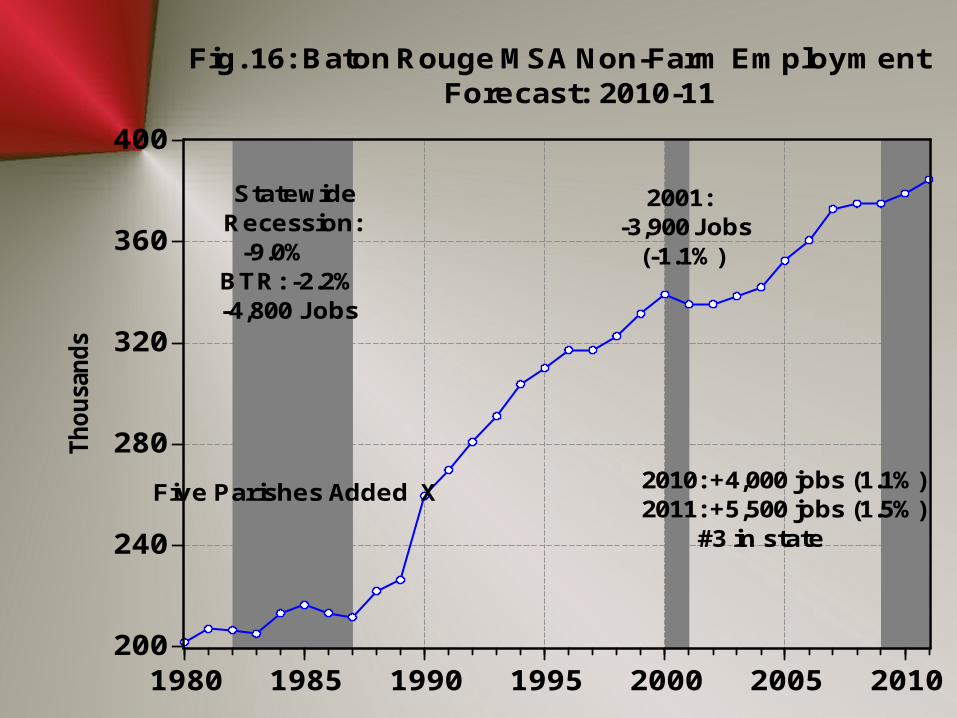
Fig. 16: Baton Rouge MSA Non-Farm Employment Forecast: 2010-11
Statewide Recession: -9.0%BTR: -2.2%-4,800 Jobs
2001:-3,900 Jobs (-1.1%)
Five Parishes Added X
Thousa
nds
2010: +4,000 jobs (1.1%)2011: +5,500 jobs (1.5%) #3 in state
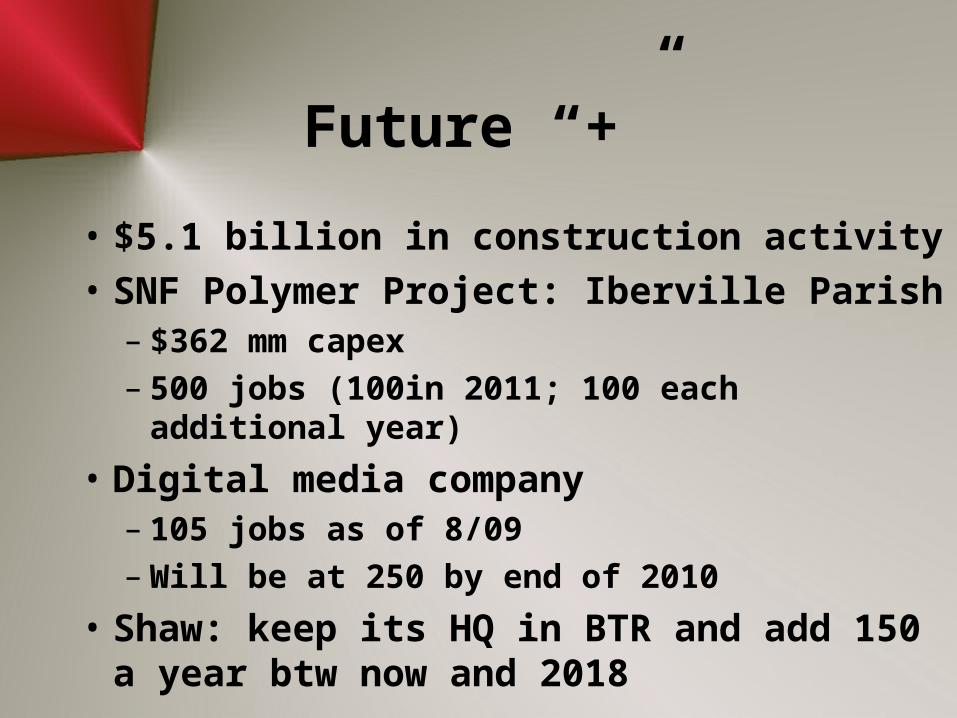
Future “+”
• $5.1 billion in construction activity
• SNF Polymer Project: Iberville Parish– $362 mm capex– 500 jobs (100in 2011; 100 each additional year)
• Digital media company– 105 jobs as of 8/09– Will be at 250 by end of 2010
• Shaw: keep its HQ in BTR and add 150 a year btw now and 2018
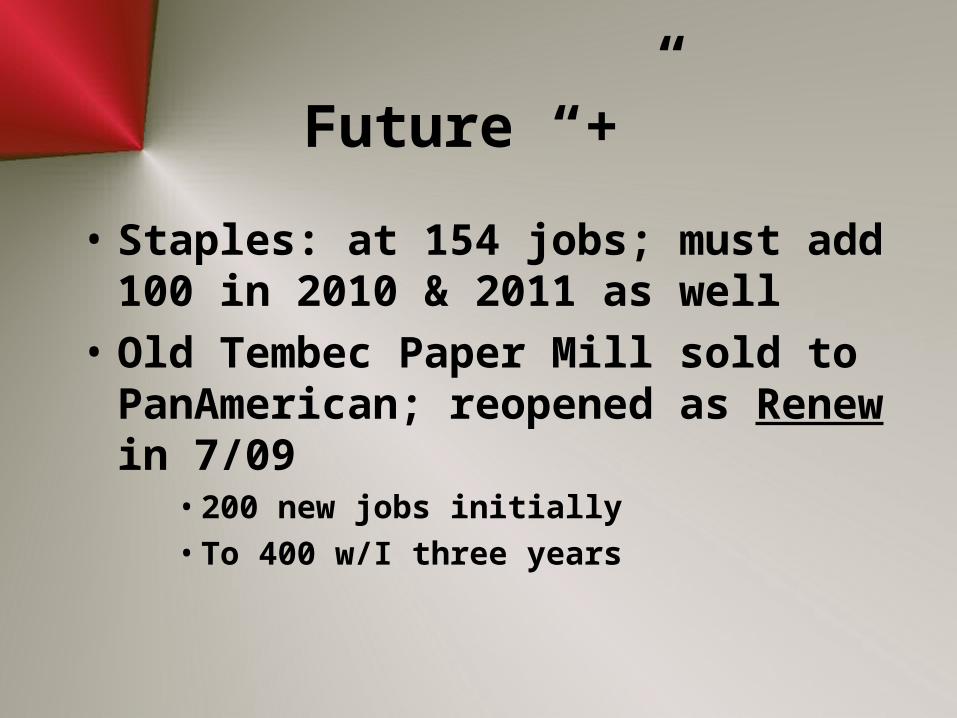
Future “+”
• Staples: at 154 jobs; must add 100 in 2010 & 2011 as well
• Old Tembec Paper Mill sold to PanAmerican; reopened as Renew in 7/09
• 200 new jobs initially
• To 400 w/I three years
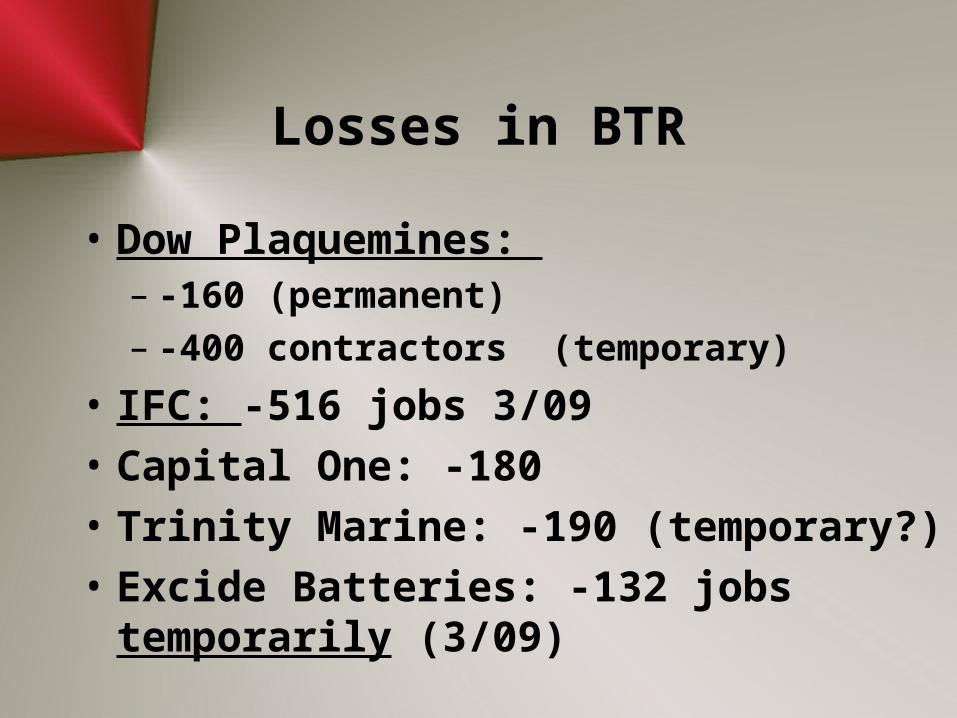
Losses in BTR
• Dow Plaquemines: – -160 (permanent)– -400 contractors (temporary)
• IFC: -516 jobs 3/09
• Capital One: -180
• Trinity Marine: -190 (temporary?)
• Excide Batteries: -132 jobs temporarily (3/09)

Concerns
• State government?
• Chemicals/Refineries?– Cap & Trade?
90
100
110
120
130
140
150
160
1980 1985 1990 1995 2000 2005 2010
Th
ou
san
ds
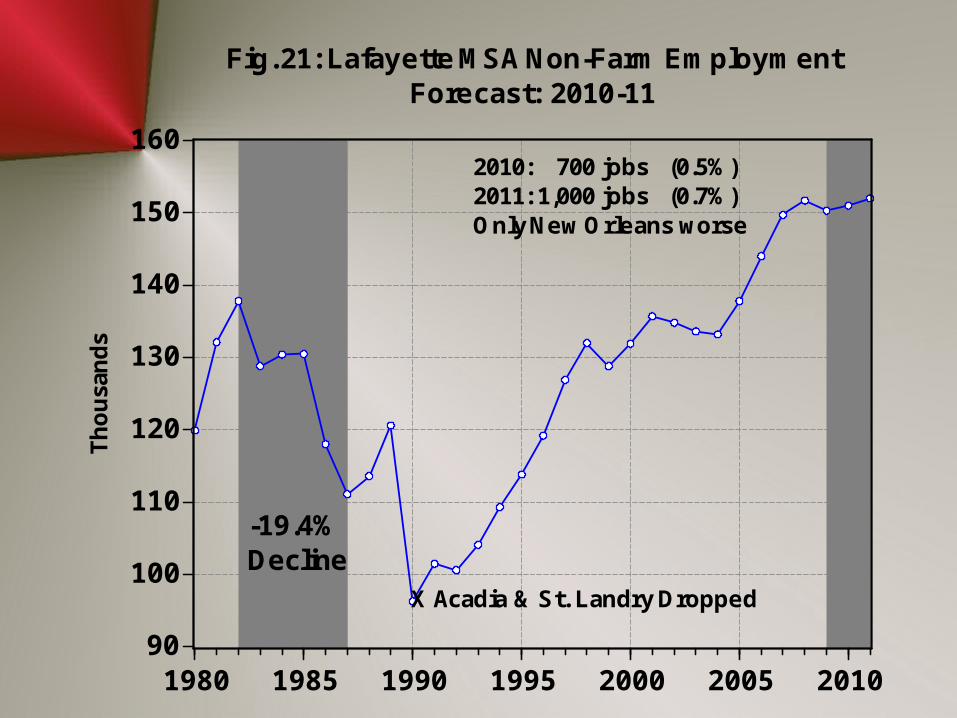
Fig. 21: Lafayette MSA Non-Farm Employment Forecast: 2010-11
-19.4%Decline
X Acadia & St. Landry Dropped
2010: 700 jobs (0.5%)2011: 1,000 jobs (0.7%)Only New Orleans worse

Lafayette Future
• Lethargic Extraction big problem• $474.2 million in construction
– Much done in 2010• Stuller adding 100• Acadian Ambulance adding 25• TransComm: +700• Flight Safety International:
– $120 mm, 70,000sq ft flight simulator facility (about finished)
– 50-60 jobs @ $60,000• TETRA creating 140 new jobs @$35k: start 11/09
50
60
70
80
90
100
1980 1985 1990 1995 2000 2005 2010
Th
ou
san
ds
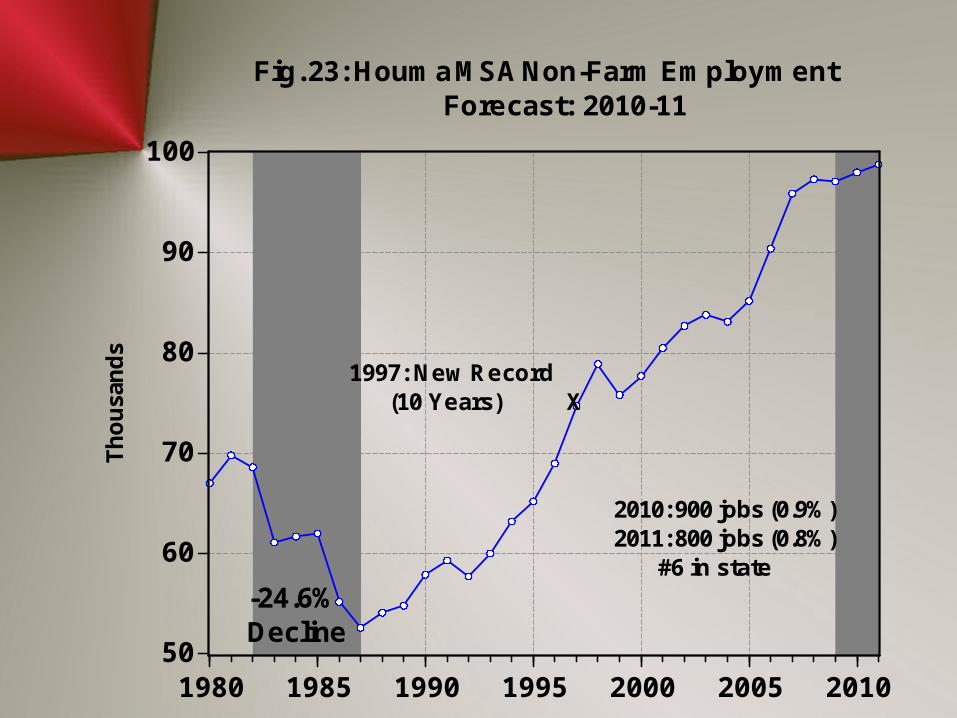
Fig. 23: Houma MSA Non-Farm Employment Forecast: 2010-11
-24.6%Decline
1997: New Record (10 Years) X
2010: 900 jobs (0.9%)2011: 800 jobs (0.8%) #6 in state

Houma Future
• Lethargic extraction sector• Shipbuilding a plus
– Edison Chouest: at least +1,000– Bollinger: stable
• Fabricators: If hit on contracts– Gulf Island: +350– J. Ray McDermott: +250
• $184.6 million in road & coastal restoration
Good News for Houma
• Performance Energy– $26 mm investment at Port of Terrebonne– Start 09-III; complete mid 2010– 350 new jobs; retain existing 800 jobs
• Fourchon: $14 mm bulkhead completed by fall 09 to attract new companies– Expert Risers adding firm there– CalDive new facility there– Building another 1100’, already full of committed
companies.– New $11 mm helicopter facility at South Lafourche
Airport.
50
60
70
80
90
100
1980 1985 1990 1995 2000 2005 2010
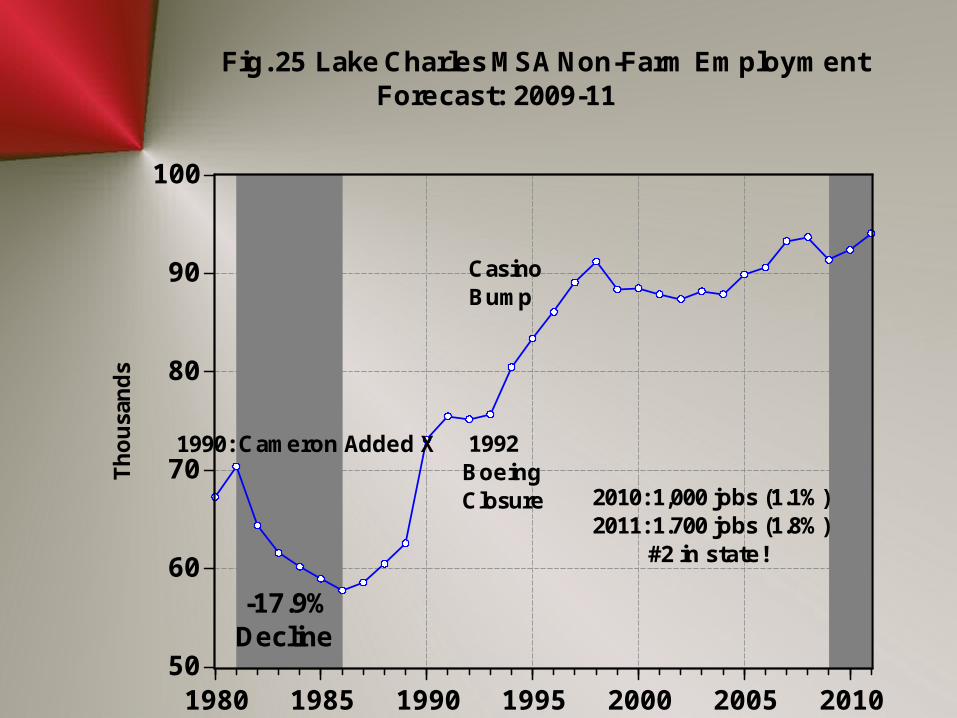
Fig. 25 Lake Charles MSA Non-Farm Employment Forecast: 2009-11
Th
ou
san
ds
-17.9%Decline
1992BoeingClosure
CasinoBump
1990: Cameron Added X
2010: 1,000 jobs (1.1%)2011: 1.700 jobs (1.8%) #2 in state!
Lake Charles Future
• Sugarcane Bay Casino (1,600-1,800)– (Casino revenue Oct-Sept up 6.3%)
• Global Modular Solutions (+1,400)• Aeroframe (+250)• NG: some additions?• $350 mm a year in maintenance at petrochem
plants• $108.7 mm highways & coastal restoration• Leucedia? $1.8 billion• But cap & trade???
50
55
60
65
70
75
80
85
1980 1985 1990 1995 2000 2005 2010
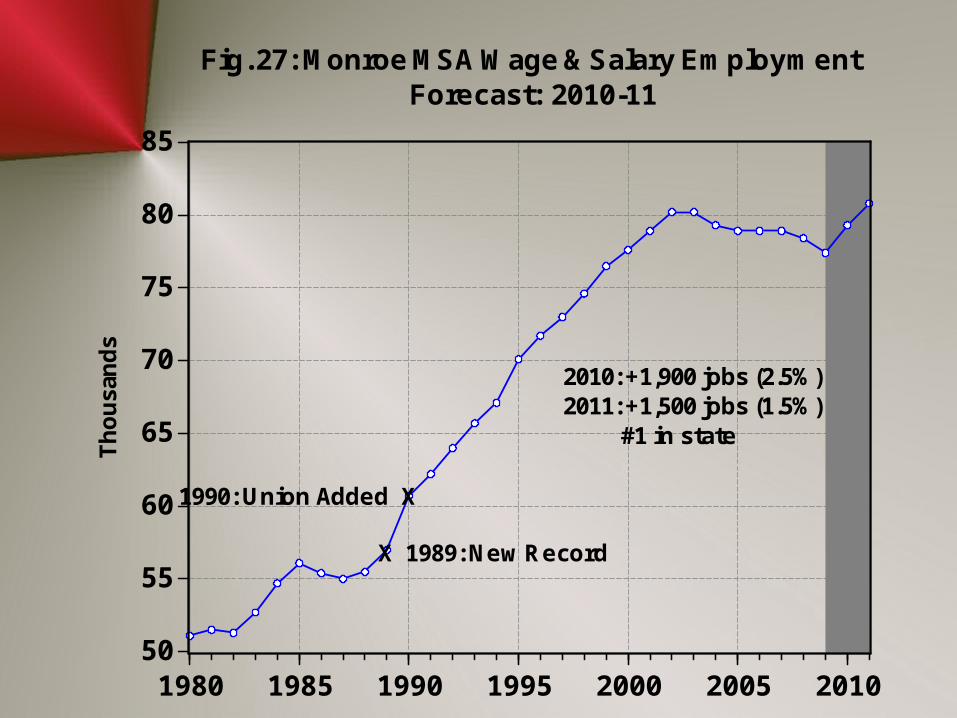
Fig. 27: Monroe MSA Wage & Salary Employment Forecast: 2010-11
Th
ou
san
ds
X 1989: New Record
1990: Union Added X
2010: +1,900 jobs (2.5%)2011: +1,500 jobs (1.5%) #1 in state
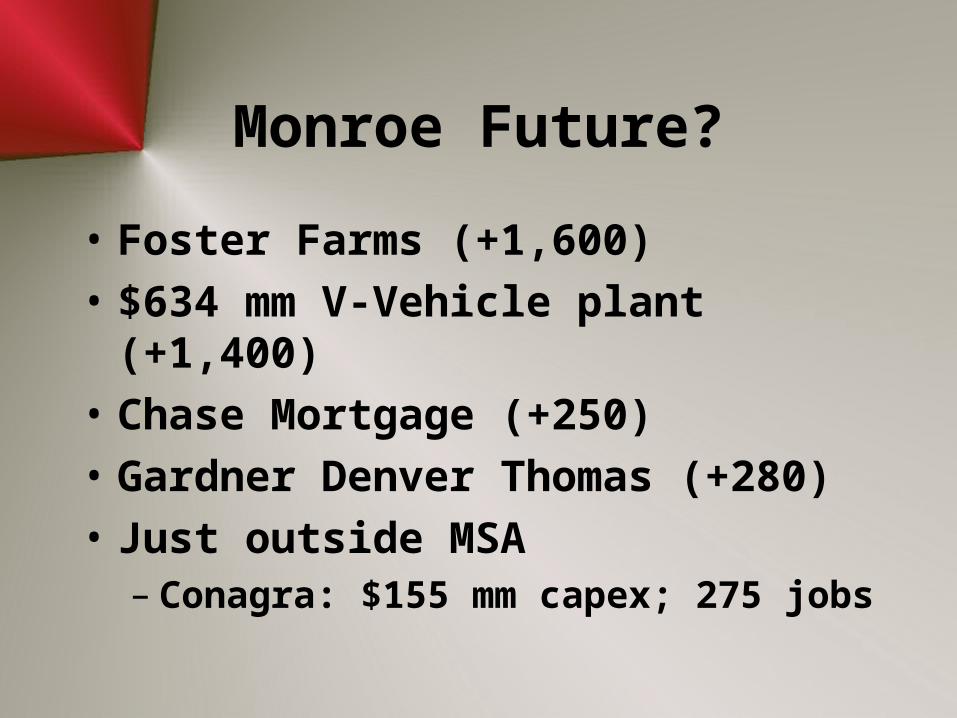
Monroe Future?
• Foster Farms (+1,600)
• $634 mm V-Vehicle plant (+1,400)
• Chase Mortgage (+250)
• Gardner Denver Thomas (+280)
• Just outside MSA– Conagra: $155 mm capex; 275 jobs
40
45
50
55
60
65
70
1980 1985 1990 1995 2000 2005 2010
Th
ou
san
ds
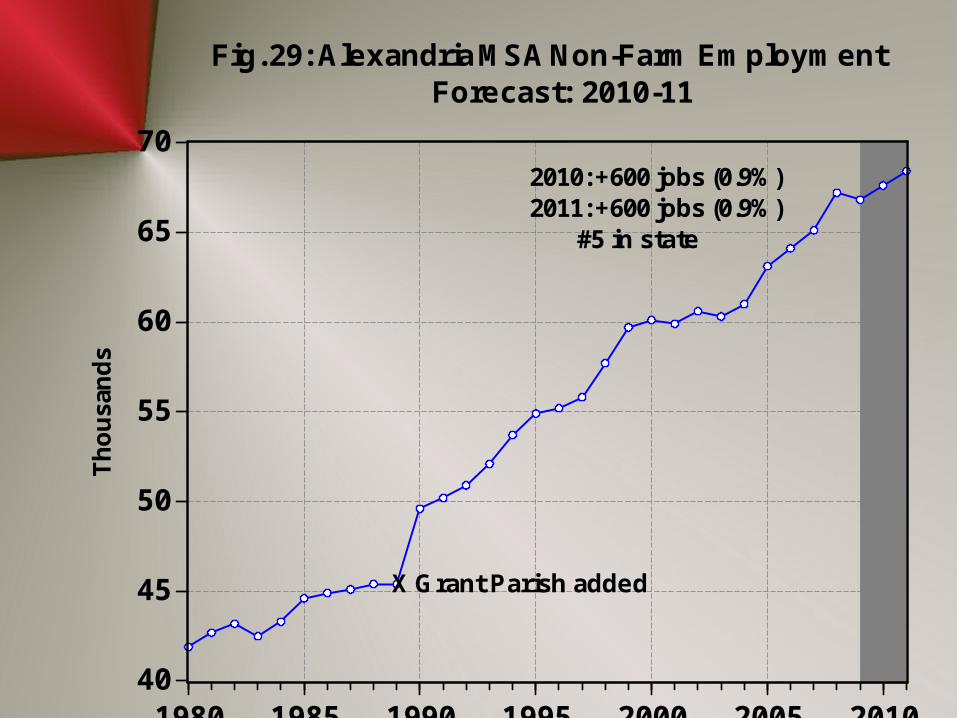
Fig. 29: Alexandria MSA Non-Farm Employment Forecast: 2010-11
X Grant Parish added
2010: +600 jobs (0.9%)2011: +600 jobs (0.9%) #5 in state
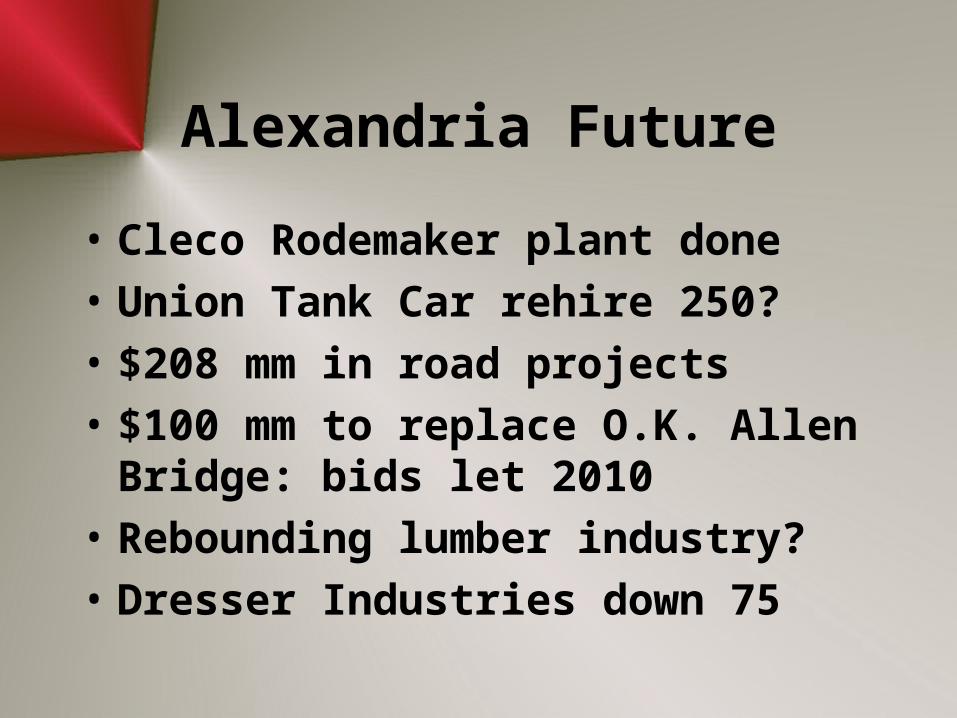
Alexandria Future
• Cleco Rodemaker plant done
• Union Tank Car rehire 250?
• $208 mm in road projects
• $100 mm to replace O.K. Allen Bridge: bids let 2010
• Rebounding lumber industry?
• Dresser Industries down 75

1400
1500
1600
1700
1800
1900
2000
1980 1985 1990 1995 2000 2005 2010
Fig. 31: Louisiana Non-Farm Employment: 2010-11T
ho
usa
nd
s
2009: -11,000 jobs (-0.6%)
2010: +17,800 Jobs (0.9%)2011: +18,000 Jobs (0.9%)

The Clash of Ideas

Karl Marx
• “From each according to his abilities, to each according to his needs”
• “The theory of Communism may be summed up in one sentence: Abolish all private property.”

Adam Smith
• “Competition alone can regulate prices with equity; it alone restricts them to a moderation which varies little; it alone attracts with certainty provisions where they are wanted or labour where it is required.”
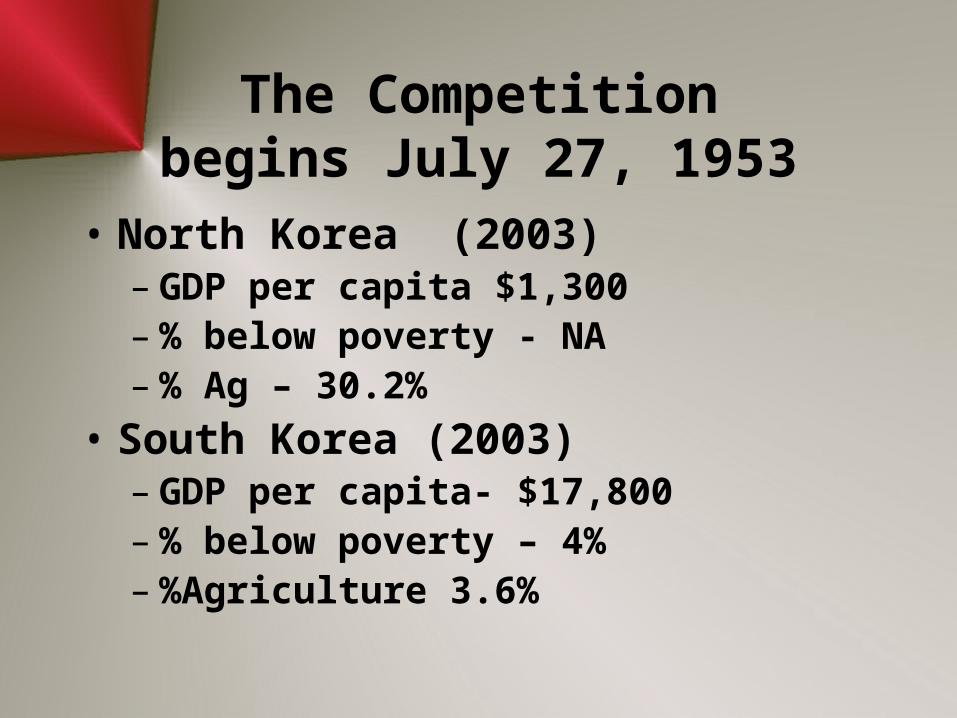
The Competitionbegins July 27, 1953
• North Korea (2003)– GDP per capita $1,300– % below poverty - NA– % Ag – 30.2%
• South Korea (2003)– GDP per capita- $17,800– % below poverty – 4%– %Agriculture 3.6%

But these are just technical economic measures
Is there another indicator of economic health?

Another measure of an Economy


November 6, 2009
Dr. Loren C. ScottLoren C. Scott & Associates, Inc.www.lorencscottassociates.com