npdes compliance summary report - mwra.state.ma.us · contributors grace bigornia-vitale mark...
TRANSCRIPT

NPDES compliance summary report, fiscal year 2003
Massachusetts Water Resources Authority
Environmental Quality Department Report ENQUAD 2003-11

NPDES COMPLIANCE SUMMARY REPORT Fiscal Year 2003
Frederick A. Laskey Executive Director
Michael J. Hornbrook
Chief Operating Officer
Dr. Andrea C. Rex Director, Environmental Quality Department
By David Wu
Technical Report No. 2003-11 Environmental Quality Department
Operations Division Massachusetts Water Resources Authority
Charlestown Navy Yard 100 First Avenue
Boston, MA 02129 (617) 242-6000

Contributors
Grace Bigornia-Vitale Mark Sullivan Kelly Coughlin
Maury Hall
Citation: Wu D. 2003. NPDES compliance summary report, fiscal year 2003. Boston: Massachusetts Water Resources Authority. Report ENQUAD 2003-11. 150 pp.

i
Table of Contents EXECUTIVE SUMMARY 1
Deer Island Treatment Plant 1 Combined Sewer Overflow Facilities 4 Collection and Transport System 5 Future Outlook 6
I: INTRODUCTION 7 II: DEER ISLAND TREATMENT PLANT 8
II.A.1 Influent Flow 8 II.A.2 Influent Conventional Parameters and Nutrients 9 II.A.3 Influent Priority Pollutants 10 II.A.4 Effluent Conventional Parameters and Nutrients 12 II.A.5 Effluent Priority Pollutants 15 II.A.6 Whole Effluent Toxicity 16 II.B.1 Compliance with Regulatory Limits 17 II.B.2 Effluent Quality Compared to Water Quality Standards 23 II.C.1 Ambient Monitoring Plan 24 II.C.2 The Contingency Plan 27
III: COMBINED SEWER OVERFLOW FACILITIES 31 III.A.1 Cottage Farm Activations 32 III.A.2 Cottage Farm Conventional Parameters 33 III.A.3 Cottage Farm Metals 33 III.B.1 Prison Point Activations 34 III.B.2 Prison Point Conventional Parameters 35 III.B.3 Prison Point Metals 35 III.C.1 Somerville Marginal Activations 36 III.C.2 Somerville Marginal Conventional Parameters 37 III.C.3 Somerville Marginal Metals 37 III.D.1 Fox Point Activations 38 III.D.2 Fox Point Conventional Parameters 39 III.D.3 Fox Point Metals 39 III.E.1 Commercial Point Activations 40 III.E.2 Commercial Point Conventional Parameters 41 III.E.3 Commercial Point Metals 41
IV: SLUDGE PROCESSING 42 IV.A Pelletizing Process 42 IV.B Sludge Pellet Regulations 42
V: TRANSPORT SYSTEMS 45 V.A.1 North System Headworks Choking 45 V.A.2 North System Sanitary Sewer Overflows 46 V.B South System Sanitary Sewer Overflows 47 V.C Infiltration/Inflow 47
VI: MISCELLANEOUS NPDES PERMIT REQUIREMENTS 48 VI.A Facility Best Management Practices Plans 48 VI.B Water Conservation / Dry Day Flow Limit 48 VI.C Pollution Prevention Program 48 VI.D Groundwater Remediation 49 VI.E Local Limits and Industrial Pretreatment Programs 49 VI.F Reporting 49

ii
APPENDICES A: Deer Island Treatment Plant Data B: Cottage Farm CSO Facility Data C: Prison Point CSO Facility Data D: Somerville Marginal CSO Facility Data E: Fox Point CSO Facility Data F: Commercial Point CSO Facility Data G: NPDES Monitoring Requirements H: An Overview of the MWRA Sewerage System and Facilities I: Instrument Detection Limits, Method Detection Limits, and Quantitation Limits J: Priority Pollutants List and Other Parameters K: Glossary, Abbreviations, and Units

iii
List of Tables
Table 1 Sanitary Sewer Overflows, FY03 6 Table II.A.1 Classification of DITP Influent, FY03 9 Table II.A.2 Deer Island Influent Characterization, FY94-FY03 10 Table II.A.3 Deer Island Removal Efficiency, FY03 12 Table II.A.4 Removal Efficiency vs. Degree of Secondary Treatment, FY03 13 Table II.A.5 Deer Island Effluent Characterization, FY94-FY03 14 Table II.A.6 Deer Island Effluent, Results of Toxicity Testing, FY03 17 Table II.B.1 Deer Island Effluent Quality Compared to Permit Limits, FY03 18 Table II.B.2 NPDES Violations at Deer Island, FY94-FY03 18 Table II.B.3 Comparison of DITP Effluent with Water Quality Criteria, FY03 23 Table II.C.1 Post-Discharge Ambient Monitoring Summary 24 Table II.C.2 Contingency Plan Threshold Summaries 27 Table II.C.3 Contingency Plan Exceedances, FY03 29 Table III.A.1 Cottage Farm CSO Activations Summary 32 Table III.A.2 Cottage Farm CSO Effluent Characteristics, FY03 33 Table III.A.3 Cottage Farm Metals, FY03 33 Table III.B.1 Prison Point CSO Activations Summary 34 Table III.B.2 Prison Point CSO Effluent Characteristics, FY03 35 Table III.B.3 Prison Point Metals, FY03 35 Table III.C.1 Somerville Marginal CSO Activations Summary 36 Table III.C.2 Somerville Marginal CSO Effluent Characteristics, FY03 37 Table III.C.3 Somerville Marginal Metals, FY03 37 Table III.D.1 Fox Point CSO Activations Summary 38 Table III.D.2 Fox Point CSO Effluent Characteristics, FY03 39 Table III.D.3 Fox Point Metals, FY03 39 Table III.E.1 Commercial Point CSO Activations Summary 40 Table III.E.2 Commercial Point CSO Effluent Characteristics, FY03 41 Table III.E.3 Commercial Point Metals, FY03 41 Table IV.B.1 Federal and State Limits for Sludge Pellet Metals 43 Table IV.B.2 Summary of Sludge Pellet Analysis, Calendar Year 2002 44 Table V.A.1 Sanitary Sewer Overflows, North System, FY02-03 47 Table V.B.1 Sanitary Sewer Overflows, South System, FY02-03 47

iv
List of Figures
Figure 1 MWRA Flows, FY92-03 1 Figure 2 DITP Dry Day Flows, FY03 2 Figure 3 DITP Effluent TSS Removal Rates 3 Figure 4 DITP Effluent BOD/cBOD Removal Rates 3 Figure 5 NPDES Violations at DITP, FY94-03 4 Figure 6 CSO Activations, FY92-03 5 Figure 7 CSO Volume Treated, FY92-03 5 Figure 8 Headworks Choking, FY92-03 6 Figure II.A.1 DITP Influent Flow Compared to Precipitation, FY03 8 Figure II.A.2 DITP Influent Flow Compared to Precipitation, FY92-03 9 Figure II.A.3 DITP Mean Influent Metals Loadings, FY92-03 11 Figure II.A.4 DITP Mean Influent Organics Loadings, FY94-03 12 Figure II.A.5 DITP Mean Effluent Nutrient Concentrations, FY94-03 15 Figure II.A.6 DITP Mean Effluent Metals Loadings, FY89-03 15 Figure II.A.7 DITP Mean Effluent Organics Loadings, FY94-03 16 Figure II.B.1 DITP Effluent cBOD (Monthly Average), FY03 19 Figure II.B.2 DITP Effluent cBOD (Weekly Average), FY03 19 Figure II.B.3 DITP Effluent TSS (Monthly Average), FY03 20 Figure II.B.4 DITP Effluent TSS (Weekly Average), FY03 20 Figure II.B.5 DITP Effluent Fecal Coliform (Daily Geometric Mean), FY03 21 Figure II.B.6 DITP Effluent Fecal Coliform (High Sample Counts), FY03 21 Figure II.B.7 DITP Effluent pH (Monthly Min and Max), FY03 22 Figure II.B.8 DITP Effluent Total Chlorine Residual (Monthly Average), FY03 22 Figure II.B.9 DITP Effluent Total Chlorine Residual (Daily Average), FY03 23 Figure II.C.1 MWRA Water Column Outfall Monitoring Stations 25 Figure II.C.2 MWRA Benthic Outfall Monitoring Stations 26 Figure II.C.3 Contingency Plan Flowchart 30 Figure III.A.1 Cottage Farm CSO Activations Compared to Precipitation, FY94-03 32 Figure III.A.2 Cottage Farm Total Volume Treated Compared to Precipitation, FY94-03 33 Figure III.B.1 Prison Point CSO Activations Compared to Precipitation, FY94-03 34 Figure III.B.2 Prison Point Total Volume Treated Compared to Precipitation, FY94-03 35 Figure III.C.1 Somerville Marginal CSO Activations Compared to Precipitation, FY94-03 36 Figure III.C.2 Somerville Marginal Total Volume Treated Compared to Precipitation, FY94-03 37 Figure III.D.1 Fox Point CSO Activations Compared to Precipitation, FY94-03 38 Figure III.D.2 Fox Point Total Volume Treated Compared to Precipitation, FY94-03 38 Figure III.E.1 Commercial Point CSO Activations Compared to Precipitation, FY94-03 40 Figure III.E.2 Commercial Point Total Volume Treated Compared to Precipitation, FY94-03 40 Figure V.A.1 Choking, FY94-03 45 Figure V.A.2 Rain-Related Choking, FY94-03 45 Figure V.A.3 Testing/Maintenance Choking, FY94-03 46

1
Executive Summary Overview This report presents and summarizes monitoring and compliance data collected
and analyzed by the Massachusetts Water Resources Authority’s (MWRA) Environmental Quality Department (ENQUAD) from July 1, 2002 to June 30, 2003. This report, while not a regulatory requirement, provides a useful documentation of influent and effluent quality trends over the course of a fiscal year for the MWRA’s Deer Island Treatment Plant (DITP) and Combined Sewer Overflow (CSO) facilities.
Deer Island Treatment Plant
The MWRA’s NPDES permit requires the Authority to monitor its wastewater treatment plant at Deer Island for specific parameters. The MWRA currently operates under a permit issued in July 2000 and effective August 20, 2000. The permit calls for secondary treatment of wastewater and monitoring of the effects of the new outfall in the Massachusetts Bay. Secondary treatment began at DITP in August 1997 with the start-up of the first battery of secondary treatment (Battery A). In March 1998, Battery B was brought on-line. The final battery, Battery C, became operational in March 2001. In addition to the completion of Battery C, the MWRA opened on September 6, 2000 a new 9.5-mile outfall tunnel that carries treated wastewater from DITP to Massachusetts Bay. The permit requires extensive monitoring of Massachusetts Bay to determine the effects of the outfall, if any exist. Figure 1 shows the Deer Island flow during each month of FY03, comparing the flow with the monthly averages of the previous eleven years – FY92 to FY02. From FY99 to FY02 all flows were treated at Deer Island, while from FY92 to FY98 flows were treated at DITP and the former Nut Island Treatment Plant, now the headworks for South System influent to DITP.
Figure 1. MWRA Flows, FY93-03
0
100
200
300
400
500
600
Jul Aug Sep Oct Nov Dec Jan Feb Mar Apr May Jun
Mea
n Fl
ow (M
GD
)
FY03 FY93-02

2
Restrictions on dry day flow are a part of the permit. These restrictions act to control new connections, ensuring that the collection system and the new treatment plant retain adequate capacity. Monthly dry day flows are calculated by averaging the flows on dry days over the previous year. A dry day is defined as a day with 0.09 inches of precipitation or less and no snow melt with the following restrictions: the precipitation on the previous day is less than 0.3 inches, the precipitation two days prior is less than 1.0 inch, and the precipitation three days prior is less than 2.0 inches. A day with snowmelt is defined as a day when there is snow on the ground and the air temperature is above 32oF. Figure 2 shows the dry day flow for Deer Island during each month of FY03. The solid line represents the dry day flow limit of 436 mgd for the permit. In FY03, no violations of the dry day flow limit occurred.
Figure 2. DITP Dry Day Flows, FY03
0
50
100
150
200
250
300
350
400
450
500
Jul Aug Sep Oct Nov Dec Jan Feb Mar Apr May Jun
Dry
day
flow
(MG
D)
FY03 Permit Limit (436 MGD)
Since the new primary treatment plant came on-line on January 21, 1995, appreciable improvements have been seen in effluent quality. The removal rates for both TSS and BOD or cBOD (cBOD has replaced BOD in the current permit as the measure of oxygen demand) have improved significantly (see Figures 3 and 4, respectively on the following page). In FY96 and FY97, removal efficiencies compared favorably to theoretical removal efficiencies for primary treatment. In FY98, efficiencies continued to improve, especially for BOD, with a removal rate well above the theoretical range.1 This coincided with the start-up of Batteries A and B of secondary treatment. Recently, removal rates for both TSS and cBOD have leveled off as DITP has reached its optimal efficiency level.
1 Metcalf & Eddy, Inc. 1972. Wastewater Engineering: Collection, Treatment, Disposal. New York: McGraw-Hill Book Company. p. 446.

3
Figure 3. DITP Effluent TSS Removal Rate
0%
10%
20%
30%
40%
50%
60%
70%
80%
90%
100%
FY94 FY95 FY96 FY97 FY98 FY99 FY00 FY01 FY02 FY03
% R
emov
al
Theoretical Primary TSS % Removal Theoretical Secondary TSS % Removal Actual TSS % Removal
Startup of primary treatment
Startup of Secondary Battery A
Startup of Secondary Battery B Startup of
Secondary Battery C
Figure 4. DITP Effluent BOD or cBOD Removal Rate
0%
10%
20%
30%
40%
50%
60%
70%
80%
90%
100%
FY94 FY95 FY96 FY97 FY98 FY99 FY00 FY01 FY02 FY03
% R
emov
al
Theoretical Primary BOD or cBOD % Removal Theoretical Secondary BOD or cBOD % RemovalActual BOD or cBOD % Removal
Startup of primary treatment
Startup of Secondary Battery A
Startup of Secondary Battery B
Startup of Secondary Battery C
Annual numbers of NPDES violations have decreased dramatically due to improved treatment at DITP. Figure 5 (next page) compares the number of NPDES permit violations at Deer Island in FY03 to previous years. No non-toxicity NPDES violations occurred in FY00, FY99, or FY97. One non-toxicity violation occurred in FY02 and FY98 and four in FY01, compared to 12 in FY96 and 19 in both FY95 and FY94. However, in FY03, three violations of the total suspended solids limit occurred at DITP. Details of those violations can be found in Chapter 2, Section II.B.

4
Figure 5. NPDES Violations at DITP, FY94-FY03
0
5
10
15
20
25
30
35
40
FY94 FY95 FY96 FY97 FY98 FY99 FY00 FY01 FY02 FY03
# of
vio
latio
ns
BOD TSS Settleable Solids Fecal Coliform
Total Coliform pH PHCs Toxicity
Dry Day Flow cBOD TCR
Since the opening of the new plant, Deer Island has seen significant reductions in loadings of metals and organic compounds in the effluent. These improvements are probably due to two factors: first, corrosion control activities and source reduction programs have helped to lower these pollutants in the incoming influent. Second, the new plant may be able to better capture both metals and organics in the treatment process.
Combined Sewer Overflow Facilities
MWRA monitors five CSO facilities – Cottage Farm, Prison Point, Somerville Marginal, Fox Point, and Commercial Point – under the permit. The Constitution Beach facility is also included under the permit. However, MWRA decommissioned the Constitution Beach facility in September 2000 following the completion of a sewer separation project in East Boston. Figures 6 and 7 on the next page show the number of activations and the total volume treated, respectively, at the six CSO facilities since FY92. The correlation between rainfall and CSO activation can be seen in both figures. Note that although total rainfall is correlated to CSO activation, the intensity of the rainfall and frequency of storms will have an important effect. These characteristics influence the degree of ground saturation, affecting the volume treated at the CSO facilities during a storm.

5
Figure 6. CSO Activations, FY92-03
0
20
40
60
80
100
120
140
160
180
FY92 FY93 FY94 FY95 FY96 FY97 FY98 FY99 FY00 FY01 FY02 FY03
Act
ivat
ions
0
10
20
30
40
50
60
Rai
nfal
l (in
ches
)
Cottage Farm Somerville Marginal Fox Point Prison PointConstitution Beach Commercial Point Rainfall
Figure 7. CSO Volume Treated, FY92-03
0
500
1000
1500
2000
2500
3000
FY92 FY93 FY94 FY95 FY96 FY97 FY98 FY99 FY00 FY01 FY02 FY03
Vol
ume
treat
ed (M
G)
0
10
20
30
40
50
60
Rai
nfal
l (in
ches
)
Cottage Farm Somerville Marginal Fox Point Prison PointConstitution Beach Commercial Point Rainfall
Collection and Transport System
The MWRA monitors the capacity of the wastewater collection and transport system. One of the system capacity parameters in the North System is choking, which occurs at the remote headworks. Choking is a reduction or stopping of flow to Deer Island at the remote headworks, either when heavy flow exceeds the capacity of the treatment plant or when maintenance or construction is performed at the plant. As Figure 8 on the following page shows, the number of hours of choking has fallen to very low levels in FY03, mainly due to the completion of the Deer Island plant. To minimize choking related to testing and maintenance, MWRA performs maintenance and testing at off-peak times so not to cause any backups in the system upstream of the headworks.

6
Figure 8. Headworks Choking, FY92-03
0
200
400
600
800
1000
1200
1400
FY92 FY93 FY94 FY95 FY96 FY97 FY98 FY99 FY00 FY01 FY02 FY03
Cho
king
(hou
rs)
Heavy Rain & Flow Testing & Maintenance
The MWRA also monitors the occurrence of Sanitary Sewer Overflows, or SSOs, associated with MWRA-owned sewer lines. These overflows occur in areas where the collection system becomes overloaded by heavy flows. In FY95, the MWRA’s Transport Department started to locate and visually monitor these SSOs in the North and South Systems. Table 1 lists the SSOs observed by MWRA personnel in FY03.
Future Outlook
The startup of the new primary treatment plant at Deer Island in FY95 was just the first of several changes and improvements in the MWRA’s facilities, including full secondary treatment, the Inter-Island Tunnel linking the South System to DITP, and the new outfall tunnel to Massachusetts Bay. The MWRA no longer discharges effluent into Boston Harbor and the Authority is currently monitoring the effects of these changes on water quality in the Harbor and Massachusetts Bay, as required by the NPDES permit issued in July 2000. In addition, a contingency plan ensures that the discharge does not adversely impact Massachusetts Bay. Finally, major upgrades are underway at the five CSO facilities. These upgrades will modernize the facilities and reduce pollutants discharged to receiving waters. The next challenges for the MWRA will be to interpret the results of the ambient monitoring in Massachusetts, finish the CSO facility upgrades, and train operating personnel to properly operate the new CSO facility equipment.
Location Number of OverflowsNorth SystemSection 133B Framingham 1Section 107 Medford 1South SystemSection 628 Braintree (Pearl Street) 1Section 626 Braintree/Weymouth (Smelt Brook) 7
Table 1. Sanitary Sewer Overflows, FY03

7
I: Introduction Overview This report presents and summarizes the NPDES monitoring and compliance
data compiled and analyzed by the MWRA Environmental Quality Department during the period of July 2002 to June 2003. MWRA's DITP and CSO facilities serve large communities’ needs for sewer systems while maintaining healthy water environments for recreation and wildlife. Chapter II presents and discusses the monitoring results for DITP, along with Contingency Plan and Ambient Monitoring Plan requirements. Chapter III describes the results for the five CSO facilities. Chapter IV discusses sludge processing operations at DITP and the MWRA’s Fore River pelletizing facility. Chapter V discusses transport and sewer system capacity issues. Finally, Chapter VI covers an array of miscellaneous topics introduced by the new permit. Appendices A-F provide detailed monthly data for the Deer Island plants and for the five CSO facilities. Appendix G provides background information about MWRA’s regulatory requirements, and Appendix H describes the MWRA sewer system and facilities. Appendix I defines the types of detection limits encountered in chemical analyses. Appendix J lists pollutants of concern. Finally, Appendix K is a glossary of the terms and phrases used throughout this report.

8
II: Deer Island Treatment Plant
Overview This chapter presents and discusses monitoring information for DITP. The characteristics examined include flow, conventional parameters, nutrients, priority pollutants (metals, cyanide, pesticides/PCBs, and organic compounds), fecal coliform bacteria, and whole effluent toxicity. Since a number of limits in the Contingency Plan set forth by the new NPDES permit deal with effluent quality, this section finishes up with a description of the Contingency Plan and the closely related Ambient Monitoring Plan.
II.A.1 Influent Flow
The average flow to DITP in FY03 was 377.2 million gallons per day (mgd). Figure II.A.1 shows that flow generally rises and falls with the amount of precipitation. This occurs because several of the larger communities in the North System (Boston, Cambridge, Somerville, and Chelsea) have combined sewers.
Figure II.A.1. DITP Influent Flow Compared to Precipitation, FY03
0.0
100.0
200.0
300.0
400.0
500.0
600.0
700.0
800.0
900.0
1000.0
Jul Aug Sep Oct Nov Dec Jan Feb Mar Apr May Jun
Influ
ent F
low
(MG
D)
0.0
1.0
2.0
3.0
4.0
5.0
6.0
Rai
nfal
l (in
ches
)Average Minimum Maximum Precipitation
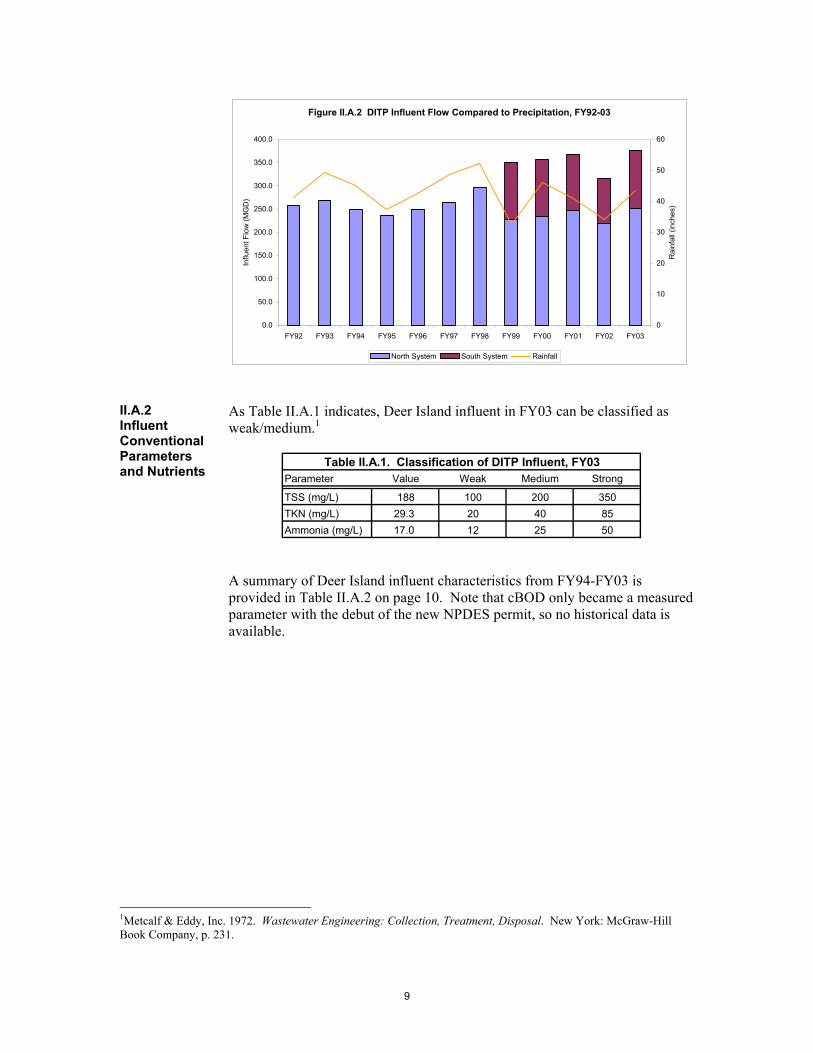
The impact of rainfall on flows can also be seen in Figure II.A.2 on the following page, which tracks average flow and precipitation over the past twelve fiscal years. The completion of the Inter-Island Tunnel from Nut Island to Deer Island in early FY99 resulted in increased flow to DITP, as DITP treated South System sewage previously treated at the Nut Island Treatment Plant. Increased rainfall in FY03 (43.51 versus 44.14 inches in FY02) lead to higher average flows to DITP in FY03.
9
Figure II.A.2 DITP Influent Flow Compared to Precipitation, FY92-03
0.0
50.0
100.0
150.0
200.0
250.0
300.0
350.0
400.0
FY92 FY93 FY94 FY95 FY96 FY97 FY98 FY99 FY00 FY01 FY02 FY03
Influ
ent F
low
(MG
D)
0
10
20
30
40
50
60
Rai
nfal
l (in
ches
)
North System South System Rainfall
II.A.2 Influent Conventional Parameters and Nutrients
As Table II.A.1 indicates, Deer Island influent in FY03 can be classified as weak/medium.1
Parameter Value Weak Medium Strong
TSS (mg/L) 188 100 200 350TKN (mg/L) 29.3 20 40 85Ammonia (mg/L) 17.0 12 25 50
Table II.A.1. Classification of DITP Influent, FY03
A summary of Deer Island influent characteristics from FY94-FY03 is provided in Table II.A.2 on page 10. Note that cBOD only became a measured parameter with the debut of the new NPDES permit, so no historical data is available.
1Metcalf & Eddy, Inc. 1972. Wastewater Engineering: Collection, Treatment, Disposal. New York: McGraw-Hill Book Company, p. 231.

10
Parameter FY94* FY95* FY96* FY97* FY98* FY99 FY00 FY01 FY02 FY03Flow (mgd) Minimum 171 167 147 167 159 233 219 260 222.7 237.6 Average 249 236 250 265 296 350 356 367 316.6 378
Maximum 528 565 526 649 917 824 901 1136 773 897.4Total Suspended Solids (TSS)
Min Conc (mg/L) 93 102 56 50 32 43 86 63 157 140Avg Conc (mg/L) 137 138 140 144 141 160 167 176 200 188Max Conc (mg/L) 175 160 432 284 382 564 379 336 255 230Average Loading (tons/d) 98 96 86 100 94 234 248 269 264 296
Carbonaceous Biochemical Oxygen Demand (cBOD)Min Conc (mg/L) ** ** ** ** ** ** ** 29 93 80Avg Conc (mg/L) ** ** ** ** ** ** ** 111 124 106Max Conc (mg/L) ** ** ** ** ** ** ** 242 162 131Average Loading (tons/d) ** ** ** ** ** ** ** 170 164 167
Settleable SolidsMin Conc (mL/L) 1.9 3.5 0.1 1.5 0.1 0.1 0.7 0.3 4.5 4.7Avg Conc (mL/L) 3.9 5.6 7.0 6.9 6.3 5.9 5.3 5.8 6.5 7.4Max Conc (mL/L) 5.6 7.3 18.0 17.0 20.0 34.2 24.6 15.5 9.5 11.1Average Loading (tons/d) 2.8 3.9 4.3 4.8 4.2 8.6 7.9 8.9 8.6 11.7
Total Kjeldahl Nitrogen Min Conc (mg/L) 11.2 14.0 11.6 8.7 13.6 14.6 13.2 16.3 26.0 23.3Avg Conc (mg/L) 21.9 21.9 26.3 24.2 26.4 29.2 27.7 30.1 35.2 29.3Max Conc (mg/L) 29.3 29.1 56.3 48.1 37.7 45.6 46.5 46.5 44.5 38.1Average Loading (tons/d) 15.6 15.2 16.1 16.9 17.4 42.7 41.1 46.1 46.5 46.2
Ammonia-NitrogenMin Conc (mg/L) 5.6 7.3 6.8 2.5 4.8 6.0 6.1 6.8 14.2 12.4Avg Conc (mg/L) 12.3 13.7 15.0 13.3 14.5 16.6 16.3 17.8 20.5 17.0Max Conc (mg/L) 17.9 18.0 24.0 18.6 23.1 30.8 25.0 24.2 28.6 23.7Average Loading (tons/d) 8.8 9.6 9.2 9.2 9.6 24.2 24.2 27.2 27.1 26.8
NitratesMin Conc (mg/L) 0.10 0.02 0.01 0.01 0.01 0.01 0.00 0.00 0.01 0.01Avg Conc (mg/L) 0.80 0.15 0.14 0.22 0.36 0.06 0.13 0.17 0.05 0.10Max Conc (mg/L) 2.70 0.59 1.42 2.31 1.95 1.21 1.56 1.53 0.26 0.37Average Loading (tons/d) 0.57 0.10 0.09 0.15 0.24 0.09 0.19 0.26 0.07 0.16
NitritesMin Conc (mg/L) 0.00 0.02 0.01 0.01 0.01 0.01 0.01 0.00 0.01 0.07Avg Conc (mg/L) 0.10 0.06 0.07 0.09 0.08 0.05 0.14 0.15 0.11 0.22Max Conc (mg/L) 0.20 0.19 1.66 0.35 0.46 0.45 0.72 0.47 0.35 0.55Average Loading (tons/d) 0.07 0.04 0.04 0.07 0.05 0.07 0.21 0.23 0.15 0.35
* North System only. FY99 and later include South System data. ** Samples not collected.
Table II.A.2. Deer Island Influent Characterization, FY94-FY03
II.A.3 Influent Priority Pollutants
The results of a complete priority pollutant scan of Deer Island influent can be found in Tables A-2 and A-3 of Appendix A. For levels below detection limits, one half of the method detection limit for inorganics or one tenth of the quantitation limit for organics was substituted to calculate concentrations and loadings. Appendix I provides a detailed discussion of detection and quantitation limits. A pollutant is included whether it was detected just once or 37 times over the course of a year. Figures II.A.3 and II.A.4 below show annual averages of the daily loads; however, they do not truly reflect how often the pollutant was detected during the year. Therefore, if a below detection limit concentration is converted to a loading, it is recorded as a non-zero value, even though the constituent may not have been present in the sample. Note that these caveats apply to both metals and organics loadings. However, since metals are commonly detected in almost every sample, the notes raised above are less of an issue.

11
Figure II.A.3 compares FY03 average influent loadings for several key metals to historical values. The MWRA samples for these pollutants a few times a month. Using the measured concentration and the flow on the day on which the sample was taken, daily loads can be calculated. Data from FY98 and earlier is from the North System only. Before 1999, metals loadings in the North System decreased steadily, as MWRA made strides in toxic and corrosion control efforts involving both water supply and wastewater transport. Since the South System flow was transferred from Nut Island to Deer Island at the start of FY99, the data after FY99 includes the South System flow. This larger, combined flow explains the increase in metals loadings from FY92-98 to FY99-03. Since loadings are calculated using flow, which in turn is affected by rainfall, higher levels of rainfall in FY03 have increased metals loads in the influent.
Figure II.A.3. DITP Mean Influent Metals Loadings, FY92-03
0
100
200
300
400
500
600
700
800
FY92* FY93* FY94* FY95* FY96* FY97* FY98* FY99 FY00 FY01 FY02 FY03
Mea
n Lo
ad (l
bs/d
ay)
Cr Cu Pb Ni Zn * North System only. FY99 and later includes South System data.
Figure II.A.4 on the following page compares influent loadings of certain representative organic priority pollutants to the loadings in previous years (see Appendix A, Table A-3). The opening of the Inter-Island Tunnel in FY99 had an identical effect on organics loadings at Deer Island as it did on metals loadings; they increased due to the added flow from the South System. Increased FY03 rainfall did not seem to have an impact on loadings of organic compounds, compared to FY02.

12
Figure II.A.4. DITP Mean Influent Organics Loadings, FY94-03
0
50
100
150
200
250
300
FY94* FY95* FY96* FY97* FY98* FY99 FY00 FY01 FY02 FY03
Mea
n Lo
ad (l
bs/d
ay)
VOA Pesticides Phthalates Total Phenols PAHs * North System only. FY99 and later include South System data.
No phenols data for FY94-95
II.A.4 Effluent Conventional Parameters and Nutrients
Table II.A.3 compares DITP’s removal efficiencies for TSS and cBOD with theoretical removal efficiencies.2 The removal efficiencies are determined from the average effluent and influent concentrations for TSS and cBOD as reported in Table A-1 of Appendix A.
Parameter DITP % Removal*TSS 90%
cBOD 90%
Table II.A.3. Deer Island Removal Efficiency, FY03Theoretical % Removal for
* Removal efficiencies were determined using the average influent and effluent concentration values as reported in Table A-1, Appendix A. Note that only a portion of the total flow each month went through secondary treatment. See Table II.A.4 for more information.
Secondary Treatment85%85%
Table II.A.4, on the next page, shows how degree of secondary treatment can affect TSS and cBOD removal efficiencies. The table lists TSS and cBOD removal efficiencies and the percentage of flow that received secondary treatment on a monthly basis. The degree of secondary treatment is the average flow through secondary treatment (mgd) during the month divided by the average plant flow (mgd) for that month. Note that the low removal efficiency for August was caused by a disruption of secondary treatment. Section II.B.1 describes this disruption in detail. For the year, 98% of DITP flow went through secondary treatment and removal efficiency for TSS was 92%. For cBOD, the plant achieved 90% removal efficiency.
2Metcalf & Eddy, Inc. 1972. Wastewater Engineering Collection, Treatment, Disposal. New York. McGraw-Hill Book Company, p. 446.

13
TSS Removal cBOD Removal % of Flow TreatedEfficiency Efficiency at Secondary Levels
July 93% 92% 99.1%August 82% 88% 98.3%September 93% 92% 96.6%October 93% 92% 96.1%November 92% 89% 93.5%December 90% 88% 88.5%January 92% 90% 93.0%February 89% 86% 93.3%March 84% 85% 89.3%April 90% 89% 85.4%May 93% 92% 94.8%June 93% 92% 94.0%Average 90% 90% 93.5%
Table II.A.4. Removal Efficiency vs. Degree of Secondary Treatment, FY03
Table II.A.5 (next page) summarizes the conventional parameters and nutrients in Deer Island effluent over the past nine years. The significant drop in several parameters that occurred between FY95 and FY96 is due to the improved removal efficiency of the primary treatment plant. The implementation of secondary treatment in FY98 can explain the drop in TSS and BOD concentrations since FY97. Secondary treatment is also responsible for the increase in ammonia concentrations over the same period.

14
Parameter FY94* FY95* FY96* FY97* FY98* FY99 FY00 FY01 FY02 FY03Flow (mgd) Minimum 171 167 147 167 159 237 219 260 222.4 237.8 Average 249 236 250 265 296 350 356 367 316.6 377.2
Maximum 528 565 526 649 917 757 900 1136 772.9 897.7Total Suspended Solids (TSS)
Min Conc (mg/L) 65 52 17 16 4 3 5 4 3 5Avg Conc (mg/L) 73 65 44 41 25 22 18 15 16 18Max Conc (mg/L) 86 90 136 100 140 69 62 47 43 132Average Loading (tons/d) 52 45 27 29 17 14 26 24 21 28
Carbonaceous Biochemical Oxygen Demand (cBOD)Min Conc (mg/L) ** ** ** ** ** ** ** 4 3 3Avg Conc (mg/L) ** ** ** ** ** ** ** 12 13 11Max Conc (mg/L) ** ** ** ** ** ** ** 36 40 40Average Loading (tons/d) ** ** ** ** ** ** ** 19 17 17
Settleable SolidsMin Conc (mL/L) 0.1 0.1 0.1 0.1 0.1 0.1 0.0 0.1 0.1 0.1Avg Conc (mL/L) 0.5 0.4 0.2 0.2 0.2 0.2 0.1 0.1 0.1 0.1Max Conc (mL/L) 0.9 0.7 2.0 1.6 7.0 3.0 3.1 1.9 3.0 3.0Average Loading (tons/d) 0.4 0.3 0.1 0.1 0.1 0.1 0.1 0.2 0.1 0.2
Total Kjeldahl Nitrogen Min Conc (mg/L) 12.8 13.7 10.6 10.9 9.1 11.2 8.2 12.2 15.1 9.7Avg Conc (mg/L) 21.7 23.0 22.5 21.9 20.4 23.4 21.8 23.6 25.9 21.2Max Conc (mg/L) 32.8 28.6 32.5 27.6 32.4 34.3 32.4 33.3 35.0 32.3Average Loading (tons/d) 22.5 22.6 23.4 24.3 25.2 34.2 32.4 36.1 34.2 33.3
Ammonia-Nitrogen Min Conc (mg/L) 6.08 7.28 5.55 4.43 3.48 5.42 5.00 5.1 9.4 7.0Avg Conc (mg/L) 12.58 14.43 14.48 13.07 15.08 17.99 17.60 17.6 21.2 17.5Max Conc (mg/L) 18.51 19.60 21.90 18.00 22.70 26.40 25.20 24.9 32.0 28.0Average Loading (tons/d) 8.97 10.05 8.88 9.12 9.97 11.90 26.16 27.0 28.0 27.5
NitratesMin Conc (mg/L) 0.13 0.03 0.01 0.01 0.01 0.01 0.00 0.0 0.01 0.01Avg Conc (mg/L) 1.04 0.08 0.30 0.34 0.42 0.22 0.69 0.7 0.89 1.50Max Conc (mg/L) 5.98 0.28 1.95 2.58 1.49 1.93 2.96 4.2 2.86 5.07Average Loading (tons/d) 0.74 0.06 0.18 0.23 0.28 0.15 1.03 1.1 1.2 2.4
NitritesMin Conc (mg/L) 0.01 0.02 0.01 0.01 0.01 0.01 0.04 0.0 0.01 0.01Avg Conc (mg/L) 0.10 0.08 0.63 0.11 0.20 0.30 0.95 0.2 0.34 0.28Max Conc (mg/L) 0.26 0.22 1.90 0.62 1.15 1.99 3.06 1.1 1.26 0.91Average Loading (tons/d) 0.07 0.06 0.39 0.08 0.13 0.20 1.41 0.3 0.4 0.4
* North System only. FY99 and later include South System data. ** Samples not collected.
Table II.A.5. Deer Island Effluent Characterization, FY94-FY03
A summary of nutrient concentrations in Deer Island effluent from FY94-FY03 is provided in Figure II.A.5 on the following page. The introduction of the new primary treatment plant in FY95 did not affect nutrient concentrations, as primary treatment has no effect on nutrients. However, the activated sludge process used in DITP’s secondary treatment does change nutrient concentrations. The activated sludge process uses bacteria to promote efficient and rapid breakdown of wastes. This bacterial breakdown results in changes in the proportions of nitrogen species. For example, total Kjeldahl nitrogen (TKN) consists of NH3-N plus organic nitrogen. Effluent NH3-N concentrations have risen while total Kjeldahl nitrogen (TKN) concentrations have remained relatively stable. Therefore, the proportion of NH3-N as a TKN component has increased. Elevated levels of NH3-N are characteristic of the activated sludge process.

15
Figure II.A.5. DITP Mean Effluent Nutrients Concentrations, FY94-03
0
5
10
15
20
25
30
TKN Ammonia-N Nitrates Nitrites
Mea
n C
once
ntra
tion
(mg/
L)
FY94* FY95* FY96* FY97* FY98* FY99 FY00 FY01 FY02 FY03
* North System only. FY99 and later includes South System data.
II.A.5 Effluent Priority Pollutants
Appendix A, Tables A-8 and A-9 provide a summary of priority pollutant concentrations and loadings in DITP effluent for FY02. For a discussion of the importance of detection limits in loading calculations, see Section II.A.3 and Appendix I. Metals loadings over the past fifteen years are summarized in Figure II.A.6, while Figure II.A.7 on page 16 graphs organic pollutants from FY94-FY03. Two factors may explain the long-term decrease in loadings. First, the MWRA has instituted a more aggressive industrial pre-treatment program coupled with stricter enforcement of local limits. Second, the decrease may also be attributed to better capture of metals and organics at the plant.
Figure II.A.6. DITP Mean Effluent Metals Loadings, FY89-03
0
100
200
300
400
500
600
700
FY89* FY90* FY91* FY92* FY93* FY94* FY95* FY96* FY97* FY98* FY99 FY00 FY01 FY02 FY03
Mea
n Lo
ad (l
bs/d
ay)
Cr Cu Pb Ni Ag Zn * North System only. FY99 and later include South System data.
Note: For FY02 onwards, Cr, Pb, Ni, Ag, Zn were collected under the DEC protocols. See Appendix A, Tables A-10 and A-11 for more details.

16
Figure II.A.7. DITP Mean Effluent Organics Loadings, FY94-03
0
50
100
150
200
250
FY94* FY95* FY96* FY97* FY98* FY99 FY00 FY01 FY02 FY03
Mea
n Lo
ad (l
bs/d
ay)
VOA Pesticides Phthalates Total Phenols PAHs* North System only. FY99 and later include South System data.
For FY02 onwards, phthalate, phenol, and PAH data were collected under the DEC protocol. See Appendix A, Tables A-10 and A-11 for more details.
II.A.6 Whole Effluent Toxicity
The MWRA tests effluent toxicity every month at DITP. Effluent toxicity provides an overall view of effluent quality, ensuring that the effluent does not adversely affect the environment. In 1989, the EPA found that surfactants were the probable cause of most acute toxicity in DITP’s wastestream. Surfactants are most commonly used in household detergents to improve cleansing power. No acute toxicity could be attributed to metals or pesticides. The MWRA permit requires four tests for effluent toxicity testing. 48-hr acute static toxicity tests using the mysid shrimp (Americamysis bahia) and the silversides fish (Menidia beryllina) measure the short-term lethal effects caused by the effluent. A chronic survival and growth test using Menidia and a chronic fertilization test using the sea urchin (Arbacia punctulata) both measure subtle toxic impacts over a longer period of time. The results of these tests for FY03 can be found in Table II.A.6 on the following page. The LC50 (Lethal Concentration 50%) is the concentration of effluent in a sample that causes mortality to 50% of the test population during the duration of the test. The two acute tests use LC50. The NOEC (No Observed Effect Concentration) used in the chronic tests is the concentration of effluent in a sample to which organisms are exposed in a life cycle or partial life cycle test that has no adverse effects. An NOEC limit of 1.5% means that 1.5% of the sample is effluent, and the remainder dilution water. Any acute LC50 below 50% or chronic NOEC below 1.5% would violate the NPDES limit.

17
Mysid acute Menidia acute Menidia chronic Arbacia chronicLC50 LC50 NOEC NOEC
Limits (%) 50 50 1.5 1.5July > 100 68.3 100 50August > 100 68.3 50 50September > 100 100 50 50October > 100 > 100 50 100November > 100 64.9 50 100December > 100 > 100 50 100January > 100 > 100 100 50February > 100 > 100 50 50March > 100 > 100 50 100April > 100 > 100 50 100May > 100 95.9 25 50June > 100 > 100 50 100# of Violations 0 0 0 0Results in bold indicate a violation of the regulatory limits.
Table II.A.6. Deer Island Effluent, Results of Toxicity Testing, FY03
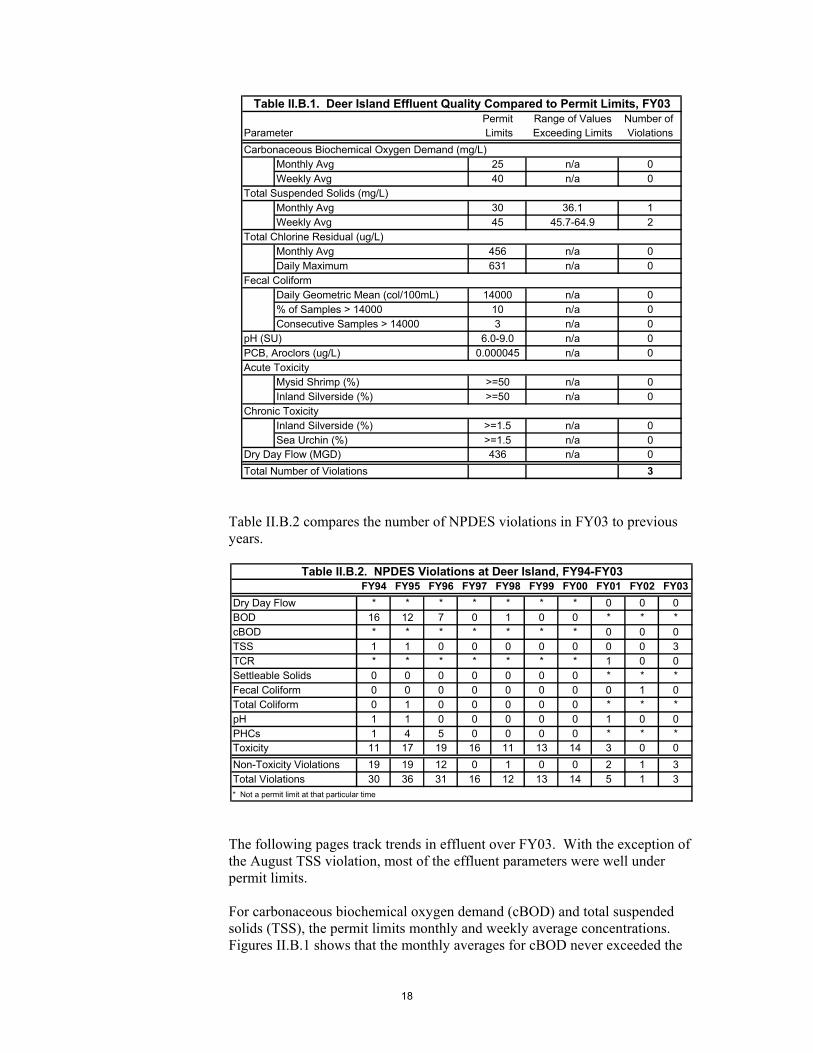
II.B.1 Compliance with Regulatory Limits
Plant performance at Deer Island is compared to permit limits in Table II.B.1 and Figures II.B.1 through II.B.9 on the following pages. The only violations of the regulatory limits in FY03 were for total suspended solids; one monthly violation, and two weekly violations, all in August 2002. MWRA traced the August TSS violations to a MWRA study conducted to determine the effect of sulfate-rich wastes being discharged by Nyacol Nano Technologies. MWRA suspected these wastes of contributing to odor and corrosion problems in the Framingham Extension Sewer. During the study, Nyacol ceased discharge of the sulfate-rich waste and the waste was instead discharged further upstream at the Delauri Pump Station in Charlestown. It was theorized that this location, closer to DITP, would not allow time for the sulfates to convert to hydrogen sulfide or sulfuric acid, the primary causes of odor and corrosion problems, respectively. Unfortunately, an unforeseen chain of events occurred that led to the TSS violations. The sulfate-rich waste, in concert with high air temperatures and low flow, caused an overgrowth of filamentous bacteria in DITP’s secondary reactors. While normally present in the secondary process, too many of these filamentous microorganisms can form mats on the wastewater surface. These mats, once formed, refused to settle during the secondary clarification process, which heightened the level of TSS discharged in the effluent. This upset of the secondary treatment process lasted 10-12 days, resulting in two violations of the weekly TSS permit limit of 45 mg/L (week of August 11 – 45.7 mg/L, week of August 18 – 64.9 mg/L). These two weekly violations were enough to push the monthly average to 36.1 mg/L, over the monthly limit of 30 mg/L. The monthly violation was the third and final permit violation of FY03.
18
Permit Range of Values Number of Parameter Limits Exceeding Limits ViolationsCarbonaceous Biochemical Oxygen Demand (mg/L)
Monthly Avg 25 n/a 0Weekly Avg 40 n/a 0
Total Suspended Solids (mg/L)Monthly Avg 30 36.1 1Weekly Avg 45 45.7-64.9 2
Total Chlorine Residual (ug/L)Monthly Avg 456 n/a 0Daily Maximum 631 n/a 0
Fecal ColiformDaily Geometric Mean (col/100mL) 14000 n/a 0% of Samples > 14000 10 n/a 0Consecutive Samples > 14000 3 n/a 0
pH (SU) 6.0-9.0 n/a 0PCB, Aroclors (ug/L) 0.000045 n/a 0Acute Toxicity
Mysid Shrimp (%) >=50 n/a 0Inland Silverside (%) >=50 n/a 0
Chronic ToxicityInland Silverside (%) >=1.5 n/a 0Sea Urchin (%) >=1.5 n/a 0
Dry Day Flow (MGD) 436 n/a 0Total Number of Violations 3
Table II.B.1. Deer Island Effluent Quality Compared to Permit Limits, FY03
Table II.B.2 compares the number of NPDES violations in FY03 to previous years.
FY94 FY95 FY96 FY97 FY98 FY99 FY00 FY01 FY02 FY03Dry Day Flow * * * * * * * 0 0 0BOD 16 12 7 0 1 0 0 * * *cBOD * * * * * * * 0 0 0TSS 1 1 0 0 0 0 0 0 0 3TCR * * * * * * * 1 0 0Settleable Solids 0 0 0 0 0 0 0 * * *Fecal Coliform 0 0 0 0 0 0 0 0 1 0Total Coliform 0 1 0 0 0 0 0 * * *pH 1 1 0 0 0 0 0 1 0 0PHCs 1 4 5 0 0 0 0 * * *Toxicity 11 17 19 16 11 13 14 3 0 0Non-Toxicity Violations 19 19 12 0 1 0 0 2 1 3Total Violations 30 36 31 16 12 13 14 5 1 3* Not a permit limit at that particular time
Table II.B.2. NPDES Violations at Deer Island, FY94-FY03
The following pages track trends in effluent over FY03. With the exception of the August TSS violation, most of the effluent parameters were well under permit limits. For carbonaceous biochemical oxygen demand (cBOD) and total suspended solids (TSS), the permit limits monthly and weekly average concentrations. Figures II.B.1 shows that the monthly averages for cBOD never exceeded the

19
regulatory discharge limit of 25 mg/L, and are well below the 10-year historical average. Unfortunately, Figure II.B.3 shows that in August 2002 the TSS monthly limit of 30 mg/L was violated. Details of the violation have already been covered above. Figure II.B.2 shows there were no violations of the cBOD weekly limit (40 mg/L). There were two back-to-back violations of the weekly 45 mg/L limit for TSS in August 2002 related to the Nyacol incident (Figure II.B.4).
Figure II.B.1. DITP Effluent cBOD (Monthly Average), FY03
0
5
10
15
20
25
30
Jul Aug Sept Oct Nov Dec Jan Feb Mar Apr May Jun
cBO
D (m
g/L)
Effluent cBOD, FY03 Effluent cBOD, FY99-02 Monthly Limit (25 mg/L)
Figure II.B.2. DITP Effluent cBOD (Weekly Average), FY03
0
5
10
15
20
25
30
35
40
45
1 3 5 7 9 11 13 15 17 19 21 23 25 27 29 31 33 35 37 39 41 43 45 47 49 51
Week
cBO
D (m
g/L)
Effluent weekly cBOD, FY03 Weekly Limit (40 mg/L)

20
Figure II.B.3. DITP Effluent TSS (Monthly Average), FY03
0
5
10
15
20
25
30
35
40
Jul Aug Sep Oct Nov Dec Jan Feb Mar Apr May Jun
TSS
(mg/
L)
Effluent TSS, FY03 Effluent TSS, FY97-FY02 Monthly Limit (30 mg/L)
Figure II.B.4. DITP Effluent TSS (Weekly Average), FY03
0
10
20
30
40
50
60
70
1 3 5 7 9 11 13 15 17 19 21 23 25 27 29 31 33 35 37 39 41 43 45 47 49 51
Week
TSS
(mg/
L)
Effluent weekly TSS, FY03 Weekly Limit (45 mg/L)

21
Fecal coliform has a discharge limit of 14,000 colonies/100mL, as calculated by the daily geometric mean of three samples per day. In FY03, monthly geometric means never exceeded 45 colonies/100mL. Additional limits for fecal coliform include: not more than three consecutive samples measuring over 14,000 colonies/100mL, and no more than 10% of the samples in a month measuring over 14,000 colonies/100 mL. These latter two limits were not approached. Figure II.B.5 shows the daily effluent trends of fecal coliform in FY03. Note that 5 colonies/100mL is the detection limit for the fecal coliform test so there will not be results below that number. Figure II.B.6 shows the percentage of high sample counts (>14,000 colonies/100mL) by month.
Figure II.B.5. DITP Effluent Fecal Coliform (Daily Geometric Mean), FY03
1
10
100
1000
10000
100000
7/1
7/15
7/29
8/12
8/26 9/
9
9/23
10/7
10/2
1
11/4
11/1
8
12/2
12/1
6
12/3
0
1/13
1/27
2/10
2/24
3/10
3/24 4/
7
4/21 5/
5
5/19 6/
2
6/16
6/30
Feca
l col
iform
(col
onie
s/10
0mL)
- lo
g sc
ale
Effluent fecal coliform, FY03 Daily limit (14,000 colonies/100mL)
Figure II.B.6. DITP Effluent Fecal Coliform (High Sample Counts), FY03
0%
2%
4%
6%
8%
10%
12%
Jul Aug Sep Oct Nov Dec Jan Feb Mar Apr May Jun
% o
f sam
ples
> 1
4,00
0 co
loni
es/1
00m
L
% of effluent samples > 14,000 colonies/100mL Monthly Limit (10%)

22
The limits for pH are based on the maximum and minimum values for each month, with pH required to fall between 6.0 and 9.0. In FY03, the pH of the effluent was always below the maximum of 9.0 and at or above the minimum of 6.0. Figure II.B.7 shows the monthly minimums and maximums throughout FY03.
Figure II.B.7. DITP Effluent pH (Monthly Min and Max), FY03
5
5.5
6
6.5
7
7.5
8
8.5
9
9.5
Jul Aug Sep Oct Nov Dec Jan Feb Mar Apr May Jun
pH (S
U)
Minimum Monthly pH Maximum Monthly pH Minimum Limit (pH 6) Maximum Limit (pH 9)
The permit regulates total chlorine residual through two limits: a monthly average of 456 µg/L and a daily maximum of 631 µg/L. Figure II.B.8 shows monthly average chlorine residual results versus the regulatory limit. The following figure, II.B.9, shows the daily results against the permit limit. Neither limit was violated, or even approached, in FY03.
Figure II.B.8. DITP Effluent Total Chlorine Residual (Monthly Average), FY03
0
50
100
150
200
250
300
350
400
450
500
Jul Aug Sep Oct Nov Dec Jan Feb Mar Apr May Jun
Tota
l chl
orin
e re
sidu
al (u
g/L)
Effluent total chlorine residual, FY03 Monthly Limit (456 ug/L)

23
Figure II.B.9. DITP Effluent Total Chlorine Residual (Daily Average), FY03
0
100
200
300
400
500
600
700
7/1
7/15
7/29
8/12
8/26 9/9
9/23
10/7
10/2
1
11/4
11/1
8
12/2
12/1
6
12/3
0
1/13
1/27
2/10
2/24
3/10
3/24 4/7
4/21 5/5
5/19 6/2
6/16
6/30
Tota
l chl
orin
e re
sidu
al (u
g/L)
Daily total chlorine residual, FY03 Daily limit (631 ug/L)
There are two other effluent limits. Arochlors 1016, 1221, 1232, 1242, 1248, 1254, and 1260 have a 0.000045 µg/L limit. None of these compounds were detected in the effluent in FY03. The dry day flow limit was covered in the Executive Summary, and the Executive Summary’s Figure 2 on page 2. MWRA must also report a number of other effluent components, although they have no discharge limit. These are listed in Appendix G, Table G-1.
II.B.2 Effluent Quality Compared to Water Quality Standards
Table II.B.3 compares concentrations of priority pollutants in DITP effluent to water quality criteria, both acute and chronic. Even before the dilution provided by the outfall, all the pollutants except for copper and silver were below both the acute and chronic criteria.
FY03 Effluent Concentration at Acute Dissolved Acute Recoverable TimesAcute Maximum (ug/L) Dilution† ZID (ug/L)‡ Criteria (ug/L)* Criteria (ug/L)** DetectedArsenic 0.40 50 0.008 69.0 69.0 0 of 23Copper 39.60 50 0.792 4.8 5.8 106 of 125Lead 7.82 50 0.156 210.0 220.8 11 of 87Mercury 0.11 50 0.002 1.8 2.1 103 of 110Nickel 5.85 50 0.117 74.0 74.7 87 of 87Silver 4.21 50 0.084 1.9 2.2 85 of 86Zinc 81.90 50 1.638 90.0 95.1 86 of 86
FY03 Effluent Concentration at Acute Dissolved Acute Recoverable TimesChronic Average (ug/L) Dilution† ZID (ug/L)‡ Criteria (ug/L)* Criteria (ug/L)** DetectedArsenic 0.40 70 0.006 36.0 36.0 0 of 23Copper 39.60 70 0.566 3.1 3.7 106 of 125Lead 7.82 70 0.112 8.1 8.5 11 of 87Mercury 0.11 70 0.002 0.9 1.1 103 of 110Nickel 5.85 70 0.084 8.2 8.3 87 of 87Zinc 81.90 70 1.170 81.0 85.6 86 of 86No conversion factor or chronic criteria exist for silver.
† Permit estimate from Attachment S.
‡ ZID is Zone of Initial Dilution, the area directly around the outfall.
* National Recommended Water Quality Criteria for Priority Toxic Pollutants, Federal Register, 12/10/98.
** Calculated using the conversion factors in Appendix A of the Federal Register, 12/10/98.
Table II.B.3. Comparison of DITP Effluent with Water Quality Criteria, FY03

24
II.C.1 Ambient Monitoring Plan
The new permit requires ambient monitoring of the Harbor and Massachusetts Bay. The ambient monitoring plan has three main components: the Harbor and Bay monitoring plan; the maintenance of the Bays Eutrophication Model; and the implementation of plume tracking. Table II.C.1 summarizes the first and third components of the monitoring plan. Note that the plume tracking component of the plan is now completed and results are available from ENQUAD. The Bays Eutrophication Model is a three-dimensional hydrographic model that is run annually to provide information on whether new limits are needed on the effluent discharge. The Model is designed primarily to examine nutrient inputs. Task Objective Sampling Protocol AnalysesEffluent sampling Weekly Nutrients
Daily Organic material (cBOD)Several times monthly Toxic contaminants3x/day Bacterial indicatorsDaily Solids
Water ColumnNearfield surveys 17 surveys/year Temperature
21 stations SalinityFarfield surveys 6 surveys/year Dissolved oxygen
26 stations NutrientsSolidsChlorophyllWater clarityPhotosynthesisRespirationPlanktonMarine mammal observations
Plume-track surveys Rhodamine dyeSalinityTemperatureCurrentsNutrientsSolidsBacterial indicators
Mooring (USGS) Continuous monitoring TemperatureSingle station Salinity3 depths Water clarity
ChlorophyllRemote sensing Surface temperature
Chlorophyll
Sea FloorSoft-bottom studies 20 nearfield stations Sediment chemistry
11 farfield stations Sediment profile imageryCommunity composition
Hard-bottom studies 1 survey/year Topography21 stations on 6 transects Substrate
Community compositionFish and ShellfishWinter flounder 1 survey/year Tissue contaminant concentrations
5 locations
American lobster 1 survey/year Tissue contaminant concentrations3 locations Physical abnormalities
Blue mussel 1 survey/year Tissue contaminant concentrations4 locations
Adapted from Werme, C. 2000. 1999 Outfall Monitoring Overview . MWRA Report ENQUAD 2000-14.
Evaluate biological condition and potential contaminant bioaccumulation
Track locations and characteristics of discharge plume, measure dilution of discharge
Provides continuous oceanographic data near outfall location
Determine contaminant body burden
Evaluate sediment quality and benthos in Boston Harbor and Massachusetts BayCharacterize marine benthic communities in rock and cobble areas
Determine contaminant body burden and population health Physical abnormalities, including liver
histopathology
Provides oceanographic data on a regional scale through satellite imagery
Completed - results available from MWRA
Available daily (cloud-cover permitting)
Table II.C.1. Post-Discharge Ambient Monitoring Plan Summary
Characterize wastewater discharge from Deer Island Treatment Plant
Collect water quality data near outfall locationCollect water quality data throughout Massachusetts and Cape Cod bays
25
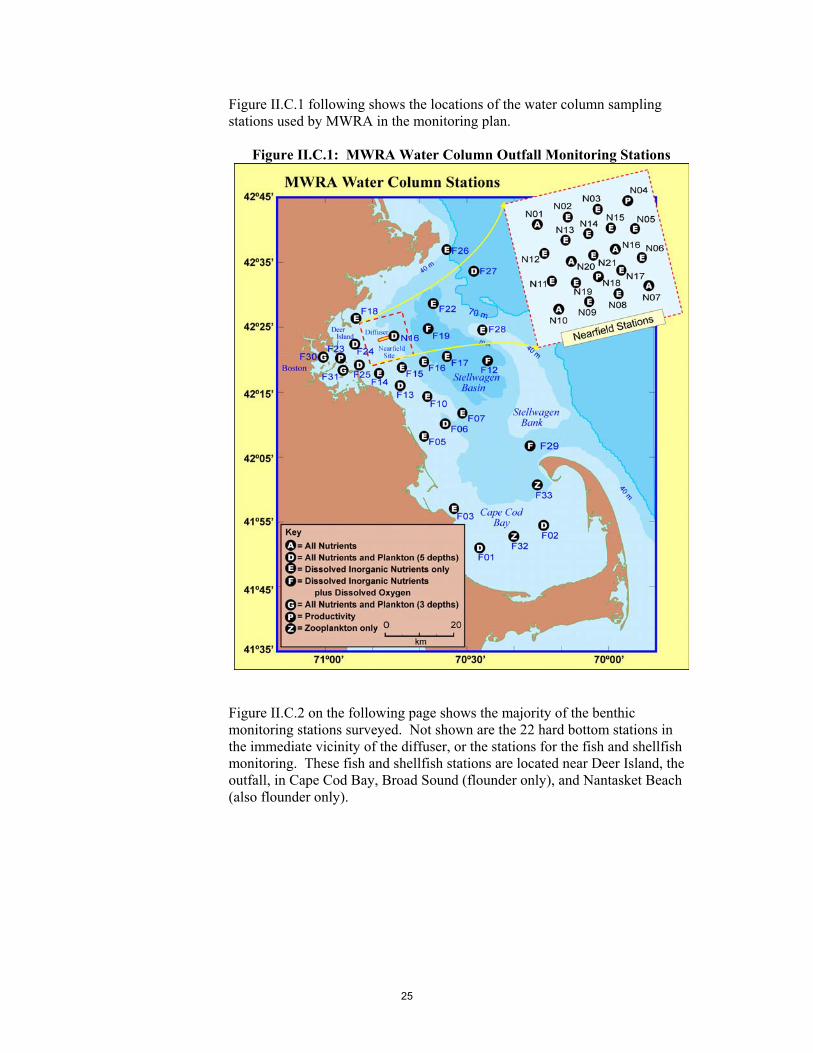
Figure II.C.1 following shows the locations of the water column sampling stations used by MWRA in the monitoring plan.
Figure II.C.1: MWRA Water Column Outfall Monitoring Stations
Figure II.C.2 on the following page shows the majority of the benthic monitoring stations surveyed. Not shown are the 22 hard bottom stations in the immediate vicinity of the diffuser, or the stations for the fish and shellfish monitoring. These fish and shellfish stations are located near Deer Island, the outfall, in Cape Cod Bay, Broad Sound (flounder only), and Nantasket Beach (also flounder only).

26
Figure II.C.2 MWRA Benthic Outfall Monitoring Stations
FF01
FF04
FF05
FF06
FF07
FF09
FF10
FF11
FF12
FF13
FF14
Cape CodBay
Provincetown#
Cape Ann
Nahant
Deer Island
Scituate #
42°00' 42°00'
42°15' 42°15'
42°30' 42°30'
71°00'
71°00'
70°45'
70°45'
70°30'
70°30'
70°15'
70°15'
NStellwagen BankNational Marine SanctuaryOutfall Diffuser
0 5 10 15 Kilometers
Farfield Stations
Benthic Farfield Stations
#
#
#
#
# #
## #
#
##
#
#
#
#
#
#
#
#
FF10
FF12
FF13
NF02
NF04
NF05
NF07
NF08 NF09
NF10NF12 NF13
NF14NF15
NF16NF17
NF18
NF19NF20
NF21
NF22
NF23
NF24
0 1 2 3 Kilometers
Depth (meters):
N
Farfield StationsNearfield Stations 15
2025
303540Outfall Diffuser
42°18' 42°18'
42°19' 42°19'
42°20' 42°20'
42°21' 42°21'
42°22' 42°22'
42°23' 42°23'
42°24' 42°24'
42°25' 42°25'
42°26' 42°26'
42°27' 42°27'
70°57'
70°57'
70°56'
70°56'
70°55'
70°55'
70°54'
70°54'
70°53'
70°53'
70°52'
70°52'
70°51'
70°51'
70°50'
70°50'
70°49'
70°49'
70°48'
70°48'
70°47'
70°47'
Benthic Nearfield Stations
Nahant
Deer Island
Hull

27
Finally, a panel of scientific experts convened by the EPA and MA DEP known as the Outfall Monitoring Science Advisory Panel (OMSAP) examines scientific data produced by the monitoring plan. OMSAP also serves as a peer review board for technical reports, and advises EPA and MA DEP on the implications of monitoring observations. Finally, OMSAP evaluates any exceedances under the Contingency Plan, described in the next section. Much more information on the ambient monitoring plan is available on the Internet. Documents directly associated with the permit can be found at: http://www.mwra.state.ma.us/harbor/html/ambient.htm Associated information and synthesis reports generated by ambient monitoring results can be found at: Boston Harbor: http://www.mwra.state.ma.us/harbor/html/wklyintr.htm Massachusetts Bay: http://www.mwra.state.ma.us/harbor/html/mbmon.htm The OMSAP web page, including announcements for public meetings, is at: http://www.epa.gov/region1/omsap/index.html
II.C.2 The Contingency Plan
The new permit requires a contingency plan that defines a response plan required when a parameter threshold is exceeded. Reponses may include changes in laboratory procedures, changes in treatment plant process, or, in a worse case scenario, examining the feasibility of re-opening the Deer Island harbor outfalls. Tables II.C.2.a-c show the thresholds for the parameters. The effluent and toxicity thresholds are set to be equal to the NPDES permit limits. However, the Contingency Plan includes a number of new thresholds related to parameters monitored under the Ambient Monitoring Plan in Massachusetts Bay.
Parameter Caution Level Warning LevelEffluent chlorine - 456 ug/L average monthly
631 ug/L maximum dailyEffluent PCBs 0.000045 ug/L monthly limit (as
Arochlors)-
Effluent toxicity - Acute: effluent LC50 < 50% for shrimp and fishChronic: effluent NOEC for fish growth and sea urchin fertilization < 1.5%
Water column initial dilution of effluent
- Effluent dilution predicted by EPA as basis for NPDES permit
Nearfield sediment toxics - NOAA Effects Range Median sediment guideline
Nearfield sediment toxics 90% EPA sediment criteria EPA sediment criteriaFish tissue mercury, near outfall 0.5 ug/g wet 0.8 ug/g wetFish tissue PCB, near outfall 1 ug/g wet 1.6 ug/g wetMussel tissue lead, near outfall 2 ug/g wet 3 ug/g wetFish tissue lipid-normalized toxics, near outfall
2 x baseline -
Flounder liver disease incidence Greater than harbor prevalence over time
-
Table II.C.2.a. Contingency Plan Thresholds: Toxic Contaminants

28
Parameter Caution Level Warning LevelEffluent total nitrogen 12,500 mtons/year 14,000 mtons/yearDissolved oxygen concentration, nearfield water column bottom, Stellwagen bottom (1)
6.5 mg/L for any survey during stratification (June-Oct.) unless background conditions are lower
6 mg/L for any survey during stratification (June-Oct.) unless background conditions are lower
Dissolved oxygen percent saturation, nearfield water column bottom, Stellwagen bottom (1)
80% saturation for any survey during stratification (June-Oct.) unless background conditions are lower
75% saturation for any survey during stratification (June-Oct.) unless background conditions are lower
Oxygen depletion rate, nearfield water column bottom
1.5 x baseline 2 x baseline
Nearfield water column chlorophyll 1.5 x baseline annual mean 2 x baseline annual mean
Nearfield water column chlorophyll 95th percentile of the baseline seasonal distribution
-
Nearfield water column nuisance algae (except Alexandrium )
95th percentile of the baseline seasonal mean
-
Nearfield water column zooplankton (2)
- -
Nearfield water column Alexandrium tamarense (3)
100 cells/L -
Farfield water column PSP extent (4)
New incidence -
Redox potential discontinuity, nearfield sediments
0.5 x baseline -
(4) The MWRA is continuing to work on improvements to the calculation of this threshold as proposed in its October 13, 2000 letter to the EPA and MADEP.
Table II.C.2.b. Contingency Plan Thresholds: Nutrients
(1) Included in Contingency Plan as an interim modification pursuant to Part I.8.d of the MWRA’s NPDES permit. MWRA will develop by July 1, 2001, and submit to OMSAP for its review, a proposed statistical approach to calculate the 5th- percentile of background conditions, as recommended in Attachment A of EPA’s and MADEP’s April 3, 2001 letter. Following OMSAP review, a final modification of the Caution and Warning Levels will be submitted by the MWRA to EPA and MADEP by November 15, 2001 pursuant to Part I.8.c of the permit. (2) The MWRA will report annually on appreciable changes to the zooplankton community in its Annual Water Column Report and in the Outfall Monitoring Overview. The MWRA also will report to EPA, MADEP and OMSAP by December 31, 2002 on the results of special zooplankton studies and evaluate whether a scientifically valid zooplankton community threshold can be developed. The MWRA also makes every effort to participate in workshops to investigate food web pathways in Massachusetts and Cape Cod bays sponsored by NOAA Fisheries.
(3) Included in Contingency Plan as an interim modification pursuant to Part I.8.d of the MWRA’s NPDES permit. By August 1, 2001, the MWRA will submit for OMSAP review either the 100 cells/liter threshold or an alternative caution level threshold value developed using a similar approach as recommended in Attachment A of EPA’s and MADEP’s April 3, 2001 letter. Following OMSAP review, a final modification of the Caution Level will be submitted by the MWRA to EPA and MADEP by November 15, 2001 pursuant to Part I.8.c of the permit. MWRA will also support a co-sponsored project in order to pursue targeted monitoring of Alexandrium . This effort will be conducted by an appropriate entity, upon EPA and MADEP approval.
Parameter Caution Level Warning Level
Effluent cBOD - 40 mg/L weekly25 mg/L monthly
Effluent fecal coliform - 14,000 fecal coliforms/100 mlEffluent TSS - 45 mg/L weekly
30 mg/L monthlyNearfield benthic diversity Appreciable change -Nearfield benthic opportunists 10% 25%Effluent floatables (5) - -
Effluent oil and grease (petroleum) -15 mg/L weekly
Plant performance 5 violations/year Noncompliance 5% of the timepH <6 or >9 at any timeFlow >436 MGD for an annual average dry day
Adapted from MWRA. 2001. Contingency Plan, Revision 1, May 2001. MWRA Report ENQUAD ms-071.
Table II.C.2.c. Contingency Plan Thresholds: Other Parameters
(5) Threshold currently under development by MWRA.

29
Under the Contingency Plan, two types of thresholds exist: a caution level and a warning level. Figure II.C.3 on the following page details the processes required by the Contingency Plan in case of a threshold exceedance. Table II.C.3 below details the Contingency Plan exceedances in FY03. For more information on these exceedances, please refer to the web site listed below.
Threshold LevelDate* Exceeded Threshold ExceededAugust 23 and 30, 2002 Warning (Effluent) Weekly effluent TSS above weekly limit of 45
mg/L; limit was exceeded for two consecutive weeks
September 6, 2002 Warning (Effluent) Monthyl effeluent TSS above monthly limit of 30 mg/L
December 9, 2002 Caution (Ambient)Summer average abundance for nuisance algae Phaeocystis above threshold of 334 cells/L
December 13, 2002 Caution (Ambient) Mussel bioaccumulation of PAHs and total chlorodane
Table II.C.3. Contingency Plan Exceedances, FY03
* Notification date; typically within 5 days of knowing of the violation. In addition to the thresholds, the Contingency Plan also requires several other unrelated items. First, the MWRA must update annually a technical survey regarding tertiary treatment systems designed to remove nutrients. Second, the Authority must maintain a nitrogen monitoring program at DITP to examine the need for tertiary treatment. Third, there must be a “dry run” of a Contingency Plan violation to assess the validity of the Contingency Plan structure. Fourth, $81 million must be held in reserve for emergency use. Finally, the old Boston Harbor outfalls must be maintained in case diversion of the effluent back to the Harbor is deemed necessary. More information on Contingency Plan topics is on the Internet at: http://www.mwra.state.ma.us/harbor/html/contingency.htm Exceedance reports are posted at: http://www.mwra.state.ma.us/harbor/html/exceed.htm

30
Figure II.C.3 Contingency Plan Flowchart

31
III: Combined Sewer Overflows
Overview MWRA monitors five CSO facilities in the North System. There are no CSO facilities in the South System. The monitoring results vary significantly between facilities because of differences in type and location. Location is especially important since storms can be highly localized – which will affect the level and intensity of rainfall at the CSO facility and the area that the facility serves. Each CSO facility screens and chlorinates combined wastewater (sewage and storm water) prior to discharge. Of the five CSO facilities, only the Cottage Farm and Prison Point facilities have pumping and tank storage capacity. Pumping and tank storage allows screened and chlorinated wastewater to be held at these facilities up to their storage capacities prior to discharge. Stored wastewater can eventually be pumped back into the system and processed at Deer Island. Any wastewater exceeding the storage capacity will overflow and discharged through the CSO outfalls. The other three CSO facilities – Somerville Marginal, Fox Point, and Commercial Point – are gravity CSO facilities, meaning that combined wastewater arrives and leaves the CSO facility by gravity instead of pumping. The combined wastewater is screened, chlorinated, and dechlorinated. The disinfected wastewater overflows to the receiving water as quickly as it arrives at the facility. A detailed description of the five CSO facilities can be found in Appendix H.

32
III.A.1 Cottage Farm Activations
Table III.A.1 and Figures III.A.1 and III.A.2 summarize activation data for the Cottage Farm CSO facility. Cottage Farm is hydraulically connected to Deer Island, so the increased pumping capacity at Deer Island is partially responsible for the general trend of decreasing activations since FY94. From FY02 to FY03, releases from Cottage Farm increased from 50.9 to 116.7 million gallons. Number of activations also increased. Substantially higher rainfall in FY03 probably accounts for this increase compared to FY02.
FY94 FY95 FY96 FY97 FY98 FY99 FY00 FY01 FY02 FY03Number of activations 31 25 26 24 19 11 19 15 8 14Number of days activated 31 25 33 29 22 13 24 18 10 16Total volume treated (MG) 621 574 918.49 1092.1 792.31 259 440.27 667.42 50.9 116.71Maximum flow (MGD) 123 100 94.02 199.23 113.62 47 86.04 223.37 13.4 20.62Minimum flow (MGD) 0.08 0.09 1.88 0.63 0.76 1.35 0.56 0.22 0.63 0.91Average flow (MGD) 20.032 22.96 27.833 37.659 36.014 19.923 18.345 37.08 5.09 7.29Total rainfall (inches) 45 37.4 42.55 48.79 50.87 32.41 46.08 41.02 34.14 43.51Average flow = Total volume treated divided by the number of days activated.
Table III.A.1. Cottage Farm CSO Activations Summary
Figure III.A.1. Cottage Farm CSO Activations Compared to Precipitation, FY94-03
31
2526
24
19
11
19
15
8
14
0
5
10
15
20
25
30
35
FY94 FY95 FY96 FY97 FY98 FY99 FY00 FY01 FY02 FY03
# of
act
ivat
ions
0
10
20
30
40
50
60
Rai
nfal
l (in
ches
)
Activations Rainfall

33
Figure III.A.2. Cottage Farm CSO Volume Treated Compared to Precipitation, FY94-03
0
200
400
600
800
1000
1200
FY94 FY95 FY96 FY97 FY98 FY99 FY00 FY01 FY02 FY03
Vol
ume
treat
ed (M
G)
0
10
20
30
40
50
60
Rai
nfal
l (in
ches
)
Volume Treated Rainfall
III.A.2 Cottage Farm Conventional Parameters
Table B-1 of Appendix B contains detailed data on conventional parameters in Cottage Farm effluent. Table III.A.2 below summarizes this data. As is the case with all five facilities covered in this chapter, Cottage Farm is a CSO facility that provides floatables control, chlorination, and dechlorination. Such a facility cannot provide the same level of treatment to the effluent as a full-fledged treatment plant such as Deer Island.
Parameter Minimum Average MaximumTSS (mg/L) 37.0 54.0 67.8BOD (mg/L) 22.8 57.6 84.7Fecal Coliform (col/100 mL) 10 90 3112pH (SU) 6.4 7.1
Table III.A.2. Cottage Farm CSO Effluent Characteristics, FY03
III.A.3 Cottage Farm Effluent Metals
For permit compliance, MWRA tests CSO effluent for metals and surfactants whenever the CSO facility is sampled. The results of these tests are presented in Appendix B, Tables B-2 and B-3. The six target metals detected in nearly every sample. Table III.A.3 summarizes average metal concentrations in Cottage Farm effluent in FY03.
Parameter Average Concentration Times DetectedCadmium (ug/L) 0.40 3 of 6Copper (ug/L) 38.23 3 of 3Lead (ug/L) 32.47 3 of 3Mercury (ug/L) 0.15 3 of 3Nickel (ug/L) 6.61 3 of 4Zinc (ug/L) 84.10 3 of 3
Table III.A.3. Cottage Farm CSO Effluent Metals, FY03

34
III.B.1 Prison Point Activations
Activation data for the Prison Point CSO facility are summarized in Table III.B.1 and Figures III.B.1 and III.B.2. Unlike the Cottage Farm facility, Prison Point is not hydraulically connected to the Deer Island Treatment Plant, so increased pumping at Deer Island will not affect Prison Point activations; hence they have remained relatively constant since FY94, primarily dependent on rainfall. The volume treated at Prison Point in FY03 was marginally greater than FY02. However, the average amount discharged per activation remained low compared to previous years, with the exception of the relatively dry FY02. Total number of activations increased slightly. Increased rainfall in FY03 is probably the cause of the increased volume discharged and more frequent activiations.
FY94 FY95 FY96 FY97 FY98 FY99 FY00 FY01 FY02 FY03Number of activations 26 26 24 26 32 23 25 24 22 26Number of days activated 26 26 29 30 34 23 30 26 27 27Total volume treated (MG) 449 460 445 925.82 958 396 739.5 634.05 201.23 280.71Maximum flow (MGD) 80.32 127 62.6 228 143 51 149 188 24.5 31.34Minimum flow (MGD) 3.01 1.63 1.24 1.5 2 1.4 2.5 1 0.41 0.47Average flow (MGD) 17.27 17.69 15.34 30.86 28.18 17.22 24.65 24.39 7.45 10.4Total rainfall (inches) 45 37.4 42.55 48.79 50.87 32.41 46.08 41.02 34.14 43.51Average flow = Total volume treated divided by the number of days activated.
Table III.B.1. Prison Point CSO Activations Summary
Figure III.B.1. Prison Point CSO Activations Compared to Precipitation, FY94-03
26 2624
26
32
2325
2422
26
0
5
10
15
20
25
30
35
FY94 FY95 FY96 FY97 FY98 FY99 FY00 FY01 FY02 FY03
# of
act
ivat
ions
0
10
20
30
40
50
60
Rai
nfal
l (in
ches
)
Activations Rainfall

35
Figure III.B.2. Prison Point CSO Volume Treated Compared to Precipitation, FY94-03
0
200
400
600
800
1000
1200
FY94 FY95 FY96 FY97 FY98 FY99 FY00 FY01 FY02 FY03
Vol
ume
treat
ed (M
G)
0
10
20
30
40
50
60
Rai
nfal
l (in
ches
)
Volume Treated Rainfall
III.B.2 Prison Point Conventional Parameters
Conventional parameter data for Prison Point effluent are provided in Appendix C, Tables C-1 and C-2. Table III.B.2 summarizes that data.
Parameter Minimum Average MaximumTSS (mg/L) 32.5 76.5 248.5BOD (mg/L) 6.0 22.6 35.8Fecal Coliform (col/100 mL) 10 96 1177pH (SU) 6.2 7.0
Table III.B.2. Prison Point CSO Effluent Characteristics, FY03
III.B.3 Prison Point Effluent Metals
The results of priority pollutant testing for Prison Point can be found in Tables C-2 and C-3 of Appendix C. As with Cottage Farm, the target metals were detected in nearly all of the samples. Table III.B.3 summarizes average metals concentrations in FY03 Prison Point effluent.
Parameter Average Concentration Times DetectedCadmium (ug/L) 0.57 3 of 6Copper (ug/L) 42.17 3 of 3Lead (ug/L) 56.77 3 of 3Mercury (ug/L) 0.07 3 of 3Nickel (ug/L) 3.24 3 of 5Zinc (ug/L) 137.67 3 of 3
Table III.B.3. Prison Point CSO Effluent Metals, FY03

36
III.C.1 Somerville Marginal Activations
Table III.C.1 and Figures III.C.1 and III.C.2 summarize activation information for the Somerville Marginal facility. Recently, there has been increased attention to SSOs (Sanitary Sewer Overflows); see Chapter V for more information. MWRA has intensified its monitoring efforts at areas known to overflow where there is a measurable rainfall event. In coordination with this increased SSO monitoring, MWRA has monitored its unmanned gravity CSO facilities of Somerville Marginal, Fox Point, and Commercial Point more frequently. As a result, the statistics for FY98 and after may not be strictly comparable to the earlier years. As with Cottage Farm and Prison Point, the volume discharged increased in FY03 compared to FY02. Again, increased rainfall is the most obvious explanation.
FY94 FY95 FY96 FY97 FY98 FY99 FY00 FY01 FY02 FY03Number of activations 34 28 28 28 30 19 28 17 29 26Number of days activated 34 28 30 29 31 19 34 21 30 28Total volume treated (MG) 72 49 80.04 142.24 127.81 57.32 113.8 90.9 33.87 54.05Maximum flow (MGD) 11 14 8.5 64.18 21.72 10.29 25.06 33 5.1 6.76Minimum flow (MGD) 0.006 0.158 0.25 0.13 0.09 0.04 0.01 0.09 0.02 0.05Average flow (MGD) 2.12 1.75 2.67 4.90 4.12 3.02 3.35 4.33 1.17 1.93Total rainfall (inches) 45 37.4 42.55 48.79 50.87 32.41 46.08 41.02 34.14 43.51Average flow = Total volume treated divided by the number of days activated.
Table III.C.1. Somerville Marginal CSO Activations Summary
Figure III.C.1. Somerville Marginal CSO Activations Compared to Precipitation, FY94-03
34
28 28 2830
19
28
17
29
26
0
5
10
15
20
25
30
35
40
FY94 FY95 FY96 FY97 FY98 FY99 FY00 FY01 FY02 FY03
# of
act
ivat
ions
0
10
20
30
40
50
60
Rai
nfal
l (in
ches
)
Activations Rainfall

37
Figure III.C.2. Somerville Marginal CSO Volume Treated Compared to Precipitation, FY94-03
0
20
40
60
80
100
120
140
160
FY94 FY95 FY96 FY97 FY98 FY99 FY00 FY01 FY02 FY03
Vol
ume
treat
ed (M
G)
0
10
20
30
40
50
60
Rai
nfal
l (in
ches
)
Volume Treated Rainfall
III.C.2 Somerville Marginal Conventional Parameters
Somerville Marginal conventional parameter data is provided in Appendix D, and summarized below in Table III.C.2.
Parameter Minimum Average MaximumTSS (mg/L) 26.7 59.3 101.0BOD (mg/L) 6.8 8.6 11.2Fecal Coliform (col/100 mL) 10 182 126000pH (SU) 6.5 8.2
Table III.C.2. Somerville Marginal CSO Effluent Characteristics, FY03
III.C.3 Somerville Marginal Effluent Metals
The results of Somerville Marginal priority pollutant testing can be found in Appendix D, Tables D-2 and D-3. As with the other CSO facilities, the target metals were detected in most of the samples. Table III.C.3 summarizes the average metals concentration in FY03.
Parameter Average Concentration Times DetectedCadmium (ug/L) 0.32 4 of 8Copper (ug/L) 22.58 4 of 4Lead (ug/L) 35.43 4 of 4Mercury (ug/L) 0.07 4 of 4Nickel (ug/L) 4.18 4 of 6Zinc (ug/L) 96.15 4 of 4
Table III.C.3. Somerville Marginal CSO Effluent Metals, FY03

38
III.D.1 Fox Point Activations
Table III.D.1 and Figures III.D.1 and III.D.2 summarize activation data for the Fox Point CSO facility. In FY03, the number of activations and volume discharged increased, as they did at most of the other CSO facilities due to the increased rainfall.
FY94 FY95 FY96 FY97 FY98 FY99 FY00 FY01 FY02 FY03Number of activations 20 4 12 16 21 12 23 17 28 30Number of days activated 20 4 14 18 24 12 25 20 28 33Total volume treated (MG) 76 24 96.63 153.81 166 59.3 96.93 65.69 50.26 75.92Maximum flow (MGD) 12 10 17.23 45.16 39 14.8 24.66 16.16 5.67 7.16Minimum flow (MGD) 0.4 1.5 1.09 0.26 0.171 0.31 0.47 0.03 0.2 0.06Average flow (MGD) 3.8 6 6.90 8.55 6.92 4.94 3.88 3.28 1.79 2.3Total rainfall (inches) 45 37.4 42.55 48.79 50.87 32.41 46.08 41.02 34.14 43.51Average flow = Total volume treated divided by the number of days activated.
Table III.D.1. Fox Point CSO Activations Summary
Figure III.D.1. Fox Point CSO Activations Compared to Precipitation, FY94-03
20
4
12
16
21
12
23
17
2830
0
5
10
15
20
25
30
35
FY94 FY95 FY96 FY97 FY98 FY99 FY00 FY01 FY02 FY03
# of
act
ivat
ions
0
10
20
30
40
50
60
Rai
nfal
l (in
ches
)
Activations Rainfall
Figure III.D.2. Fox Point CSO Volume Treated Compared to Precipitation, FY94-
03
0
20
40
60
80
100
120
140
160
180
FY94 FY95 FY96 FY97 FY98 FY99 FY00 FY01 FY02 FY03
Vol
ume
treat
ed (M
G)
0
10
20
30
40
50
60
Rai
nfal
l (in
ches
)
Volume Treated Rainfall

39
III.D.2 Fox Point Conventional Parameters
Appendix E, Table E-1, provides data on conventional pollutants collected at Fox Point in FY03. Results are summarized below in Table III.D.2.
Parameter Minimum Average MaximumTSS (mg/L) 19.8 43.2 75.0BOD (mg/L) 1.8 5.4 14.0Fecal Coliform (col/100 mL) 10 11 18pH (SU) 7.0 8.2
Table III.D.2. Fox Point CSO Effluent Characteristics, FY03
III.D.3 Fox Point Effluent Metals
The results of sampling for priority pollutants at Fox Point can be found in Appendix E, Tables E-2 and E-3. Table III.D.3 summarizes the average metals concentrations in FY03.
Parameter Average Concentration Times DetectedCadmium (ug/L) 0.12 1 of 5Copper (ug/L) 14.02 5 of 5Lead (ug/L) 23.29 4 of 5Mercury (ug/L) 0.06 4 of 4Nickel (ug/L) 4.22 3 of 5Zinc (ug/L) 75.35 4 of 4
Table III.D.3. Fox Point CSO Effluent Metals, FY03

40
III.E.1 Commercial Point Activations
Data on Commercial Point activations can be found in Appendix F, and in the table and two figures below. Commercial Point was the only facility that discharged less – volume-wise and activation-wise – in FY03 than FY02, despite the increased rainfall in FY03. The average flow per activation also decreased.
FY94 FY95 FY96 FY97 FY98 FY99 FY00 FY01 FY02 FY03Number of activations 25 19 13 23 25 20 32 19 32 30Number of days activated 25 19 14 24 28 20 36 24 35 32Total volume treated (MG) 93 55.95 70.14 158.14 124.74 62.78 101.33 93.77 79.23 64.5Maximum flow (MGD) 16.52 16.7 18.42 53.86 25 12.39 30.42 30.84 7.8 7.3Minimum flow (MGD) 0.21 0.15 0.06 0.19 0.14 0.1 0.03 0.06 0.2 0.05Average flow (MGD) 3.72 2.94 5.01 6.59 4.46 3.14 2.81 3.91 2.26 2.02Total rainfall (inches) 45 37.47 42.55 48.79 50.87 32.41 46.08 41.02 34.14 43.51Average flow = Total volume treated divided by the number of days activated.
Table III.E.1. Commercial Point CSO Activations Summary
Figure III.E.1. Commercial Point CSO Activations Compared to Precipitation, FY94-03
25
19
13
2325
20
32
19
3230
0
5
10
15
20
25
30
35
FY94 FY95 FY96 FY97 FY98 FY99 FY00 FY01 FY02 FY03
# of
act
ivat
ions
0
10
20
30
40
50
60
Rai
nfal
l (in
ches
)
Activations Rainfall
Figure III.E.2. Commercial Point CSO Volume Treated Compared to
Precipitation, FY94-03
0
20
40
60
80
100
120
140
160
180
FY94 FY95 FY96 FY97 FY98 FY99 FY00 FY01 FY02 FY03
Vol
ume
treat
ed (M
G)
0
10
20
30
40
50
60
Rai
nfal
l (in
ches
)
Volume Treated Rainfall

41
III.E.2 Commercial Point Conventional Parameters
Appendix F, Table F-1 presents data for conventional parameters sampled at Commercial Point in FY03. Results are summarized in Table III.E.2 below.
Parameter Minimum Average MaximumTSS (mg/L) 32.0 106.6 148.0BOD (mg/L) 9.5 13.9 19.8Fecal Coliform (col/100 mL) 10 12 14pH (SU) 6.4 8.0
Table III.E.2. Commercial Point CSO Effluent Characteristics, FY03
III.E.3 Commercial Point Effluent Metals
Table III.E.3 summarizes data from Appendix F, Tables F-2 and F-3 regarding priority pollutants at Commercial Point. Metals were found in detectable amounts in nearly all the samples.
Parameter Average Concentration Times DetectedCadmium (ug/L) 0.28 2 of 3Copper (ug/L) 24.40 2 of 2Lead (ug/L) 49.80 2 of 2Mercury (ug/L) 0.24 2 of 2Nickel (ug/L) 4.01 3 of 3Zinc (ug/L) 93.05 2 of 2
Table III.E.3. Commercial Point CSO Effluent Metals, FY03

42
IV: Sludge Processing
Overview In December 1991, the MWRA ceased discharge of sludge into Boston Harbor. The sludge was then sent to a new plant located on the Fore River in Quincy for processing into fertilizer pellets.
IV.A Pelletizing Process
The pelletizing process begins at the Deer Island Treatment Plant, where gravity thickeners handle sludge and scum from the plant’s primary batteries. Centrifuges thicken secondary sludge and scum, with the help of added polymers. Centrate, or the liquid produced by these processes, is sent back to the head of the plant for treatment. The thickened product is then transferred to Deer Island’s most distinctive feature, the egg-shaped anaerobic digesters. In the digesters, bacteria break down the sludge into methane, carbon dioxide, organic material, and water. The methane is tapped, stored, and used later to generate electrical power or heat for Deer Island. The digested sludge is centrifuged again and then is barged across the Harbor to the Fore River Pelletizing facility. At the pelletizing plant, centrifuges dewater the sludge into “cake,” and dryers further process the sludge into the fertilizer pellets. The centrate from the centrifuges is barged back to Deer Island for treatment. The pellets, marketed as “Bay State Fertilizer,” are stored at the facility after production. They can either be packaged on-site, or loaded and shipped out in bulk by rail. Bay State Fertilizer is available in limited quantities to the general public, and is more widely available to local municipalities and for wholesale purchase. In the future, sludge will be transferred to the Fore River facility via two tunnels built inside the Inter-Island Tunnel, and a connection from Nut Island (the southern terminus of the Inter-Island Tunnel) to the pelletizing facility. This connection will obviate the need for barging sludge.
IV.B Sludge Pellet Regulations
Both the federal government and the Commonwealth of Massachusetts have regulations for the composition of fertilizer pellets. The federal government regulates copper, molybdenum, nickel, zinc, arsenic, cadmium, lead, mercury, and selenium. Massachusetts sets limits for all of the above except arsenic and selenium, while adding limits for boron and chromium. In most cases the Massachusetts standard are tougher than the federal standards. Meeting these regulations has generally not been a problem for the MWRA or its contractor, New England Fertilizer Company. Table IV.B.1 (next page) summarizes the applicable standards.

43
Due to the February 19 annual submittal date for sludge data, complete data is not available for FY03 operations. However, in calendar year 2002 (CY02; the latest available data), there were no violations of federal standards for sludge pellets. In five months there were violations of the Massachusetts standard for molybdenum. Table IV.B.2 summarizes the analytical results. The plant processed 32,522 dry tons of sludge in CY02.
Parameter Federal Limit (ppm) Massachusetts Type 1* Limit (ppm)Arsenic 41 NRBoron NR 300Cadmium 39 14Chromium NR 1000Copper 1500 1000Lead 300 300Mercury 17 10Molybdenum 75 25Nickel 420 200Selenium 100 NRZinc 2800 2500NR: Not regulated
*: Type 1 pellets are certified for marketing and distribution in Massacusetts by MADEP
Table IV.B.1 Federal and State Limits for Sludge Pellet Metals

44
Parameter Jan-02 Feb-02 Mar-02 Apr-02 May-02 Jun-02 Jul-02 Aug-02 Sep-02 Oct-02 Nov-02 Dec-02Arsenic (mg/kg, dry weight) ND ND ND ND ND ND ND ND ND ND ND NDBoron (mg/kg, dry weight) ND ND ND ND ND ND ND ND ND ND ND NDCadmium (mg/kg, dry weight) 3.6 3.5 3.7 3.1 2.7 2.7 2.4 2.3 1.8 1.9 2.4 3.0Chromium (mg/kg, dry weight) 59.1 53.2 56.1 61.0 59.3 60.0 51.4 48.6 45.9 50.6 56.2 54.0Copper (mg/kg, dry weight) 695.2 696.8 692.3 716.3 766.4 751.3 759.2 812.3 831.0 780.4 826.3 773.2Lead (mg/kg, dry weight) 187.2 197.3 205.5 210.0 200.4 213.5 217.6 192.8 194.3 193.0 188.5 181.6Mercury (mg/kg, dry weight) 3.6 4.0 4.2 4.0 4.0 4.1 4.1 4.0 4.0 3.8 4.2 4.0Molybdenum (mg/kg, dry weight) 35.9 23.2 17.6 17.7 18.4 17.9 24.1 33.7 40.0 36.8 33.0 27.5Nickel (mg/kg, dry weight) 27.0 24.3 25.8 23.9 28.5 29.9 27.9 24.0 24.0 25.9 27.6 32.2Selenium (mg/kg, dry weight) 4.3 3.5 4.8 4.5 4.2 4.0 4.2 5.3 3.9 3.4 2.4 3.5Zinc (mg/kg, dry weight) 1110.0 1090.0 1040.0 1095.0 1148.0 1160.0 1194.0 1277.5 1282.5 1214.0 1232.5 1218.0ND: No dataBold indicates violations of the MADEP limits for Type 1 sludge. There were no violation of the federal limits.
Table IV.B.2 Summary of Sludge Pellet Analysis, Calendar Year 2002

45
V: Transport Systems
V.A.1 North System Headworks Choking
Figure V.A.1 below shows the number of hours of maintenance- and rain-related choking at the remote headworks since FY94. Testing and maintenance hours have steadily declined as the MWRA has completed the new DITP.
Figure V.A.1. Choking, FY94-03
0
200
400
600
800
1000
1200
1400
FY94 FY95 FY96 FY97 FY98 FY99 FY00 FY01 FY02 FY03
Cho
king
(hou
rs)
Heavy Rain & Flow Testing & Maintenance
Figure V.A.2 shows the influence of the number of rainy days in a year on the hours of rain-related choking. A rainy day is defined as a day with at greater than 0.09 inches of rainfall. As this figure shows, FY03 had slightly more rainy days than FY02 and more rain-related choking hours. Differences in storm intensity between the years can explain years that have similar amounts of rainy days yet vastly different choking hours (i.e., FY96 versus FY98 and FY02 versus FY03).
Figure V.A.2. Rain-Related Choking, FY94-03
0
100
200
300
400
500
600
700
800
900
FY94 FY95 FY96 FY97 FY98 FY99 FY00 FY01 FY02 FY03
Cho
king
(hou
rs)
0
10
20
30
40
50
60
70
80
90#
of ra
iny
days
Heavy Rain & Flow Rainy Days

46
Choking for maintenance purposes is plotted in Figure V.A.3. Maintenance choking peaked in FY95 due to the maintenance and testing involved in bringing the new primary treatment plant on-line. From FY96 to FY98 the number of hours of maintenance-related choking continued to be fairly high because of maintenance and testing related to the startup of the new primary and secondary treatment plants. For example, in FY98, of the approximately 580 choking hours related to testing and maintenance, 442 hours were due to testing. Since there were no new systems to test in FY99, there was a significant decrease in the testing/maintenance choking hours from FY98 to FY99. Testing and maintenance increased in FY01 due to the finishing of both secondary Battery C and the outfall tunnel. With no new systems in FY02 and FY03, choking due to testing and maintenance fell to minimal levels.
Figure V.A.3. Testing and Maintenance-related Choking, FY94-03
0
200
400
600
800
1000
1200
1400
FY94 FY95 FY96 FY97 FY98 FY99 FY00 FY01 FY02 FY03
Cho
king
(hou
rs)
Testing & Maintenance
V.A.2 North System Sanitary Sewer Overflows
MWRA monitors sanitary sewer overflows (SSOs) visually and with meters in both the North and South Systems. SSOs occur when extreme rainfall overwhelms the transport system. Note that SSOs differ from CSOs (combined sewer overflows) in that CSO relief points are pipes that were specifically designed to relieve the combined sewer system. When the system becomes overloaded, these CSOs discharge combined sewage and storm water into a receiving body of water, such as the Charles River. SSOs, on the other hand, are weak points in the separate system, such as manholes, which will overflow during heavy rain events. There were only two reported overflows in FY03 for the North System (see Table V.A.1 on the next page). However, this count includes only overflows at MWRA-owned overflow areas. There may be overflows for which the local municipalities are responsible. MWRA monitors these local overflows less frequently, and only when requested to do so by municipalities or notified of a problem by concerned citizens. A list of all the known overflow locations in MWRA lines is provided in Appendix H, Table H-4.

47
V.B South System Sanitary Sewer Overflows
There were eight overflows at two locations in the South System in FY03.
V.C Inflow and Infiltration
Inflow and infiltration (I/I) is a potentially serious problem that affects all sewerage systems. The NPDES permit requires the MWRA to address issues associated with I/I. Inflow is defined as the introduction of non-sanitary sewer water such as stormwater, residential basement pump-out, and industrial cooling water, into sanitary sewers. Infiltration is the leakage of groundwater into sewage lines through cracks, inadequately sealed joints, etc. In both cases, this additional load decreases system capacity, potentially leading to SSOs. I/I poses both a wet and dry weather problem; however, wet weather exacerbates I/I problems. A summary of all actions minimizing I/I is prepared annually by MWRA. In addition, the MWRA participates in a Regional I/I Task Force responsible for creating a Regional I/I Reduction Plan for both MWRA and local community collection systems. The I/I Task Force includes MWRA staff, state regulators, and representatives from local communities. To reduce I/I, the MWRA “may consider incentive programs, rate structures, grant and loan programs, technical assistance and public education efforts as well as regulatory and enforcement mechanisms…” (permit section 18.bb.iv) As of the end of FY03, MWRA has submitted the Regional I/I Reduction Plan for regulatory review. Find permit-related I/I materials at: http://www.mwra.state.ma.us/harbor/html/operations.htm
Location FY02 FY03Section 133B Framingham 0 1Section 107 Medford 0 1
Table V.A.1. Sanitary Sewer Overflows, North System, FY02-03Number of Overflows
Location FY02 FY03Section 628 Braintree (Pearl Street) 0 1Section 626 Braintree/Weymouth (Smelt Brook) 0 7
Table V.B.1. Sanitary Sewer Overflows, South System, FY02-03Number of Overflows

48
VI: Miscellaneous NPDES Permit Requirements
Overview The MWRA’s NPDES permit includes a number of other sections other than effluent quality for Deer Island and the CSO facilities, making it one of the most comprehensive permits ever issued by EPA.
VI.A Facility Best Management Practices Plans
Best Management Practices Plans (BMPs) are designed to minimize the environmental impact of MWRA facilities. The MWRA has developed plans for the following facilities:
• Deer Island Treatment Plant • Nut Island Headworks • Ward Street Headworks • Columbus Park Headworks • Chelsea Creek Headworks • Cottage Farm CSO facility • Prison Point CSO facility • Somerville Marginal CSO facility • Fox Point CSO facility • Commercial Point CSO facility • Fore River Pelletizing Plant
The objectives of BMPs are “(1) minimize the potential for violations of the permit, (2) protect the designated water uses of the surrounding water bodies, and (3) mitigate pollution from materials storage areas, site runoff, improper use of waste disposal system, accidental spillage, etc.” (permit section 9.a) BMPs are available at the above facilities or by request.
VI.B Water Conservation / Dry Day Flow Limit
As described in the Executive Summary, one of the requirements of the permit is the adherence to a 436 MGD dry day flow limit. In FY03, the MWRA was well within compliance for this limit. See Figure 2 in the Executive Summary for details. If dry day flow reaches 415 MGD, MWRA cannot accept new connections larger than 1.4 MGD. Additionally, a report is prepared annually documenting the MWRA’s demand management program. The demand management program, run with the cooperation of member communities, reviews historical water and wastewater use, and looks at the effectiveness of past and future conservation programs. Find permit-related water conservation and dry day flow limit materials at: http://www.mwra.state.ma.us/harbor/html/flow.htm
VI.C Pollution Prevention Program
The pollution prevention requirement of the permit requires MWRA to develop strategies to reduce pollutant loadings from households and permitted industries in the service area. The main target of the program is

49
polychlorinated biphenyls, or PCBs, a known human carcinogen. Manufacture of PCBs has been banned for several decades; however, quantities remain in the environment. The other main aspect of the program is the development of educational materials regarding domestic household hazardous waste, with the aim of preventing those materials from entering the MWRA sewerage system through proper disposal techniques. For more information on the MWRA’s pollution prevention program, visit: http://www.mwra.state.ma.us/harbor/html/pollution.htm
VI.D Groundwater Remediation
Currently, groundwater remediation site waters cannot be discharged into the MWRA sewer system. If this prohibition is ever relaxed, a comprehensive assessment of its effects on the sewage system and treatment process is required. As of the end of FY03, no action has been taken on this section.
VI.E Local Limits and Industrial Pretreatment Programs
These two related programs deal exclusively with non-domestic users, which are primarily industry. Under the local limits program, the MWRA develops and enforces specific limits on effluent from industrial users. The industrial pretreatment program requires the MWRA to inspect and sample industrial users as specified by 40 CFR (Code of Federal Regulations) Part 403. 40 CFR Part 403 is designed as a source reduction program to limit the amount of pollutants in treatment plant influent. Both programs result in cleaner influent to Deer Island, reducing stress on the plant, improving the efficiency of the treatment process, and reducing “pass-through” of contaminants to the effluent. Additionally, the sludge produced is cleaner and more amenable to safe fertilizer production. More information on local limits and the pretreatment program is on-line at: http://www.mwra.state.ma.us/harbor/html/local.htm
VI.F Reporting
Finally, the permit also requires the MWRA to provide the public with easy access to permit compliance reports and other information. MWRA maintains a NPDES permit website at: http://www.mwra.state.ma.us/harbor/html/ditp_performance.htm EPA maintains an electronic mailing list for permit-related announcements: http://www.epa.gov/region1/eco/mwra/listserv.html Finally, there are two library repositories for permit documents: MWRA Library Hyannis Public Library Charlestown Navy Yard 401 Main Street 100 First Avenue Hyannis, MA 02601 Boston, MA 02129

Appendix A Table A-1 Deer Island Treatment Plant Operations Summary, Fiscal Year 2002 Table A-2 Deer Island Influent Characterization (North & South Systems), Fiscal Year 2002 Table A-3 Deer Island Influent Loadings (North & South Systems), Fiscal Year 2002 Table A-4 Deer Island Influent Characterization (North System), Fiscal Year 2002 Table A-5 Deer Island Influent Loadings (North System), Fiscal Year 2002 Table A-6 Deer Island Influent Characterization (South System), Fiscal Year 2002 Table A-7 Deer Island Influent Loadings (South System), Fiscal Year 2002 Table A-8 Deer Island Effluent Characterization, Fiscal Year 2002 Table A-9 Deer Island Effluent Loadings, Fiscal Year 2002 Table A-10 Deer Island Effluent Characterization (DEC), Fiscal Year 2002 Table A-11 Deer Island Effluent Loadings (DEC), Fiscal Year 2002

North System InfluentJul Aug Sep Oct Nov Dec Jan Feb Mar Apr May Jun Min Average Max
Flow (mgd)Average 195.7 195.7 201.7 210 265.3 297.1 266.8 244.3 298.4 332.7 242.6 275.2 252.1Minimum 171.4 171.4 167.7 178.7 196.1 206.3 208.8 193.3 233.4 259.3 201.7 217.2 167.7Maximum 274.2 333.2 333.9 492.9 514.4 647.4 478.3 482.6 540.9 575.4 470.5 274.2 647.4
Temperature (deg F)Average 71.4 72.8 70.9 69.2 66.9 63.3 60.1 59.9 58.4 58.7 61.1 64.8 64.8Minimum 68.5 68.7 68.5 64.2 55.2 59.5 54.7 51.3 51.8 50.4 50.2 60.4 50.2Maximum 75.2 77.0 73.8 73.2 81.3 69.3 64.4 64.8 64.4 67.3 66.4 70.7 81.3
pH (SU)Average 6.4 6.7 6.8 6.8 6.9 6.9 6.9 6.9 6.8 6.7 6.7 6.6 6.8Minimum 5.8 6.3 6.4 6.5 6.4 6.6 6.6 6.1 6.5 6.1 6.2 6.2 5.8Maximum 6.9 7.2 7.1 7.1 7.2 7.3 7.3 7.2 7.0 7.0 7.3 7.0 7.3
North System Influent: Conventional Parameters (mg/L)Jul Aug Sep Oct Nov Dec Jan Feb Mar Apr May Jun Min Average Max
Total Suspended SolidsAverage 207 227 231 241 228 161 157 198 181 167 184 183 197Minimum 130 152 152 150 126 88 68 108 88 96 110 124 68Maximum 283 308 412 417 375 265 310 300 368 320 260 266 417
cBODAverage 118 126 123 127 111 88 92 98 82 73 102 95 103Minimum 76 102 77 84 48 50 48 51 44 48 72 62 44Maximum 164 149 195 185 163 139 143 126 127 101 130 172 195
Settleable Solids (mL/L)Average 5.5 8.6 6.6 8.9 7.6 4.4 6.7 7.4 6.1 4.6 6.2 5.5 6.5Minimum 3.0 3.0 2.0 4.5 1.8 0.9 0.6 3.0 0.5 0.3 4.0 2.0 0.3Maximum 10.0 52.0 9.5 16.0 20.0 8.0 20.0 15.0 15.0 12.0 12.0 15.0 52.0
Total SolidsAverage 1515 1525 1688 1573 1327 1129 1360 1549 1194 1211 1093 1149 1359Minimum 892 932 820 936 808 720 976 1020 844 916 848 784 720Maximum 2550 2130 2940 2210 2750 2050 2060 2420 1660 2060 1580 1560 2940
Volatile SolidsAverage 448 455 481 393 338 265 294 348 309 294 312 350 357Minimum 244 288 224 220 192 144 188 180 188 152 212 184 144Maximum 796 700 840 620 720 400 372 508 444 612 388 540 840
Volatile Suspended SolidsAverage 178 197 199 209 198 137 139 172 157 144 161 158 171Minimum 118 134 134 130 106 84 59 88 68 78 98 104 59Maximum 224 264 352 363 325 235 288 264 332 270 230 250 363
Table A-1. Deer Island Treatment Plant Operations Summary, FY03
Annual
Annual
A-1

North System Influent: Conventional Parameters (mg/L; cont.)Jul Aug Sep Oct Nov Dec Jan Feb Mar Apr May Jun Min Average Max
BODAverage 168 182 186 191 183 137 137 155 145 126 164 171 162Minimum 98 144 120 135 88 83 67 74 75 81 126 97 67Maximum 288 284 314 259 287 232 194 232 256 174 242 415 415
CODAverage 442 497 460 450 409 322 315 380 344 308 394 334 388Minimum 289 388 343 295 201 205 176 217 190 208 256 248 176Maximum 642 679 674 577 595 446 428 617 506 494 636 531 679
ChlorideAverage 557 592 633 586 483 422 552 638 459 468 373 389 513Minimum 280 294 246 298 229 209 210 327 268 346 216 223 209Maximum 963 946 1190 995 1120 1100 1050 1050 932 785 613 585 1190
North System Influent: Nutrients (mg/L)Jul Aug Sep Oct Nov Dec Jan Feb Mar Apr May Jun Min Average Max
AmmoniaAverage 19.9 24.2 21.0 22.9 13.6 14.2 18.7 19.9 14.4 14.0 18.4 18.0 18.3Minimum 18.2 18.4 16.8 19.5 10.3 11.0 13.0 19.9 11.4 11.7 12.4 13.7 10.3Maximum 22.2 29.7 26.9 28.0 16.8 18.2 22.8 19.9 18.0 15.3 21.1 28.7 29.7
NitriteAverage 0.14 0.07 0.36 0.37 0.26 0.68 0.21 0.18 0.09 0.26 0.24 0.54 0.28Minimum 0.01 0.01 0.03 0.09 0.18 0.25 0.01 0.18 0.01 0.03 0.01 0.01 0.01Maximum 0.36 0.20 1.16 0.80 0.33 1.03 0.45 0.18 0.32 0.60 0.69 0.93 1.16
NitrateAverage 0.06 0.01 0.04 0.05 0.20 0.45 0.15 0.01 0.01 0.19 0.08 0.14 0.12Minimum 0.01 0.01 0.01 0.01 0.01 0.01 0.01 0.01 0.01 0.01 0.01 0.01 0.01Maximum 0.24 0.01 0.08 0.10 0.39 0.93 0.43 0.01 0.01 0.87 0.23 0.45 0.93
Total Kjeldahl NitrogenAverage 29.9 38.0 41.2 39.9 26.5 25.3 28.9 31.6 24.5 23.6 29.3 31.2 30.8Minimum 16.1 29.4 32.6 33.3 23.6 17.8 19.4 31.6 18.5 20.0 25.8 22.3 16.1Maximum 39.2 42.4 49.8 47.7 29.4 29.9 33.1 31.6 29.3 25.4 31.4 48.8 49.8
OrthophosphatesAverage 2.4 3.1 2.7 2.9 1.3 1.4 2.1 2.3 1.4 1.4 1.9 2.4 2.1Minimum 2.3 2.7 2.2 2.6 1.0 0.9 1.1 2.3 0.9 1.2 1.1 1.7 0.9Maximum 2.5 3.6 2.9 3.5 1.5 1.9 2.9 2.3 2.0 1.7 2.2 4.2 4.2
Total PhosphorusAverage 4.9 5.8 5.8 6.4 4.5 3.9 4.6 4.9 3.7 3.5 4.6 6.2 4.9Minimum 4.5 4.8 4.7 5.6 4.3 2.6 3.3 4.9 2.7 2.4 3.4 4.1 2.4Maximum 5.9 7.0 7.0 7.4 4.6 5.0 5.1 4.9 4.5 3.9 5.0 10.3 10.3
Annual
Annual
Table A-1. Deer Island Treatment Plant Operations Summary, FY03 (cont.)
A-2

South System InfluentJul Aug Sep Oct Nov Dec Jan Feb Mar Apr May Jun Min Average Max
Flow (mgd)Average 86.6 75.0 83.6 85.7 121.0 159.8 145.6 116.2 167.4 194.6 127.3 145.5 125.7Minimum 70.8 63.0 69.9 75.5 80.4 105.6 100.5 88.2 130.2 149.3 99.4 100.4 63.0Maximum 101.6 90.2 94.7 125.7 227.4 259.4 253.1 207.2 272.9 303.4 155.3 211.8 303.4
Temperature (deg F)Average 68.4 70.3 69.6 66.3 61.2 57.2 53.4 53.9 52.1 54.1 57.2 60.2 60.3Minimum 65.3 68.5 67.8 61.7 57.4 53.6 51.4 48.4 45.5 49.5 54.5 56.5 45.5Maximum 77.9 74.5 71.6 72.1 67.3 67.3 58.8 65.3 72.0 78.8 63.1 68.0 78.8
pH (SU)Average 6.7 6.6 6.5 6.5 6.4 6.3 6.0 6.2 6.4 6.4 6.4 6.5 6.4Minimum 6.4 6.4 6.3 6.2 6.1 6.0 5.5 5.7 6.2 6.1 6.0 6.2 5.5Maximum 6.9 6.8 6.8 7.0 6.9 6.7 6.8 6.6 6.7 6.8 6.7 6.8 7.0
South System Influent: Conventional Parameters (mg/L)Jul Aug Sep Oct Nov Dec Jan Feb Mar Apr May Jun Min Average Max
Total Suspended SolidsAverage 118 130 120 120 111 101 258 212 138 189 318 158 164Minimum 84 104 68 76 70 66 72 92 64 56 158 80 56Maximum 162 192 196 220 180 144 604 392 228 468 520 228 604
cBODAverage 126 146 134 123 96 71 113 135 77 93 144 97 113Minimum 96 104 100 73 39 41 40 62 41 29 81 64 29Maximum 156 197 189 160 179 105 223 213 118 241 364 156 364
Settleable Solids (mL/L)Average 4.7 5.9 5.3 5.5 5.1 5.2 16.1 13.9 8.5 10.6 20.5 7.1 9.0Minimum 2.0 3.5 2.5 2.0 0.3 2.0 3.5 4.0 3.5 2.5 4.0 3.0 0.3Maximum 8.0 11.0 10.0 10.0 13.0 25.0 40.0 39.0 27.0 40.0 44.0 40.0 44.0
Total SolidsAverage 1448 1489 1395 1304 1156 958 1061 1120 979 1025 1215 1011 1180Minimum 940 1080 1040 972 672 676 780 868 812 716 932 788 672Maximum 5120 2490 2320 2100 2190 1520 1400 1520 1220 1590 1650 1340 5120
Volatile SolidsAverage 424 416 351 283 249 212 335 331 259 328 423 297 326Minimum 212 276 200 196 108 92 164 148 144 124 236 208 92Maximum 2250 740 604 476 504 348 584 584 336 776 576 404 2250
Volatile Suspended SolidsAverage 105 115 107 106 98 89 228 188 123 167 280 140 145Minimum 74 94 64 68 58 56 66 82 58 48 140 74 48Maximum 144 170 182 184 156 129 532 344 206 412 456 200 532
Table A-1. Deer Island Treatment Plant Operations Summary, FY03 (cont.)
Annual
Annual
A-3
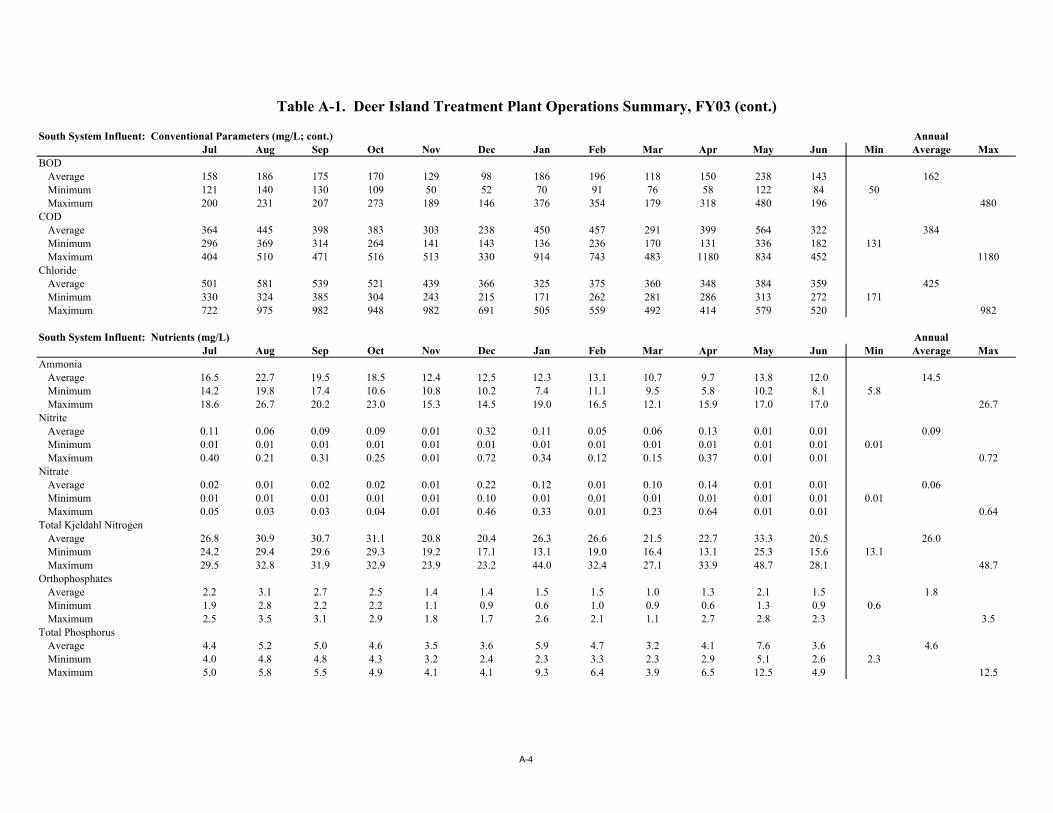
South System Influent: Conventional Parameters (mg/L; cont.)Jul Aug Sep Oct Nov Dec Jan Feb Mar Apr May Jun Min Average Max
BODAverage 158 186 175 170 129 98 186 196 118 150 238 143 162Minimum 121 140 130 109 50 52 70 91 76 58 122 84 50Maximum 200 231 207 273 189 146 376 354 179 318 480 196 480
CODAverage 364 445 398 383 303 238 450 457 291 399 564 322 384Minimum 296 369 314 264 141 143 136 236 170 131 336 182 131Maximum 404 510 471 516 513 330 914 743 483 1180 834 452 1180
ChlorideAverage 501 581 539 521 439 366 325 375 360 348 384 359 425Minimum 330 324 385 304 243 215 171 262 281 286 313 272 171Maximum 722 975 982 948 982 691 505 559 492 414 579 520 982
South System Influent: Nutrients (mg/L)Jul Aug Sep Oct Nov Dec Jan Feb Mar Apr May Jun Min Average Max
AmmoniaAverage 16.5 22.7 19.5 18.5 12.4 12.5 12.3 13.1 10.7 9.7 13.8 12.0 14.5Minimum 14.2 19.8 17.4 10.6 10.8 10.2 7.4 11.1 9.5 5.8 10.2 8.1 5.8Maximum 18.6 26.7 20.2 23.0 15.3 14.5 19.0 16.5 12.1 15.9 17.0 17.0 26.7
NitriteAverage 0.11 0.06 0.09 0.09 0.01 0.32 0.11 0.05 0.06 0.13 0.01 0.01 0.09Minimum 0.01 0.01 0.01 0.01 0.01 0.01 0.01 0.01 0.01 0.01 0.01 0.01 0.01Maximum 0.40 0.21 0.31 0.25 0.01 0.72 0.34 0.12 0.15 0.37 0.01 0.01 0.72
NitrateAverage 0.02 0.01 0.02 0.02 0.01 0.22 0.12 0.01 0.10 0.14 0.01 0.01 0.06Minimum 0.01 0.01 0.01 0.01 0.01 0.10 0.01 0.01 0.01 0.01 0.01 0.01 0.01Maximum 0.05 0.03 0.03 0.04 0.01 0.46 0.33 0.01 0.23 0.64 0.01 0.01 0.64
Total Kjeldahl NitrogenAverage 26.8 30.9 30.7 31.1 20.8 20.4 26.3 26.6 21.5 22.7 33.3 20.5 26.0Minimum 24.2 29.4 29.6 29.3 19.2 17.1 13.1 19.0 16.4 13.1 25.3 15.6 13.1Maximum 29.5 32.8 31.9 32.9 23.9 23.2 44.0 32.4 27.1 33.9 48.7 28.1 48.7
OrthophosphatesAverage 2.2 3.1 2.7 2.5 1.4 1.4 1.5 1.5 1.0 1.3 2.1 1.5 1.8Minimum 1.9 2.8 2.2 2.2 1.1 0.9 0.6 1.0 0.9 0.6 1.3 0.9 0.6Maximum 2.5 3.5 3.1 2.9 1.8 1.7 2.6 2.1 1.1 2.7 2.8 2.3 3.5
Total PhosphorusAverage 4.4 5.2 5.0 4.6 3.5 3.6 5.9 4.7 3.2 4.1 7.6 3.6 4.6Minimum 4.0 4.8 4.8 4.3 3.2 2.4 2.3 3.3 2.3 2.9 5.1 2.6 2.3Maximum 5.0 5.8 5.5 4.9 4.1 4.1 9.3 6.4 3.9 6.5 12.5 4.9 12.5
Annual
Annual
Table A-1. Deer Island Treatment Plant Operations Summary, FY03 (cont.)
A-4

Flow-Weighted Influent (North+South Systems): Conventional Parameters (mg/L)Jul Aug Sep Oct Nov Dec Jan Feb Mar Apr May Jun Min Average Max
Total Suspended SolidsAverage 180 200 198 206 191 140 193 203 166 175 230 174 140 188 230
cBODAverage 121 131 126 126 106 82 99 110 80 81 116 96 80 106 131
Settleable Solids (mL/L)Average 5.2 7.9 6.2 7.9 6.8 4.7 10.0 9.5 7.0 6.8 11.1 6.0 4.7 7.4 11.1
Total SolidsAverage 1495 1515 1602 1495 1273 1069 1255 1411 1116 1142 1135 1101 1069 1301 1602
Volatile SolidsAverage 440 444 443 361 310 247 309 343 291 307 350 332 247 348 444
Volatile Suspended SolidsAverage 156 174 172 179 167 120 171 177 145 153 202 151 120 164 202
BODAverage 165 183 183 185 166 123 155 168 135 135 189 161 123 162 189
CODAverage 418 483 442 431 376 292 363 405 325 342 453 329 292 388 483
ChlorideAverage 540 589 605 567 469 402 472 553 423 424 377 378 377 483 605
Flow-Weighted Influent (North+South Systems): Nutrients (mg/L)Jul Aug Sep Oct Nov Dec Jan Feb Mar Apr May Jun Min Average Max
AmmoniaAverage 18.8 23.7 20.5 21.6 13.2 13.6 16.4 17.7 13.1 12.4 16.8 15.9 12.4 17.0 23.7
NitriteAverage 0.13 0.07 0.28 0.29 0.18 0.55 0.18 0.14 0.08 0.21 0.16 0.36 0.07 0.22 0.55
NitrateAverage 0.05 0.01 0.04 0.04 0.14 0.37 0.14 0.01 0.04 0.17 0.06 0.10 0.01 0.10 0.37
Total Kjeldahl NitrogenAverage 28.9 36.1 38.1 37.4 24.7 23.6 28.0 30.0 23.4 23.3 30.7 27.5 23.3 29.3 38.1
OrthophosphatesAverage 2.3 3.1 2.7 2.8 1.3 1.4 1.9 2.1 1.3 1.3 1.9 2.1 1.3 2.0 3.1
Total PhosphorusAverage 4.8 5.7 5.5 5.9 4.1 3.8 5.0 4.8 3.5 3.7 5.6 5.3 3.5 4.8 5.9
Table A-1. Deer Island Treatment Plant Operations Summary, FY03 (cont.)
Annual
Annual
A-5

Final EffluentJul Aug Sep Oct Nov Dec Jan Feb Mar Apr May Jun Min Average Max
Flow (mgd)Average 282.1 264.8 285.2 295.6 386.1 456.9 412.2 360.4 465.5 527.1 369.8 420.7 377.2Minimum 244.0 244.1 237.8 255.1 276.2 311.1 309.9 281.7 363.5 408.0 307.9 322.0 237.8Maximum 375.7 423.3 425.7 618.2 741.6 897.7 687.6 660.6 813.5 812.2 623.2 702.1 897.7
Temperature (deg F)Average 70.9 73.1 72.3 69.0 64.0 59.3 55.8 54.7 54.1 55.2 60.3 63.4 62.7Minimum 68.5 70.9 70.7 64.2 59.7 56.3 52.2 51.1 50.5 52.3 56.3 60.3 50.5Maximum 73.2 75.0 74.8 73.4 68.2 62.6 58.1 57.2 56.8 58.3 62.4 66.6 75.0
pH (SU)*Average 6.7 6.7 6.6 6.6 6.5 6.3 6.3 6.6 6.6 6.6 6.6 6.6 6.6Minimum 6.5 6.6 6.2 6.2 6.1 6.0 6.0 6.4 6.3 6.5 6.4 6.4 6.0Maximum 7.0 6.9 6.9 6.9 6.8 6.7 6.6 6.9 6.8 6.8 7.0 6.9 7.0
Final Effluent: Conventional Parameters (mg/L)Jul Aug Sep Oct Nov Dec Jan Feb Mar Apr May Jun Min Average Max
Total Suspended SolidsAverage 12.2 36.1 14.5 15.9 14.2 15.4 15.6 22.5 25.5 16.9 16.2 12.3 18.1Minimum 5.5 8.0 5.0 5.5 6.5 5.0 7.3 14.0 14.0 10.0 8.0 6.0 5.0Maximum 23.0 132.0 42.0 41.5 36.0 34.0 28.5 50.0 38.5 43.3 43.3 25.5 132.0
cBODAverage 9.4 15.8 9.7 9.6 11.4 10.2 10.3 15.0 12.4 8.8 9.2 7.2 10.7Minimum 4.7 6.9 4.6 3.8 6.5 4.1 5.5 9.0 8.5 5.2 2.8 2.7 2.7Maximum 16.9 39.9 28.9 25.7 24.5 35.8 14.5 28.4 23.3 18.3 27.7 15.3 39.9
Settleable Solids (mL/L)Average 0.1 0.2 0.3 0.2 0.1 0.1 0.1 0.1 0.1 0.1 0.1 0.1 0.1Minimum 0.1 0.1 0.1 0.1 0.1 0.1 0.1 0.1 0.1 0.1 0.1 0.1 0.1Maximum 0.2 1.0 3.0 1.4 0.4 0.1 0.2 0.2 0.2 0.1 0.1 0.1 3.0
Total Chlorine Residual*Average 0.03 0.03 0.03 0.03 0.03 0.03 0.03 0.03 0.03 0.03 0.04 0.03 0.03Minimum 0.03 0.03 0.03 0.03 0.03 0.03 0.03 0.03 0.03 0.03 0.03 0.03 0.03Maximum 0.03 0.05 0.04 0.05 0.03 0.03 0.04 0.03 0.03 0.03 0.10 0.03 0.10
Fecal Coliform (colonies/100mL)*Geometric Mean 8 13 11 14 9 19 19 10 19 45 20 25 16Minimum 5 5 5 5 5 5 5 5 5 12 5 5 5Maximum 59 225 75 292 53 460 2233 79 300 1249 325 268 2233
Total SolidsAverage 1319 1332 1286 1226 1093 989 981 1068 1001 931 1001 961 1099Minimum 1060 816 732 800 712 652 640 800 672 724 708 740 640Maximum 2230 1900 2140 2030 2150 1830 1590 1580 1360 1470 1360 1320 2230
Annual
Table A-1. Deer Island Treatment Plant Operations Summary, FY03 (cont.)
Annual
A-6

Final Effluent: Conventional Parameters (mg/L; cont.)Jul Aug Sep Oct Nov Dec Jan Feb Mar Apr May Jun Min Average Max
Volatile SolidsAverage 273 284 248 174 150 142 135 149 163 157 154 184 184Minimum 144 128 96 60 28 52 48 56 64 24 76 108 24Maximum 524 496 476 380 316 232 268 248 232 500 268 276 524
Volatile Suspended SolidsAverage 13.2 32.1 13.0 13.9 13.1 11.9 13.5 19.5 21.5 14.3 13.8 10.5 15.9Minimum 5.0 7.0 5.0 5.0 6.0 4.0 6.0 12.5 13.0 7.3 7.5 5.5 4.0Maximum 85.0 112.0 40.0 35.5 32.0 26.0 23.5 39.0 30.5 34.0 34.7 20.5 112.0
BODAverage 16.4 31.1 22.8 21.3 18.8 19.2 21.6 23.0 20.8 16.8 17.5 16.7 20.5Minimum 8.4 11.0 10.9 7.9 10.0 6.6 10.0 14.6 15.0 10.7 8.4 8.4 6.6Maximum 30.3 72.1 51.2 45.9 43.6 67.7 45.8 41.2 34.0 37.1 39.5 30.2 72.1
CODAverage 85 131 94 93 83 74 80 98 92 69 88 70 88Minimum 59 78 66 55 48 49 60 72 69 56 61 56 48Maximum 125 263 138 155 131 126 135 126 116 107 200 129 263
Total Organic CarbonAverage 22.1 23.3 15.7 28.9 20.7 16.2 16.6 22.5 21.0 12.7 13.0 12.6 18.7Minimum 18.0 20.8 15.4 28.9 14.8 10.5 15.8 20.1 19.8 10.9 12.5 11.7 10.5Maximum 26.2 25.7 15.9 28.9 34.2 29.4 17.4 24.9 22.1 14.4 13.4 13.5 34.2
ChlorideAverage 540 587 530 547 480 444 430 483 431 398 435 396 475Minimum 446 300 281 311 260 248 264 327 289 306 292 284 248Maximum 683 949 843 960 945 943 854 822 588 503 627 574 960
Fats, Oils, and GreaseAverage 7.0 7.0 7.0 7.0 8.2 11.3 7.0 7.0 7.0 7.0 7.0 7.0 7.5Minimum 7.0 7.0 7.0 7.0 7.0 7.0 7.0 7.0 7.0 7.0 7.0 7.0 7.0Maximum 7.0 7.0 7.0 7.0 13.0 44.0 7.0 7.0 7.0 7.0 7.0 7.0 44.0
Table A-1. Deer Island Treatment Plant Operations Summary, FY03 (cont.)
Annual
A-7

Final Effluent: Nutrients (mg/L)Jul Aug Sep Oct Nov Dec Jan Feb Mar Apr May Jun Min Average Max
AmmoniaAverage 19.9 23.5 22.0 22.8 15.6 14.9 14.0 18.1 14.3 11.9 17.6 15.9 17.5Minimum 19.2 21.0 19.8 18.6 11.4 8.3 7.0 14.4 12.4 10.3 13.2 9.5 7.0Maximum 21.0 25.8 24.0 28.0 23.7 18.9 20.9 22.4 17.8 13.9 20.7 20.0 28.0
NitriteAverage 0.25 0.14 0.22 0.11 0.11 0.33 0.59 0.30 0.37 0.36 0.12 0.38 0.28Minimum 0.07 0.09 0.09 0.08 0.01 0.08 0.09 0.16 0.30 0.11 0.08 0.31 0.01Maximum 0.69 0.24 0.56 0.18 0.21 0.75 0.91 0.42 0.43 0.50 0.18 0.45 0.91
NitrateAverage 0.84 1.09 2.10 2.04 1.23 2.43 1.17 1.39 1.31 1.28 2.00 1.09 1.50Minimum 0.02 0.04 0.01 1.43 0.02 0.03 0.06 0.03 0.73 0.10 0.33 0.42 0.01Maximum 1.69 1.92 5.07 2.65 1.93 4.30 2.48 2.43 2.30 3.07 2.89 2.54 5.07
Total Kjeldahl NitrogenAverage 23.6 28.3 26.4 27.3 20.0 16.9 16.5 22.2 18.8 15.3 20.6 18.9 21.2Minimum 23.0 26.6 24.3 23.3 15.3 9.8 9.7 17.3 15.0 13.1 15.2 14.0 9.7Maximum 24.5 31.1 29.9 32.3 28.8 20.3 24.6 26.2 23.3 16.8 23.2 24.2 32.3
OrthophosphatesAverage 2.3 2.9 2.8 2.7 1.6 1.5 1.4 1.8 1.3 0.9 2.0 2.2 1.9Minimum 1.9 2.7 2.5 2.4 1.3 0.8 0.9 1.2 1.1 0.8 1.3 1.6 0.8Maximum 2.5 3.2 3.4 3.1 1.9 2.0 2.0 2.5 1.6 1.2 3.0 2.7 3.4
Total PhosphorusAverage 3.0 4.2 3.7 3.7 2.4 2.1 2.2 2.7 2.2 1.6 2.7 2.7 2.8Minimum 2.6 3.8 3.2 3.3 2.1 1.4 1.7 1.9 2.0 1.2 1.8 2.2 1.2Maximum 3.6 4.5 4.7 4.2 2.7 3.1 3.0 3.5 2.6 1.7 3.9 3.3 4.7
~: No data collected*: Effluent pH, TCR, and fecal coliform are sampled multiple times daily. The minimum and maximum are the minimum and maximum daily averages, not single sample minimums and maximums.
Annual
Table A-1. Deer Island Treatment Plant Operations Summary, FY03 (cont.)
A-8

Metals (ug/L) TimesJul Aug Sep Oct Nov Dec Jan Feb Mar Apr May Jun Average Maximum Detected
ANTIMONY 8.95 9.23 ~ 7.5 10 10 10 8.69 7.5 7.5 7.5 10 8.89 10 0 of 32ARSENIC 1.27 0.4 ~ 0.4 0.4 0.601 0.4 0.596 0.898 0.4 1.5 0.4 0.7 1.68 10 of 33BERYLLIUM 0.25 0.25 ~ 0.25 0.25 0.25 0.25 0.25 0.25 0.25 0.25 0.25 0.25 0.25 0 of 32BORON 204 171 ~ 398 368 273 125 214 125 125 125 125 192 398 14 of 32CADMIUM 0.454 0.282 ~ 0.281 0.214 0.324 0.324 0.599 0.317 0.544 0.661 0.363 0.422 0.799 32 of 32CHROMIUM 4.41 2.39 ~ 2.01 2.21 3.54 3 4.84 3.49 2.91 4.84 2.89 3.49 5.99 32 of 32COPPER 81.5 64.8 ~ 63.1 57.8 62.9 32 81.3 38.7 51.2 85.1 38.1 60.2 93.9 32 of 32HEXAVALENT CHROMIUM 2.5 2.5 2.5 2.5 2.5 2.5 2.5 2.5 2.5 2.5 2.5 2.5 2.5 2.5 0 of 38IRON 2470 1690 ~ 1290 1480 2090 1310 2520 1630 2000 2770 1390 1930 3130 32 of 32LEAD 20.5 4.54 ~ 8.53 8.4 5.94 4.69 16 3.86 7.93 10.1 5.75 9.44 29.1 30 of 32MERCURY 0.155 0.194 ~ 0.15 0.135 0.238 0.101 0.245 0.124 0.279 0.316 0.124 0.189 0.365 32 of 32MOLYBDENUM 9.54 11.7 ~ 6.57 9.54 2.63 4.38 12.2 4.38 7.63 7.5 7.63 7.92 13.4 31 of 32NICKEL 5.13 4.35 ~ 2.05 4.02 4.39 2.83 4.64 3.63 3.85 7.39 4.34 4.49 9.98 32 of 32SELENIUM 0.45 0.45 ~ 0.45 0.45 0.45 0.45 0.45 0.45 0.45 0.45 0.45 0.45 0.45 0 of 32SILVER 1.61 1.36 ~ 1.47 2.19 1.56 1.35 2.12 1.52 1.57 3.12 1.67 1.87 3.43 33 of 33THALLIUM 0.5 0.5 ~ 0.5 0.5 0.5 0.5 0.5 0.5 0.5 0.5 0.5 0.5 0.5 0 of 32ZINC 145 102 ~ 102 85.3 107 78.8 146 94.5 110 157 79.5 112 176 32 of 32
Cyanide and Phenols (ug/L) TimesJul Aug Sep Oct Nov Dec Jan Feb Mar Apr May Jun Average Maximum Detected
CYANIDE 5 5 5 5 5 5 5 5 5 5 5 5 5 5 0 of 38PHENOL 31.1 85.9 38.2 ~ 24.7 21.8 ~ ~ ~ ~ ~ ~ 36.4 85.9 13 of 14
Oil and Grease, Surfactants, and Petroleum Hydrocarbons (mg/L) TimesJul Aug Sep Oct Nov Dec Jan Feb Mar Apr May Jun Average Maximum Detected
FATS OIL AND GREASE 35.4 65.8 51.4 ~ 44.8 34.6 20.6 48.8 25.3 28.4 36.8 25.3 35.7 65.8 36 of 36MBAS 5.39 6.11 4.9 6.17 4.65 3.66 1.92 3.23 2.8 1.96 3.63 2.66 3.71 6.7 36 of 36PETROLEUM HYDROCARBON 0.558 0.426 0.61 0.685 0.527 0.37 0.647 0.521 0.371 0.334 0.674 0.792 0.572 0.994 37 of 38
Table A-2. Deer Island Influent Characterization (North & South Systems), FY03
A-9

Organochlorine Pesticides and PCBs (ug/L) TimesJul Aug Sep Oct Nov Dec Jan Feb Mar Apr May Jun Average Maximum Detected
2,4'-DDD 0.000106 0.000107 0.000119 0.000178 ~ 0.000106 ~ 0.000115 ~ 0.000115 ~ 0.000121 0.000119 0.000178 0 of 262,4'-DDE 0.000106 0.000107 0.000119 0.000178 ~ 0.000106 ~ 0.000115 ~ 0.000115 ~ 0.000121 0.000119 0.000178 0 of 262,4'-DDT 0.000106 0.000107 0.000119 0.000178 ~ 0.000106 ~ 0.000115 ~ 0.000115 ~ 0.000121 0.000119 0.000178 0 of 264,4'-DDD 0.00206 0.00159 0.00159 0.00137 0.00213 0.00261 0.00206 0.00192 0.0021 0.0015 0.00217 0.00191 0.00194 0.00261 24 of 624,4'-DDE 0.00285 0.00345 0.00263 0.00266 0.00213 0.00177 0.00206 0.00252 0.0021 0.00502 0.00217 0.00324 0.00273 0.00502 28 of 624,4'-DDT 0.00232 0.00197 0.0016 0.00118 0.00213 0.0012 0.00206 0.00285 0.0021 0.0018 0.00428 0.000873 0.00212 0.00658 19 of 62ALDRIN 0.00172 0.00112 0.00128 0.00118 0.00213 0.0012 0.00206 0.00126 0.0021 0.00117 0.00217 0.000785 0.00152 0.0025 0 of 62ALPHA-BHC 0.00232 0.00213 0.00244 0.00218 0.00213 0.0023 0.00206 0.0024 0.0021 0.00223 0.00217 0.00211 0.00222 0.00255 0 of 36ALPHA-CHLORDANE 0.00273 0.00339 0.00285 0.00299 0.00213 0.0026 0.00206 0.00277 0.0021 0.00381 0.00695 0.00489 0.00351 0.00796 27 of 62AROCLOR-1016 0.058 0.0532 0.0611 0.0547 0.0533 0.0575 0.0515 0.0601 0.0525 0.0558 0.0542 0.0529 0.0555 0.0638 0 of 36AROCLOR-1221 0.116 0.106 0.122 0.109 0.107 0.115 0.103 0.12 0.105 0.112 0.108 0.106 0.111 0.128 0 of 36AROCLOR-1232 0.058 0.0532 0.0611 0.0547 0.0533 0.0575 0.0515 0.0601 0.0525 0.0558 0.0542 0.0529 0.0555 0.0638 0 of 36AROCLOR-1242 0.058 0.0532 0.0611 0.0547 0.0533 0.0575 0.0515 0.0601 0.0525 0.0558 0.0542 0.0529 0.0555 0.0638 0 of 36AROCLOR-1248 0.058 0.0532 0.0611 0.0547 0.0533 0.0575 0.0515 0.0601 0.0525 0.0558 0.0542 0.0529 0.0555 0.0638 0 of 36AROCLOR-1254 0.058 0.0532 0.0611 0.0547 0.0533 0.0575 0.0515 0.0601 0.0525 0.0558 0.0542 0.0529 0.0555 0.0638 0 of 36AROCLOR-1260 0.058 0.0532 0.0611 0.0547 0.0533 0.0575 0.0515 0.0601 0.0525 0.0558 0.0542 0.0529 0.0555 0.0638 0 of 36BETA-BHC 0.00232 0.00213 0.00244 0.00218 0.00213 0.0023 0.00206 0.0024 0.0021 0.00223 0.00217 0.00211 0.00222 0.00255 0 of 36CHLORDANE (TECHNICAL) 0.058 0.0532 0.0611 0.0547 0.0533 0.0575 0.0515 0.0601 0.0525 0.0558 0.0542 0.0529 0.0555 0.0638 0 of 36DDMU 0.000106 0.000107 0.000119 0.000178 0.000106 ~ 0.000115 ~ 0.000115 ~ 0.000121 0.000119 0.000178 0 of 26DELTA-BHC 0.00232 0.00213 0.00244 0.00218 0.00213 0.0023 0.00206 0.0024 0.0021 0.00223 0.00217 0.00211 0.00222 0.00255 0 of 36DIELDRIN 0.00172 0.00112 0.00128 0.00118 0.00213 0.0012 0.00206 0.00126 0.0021 0.00254 0.00217 0.00163 0.00175 0.00254 10 of 62ENDOSULFAN I 0.00232 0.00213 0.00244 0.00218 0.00213 0.0023 0.00206 0.0024 0.0021 0.00223 0.00217 0.00211 0.00222 0.00255 0 of 36ENDOSULFAN II 0.00232 0.00213 0.00244 0.00218 0.00213 0.0023 0.00206 0.0024 0.0021 0.00223 0.00217 0.00211 0.00222 0.00255 0 of 36ENDOSULFAN SULFATE 0.00232 0.00213 0.00244 0.00218 0.00213 0.0023 0.00206 0.0024 0.0021 0.00223 0.00217 0.00211 0.00222 0.00255 0 of 36ENDRIN 0.00172 0.00112 0.00128 0.00118 0.00213 0.0012 0.00206 0.00126 0.0021 0.00117 0.00217 0.000785 0.00152 0.0025 0 of 62ENDRIN ALDEHYDE 0.00232 0.00213 0.00244 0.00218 0.00213 0.0023 0.00206 0.0024 0.0021 0.00223 0.00217 0.00211 0.00222 0.00255 0 of 36ENDRIN KETONE 0.00232 0.00213 0.00244 0.00218 0.00213 0.0023 0.00206 0.0024 0.0021 0.00223 0.00217 0.00211 0.00222 0.00255 0 of 36GAMMA-BHC (LINDANE) 0.00216 0.00271 0.0025 0.00257 0.00213 0.0012 0.00206 0.00126 0.0021 0.00208 0.00217 0.000785 0.00185 0.00271 12 of 62GAMMA-CHLORDANE 0.00291 0.00431 0.00321 0.00309 0.00213 0.00207 0.00206 0.00309 0.0021 0.00379 0.00652 0.00506 0.00358 0.0084 28 of 62HEPTACHLOR 0.00172 0.00112 0.00128 0.00118 0.00213 0.0012 0.00206 0.00126 0.0021 0.00117 0.00217 0.000785 0.00152 0.0025 0 of 62HEPTACHLOR EPOXIDE 0.00172 0.00112 0.00128 0.00118 0.00213 0.0012 0.00206 0.00126 0.0021 0.00117 0.00217 0.000785 0.00152 0.0025 0 of 62HEXACHLOROBENZENE 0.000106 0.000107 0.000119 0.000178 ~ 0.000106 ~ 0.000115 ~ 0.000115 ~ 0.000121 0.000119 0.000178 0 of 26METHOXYCHLOR 0.0232 0.0213 0.0244 0.0218 0.0213 0.023 0.0206 0.0241 0.021 0.0223 0.0217 0.0211 0.0222 0.0255 0 of 36MIREX 0.000106 0.000107 0.000119 0.000178 ~ 0.000106 ~ 0.000115 ~ 0.000115 ~ 0.000121 0.000119 0.000178 0 of 26TOTAL CHLORDANE 0.0103 0.0137 0.0042 0.0106 ~ 0.00536 ~ 0.00844 ~ 0.0135 ~ 0.0123 0.00986 0.0144 24 of 26TOTAL DDT 0.00751 0.00763 0.0109 0.00353 ~ 0.00408 ~ 0.00734 ~ 0.00396 ~ 0.00391 0.00605 0.0122 26 of 26TOXAPHENE 0.058 0.0532 0.0611 0.0547 0.0533 0.0575 0.0515 0.0601 0.0525 0.0558 0.0542 0.0529 0.0555 0.0638 0 of 36TRANS-NONACHLOR 0.00242 0.00259 0.00366 0.00281 ~ 0.000739 ~ 0.00155 ~ 0.00276 ~ 0.00249 0.00238 0.00395 25 of 26
Table A-2. Deer Island Influent Characterization (North & South Systems), FY03 (cont.)
A-10

Semivolatile Organics (ug/L) TimesJul Aug Sep Oct Nov Dec Jan Feb Mar Apr May Jun Average Maximum Detected
1,2,4-TRICHLOROBENZENE 1.04 1.09 2.65 1.2 1.06 1.05 1.07 1.07 1.02 1.17 1.01 1.08 1.2 4.24 0 of 361,2-DICHLOROBENZENE 1.04 1.09 2.65 1.2 1.06 1.05 1.07 1.07 1.02 1.17 1.01 1.08 1.2 4.24 0 of 361,2-DIPHENYLHYDRAZINE (AS AZOBENZENE) 1.04 1.09 2.65 1.2 1.06 1.05 1.07 1.07 1.02 1.17 1.01 1.08 1.2 4.24 0 of 361,3-DICHLOROBENZENE 1.04 1.09 2.65 1.2 1.06 1.05 1.07 1.07 1.02 1.17 1.01 1.08 1.2 4.24 0 of 361,4-DICHLOROBENZENE 1.04 1.09 2.65 1.2 1.06 1.05 1.07 1.07 1.02 1.17 1.01 1.08 1.2 4.24 0 of 362,2'-OXYBIS(1-CHLOROPROPANE) 1.04 1.09 2.65 1.2 1.06 1.05 1.07 1.07 1.02 1.17 1.01 1.08 1.2 4.24 0 of 362,4,5-TRICHLOROPHENOL 1.04 1.09 2.65 1.2 1.06 1.05 1.07 1.07 1.02 1.17 1.01 1.08 1.2 4.24 0 of 362,4,6-TRICHLOROPHENOL 1.04 1.09 2.65 1.2 1.06 1.05 1.07 1.07 1.02 1.17 1.01 1.08 1.2 4.24 0 of 362,4-DICHLOROPHENOL 1.04 1.09 2.65 1.2 1.06 1.05 1.07 1.07 1.02 1.17 1.01 1.08 1.2 4.24 0 of 362,4-DIMETHYLPHENOL 1.04 1.09 2.65 1.2 1.06 1.05 1.07 1.07 1.02 1.17 1.01 1.08 1.2 4.24 0 of 362,4-DINITROPHENOL 2.09 2.17 5.29 2.4 2.13 2.11 2.14 2.15 2.04 2.34 2.03 2.16 2.4 8.47 0 of 362,4-DINITROTOLUENE 1.04 1.09 2.65 1.2 1.06 1.05 1.07 1.07 1.02 1.17 1.01 1.08 1.2 4.24 0 of 362,6-DINITROTOLUENE 1.04 1.09 2.65 1.2 1.06 1.05 1.07 1.07 1.02 1.17 1.01 1.08 1.2 4.24 0 of 362-CHLORONAPHTHALENE 1.04 1.09 2.65 1.2 1.06 1.05 1.07 1.07 1.02 1.17 1.01 1.08 1.2 4.24 0 of 362-CHLOROPHENOL 1.04 1.09 2.65 1.2 1.06 1.05 1.07 1.07 1.02 1.17 1.01 1.08 1.2 4.24 0 of 362-METHYL-4,6-DINITROPHENOL 10.4 10.9 26.5 12 10.6 10.5 10.7 10.7 10.2 11.7 10.1 10.8 12 42.4 0 of 362-METHYLNAPHTHALENE 1.04 1.09 2.65 1.2 1.06 1.05 1.07 1.07 1.02 1.17 1.01 1.08 1.2 4.24 0 of 362-METHYLPHENOL 1.04 1.09 2.65 1.2 1.06 1.05 1.07 1.07 1.02 1.17 1.01 1.08 1.2 4.24 0 of 362-NITROANILINE 1.04 1.09 2.65 1.2 1.06 1.05 1.07 1.07 1.02 1.17 1.01 1.08 1.2 4.24 0 of 362-NITROPHENOL 1.04 1.09 2.65 1.2 1.06 1.05 1.07 1.07 1.02 1.17 1.01 1.08 1.2 4.24 0 of 363,3'-DICHLOROBENZIDINE 2.09 2.17 5.29 2.4 2.13 2.11 2.14 2.15 2.04 2.34 2.03 2.16 2.4 8.47 0 of 363-NITROANILINE 1.04 1.09 2.65 1.2 1.06 1.05 1.07 1.07 1.02 1.17 1.01 1.08 1.2 4.24 0 of 364-BROMOPHENYL PHENYL ETHER 1.04 1.09 2.65 1.2 1.06 1.05 1.07 1.07 1.02 1.17 1.01 1.08 1.2 4.24 0 of 364-CHLORO-3-METHYLPHENOL 1.04 1.09 2.65 1.2 1.06 1.05 1.07 1.07 1.02 1.17 1.01 1.08 1.2 4.24 0 of 364-CHLOROANILINE 1.04 1.09 3.3 1.2 1.06 1.05 1.07 1.07 1.02 1.17 1.01 1.08 1.26 4.24 1 of 364-CHLOROPHENYL PHENYL ETHER 1.04 1.09 2.65 1.2 1.06 1.05 1.07 1.07 1.02 1.17 1.01 1.08 1.2 4.24 0 of 364-METHYLPHENOL (INCLUDES 3-METHYLPHENOL) 9.53 9.58 15.9 25 8.78 5.82 1.07 15.1 1.02 5.35 27.1 4.69 10.8 27.4 23 of 364-NITROANILINE 1.04 1.09 2.65 1.2 1.06 1.05 1.07 1.07 1.02 1.17 1.01 1.08 1.2 4.24 0 of 364-NITROPHENOL 2.09 2.17 5.29 2.4 2.13 2.11 2.14 2.15 2.04 2.34 2.03 2.16 2.4 8.47 0 of 36ACENAPHTHENE 1.04 1.09 2.65 1.2 1.06 1.05 1.07 1.07 1.02 1.17 1.01 1.08 1.2 4.24 0 of 36ACENAPHTHYLENE 1.04 1.09 2.65 1.2 1.06 1.05 1.07 1.07 1.02 1.17 1.01 1.08 1.2 4.24 0 of 36ANILINE 1.04 1.09 2.65 1.2 1.06 1.05 1.07 1.07 1.02 1.17 1.01 1.08 1.2 4.24 0 of 36ANTHRACENE 1.04 1.09 2.65 1.2 1.06 1.05 1.07 1.07 1.02 1.17 1.01 1.08 1.2 4.24 0 of 36BENZIDINE 5.22 5.43 16.6 6 5.31 5.26 5.34 5.37 5.09 5.85 5.07 5.4 6.28 21.2 1 of 36
Table A-2. Deer Island Influent Characterization (North & South Systems), FY03 (cont.)
A-11

Semivolatile Organics (ug/L) TimesJul Aug Sep Oct Nov Dec Jan Feb Mar Apr May Jun Average Maximum Detected
BENZO(A)ANTHRACENE 1.04 1.09 2.65 1.2 1.06 1.05 1.07 1.07 1.02 1.17 1.01 1.08 1.2 4.24 0 of 36BENZO(A)PYRENE 1.04 1.09 2.65 1.2 1.06 1.05 1.07 1.07 1.02 1.17 1.01 1.08 1.2 4.24 0 of 36BENZO(B)FLUORANTHENE 1.04 1.09 2.65 1.2 1.06 1.05 1.07 1.07 1.02 1.17 1.01 1.08 1.2 4.24 0 of 36BENZO(GHI)PERYLENE 1.04 1.09 2.65 1.2 1.06 1.05 1.07 1.07 1.02 1.17 1.01 1.08 1.2 4.24 0 of 36BENZO(K)FLUORANTHENE 1.04 1.09 2.65 1.2 1.06 1.05 1.07 1.07 1.02 1.17 1.01 1.08 1.2 4.24 0 of 36BENZOIC ACID 6.48 6.68 5.29 34.8 12.8 2.11 2.14 5.24 2.04 8.19 2.03 2.16 6.15 34.8 9 of 36BENZYL ALCOHOL 5.09 2.67 7.66 13.5 3.68 1.05 1.07 3.93 5.47 5.14 5.8 6.48 5.07 13.5 21 of 36BIS(2-CHLOROETHOXY)METHANE 1.04 1.09 2.65 1.2 1.06 1.05 1.07 1.07 1.02 1.17 1.01 1.08 1.2 4.24 0 of 36BIS(2-CHLOROETHYL)ETHER 1.04 1.09 2.65 1.2 1.06 1.05 1.07 1.07 1.02 1.17 1.01 1.08 1.2 4.24 0 of 36BIS(2-ETHYLHEXYL)PHTHALATE 13.8 15.3 21.3 21 15.3 18.4 6.7 20.7 9.38 18.4 14.7 6.55 14.5 24.4 32 of 36BUTYL BENZYL PHTHALATE 1.04 1.09 2.65 1.2 1.06 1.05 1.07 1.07 1.02 1.17 1.01 1.08 1.2 4.24 0 of 36CHRYSENE 1.04 1.09 2.65 1.2 1.06 1.05 1.07 1.07 1.02 1.17 1.01 1.08 1.2 4.24 0 of 36DI-N-BUTYLPHTHALATE 1.04 1.09 2.65 1.2 1.06 1.05 1.07 1.07 1.02 1.17 1.01 1.08 1.2 4.24 0 of 36DI-N-OCTYLPHTHALATE 1.04 1.09 2.65 1.2 1.06 1.05 1.07 1.07 1.02 1.17 1.01 1.08 1.2 4.24 0 of 36DIBENZO(A,H)ANTHRACENE 1.04 1.09 2.65 1.2 1.06 1.05 1.07 1.07 1.02 1.17 1.01 1.08 1.2 4.24 0 of 36DIBENZOFURAN 1.04 1.09 2.65 1.2 1.06 1.05 1.07 1.07 1.02 1.17 1.01 1.08 1.2 4.24 0 of 36DIETHYL PHTHALATE 1.04 1.09 3.41 4.99 1.94 1.05 1.07 1.07 1.02 1.17 1.01 1.08 1.5 4.99 3 of 36DIMETHYL PHTHALATE 1.04 1.09 2.65 1.2 1.06 1.05 1.07 1.07 1.02 1.17 1.01 1.08 1.2 4.24 0 of 36FLUORANTHENE 1.04 1.09 2.65 1.2 1.06 1.05 1.07 1.07 1.02 1.17 1.01 1.08 1.2 4.24 0 of 36FLUORENE 1.04 1.09 2.65 1.2 1.06 1.05 1.07 1.07 1.02 1.17 1.01 1.08 1.2 4.24 0 of 36HEXACHLOROBENZENE 1.04 1.09 2.65 1.2 1.06 1.05 1.07 1.07 1.02 1.17 1.01 1.08 1.2 4.24 0 of 36HEXACHLOROBUTADIENE 1.04 1.09 2.65 1.2 1.06 1.05 1.07 1.07 1.02 1.17 1.01 1.08 1.2 4.24 0 of 36HEXACHLOROCYCLOPENTADIENE 5.22 5.43 13.2 6 5.31 5.26 5.34 5.37 5.09 5.85 5.07 5.4 6.01 21.2 0 of 36HEXACHLOROETHANE 1.04 1.09 2.65 1.2 1.06 1.05 1.07 1.07 1.02 1.17 1.01 1.08 1.2 4.24 0 of 36INDENO(1,2,3-CD)PYRENE 1.04 1.09 2.65 1.2 1.06 1.05 1.07 1.07 1.02 1.17 1.01 1.08 1.2 4.24 0 of 36ISOPHORONE 1.04 1.09 2.65 1.2 1.06 1.05 1.07 1.07 1.02 1.17 1.01 1.08 1.2 4.24 0 of 36N-NITROSODI-N-PROPYLAMINE 1.04 1.09 2.65 1.2 1.06 1.05 1.07 1.07 1.02 1.17 1.01 1.08 1.2 4.24 0 of 36N-NITROSODIMETHYLAMINE 1.04 1.09 2.65 1.2 1.06 1.05 1.07 1.07 1.02 1.17 1.01 1.08 1.2 4.24 0 of 36N-NITROSODIPHENYLAMINE 1.04 1.09 2.65 1.2 1.06 1.05 1.07 1.07 1.02 1.17 1.01 1.08 1.2 4.24 0 of 36NAPHTHALENE 1.04 1.09 2.65 1.2 1.06 1.05 1.07 1.07 1.02 1.17 1.01 1.08 1.2 4.24 0 of 36NITROBENZENE 1.04 1.09 2.65 1.2 1.06 1.05 1.07 1.07 1.02 1.17 1.01 1.08 1.2 4.24 0 of 36PENTACHLOROPHENOL 3.13 3.26 7.94 3.6 3.19 3.16 3.21 3.22 3.06 3.51 3.04 3.24 3.61 12.7 0 of 36PHENANTHRENE 0.104 0.109 0.265 0.12 0.106 0.105 0.107 0.107 0.102 0.117 0.101 0.108 0.12 0.424 0 of 36PHENOL 2.09 2.17 5.29 5.96 2.13 2.11 2.14 2.15 2.04 2.34 2.03 2.16 2.55 8.47 1 of 36PYRENE 1.04 1.09 2.65 1.2 1.06 1.05 1.07 1.07 1.02 1.17 1.01 1.08 1.2 4.24 0 of 36
Table A-2. Deer Island Influent Characterization (North & South Systems), FY03 (cont.)
A-12

Volatile Organics (ug/L) TimesJul Aug Sep Oct Nov Dec Jan Feb Mar Apr May Jun Average Maximum Detected
1,1,1-TRICHLOROETHANE 0.5 0.5 0.5 0.5 0.5 0.5 0.5 0.5 0.5 0.5 0.5 0.5 0.5 0.5 0 of 381,1,2,2-TETRACHLOROETHANE 0.5 0.5 0.5 0.5 0.5 0.5 0.5 0.5 0.5 0.5 0.5 0.5 0.5 0.5 0 of 381,1,2-TRICHLOROETHANE 0.5 0.5 0.5 0.5 0.5 0.5 0.5 0.5 0.5 0.5 0.5 0.5 0.5 0.5 0 of 381,1-DICHLOROETHANE 0.5 0.5 0.5 0.5 0.5 0.5 0.5 0.5 0.5 0.5 0.5 0.5 0.5 0.5 0 of 381,1-DICHLOROETHENE 0.5 0.5 0.5 0.5 0.5 0.5 0.5 0.5 0.5 0.5 0.5 0.5 0.5 0.5 0 of 381,2-DICHLOROBENZENE 0.5 0.5 0.5 0.5 0.5 0.5 0.5 0.5 0.5 0.5 0.5 0.5 0.5 0.5 0 of 381,2-DICHLOROETHANE 0.5 0.5 0.5 0.5 0.5 0.5 0.5 0.5 0.5 0.5 0.5 0.5 0.5 0.5 0 of 381,2-DICHLOROPROPANE 0.5 0.5 0.5 0.5 0.5 0.5 0.5 0.5 0.5 0.5 0.5 0.5 0.5 0.5 0 of 381,3-DICHLOROBENZENE 0.5 0.5 0.911 0.5 0.5 0.5 0.5 0.5 0.5 0.5 0.5 0.5 0.532 1.31 1 of 381,4-DICHLOROBENZENE 1.12 1.18 1.32 1.21 0.5 0.5 0.5 0.5 0.5 0.5 0.5 0.5 0.667 1.74 5 of 382-BUTANONE 3.67 5.96 6.18 6.06 2.68 0.5 1.45 1.06 0.5 0.5 0.5 2.78 2.32 8.8 17 of 382-CHLOROETHYL VINYL ETHER 0.5 0.5 0.5 0.5 0.5 0.5 0.5 0.5 0.5 0.5 0.5 0.5 0.5 0.5 0 of 382-HEXANONE 0.5 0.5 0.5 0.5 0.5 0.5 0.5 0.5 0.5 0.5 0.5 0.5 0.5 0.5 0 of 384-METHYL-2-PENTANONE 0.5 0.5 0.5 0.5 0.5 0.5 0.5 0.5 0.5 0.5 0.5 0.5 0.5 0.5 0 of 38ACETONE 121 185 141 142 112 159 84.8 76.4 154 103 230 71 123 386 37 of 38ACROLEIN 0.5 0.5 0.5 0.5 0.5 0.5 0.5 1 1 1 1 1 0.736 1 0 of 38ACRYLONITRILE 0.5 0.5 0.5 0.5 0.5 0.5 0.5 1 1 1 1 1 0.736 1 0 of 38BENZENE 0.5 0.5 0.5 0.5 0.5 0.5 2.44 0.5 2.59 0.5 0.5 0.5 0.906 2.59 3 of 38BROMODICHLOROMETHANE 0.5 0.5 0.5 0.5 0.5 0.5 0.5 0.5 0.5 0.5 0.5 0.5 0.5 0.5 0 of 38BROMOFORM 0.5 0.5 0.5 0.5 0.5 0.5 0.5 0.5 0.5 0.5 0.5 0.5 0.5 0.5 0 of 38BROMOMETHANE 0.5 0.5 0.5 0.5 0.5 0.5 0.5 0.5 0.5 0.5 0.5 0.5 0.5 0.5 0 of 38CARBON DISULFIDE 0.5 5.63 0.5 1.36 3.88 0.5 1.12 0.5 2.33 0.5 0.5 0.5 1.28 6.07 6 of 38CARBON TETRACHLORIDE 0.5 0.5 0.5 0.5 0.5 0.5 0.5 0.5 0.5 0.5 0.5 0.5 0.5 0.5 0 of 38CHLOROBENZENE 0.5 0.5 0.5 0.5 0.5 0.5 0.5 0.5 0.5 0.5 0.5 0.5 0.5 0.5 0 of 38CHLOROETHANE 0.5 0.5 0.5 0.5 0.5 0.5 0.5 0.5 0.5 0.5 0.5 0.5 0.5 0.5 0 of 38CHLOROFORM 6.62 7.46 6.47 5.95 3.86 3.48 3.59 5.65 5.23 4.7 7.04 4.23 5.15 7.66 36 of 38CHLOROMETHANE 0.5 0.5 0.5 0.5 0.5 0.5 0.5 0.5 0.5 0.5 0.5 0.5 0.5 0.5 0 of 38CIS-1,2-DICHLOROETHENE 0.5 0.5 0.5 0.5 0.5 0.5 0.5 0.5 0.5 0.5 0.5 0.5 0.5 0.5 0 of 38CIS-1,3-DICHLOROPROPENE 0.5 0.5 0.5 0.5 0.5 0.5 0.5 0.5 0.5 0.5 0.5 0.5 0.5 0.5 0 of 38DIBROMOCHLOROMETHANE 0.5 0.5 0.5 0.5 0.5 0.5 0.5 0.5 0.5 0.5 0.5 0.5 0.5 0.5 0 of 38ETHYLBENZENE 0.5 0.5 0.5 0.5 0.5 0.5 0.5 0.5 0.5 0.5 0.5 0.5 0.5 0.5 0 of 38M,P-XYLENE 0.5 3.04 0.5 0.5 0.5 0.5 0.5 1 1 1 1 1 0.829 3.04 1 of 38METHYLENE CHLORIDE 0.5 3.11 1.76 0.5 0.5 0.5 0.5 0.847 0.5 1.27 1.16 0.956 0.912 3.11 8 of 38O-XYLENE 0.5 1.34 0.5 0.5 0.5 0.5 0.5 0.5 0.5 0.5 0.5 0.5 0.531 1.34 1 of 38STYRENE 0.5 0.5 0.5 0.5 0.5 0.5 0.5 0.5 0.5 0.5 4.33 0.5 0.897 8.2 1 of 38TETRACHLOROETHENE 2 5.72 2.27 3 1.39 0.5 1.73 8.38 3.57 3.14 2.44 1.08 2.78 11.5 21 of 38TOLUENE 7.35 5.89 5.44 5.41 4.43 2.72 4.06 3.81 3.35 1.81 2.83 1 3.77 9.55 29 of 38TRANS-1,2-DICHLOROETHENE 0.5 0.5 0.5 0.5 0.5 0.5 0.5 0.5 0.5 0.5 0.5 0.5 0.5 0.5 0 of 38TRANS-1,3-DICHLOROPROPENE 0.5 0.5 0.5 0.5 0.5 0.5 0.5 0.5 0.5 0.5 0.5 0.5 0.5 0.5 0 of 38TRICHLOROETHENE 0.839 0.5 0.5 0.5 0.5 0.5 0.5 0.884 0.5 0.5 0.5 0.5 0.567 1.31 2 of 38TRICHLOROFLUOROMETHANE 0.5 0.5 0.5 0.5 0.5 0.5 0.5 0.5 0.5 0.5 0.5 0.5 0.5 0.5 0 of 38VINYL ACETATE 0.5 0.5 0.5 0.5 0.5 0.5 0.5 0.5 0.5 0.5 0.5 0.5 0.5 0.5 0 of 38VINYL CHLORIDE 0.5 0.5 0.5 0.5 0.5 0.5 0.5 0.5 0.5 0.5 0.5 0.5 0.5 0.5 0 of 38
Notes~: No data or no samples takenResults in bold indicate one or more detects that monthYearly averages are calculated from individual results collected during the fiscal year.Non-detected compounds are assumed to equal one half of the detection limit for metals and inorganics and one tenth of the reporting limit for organic compounds.
Table A-2. Deer Island Influent Characterization (North & South Systems), FY03 (cont.)
A-13

Metals (lbs/day) TimesJul Aug Sep Oct Nov Dec Jan Feb Mar Apr May Jun Average Maximum Detected
ANTIMONY 24.2 19.9 ~ 16.4 26.1 28.4 41.9 26.1 25.9 32.4 23.1 40.2 27.8 42.3 0 of 32ARSENIC 3.45 0.865 ~ 0.875 1.04 1.71 1.67 1.79 3.1 1.73 4.62 1.61 2.19 5.14 10 of 33BERYLLIUM 0.676 0.54 ~ 0.547 0.653 0.709 1.05 0.751 0.864 1.08 0.771 1 0.781 1.08 0 of 32BORON 552 370 ~ 870 962 776 523 644 432 540 385 502 600 1080 14 of 32CADMIUM 1.23 0.61 ~ 0.616 0.559 0.92 1.36 1.8 1.09 2.35 2.04 1.46 1.32 2.51 32 of 32CHROMIUM 11.9 5.17 ~ 4.4 5.77 10 12.6 14.5 12 12.6 14.9 11.6 10.9 18.8 32 of 32COPPER 221 140 ~ 138 151 179 134 244 134 221 262 153 188 295 32 of 32HEXAVALENT CHROMIUM 6.05 5.38 5.65 5.6 7.76 7.24 10.3 7.43 9.49 10.8 7.62 9.45 7.73 10.8 0 of 38IRON 6690 3660 ~ 2830 3860 5930 5490 7570 5630 8630 8540 5580 6040 9820 32 of 32LEAD 55.5 9.82 ~ 18.7 22 16.8 19.6 48.2 13.3 34.3 31 23.1 29.5 91.2 30 of 32MERCURY 0.42 0.418 ~ 0.328 0.352 0.676 0.421 0.736 0.429 1.21 0.973 0.497 0.59 1.21 32 of 32MOLYBDENUM 25.8 25.3 ~ 14.4 24.9 7.47 18.4 36.6 15.1 33 23.1 30.7 24.7 42.1 31 of 32NICKEL 13.9 9.4 ~ 4.49 10.5 12.4 11.8 13.9 12.5 16.7 22.8 17.4 14 30.5 32 of 32SELENIUM 1.22 0.973 ~ 0.985 1.18 1.28 1.88 1.35 1.55 1.94 1.39 1.81 1.41 1.94 0 of 32SILVER 4.35 2.94 ~ 3.21 5.71 4.42 5.66 6.38 5.26 6.78 9.6 6.7 5.86 10.5 33 of 33THALLIUM 1.35 1.08 ~ 1.09 1.31 1.42 2.09 1.5 1.73 2.16 1.54 2.01 1.56 2.16 0 of 32ZINC 393 221 ~ 224 223 302 330 439 327 477 483 320 350 552 32 of 32
Cyanide and Phenols (lbs/day) TimesJul Aug Sep Oct Nov Dec Jan Feb Mar Apr May Jun Average Maximum Detected
CYANIDE 12.1 10.8 11.3 11.2 15.5 14.5 20.5 14.9 19 21.6 15.2 18.9 15.5 21.6 0 of 38PHENOL 70.7 186 85.8 ~ 64.5 61.8 ~ ~ ~ ~ ~ ~ 88.4 186 13 of 14
Oil and Grease, Surfactants, and Petroleum Hydrocarbons (lbs/day) TimesJul Aug Sep Oct Nov Dec Jan Feb Mar Apr May Jun Average Maximum Detected
FATS OIL AND GREASE 85600 142000 116000 ~ 139000 100000 84800 145000 95900 123000 112000 95700 112000 156000 36 of 36MBAS 14600 13200 11100 13500 12200 10400 8030 9700 9530 8450 11200 10700 11200 15300 36 of 36PETROLEUM HYDROCARBON 1350 916 1380 1530 1640 1070 2660 1550 1410 1440 2050 2990 1770 4050 37 of 38
Table A-3. Deer Island Influent Loadings (North & South Systems), FY03
A-14

Organochlorine Pesticides and PCBs (lbs/day) TimesJul Aug Sep Oct Nov Dec Jan Feb Mar Apr May Jun Average Maximum Detected
2,4'-DDD 0.000334 0.000231 0.000267 0.000389 ~ 0.000301 ~ 0.000345 ~ 0.000498 ~ 0.000487 0.000359 0.000561 0 of 262,4'-DDE 0.000334 0.000231 0.000267 0.000389 ~ 0.000301 ~ 0.000345 ~ 0.000498 ~ 0.000487 0.000359 0.000561 0 of 262,4'-DDT 0.000334 0.000231 0.000267 0.000389 ~ 0.000301 ~ 0.000345 ~ 0.000498 ~ 0.000487 0.000359 0.000561 0 of 264,4'-DDD 0.00557 0.00343 0.00356 0.00299 0.00557 0.00741 0.00862 0.00576 0.00725 0.00647 0.00669 0.0077 0.00588 0.00862 24 of 624,4'-DDE 0.0077 0.00746 0.00591 0.00581 0.00557 0.00501 0.00862 0.00756 0.00725 0.0217 0.00669 0.013 0.00826 0.0217 28 of 624,4'-DDT 0.00628 0.00426 0.00359 0.00258 0.00557 0.00341 0.00862 0.00857 0.00725 0.00779 0.0132 0.00351 0.00641 0.0201 19 of 62ALDRIN 0.00464 0.00242 0.00288 0.00258 0.00557 0.00341 0.00862 0.00378 0.00725 0.00507 0.00669 0.00316 0.0046 0.00862 0 of 62ALPHA-BHC 0.00627 0.0046 0.00549 0.00478 0.00557 0.00653 0.00862 0.00722 0.00725 0.00964 0.00669 0.00849 0.00672 0.00964 0 of 36ALPHA-CHLORDANE 0.00739 0.00732 0.00641 0.00655 0.00557 0.00739 0.00862 0.0083 0.00725 0.0165 0.0214 0.0197 0.0106 0.0244 27 of 62AROCLOR-1016 0.157 0.115 0.137 0.12 0.139 0.163 0.216 0.18 0.181 0.241 0.167 0.213 0.168 0.241 0 of 36AROCLOR-1221 0.314 0.229 0.275 0.239 0.278 0.326 0.432 0.361 0.362 0.484 0.334 0.425 0.336 0.484 0 of 36AROCLOR-1232 0.157 0.115 0.137 0.12 0.139 0.163 0.216 0.18 0.181 0.241 0.167 0.213 0.168 0.241 0 of 36AROCLOR-1242 0.157 0.115 0.137 0.12 0.139 0.163 0.216 0.18 0.181 0.241 0.167 0.213 0.168 0.241 0 of 36AROCLOR-1248 0.157 0.115 0.137 0.12 0.139 0.163 0.216 0.18 0.181 0.241 0.167 0.213 0.168 0.241 0 of 36AROCLOR-1254 0.157 0.115 0.137 0.12 0.139 0.163 0.216 0.18 0.181 0.241 0.167 0.213 0.168 0.241 0 of 36AROCLOR-1260 0.157 0.115 0.137 0.12 0.139 0.163 0.216 0.18 0.181 0.241 0.167 0.213 0.168 0.241 0 of 36BETA-BHC 0.00627 0.0046 0.00549 0.00478 0.00557 0.00653 0.00862 0.00722 0.00725 0.00964 0.00669 0.00849 0.00672 0.00964 0 of 36CHLORDANE (TECHNICAL) 0.157 0.115 0.137 0.12 0.139 0.163 0.216 0.18 0.181 0.241 0.167 0.213 0.168 0.241 0 of 36DDMU 0.000334 0.000231 0.000267 0.000389 ~ 0.000301 ~ 0.000345 ~ 0.000498 ~ 0.000487 0.000359 0.000561 0 of 26DELTA-BHC 0.00627 0.0046 0.00549 0.00478 0.00557 0.00653 0.00862 0.00722 0.00725 0.00964 0.00669 0.00849 0.00672 0.00964 0 of 36DIELDRIN 0.00464 0.00242 0.00288 0.00258 0.00557 0.00341 0.00862 0.00378 0.00725 0.011 0.00669 0.00655 0.0053 0.011 10 of 62ENDOSULFAN I 0.00627 0.0046 0.00549 0.00478 0.00557 0.00653 0.00862 0.00722 0.00725 0.00964 0.00669 0.00849 0.00672 0.00964 0 of 36ENDOSULFAN II 0.00627 0.0046 0.00549 0.00478 0.00557 0.00653 0.00862 0.00722 0.00725 0.00964 0.00669 0.00849 0.00672 0.00964 0 of 36ENDOSULFAN SULFATE 0.00627 0.0046 0.00549 0.00478 0.00557 0.00653 0.00862 0.00722 0.00725 0.00964 0.00669 0.00849 0.00672 0.00964 0 of 36ENDRIN 0.00464 0.00242 0.00288 0.00258 0.00557 0.00341 0.00862 0.00378 0.00725 0.00507 0.00669 0.00316 0.0046 0.00862 0 of 62ENDRIN ALDEHYDE 0.00627 0.0046 0.00549 0.00478 0.00557 0.00653 0.00862 0.00722 0.00725 0.00964 0.00669 0.00849 0.00672 0.00964 0 of 36ENDRIN KETONE 0.00627 0.0046 0.00549 0.00478 0.00557 0.00653 0.00862 0.00722 0.00725 0.00964 0.00669 0.00849 0.00672 0.00964 0 of 36GAMMA-BHC (LINDANE) 0.00583 0.00585 0.00562 0.00562 0.00557 0.00341 0.00862 0.00378 0.00725 0.00898 0.00669 0.00316 0.00561 0.00898 12 of 62GAMMA-CHLORDANE 0.00787 0.00932 0.0072 0.00675 0.00557 0.00587 0.00862 0.00928 0.00725 0.0164 0.0201 0.0204 0.0108 0.0257 28 of 62HEPTACHLOR 0.00464 0.00242 0.00288 0.00258 0.00557 0.00341 0.00862 0.00378 0.00725 0.00507 0.00669 0.00316 0.0046 0.00862 0 of 62HEPTACHLOR EPOXIDE 0.00464 0.00242 0.00288 0.00258 0.00557 0.00341 0.00862 0.00378 0.00725 0.00507 0.00669 0.00316 0.0046 0.00862 0 of 62HEXACHLOROBENZENE 0.000334 0.000231 0.000267 0.000389 ~ 0.000301 ~ 0.000345 ~ 0.000498 ~ 0.000487 0.000359 0.000561 0 of 26METHOXYCHLOR 0.0627 0.046 0.0549 0.0478 0.0557 0.0653 0.0862 0.0722 0.0725 0.0964 0.0669 0.0849 0.0672 0.0964 0 of 36MIREX 0.000334 0.000231 0.000267 0.000389 ~ 0.000301 ~ 0.000345 ~ 0.000498 ~ 0.000487 0.000359 0.000561 0 of 26TOTAL CHLORDANE 0.0322 0.0296 0.00943 0.0232 ~ 0.0152 ~ 0.0254 ~ 0.0584 ~ 0.0494 0.0297 0.0608 24 of 26TOTAL DDT 0.0235 0.0165 0.0245 0.00773 ~ 0.0116 ~ 0.0221 ~ 0.0171 ~ 0.0157 0.0183 0.0276 26 of 26TOXAPHENE 0.157 0.115 0.137 0.12 0.139 0.163 0.216 0.18 0.181 0.241 0.167 0.213 0.168 0.241 0 of 36TRANS-NONACHLOR 0.00758 0.0056 0.00821 0.00615 ~ 0.0021 ~ 0.00466 ~ 0.0119 ~ 0.01 0.00719 0.0119 25 of 26
Table A-3. Deer Island Influent Loadings (North & South Systems), FY03 (cont.)
A-15

Semivolatile Organics (lbs/day) TimesJul Aug Sep Oct Nov Dec Jan Feb Mar Apr May Jun Average Maximum Detected
1,2,4-TRICHLOROBENZENE 2.83 2.35 5.94 2.63 2.78 2.99 4.47 3.23 3.52 5.05 3.13 4.34 3.64 9.56 0 of 361,2-DICHLOROBENZENE 2.83 2.35 5.94 2.63 2.78 2.99 4.47 3.23 3.52 5.05 3.13 4.34 3.64 9.56 0 of 361,2-DIPHENYLHYDRAZINE (AS AZOBENZENE) 2.83 2.35 5.94 2.63 2.78 2.99 4.47 3.23 3.52 5.05 3.13 4.34 3.64 9.56 0 of 361,3-DICHLOROBENZENE 2.83 2.35 5.94 2.63 2.78 2.99 4.47 3.23 3.52 5.05 3.13 4.34 3.64 9.56 0 of 361,4-DICHLOROBENZENE 2.83 2.35 5.94 2.63 2.78 2.99 4.47 3.23 3.52 5.05 3.13 4.34 3.64 9.56 0 of 362,2'-OXYBIS(1-CHLOROPROPANE) 2.83 2.35 5.94 2.63 2.78 2.99 4.47 3.23 3.52 5.05 3.13 4.34 3.64 9.56 0 of 362,4,5-TRICHLOROPHENOL 2.83 2.35 5.94 2.63 2.78 2.99 4.47 3.23 3.52 5.05 3.13 4.34 3.64 9.56 0 of 362,4,6-TRICHLOROPHENOL 2.83 2.35 5.94 2.63 2.78 2.99 4.47 3.23 3.52 5.05 3.13 4.34 3.64 9.56 0 of 362,4-DICHLOROPHENOL 2.83 2.35 5.94 2.63 2.78 2.99 4.47 3.23 3.52 5.05 3.13 4.34 3.64 9.56 0 of 362,4-DIMETHYLPHENOL 2.83 2.35 5.94 2.63 2.78 2.99 4.47 3.23 3.52 5.05 3.13 4.34 3.64 9.56 0 of 362,4-DINITROPHENOL 5.65 4.7 11.9 5.25 5.55 5.97 8.95 6.45 7.04 10.1 6.26 8.68 7.28 19.1 0 of 362,4-DINITROTOLUENE 2.83 2.35 5.94 2.63 2.78 2.99 4.47 3.23 3.52 5.05 3.13 4.34 3.64 9.56 0 of 362,6-DINITROTOLUENE 2.83 2.35 5.94 2.63 2.78 2.99 4.47 3.23 3.52 5.05 3.13 4.34 3.64 9.56 0 of 362-CHLORONAPHTHALENE 2.83 2.35 5.94 2.63 2.78 2.99 4.47 3.23 3.52 5.05 3.13 4.34 3.64 9.56 0 of 362-CHLOROPHENOL 2.83 2.35 5.94 2.63 2.78 2.99 4.47 3.23 3.52 5.05 3.13 4.34 3.64 9.56 0 of 362-METHYL-4,6-DINITROPHENOL 28.3 23.5 59.4 26.3 27.8 29.9 44.7 32.3 35.2 50.5 31.3 43.4 36.4 95.6 0 of 362-METHYLNAPHTHALENE 2.83 2.35 5.94 2.63 2.78 2.99 4.47 3.23 3.52 5.05 3.13 4.34 3.64 9.56 0 of 362-METHYLPHENOL 2.83 2.35 5.94 2.63 2.78 2.99 4.47 3.23 3.52 5.05 3.13 4.34 3.64 9.56 0 of 362-NITROANILINE 2.83 2.35 5.94 2.63 2.78 2.99 4.47 3.23 3.52 5.05 3.13 4.34 3.64 9.56 0 of 362-NITROPHENOL 2.83 2.35 5.94 2.63 2.78 2.99 4.47 3.23 3.52 5.05 3.13 4.34 3.64 9.56 0 of 363,3'-DICHLOROBENZIDINE 5.65 4.7 11.9 5.25 5.55 5.97 8.95 6.45 7.04 10.1 6.26 8.68 7.28 19.1 0 of 363-NITROANILINE 2.83 2.35 5.94 2.63 2.78 2.99 4.47 3.23 3.52 5.05 3.13 4.34 3.64 9.56 0 of 364-BROMOPHENYL PHENYL ETHER 2.83 2.35 5.94 2.63 2.78 2.99 4.47 3.23 3.52 5.05 3.13 4.34 3.64 9.56 0 of 364-CHLORO-3-METHYLPHENOL 2.83 2.35 5.94 2.63 2.78 2.99 4.47 3.23 3.52 5.05 3.13 4.34 3.64 9.56 0 of 364-CHLOROANILINE 2.83 2.35 7.4 2.63 2.78 2.99 4.47 3.23 3.52 5.05 3.13 4.34 3.8 9.56 1 of 364-CHLOROPHENYL PHENYL ETHER 2.83 2.35 5.94 2.63 2.78 2.99 4.47 3.23 3.52 5.05 3.13 4.34 3.64 9.56 0 of 364-METHYLPHENOL (INCLUDES 3-METHYLPHENOL) 25.8 20.7 35.6 54.7 22.9 16.5 4.47 45.4 3.52 23.1 83.4 18.9 32.6 85 23 of 364-NITROANILINE 2.83 2.35 5.94 2.63 2.78 2.99 4.47 3.23 3.52 5.05 3.13 4.34 3.64 9.56 0 of 364-NITROPHENOL 5.65 4.7 11.9 5.25 5.55 5.97 8.95 6.45 7.04 10.1 6.26 8.68 7.28 19.1 0 of 36ACENAPHTHENE 2.83 2.35 5.94 2.63 2.78 2.99 4.47 3.23 3.52 5.05 3.13 4.34 3.64 9.56 0 of 36ACENAPHTHYLENE 2.83 2.35 5.94 2.63 2.78 2.99 4.47 3.23 3.52 5.05 3.13 4.34 3.64 9.56 0 of 36ANILINE 2.83 2.35 5.94 2.63 2.78 2.99 4.47 3.23 3.52 5.05 3.13 4.34 3.64 9.56 0 of 36ANTHRACENE 2.83 2.35 5.94 2.63 2.78 2.99 4.47 3.23 3.52 5.05 3.13 4.34 3.64 9.56 0 of 36BENZIDINE 14.1 11.7 37.2 13.1 13.9 14.9 22.4 16.1 17.6 25.3 15.6 21.7 19 47.8 1 of 36
Table A-3. Deer Island Influent Loadings (North & South Systems), FY03 (cont.)
A-16

Semivolatile Organics (lbs/day) TimesJul Aug Sep Oct Nov Dec Jan Feb Mar Apr May Jun Average Maximum Detected
BENZO(A)ANTHRACENE 2.83 2.35 5.94 2.63 2.78 2.99 4.47 3.23 3.52 5.05 3.13 4.34 3.64 9.56 0 of 36BENZO(A)PYRENE 2.83 2.35 5.94 2.63 2.78 2.99 4.47 3.23 3.52 5.05 3.13 4.34 3.64 9.56 0 of 36BENZO(B)FLUORANTHENE 2.83 2.35 5.94 2.63 2.78 2.99 4.47 3.23 3.52 5.05 3.13 4.34 3.64 9.56 0 of 36BENZO(GHI)PERYLENE 2.83 2.35 5.94 2.63 2.78 2.99 4.47 3.23 3.52 5.05 3.13 4.34 3.64 9.56 0 of 36BENZO(K)FLUORANTHENE 2.83 2.35 5.94 2.63 2.78 2.99 4.47 3.23 3.52 5.05 3.13 4.34 3.64 9.56 0 of 36BENZOIC ACID 17.5 14.4 11.9 76.2 33.5 5.97 8.95 15.7 7.04 35.4 6.26 8.68 18.6 76.2 9 of 36BENZYL ALCOHOL 13.8 5.78 17.2 29.4 9.6 2.99 4.47 11.8 18.9 22.2 17.9 26.1 15.4 30.4 21 of 36BIS(2-CHLOROETHOXY)METHANE 2.83 2.35 5.94 2.63 2.78 2.99 4.47 3.23 3.52 5.05 3.13 4.34 3.64 9.56 0 of 36BIS(2-CHLOROETHYL)ETHER 2.83 2.35 5.94 2.63 2.78 2.99 4.47 3.23 3.52 5.05 3.13 4.34 3.64 9.56 0 of 36BIS(2-ETHYLHEXYL)PHTHALATE 37.4 33 47.7 45.9 40 52.1 28.1 62.2 32.4 79.7 45.3 26.3 43.8 79.7 32 of 36BUTYL BENZYL PHTHALATE 2.83 2.35 5.94 2.63 2.78 2.99 4.47 3.23 3.52 5.05 3.13 4.34 3.64 9.56 0 of 36CHRYSENE 2.83 2.35 5.94 2.63 2.78 2.99 4.47 3.23 3.52 5.05 3.13 4.34 3.64 9.56 0 of 36DI-N-BUTYLPHTHALATE 2.83 2.35 5.94 2.63 2.78 2.99 4.47 3.23 3.52 5.05 3.13 4.34 3.64 9.56 0 of 36DI-N-OCTYLPHTHALATE 2.83 2.35 5.94 2.63 2.78 2.99 4.47 3.23 3.52 5.05 3.13 4.34 3.64 9.56 0 of 36DIBENZO(A,H)ANTHRACENE 2.83 2.35 5.94 2.63 2.78 2.99 4.47 3.23 3.52 5.05 3.13 4.34 3.64 9.56 0 of 36DIBENZOFURAN 2.83 2.35 5.94 2.63 2.78 2.99 4.47 3.23 3.52 5.05 3.13 4.34 3.64 9.56 0 of 36DIETHYL PHTHALATE 2.83 2.35 7.66 10.9 5.07 2.99 4.47 3.23 3.52 5.05 3.13 4.34 4.54 10.9 3 of 36DIMETHYL PHTHALATE 2.83 2.35 5.94 2.63 2.78 2.99 4.47 3.23 3.52 5.05 3.13 4.34 3.64 9.56 0 of 36FLUORANTHENE 2.83 2.35 5.94 2.63 2.78 2.99 4.47 3.23 3.52 5.05 3.13 4.34 3.64 9.56 0 of 36FLUORENE 2.83 2.35 5.94 2.63 2.78 2.99 4.47 3.23 3.52 5.05 3.13 4.34 3.64 9.56 0 of 36HEXACHLOROBENZENE 2.83 2.35 5.94 2.63 2.78 2.99 4.47 3.23 3.52 5.05 3.13 4.34 3.64 9.56 0 of 36HEXACHLOROBUTADIENE 2.83 2.35 5.94 2.63 2.78 2.99 4.47 3.23 3.52 5.05 3.13 4.34 3.64 9.56 0 of 36HEXACHLOROCYCLOPENTADIENE 14.1 11.7 29.7 13.1 13.9 14.9 22.4 16.1 17.6 25.3 15.6 21.7 18.2 47.8 0 of 36HEXACHLOROETHANE 2.83 2.35 5.94 2.63 2.78 2.99 4.47 3.23 3.52 5.05 3.13 4.34 3.64 9.56 0 of 36INDENO(1,2,3-CD)PYRENE 2.83 2.35 5.94 2.63 2.78 2.99 4.47 3.23 3.52 5.05 3.13 4.34 3.64 9.56 0 of 36ISOPHORONE 2.83 2.35 5.94 2.63 2.78 2.99 4.47 3.23 3.52 5.05 3.13 4.34 3.64 9.56 0 of 36N-NITROSODI-N-PROPYLAMINE 2.83 2.35 5.94 2.63 2.78 2.99 4.47 3.23 3.52 5.05 3.13 4.34 3.64 9.56 0 of 36N-NITROSODIMETHYLAMINE 2.83 2.35 5.94 2.63 2.78 2.99 4.47 3.23 3.52 5.05 3.13 4.34 3.64 9.56 0 of 36N-NITROSODIPHENYLAMINE 2.83 2.35 5.94 2.63 2.78 2.99 4.47 3.23 3.52 5.05 3.13 4.34 3.64 9.56 0 of 36NAPHTHALENE 2.83 2.35 5.94 2.63 2.78 2.99 4.47 3.23 3.52 5.05 3.13 4.34 3.64 9.56 0 of 36NITROBENZENE 2.83 2.35 5.94 2.63 2.78 2.99 4.47 3.23 3.52 5.05 3.13 4.34 3.64 9.56 0 of 36PENTACHLOROPHENOL 8.48 7.05 17.8 7.88 8.33 8.96 13.4 9.68 10.6 15.2 9.38 13 10.9 28.7 0 of 36PHENANTHRENE 0.283 0.235 0.594 0.263 0.278 0.299 0.447 0.323 0.352 0.505 0.313 0.434 0.364 0.956 0 of 36PHENOL 5.65 4.7 11.9 13 5.55 5.97 8.95 6.45 7.04 10.1 6.26 8.68 7.71 19.1 1 of 36PYRENE 2.83 2.35 5.94 2.63 2.78 2.99 4.47 3.23 3.52 5.05 3.13 4.34 3.64 9.56 0 of 36
Table A-3. Deer Island Influent Loadings (North & South Systems), FY03 (cont.)
A-17

Volatile Organics (lbs/day) TimesJul Aug Sep Oct Nov Dec Jan Feb Mar Apr May Jun Average Maximum Detected
1,1,1-TRICHLOROETHANE 1.21 1.08 1.13 1.12 1.55 1.45 2.05 1.49 1.9 2.16 1.52 1.89 1.55 2.16 0 of 381,1,2,2-TETRACHLOROETHANE 1.21 1.08 1.13 1.12 1.55 1.45 2.05 1.49 1.9 2.16 1.52 1.89 1.55 2.16 0 of 381,1,2-TRICHLOROETHANE 1.21 1.08 1.13 1.12 1.55 1.45 2.05 1.49 1.9 2.16 1.52 1.89 1.55 2.16 0 of 381,1-DICHLOROETHANE 1.21 1.08 1.13 1.12 1.55 1.45 2.05 1.49 1.9 2.16 1.52 1.89 1.55 2.16 0 of 381,1-DICHLOROETHENE 1.21 1.08 1.13 1.12 1.55 1.45 2.05 1.49 1.9 2.16 1.52 1.89 1.55 2.16 0 of 381,2-DICHLOROBENZENE 1.21 1.08 1.13 1.12 1.55 1.45 2.05 1.49 1.9 2.16 1.52 1.89 1.55 2.16 0 of 381,2-DICHLOROETHANE 1.21 1.08 1.13 1.12 1.55 1.45 2.05 1.49 1.9 2.16 1.52 1.89 1.55 2.16 0 of 381,2-DICHLOROPROPANE 1.21 1.08 1.13 1.12 1.55 1.45 2.05 1.49 1.9 2.16 1.52 1.89 1.55 2.16 0 of 381,3-DICHLOROBENZENE 1.21 1.08 2.06 1.12 1.55 1.45 2.05 1.49 1.9 2.16 1.52 1.89 1.64 3.01 1 of 381,4-DICHLOROBENZENE 2.72 2.53 2.99 2.71 1.55 1.45 2.05 1.49 1.9 2.16 1.52 1.89 2.06 4.24 5 of 382-BUTANONE 8.88 12.8 14 13.6 8.31 1.45 5.95 3.16 1.9 2.16 1.52 10.5 7.19 19.6 17 of 382-CHLOROETHYL VINYL ETHER 1.21 1.08 1.13 1.12 1.55 1.45 2.05 1.49 1.9 2.16 1.52 1.89 1.55 2.16 0 of 382-HEXANONE 1.21 1.08 1.13 1.12 1.55 1.45 2.05 1.49 1.9 2.16 1.52 1.89 1.55 2.16 0 of 384-METHYL-2-PENTANONE 1.21 1.08 1.13 1.12 1.55 1.45 2.05 1.49 1.9 2.16 1.52 1.89 1.55 2.16 0 of 38ACETONE 293 398 320 318 346 459 348 227 583 447 702 268 380 1170 37 of 38ACROLEIN 1.21 1.08 1.13 1.12 1.55 1.45 2.05 2.97 3.8 4.32 3.05 3.78 2.28 4.32 0 of 38ACRYLONITRILE 1.21 1.08 1.13 1.12 1.55 1.45 2.05 2.97 3.8 4.32 3.05 3.78 2.28 4.32 0 of 38BENZENE 1.21 1.08 1.13 1.12 1.55 1.45 10 1.49 9.84 2.16 1.52 1.89 2.8 10.8 3 of 38BROMODICHLOROMETHANE 1.21 1.08 1.13 1.12 1.55 1.45 2.05 1.49 1.9 2.16 1.52 1.89 1.55 2.16 0 of 38BROMOFORM 1.21 1.08 1.13 1.12 1.55 1.45 2.05 1.49 1.9 2.16 1.52 1.89 1.55 2.16 0 of 38BROMOMETHANE 1.21 1.08 1.13 1.12 1.55 1.45 2.05 1.49 1.9 2.16 1.52 1.89 1.55 2.16 0 of 38CARBON DISULFIDE 1.21 12.1 1.13 3.05 12.1 1.45 4.58 1.49 8.83 2.16 1.52 1.89 3.97 22.9 6 of 38CARBON TETRACHLORIDE 1.21 1.08 1.13 1.12 1.55 1.45 2.05 1.49 1.9 2.16 1.52 1.89 1.55 2.16 0 of 38CHLOROBENZENE 1.21 1.08 1.13 1.12 1.55 1.45 2.05 1.49 1.9 2.16 1.52 1.89 1.55 2.16 0 of 38CHLOROETHANE 1.21 1.08 1.13 1.12 1.55 1.45 2.05 1.49 1.9 2.16 1.52 1.89 1.55 2.16 0 of 38CHLOROFORM 16 16.1 14.6 13.3 12 10.1 14.7 16.8 19.9 20.3 21.5 16 15.9 22.8 36 of 38CHLOROMETHANE 1.21 1.08 1.13 1.12 1.55 1.45 2.05 1.49 1.9 2.16 1.52 1.89 1.55 2.16 0 of 38CIS-1,2-DICHLOROETHENE 1.21 1.08 1.13 1.12 1.55 1.45 2.05 1.49 1.9 2.16 1.52 1.89 1.55 2.16 0 of 38CIS-1,3-DICHLOROPROPENE 1.21 1.08 1.13 1.12 1.55 1.45 2.05 1.49 1.9 2.16 1.52 1.89 1.55 2.16 0 of 38DIBROMOCHLOROMETHANE 1.21 1.08 1.13 1.12 1.55 1.45 2.05 1.49 1.9 2.16 1.52 1.89 1.55 2.16 0 of 38ETHYLBENZENE 1.21 1.08 1.13 1.12 1.55 1.45 2.05 1.49 1.9 2.16 1.52 1.89 1.55 2.16 0 of 38M,P-XYLENE 1.21 6.54 1.13 1.12 1.55 1.45 2.05 2.97 3.8 4.32 3.05 3.78 2.56 6.54 1 of 38METHYLENE CHLORIDE 1.21 6.69 3.98 1.12 1.55 1.45 2.05 2.52 1.9 5.5 3.55 3.61 2.82 6.8 8 of 38O-XYLENE 1.21 2.88 1.13 1.12 1.55 1.45 2.05 1.49 1.9 2.16 1.52 1.89 1.64 2.88 1 of 38STYRENE 1.21 1.08 1.13 1.12 1.55 1.45 2.05 1.49 1.9 2.16 13.2 1.89 2.78 24.9 1 of 38TETRACHLOROETHENE 4.83 12.3 5.13 6.73 4.32 1.45 7.12 24.9 13.5 13.6 7.42 4.07 8.59 32.2 21 of 38TOLUENE 17.8 12.7 12.3 12.1 13.8 7.87 16.6 11.3 12.7 7.82 8.63 3.78 11.7 31.3 29 of 38TRANS-1,2-DICHLOROETHENE 1.21 1.08 1.13 1.12 1.55 1.45 2.05 1.49 1.9 2.16 1.52 1.89 1.55 2.16 0 of 38TRANS-1,3-DICHLOROPROPENE 1.21 1.08 1.13 1.12 1.55 1.45 2.05 1.49 1.9 2.16 1.52 1.89 1.55 2.16 0 of 38TRICHLOROETHENE 2.03 1.08 1.13 1.12 1.55 1.45 2.05 2.63 1.9 2.16 1.52 1.89 1.75 3.68 2 of 38TRICHLOROFLUOROMETHANE 1.21 1.08 1.13 1.12 1.55 1.45 2.05 1.49 1.9 2.16 1.52 1.89 1.55 2.16 0 of 38VINYL ACETATE 1.21 1.08 1.13 1.12 1.55 1.45 2.05 1.49 1.9 2.16 1.52 1.89 1.55 2.16 0 of 38VINYL CHLORIDE 1.21 1.08 1.13 1.12 1.55 1.45 2.05 1.49 1.9 2.16 1.52 1.89 1.55 2.16 0 of 38
Notes~: No data or no samples takenResults in bold indicate one or more detects that monthYearly averages are calculated from individual results collected during the fiscal year.Non-detected compounds are assumed to equal one half of the detection limit for metals and inorganics and one tenth of the reporting limit for organic compounds.
Table A-3. Deer Island Influent Loadings (North & South Systems), FY03 (cont.)
A-18

Metals (ug/L) TimesJul Aug Sep Oct Nov Dec Jan Feb Mar Apr May Jun Average Maximum Detected
ANTIMONY 8.98 8.73 ~ 7.5 10 10 10 8.68 7.5 7.5 7.5 10 8.79 10 0 of 22ARSENIC 1.63 0.866 ~ 0.4 0.4 1.03 0.4 0.69 0.792 0.4 1.61 0.4 0.759 1.84 9 of 23BERYLLIUM 0.25 0.25 ~ 0.25 0.25 0.25 0.25 0.25 0.25 0.25 0.25 0.25 0.25 0.25 0 of 22BORON 204 193 ~ 346 375 192 125 185 125 125 125 125 183 382 8 of 22CADMIUM 0.491 0.41 ~ 0.446 0.228 0.46 0.39 0.409 0.41 0.484 0.44 0.344 0.41 0.599 22 of 22CHROMIUM 5.02 4.9 ~ 4.5 2.23 4.56 3.29 4.6 3.42 3.35 3.09 2.87 3.72 7.27 22 of 22COPPER 89.1 99.9 ~ 91.3 57.8 64.9 48.4 68.7 46.6 46.4 55.3 34.3 60.9 141 22 of 22HEXAVALENT CHROMIUM 2.5 2.5 2.5 2.5 2.5 2.5 2.5 2.5 2.5 2.5 2.5 2.5 2.5 2.5 0 of 24IRON 2850 2610 ~ 1670 1510 2160 1640 2300 1610 1800 1990 1290 1910 3420 22 of 22LEAD 26.9 9.51 ~ 13.6 9.94 7.17 7.77 18.6 5.65 6.7 7.44 6.09 10.5 37.1 22 of 22MERCURY 0.173 0.241 ~ 0.24 0.14 0.145 0.112 0.239 0.154 0.22 0.209 0.109 0.176 0.325 22 of 22MOLYBDENUM 10.6 13.7 ~ 13.8 12 4.13 6.22 15.9 9.02 9.24 6.79 10 9.89 19.8 22 of 22NICKEL 5.55 5.74 ~ 4.19 4.62 6.13 4.25 4.66 3.76 3.95 3.97 4.18 4.57 8.29 22 of 22SELENIUM 0.45 0.45 ~ 0.45 0.45 0.45 0.45 0.45 0.45 0.45 0.45 0.45 0.45 0.45 0 of 22SILVER 1.86 2.04 ~ 3.37 2.28 2.23 1.62 2.12 1.96 1.63 2.33 1.46 2.02 5.2 23 of 23THALLIUM 0.5 0.5 ~ 0.5 0.5 0.5 0.5 0.5 0.5 0.5 0.5 0.5 0.5 0.5 0 of 22ZINC 166 153 ~ 138 87.8 116 105 129 103 101 108 76.6 114 205 22 of 22
Cyanide and Phenols (ug/L) TimesJul Aug Sep Oct Nov Dec Jan Feb Mar Apr May Jun Average Maximum Detected
CYANIDE 5 5 5 5 5 5 5 5 5 5 5 5 5 5 0 of 24PHENOL 28.3 90.1 21.7 18.6 20.3 17.8 ~ ~ ~ ~ ~ ~ 32.7 105 10 of 11
Oil and Grease, Surfactants, and Petroleum Hydrocarbons (mg/L) TimesJul Aug Sep Oct Nov Dec Jan Feb Mar Apr May Jun Average Maximum Detected
FATS OIL AND GREASE 32.6 62.1 52.5 35 42.9 35.5 21 47 29.8 29.5 39.5 27.1 36.2 72 23 of 23MBAS 5.03 5.39 4.57 5.18 3.97 3.52 24.2 27.1 28 22.6 36.2 29.4 35.3 6.69 24 of 24PETROLEUM HYDROCARBON 0.461 0.366 0.632 0.394 0.56 0.375 0.886 0.408 0.404 0.254 0.485 0.731 0.493 1.4 24 of 24
Table A-4. Deer Island Influent Characterization (North System), FY03
A-19

Organochlorine Pesticides and PCBs (ug/L) TimesJul Aug Sep Oct Nov Dec Jan Feb Mar Apr May Jun Average Maximum Detected
2,4'-DDD 0.000107 0.000106 0.000119 0.000157 ~ 0.000307 ~ 0.000113 ~ 0.000116 ~ 0.000133 0.000145 0.0005 0 of 172,4'-DDE 0.000107 0.000106 0.000119 0.000157 ~ 0.000307 ~ 0.000113 ~ 0.000116 ~ 0.000133 0.000145 0.0005 0 of 172,4'-DDT 0.000107 0.000106 0.000119 0.000157 ~ 0.000307 ~ 0.000113 ~ 0.000116 ~ 0.000133 0.000145 0.0005 0 of 174,4'-DDD 0.00217 0.00189 0.00144 0.00167 0.00212 0.00283 0.00219 0.00196 0.00213 0.00151 0.00216 0.00215 0.00203 0.00297 15 of 414,4'-DDE 0.00309 0.00363 0.00259 0.00272 0.00212 0.00202 0.00219 0.00247 0.00213 0.0046 0.00216 0.00328 0.00278 0.00684 18 of 414,4'-DDT 0.00247 0.00204 0.00156 0.00265 0.00212 0.00125 0.00219 0.00301 0.00213 0.00183 0.00216 0.000897 0.00201 0.00411 13 of 41ALDRIN 0.00175 0.00124 0.00125 0.00118 0.00212 0.00125 0.00219 0.00134 0.00213 0.00115 0.00216 0.000797 0.00156 0.0026 0 of 41ALPHA-BHC 0.00237 0.00238 0.00239 0.0022 0.00212 0.00219 0.00219 0.00256 0.00213 0.00218 0.00216 0.00213 0.00224 0.00267 0 of 24ALPHA-CHLORDANE 0.00281 0.00465 0.00203 0.0026 0.00212 0.00292 0.00219 0.00238 0.00213 0.00293 0.00216 0.00355 0.00269 0.00603 16 of 41AROCLOR-1016 0.0594 0.0596 0.0597 0.0552 0.0531 0.0548 0.0547 0.0641 0.0532 0.0545 0.054 0.0532 0.0561 0.0667 0 of 24AROCLOR-1221 0.119 0.119 0.119 0.11 0.106 0.109 0.109 0.128 0.107 0.109 0.108 0.107 0.112 0.133 0 of 24AROCLOR-1232 0.0594 0.0596 0.0597 0.0552 0.0531 0.0548 0.0547 0.0641 0.0532 0.0545 0.054 0.0532 0.0561 0.0667 0 of 24AROCLOR-1242 0.0594 0.0596 0.0597 0.0552 0.0531 0.0548 0.0547 0.0641 0.0532 0.0545 0.054 0.0532 0.0561 0.0667 0 of 24AROCLOR-1248 0.0594 0.0596 0.0597 0.0552 0.0531 0.0548 0.0547 0.0641 0.0532 0.0545 0.054 0.0532 0.0561 0.0667 0 of 24AROCLOR-1254 0.0594 0.0596 0.0597 0.0552 0.0531 0.0548 0.0547 0.0641 0.0532 0.0545 0.054 0.0532 0.0561 0.0667 0 of 24AROCLOR-1260 0.0594 0.0596 0.0597 0.0552 0.0531 0.0548 0.0547 0.0641 0.0532 0.0545 0.054 0.0532 0.0561 0.0667 0 of 24BETA-BHC 0.00237 0.00238 0.00239 0.0022 0.00212 0.00219 0.00219 0.00256 0.00213 0.00218 0.00216 0.00213 0.00224 0.00267 0 of 24CHLORDANE (TECHNICAL) 0.0594 0.0596 0.0597 0.0552 0.0531 0.0548 0.0547 0.0641 0.0532 0.0545 0.054 0.0532 0.0561 0.0667 0 of 24DDMU 0.000107 0.000106 0.000119 0.000157 ~ 0.000307 ~ 0.000113 ~ 0.000116 ~ 0.000133 0.000145 0.0005 0 of 17DELTA-BHC 0.00237 0.00238 0.00239 0.0022 0.00212 0.00219 0.00219 0.00256 0.00213 0.00218 0.00216 0.00213 0.00224 0.00267 0 of 24DIELDRIN 0.00175 0.00124 0.00125 0.00118 0.00212 0.00125 0.00219 0.00134 0.00213 0.00209 0.00216 0.00117 0.0017 0.0026 6 of 41ENDOSULFAN I 0.00237 0.00238 0.00239 0.0022 0.00212 0.00219 0.00219 0.00256 0.00213 0.00218 0.00216 0.00213 0.00224 0.00267 0 of 24ENDOSULFAN II 0.00237 0.00238 0.00239 0.0022 0.00212 0.00219 0.00219 0.00256 0.00213 0.00218 0.00216 0.00213 0.00224 0.00267 0 of 24ENDOSULFAN SULFATE 0.00237 0.00238 0.00239 0.0022 0.00212 0.00219 0.00219 0.00256 0.00213 0.00218 0.00216 0.00213 0.00224 0.00267 0 of 24ENDRIN 0.00175 0.00124 0.00125 0.00118 0.00212 0.00125 0.00219 0.00134 0.00213 0.00115 0.00216 0.000797 0.00156 0.0026 0 of 41ENDRIN ALDEHYDE 0.00237 0.00238 0.00239 0.0022 0.00212 0.00219 0.00219 0.00256 0.00213 0.00218 0.00216 0.00213 0.00224 0.00267 0 of 24ENDRIN KETONE 0.00237 0.00238 0.00239 0.0022 0.00212 0.00219 0.00219 0.00256 0.00213 0.00218 0.00216 0.00213 0.00224 0.00267 0 of 24GAMMA-BHC (LINDANE) 0.0022 0.00334 0.00265 0.002 0.00212 0.00125 0.00219 0.00134 0.00213 0.00166 0.00216 0.000797 0.00193 0.00379 9 of 41GAMMA-CHLORDANE 0.00301 0.00457 0.00229 0.00267 0.00212 0.00258 0.00219 0.00271 0.00213 0.00278 0.00216 0.00334 0.00268 0.00477 16 of 41HEPTACHLOR 0.00175 0.00124 0.00125 0.00118 0.00212 0.00125 0.00219 0.00134 0.00213 0.00115 0.00216 0.000797 0.00156 0.0026 0 of 41HEPTACHLOR EPOXIDE 0.00175 0.00124 0.00125 0.00118 0.00212 0.00125 0.00219 0.00134 0.00213 0.00115 0.00216 0.000797 0.00156 0.0026 0 of 41HEXACHLOROBENZENE 0.000107 0.000106 0.000119 0.000157 ~ 0.000307 ~ 0.000113 ~ 0.000116 ~ 0.000133 0.000145 0.0005 0 of 17METHOXYCHLOR 0.0237 0.0238 0.0239 0.022 0.0212 0.0219 0.0219 0.0256 0.0213 0.0218 0.0216 0.0213 0.0224 0.0267 0 of 24MIREX 0.000107 0.000106 0.000119 0.000157 ~ 0.000307 ~ 0.000113 ~ 0.000116 ~ 0.000133 0.000145 0.0005 0 of 17TOTAL CHLORDANE 0.0105 0.0168 0.00389 0.00805 ~ 0.00836 ~ 0.00616 ~ 0.00899 ~ 0.00667 0.00843 0.0203 15 of 17TOTAL DDT 0.00869 0.00796 0.00624 0.00728 ~ 0.00527 ~ 0.00718 ~ 0.00434 ~ 0.00423 0.00606 0.0114 17 of 17TOXAPHENE 0.0594 0.0596 0.0597 0.0552 0.0531 0.0548 0.0547 0.0641 0.0532 0.0545 0.054 0.0532 0.0561 0.0667 0 of 24TRANS-NONACHLOR 0.00246 0.0032 0.00238 0.00192 ~ 0.00186 ~ 0.00112 ~ 0.00191 ~ 0.00191 0.00202 0.00397 16 of 17
Table A-4. Deer Island Influent Characterization (North System), FY03 (cont.)
A-20

Semivolatile Organics (ug/L) TimesJul Aug Sep Oct Nov Dec Jan Feb Mar Apr May Jun Average Maximum Detected
1,2,4-TRICHLOROBENZENE 1.05 1.06 1.14 1.13 1.06 1.04 1.04 1.05 1.14 1.11 1 1.11 1.08 1.27 0 of 241,2-DICHLOROBENZENE 1.05 1.06 1.14 1.13 1.06 1.04 1.04 1.05 1.14 1.11 1 1.11 1.08 1.27 0 of 241,2-DIPHENYLHYDRAZINE (AS AZOBENZENE) 1.05 1.06 1.14 1.13 1.06 1.04 1.04 1.05 1.14 1.11 1 1.11 1.08 1.27 0 of 241,3-DICHLOROBENZENE 1.05 1.06 1.14 1.13 1.06 1.04 1.04 1.05 1.14 1.11 1 1.11 1.08 1.27 0 of 241,4-DICHLOROBENZENE 1.05 1.06 1.14 1.13 1.06 1.04 1.04 1.05 1.14 1.11 1 1.11 1.08 1.27 0 of 242,2'-OXYBIS(1-CHLOROPROPANE) 1.05 1.06 1.14 1.13 1.06 1.04 1.04 1.05 1.14 1.11 1 1.11 1.08 1.27 0 of 242,4,5-TRICHLOROPHENOL 1.05 1.06 1.14 1.13 1.06 1.04 1.04 1.05 1.14 1.11 1 1.11 1.08 1.27 0 of 242,4,6-TRICHLOROPHENOL 1.05 1.06 1.14 1.13 1.06 1.04 1.04 1.05 1.14 1.11 1 1.11 1.08 1.27 0 of 242,4-DICHLOROPHENOL 1.05 1.06 1.14 1.13 1.06 1.04 1.04 1.05 1.14 1.11 1 1.11 1.08 1.27 0 of 242,4-DIMETHYLPHENOL 1.05 1.06 1.14 1.13 1.06 1.04 1.04 1.05 1.14 1.11 1 1.11 1.08 1.27 0 of 242,4-DINITROPHENOL 2.1 2.13 2.28 2.26 2.12 2.09 2.08 2.1 2.27 2.21 2 2.23 2.15 2.54 0 of 242,4-DINITROTOLUENE 1.05 1.06 1.14 1.13 1.06 1.04 1.04 1.05 1.14 1.11 1 1.11 1.08 1.27 0 of 242,6-DINITROTOLUENE 1.05 1.06 1.14 1.13 1.06 1.04 1.04 1.05 1.14 1.11 1 1.11 1.08 1.27 0 of 242-CHLORONAPHTHALENE 1.05 1.06 1.14 1.13 1.06 1.04 1.04 1.05 1.14 1.11 1 1.11 1.08 1.27 0 of 242-CHLOROPHENOL 1.05 1.06 1.14 1.13 1.06 1.04 1.04 1.05 1.14 1.11 1 1.11 1.08 1.27 0 of 242-METHYL-4,6-DINITROPHENOL 10.5 10.6 11.4 11.3 10.6 10.4 10.4 10.5 11.4 11.1 10 11.1 10.8 12.7 0 of 242-METHYLNAPHTHALENE 1.05 1.06 1.14 1.13 1.06 1.04 1.04 1.05 1.14 1.11 1 1.11 1.08 1.27 0 of 242-METHYLPHENOL 1.05 1.06 1.14 1.13 1.06 1.04 1.04 1.05 1.14 1.11 1 1.11 1.08 1.27 0 of 242-NITROANILINE 1.05 1.06 1.14 1.13 1.06 1.04 1.04 1.05 1.14 1.11 1 1.11 1.08 1.27 0 of 242-NITROPHENOL 1.05 1.06 1.14 1.13 1.06 1.04 1.04 1.05 1.14 1.11 1 1.11 1.08 1.27 0 of 243,3'-DICHLOROBENZIDINE 2.1 2.13 2.28 2.26 2.12 2.09 2.08 2.1 2.27 2.21 2 2.23 2.15 2.54 0 of 243-NITROANILINE 1.05 1.06 1.14 1.13 1.06 1.04 1.04 1.05 1.14 1.11 1 1.11 1.08 1.27 0 of 244-BROMOPHENYL PHENYL ETHER 1.05 1.06 1.14 1.13 1.06 1.04 1.04 1.05 1.14 1.11 1 1.11 1.08 1.27 0 of 244-CHLORO-3-METHYLPHENOL 1.05 1.06 1.14 1.13 1.06 1.04 1.04 1.05 1.14 1.11 1 1.11 1.08 1.27 0 of 244-CHLOROANILINE 1.05 1.06 1.14 1.13 1.06 1.04 1.04 1.05 1.14 1.11 1 1.11 1.08 1.27 0 of 244-CHLOROPHENYL PHENYL ETHER 1.05 1.06 1.14 1.13 1.06 1.04 1.04 1.05 1.14 1.11 1 1.11 1.08 1.27 0 of 244-METHYLPHENOL (INCLUDES 3-METHYLPHENOL) 4.77 9.57 14.5 20.1 1.06 4.73 1.04 7.53 3.93 4.62 11.7 5.43 6.76 20.8 14 of 244-NITROANILINE 1.05 1.06 1.14 1.13 1.06 1.04 1.04 1.05 1.14 1.11 1 1.11 1.08 1.27 0 of 244-NITROPHENOL 2.1 2.13 2.28 2.26 2.12 2.09 2.08 2.1 2.27 2.21 2 2.23 2.15 2.54 0 of 24ACENAPHTHENE 1.05 1.06 1.14 1.13 1.06 1.04 1.04 1.05 1.14 1.11 1 1.11 1.08 1.27 0 of 24ACENAPHTHYLENE 1.05 1.06 1.14 1.13 1.06 1.04 1.04 1.05 1.14 1.11 1 1.11 1.08 1.27 0 of 24ANILINE 1.05 1.06 1.14 1.13 1.06 1.04 1.04 1.05 1.14 1.11 1 1.11 1.08 1.27 0 of 24ANTHRACENE 1.05 1.06 1.14 1.13 1.06 1.04 1.04 1.05 1.14 1.11 1 1.11 1.08 1.27 0 of 24BENZIDINE 5.24 5.32 5.7 5.64 5.3 5.22 5.2 5.26 5.68 5.53 5 5.56 5.39 6.35 0 of 24
Table A-4. Deer Island Influent Characterization (North System), FY03 (cont.)
A-21

Semivolatile Organics (ug/L) TimesJul Aug Sep Oct Nov Dec Jan Feb Mar Apr May Jun Average Maximum Detected
BENZO(A)ANTHRACENE 1.05 1.06 1.14 1.13 1.06 1.04 1.04 1.05 1.14 1.11 1 1.11 1.08 1.27 0 of 24BENZO(A)PYRENE 1.05 1.06 1.14 1.13 1.06 1.04 1.04 1.05 1.14 1.11 1 1.11 1.08 1.27 0 of 24BENZO(B)FLUORANTHENE 1.05 1.06 1.14 1.13 1.06 1.04 1.04 1.05 1.14 1.11 1 1.11 1.08 1.27 0 of 24BENZO(GHI)PERYLENE 1.05 1.06 1.14 1.13 1.06 1.04 1.04 1.05 1.14 1.11 1 1.11 1.08 1.27 0 of 24BENZO(K)FLUORANTHENE 1.05 1.06 1.14 1.13 1.06 1.04 1.04 1.05 1.14 1.11 1 1.11 1.08 1.27 0 of 24BENZOIC ACID 2.1 2.13 2.28 22.3 2.12 2.09 2.08 2.1 9.3 7.12 2 2.23 4.6 30.1 4 of 24BENZYL ALCOHOL 3.82 1.06 7.24 19.1 1.06 1.04 1.04 3.83 11.3 4.44 4.99 10 5.6 25.5 12 of 24BIS(2-CHLOROETHOXY)METHANE 1.05 1.06 1.14 1.13 1.06 1.04 1.04 1.05 1.14 1.11 1 1.11 1.08 1.27 0 of 24BIS(2-CHLOROETHYL)ETHER 1.05 1.06 1.14 1.13 1.06 1.04 1.04 1.05 1.14 1.11 1 1.11 1.08 1.27 0 of 24BIS(2-ETHYLHEXYL)PHTHALATE 15.2 18.1 23.2 30.4 16.7 17.2 10.3 20.3 12.7 14.6 9.96 10.1 15.8 36.3 24 of 24BUTYL BENZYL PHTHALATE 1.05 1.06 1.14 1.13 1.06 1.04 1.04 1.05 1.14 1.11 1 1.11 1.08 1.27 0 of 24CHRYSENE 1.05 1.06 1.14 1.13 1.06 1.04 1.04 1.05 1.14 1.11 1 1.11 1.08 1.27 0 of 24DI-N-BUTYLPHTHALATE 1.05 1.06 1.14 5.52 1.06 1.04 1.04 1.05 1.14 1.11 1 1.11 1.36 9.69 1 of 24DI-N-OCTYLPHTHALATE 1.05 1.06 1.14 1.13 1.06 1.04 1.04 1.05 1.14 1.11 1 1.11 1.08 1.27 0 of 24DIBENZO(A,H)ANTHRACENE 1.05 1.06 1.14 1.13 1.06 1.04 1.04 1.05 1.14 1.11 1 1.11 1.08 1.27 0 of 24DIBENZOFURAN 1.05 1.06 1.14 1.13 1.06 1.04 1.04 1.05 1.14 1.11 1 1.11 1.08 1.27 0 of 24DIETHYL PHTHALATE 1.05 1.06 1.14 6.57 1.06 1.04 1.04 1.05 1.14 1.11 1 1.11 1.42 6.74 2 of 24DIMETHYL PHTHALATE 1.05 1.06 1.14 1.13 1.06 1.04 1.04 1.05 1.14 1.11 1 1.11 1.08 1.27 0 of 24FLUORANTHENE 1.05 1.06 1.14 1.13 1.06 1.04 1.04 1.05 1.14 1.11 1 1.11 1.08 1.27 0 of 24FLUORENE 1.05 1.06 1.14 1.13 1.06 1.04 1.04 1.05 1.14 1.11 1 1.11 1.08 1.27 0 of 24HEXACHLOROBENZENE 1.05 1.06 1.14 1.13 1.06 1.04 1.04 1.05 1.14 1.11 1 1.11 1.08 1.27 0 of 24HEXACHLOROBUTADIENE 1.05 1.06 1.14 1.13 1.06 1.04 1.04 1.05 1.14 1.11 1 1.11 1.08 1.27 0 of 24HEXACHLOROCYCLOPENTADIENE 5.24 5.32 5.7 5.64 5.3 5.22 5.2 5.26 5.68 5.53 5 5.56 5.39 6.35 0 of 24HEXACHLOROETHANE 1.05 1.06 1.14 1.13 1.06 1.04 1.04 1.05 1.14 1.11 1 1.11 1.08 1.27 0 of 24INDENO(1,2,3-CD)PYRENE 1.05 1.06 1.14 1.13 1.06 1.04 1.04 1.05 1.14 1.11 1 1.11 1.08 1.27 0 of 24ISOPHORONE 1.05 1.06 1.14 1.13 1.06 1.04 1.04 1.05 1.14 1.11 1 1.11 1.08 1.27 0 of 24N-NITROSODI-N-PROPYLAMINE 1.05 1.06 1.14 1.13 1.06 1.04 1.04 1.05 1.14 1.11 1 1.11 1.08 1.27 0 of 24N-NITROSODIMETHYLAMINE 1.05 1.06 1.14 1.13 1.06 1.04 1.04 1.05 1.14 1.11 1 1.11 1.08 1.27 0 of 24N-NITROSODIPHENYLAMINE 1.05 1.06 1.14 1.13 1.06 1.04 1.04 1.05 1.14 1.11 1 1.11 1.08 1.27 0 of 24NAPHTHALENE 1.05 1.06 1.14 1.13 1.06 1.04 1.04 1.05 1.14 1.11 1 1.11 1.08 1.27 0 of 24NITROBENZENE 1.05 1.06 1.14 1.13 1.06 1.04 1.04 1.05 1.14 1.11 1 1.11 1.08 1.27 0 of 24PENTACHLOROPHENOL 3.14 3.19 3.42 3.39 3.18 3.13 3.12 3.16 3.41 3.32 3 3.34 3.23 3.81 0 of 24PHENANTHRENE 0.105 0.106 0.114 0.113 0.106 0.104 0.104 0.105 0.114 0.111 0.1 0.111 0.108 0.127 0 of 24PHENOL 2.1 2.13 2.28 2.26 2.12 2.09 2.08 2.1 2.27 2.21 2 2.23 2.15 2.54 0 of 24PYRENE 1.05 1.06 1.14 1.13 1.06 1.04 1.04 1.05 1.14 1.11 1 1.11 1.08 1.27 0 of 24
Table A-4. Deer Island Influent Characterization (North System), FY03 (cont.)
A-22

Volatile Organics (ug/L) TimesJul Aug Sep Oct Nov Dec Jan Feb Mar Apr May Jun Average Maximum Detected
1,1,1-TRICHLOROETHANE 0.5 0.5 0.5 0.5 0.5 0.5 0.5 0.5 0.5 0.5 0.5 0.5 0.5 0.5 0 of 241,1,2,2-TETRACHLOROETHANE 0.5 0.5 0.5 0.5 0.5 0.5 0.5 0.5 0.5 0.5 0.5 0.5 0.5 0.5 0 of 241,1,2-TRICHLOROETHANE 0.5 0.5 0.5 0.5 0.5 0.5 0.5 0.5 0.5 0.5 0.5 0.5 0.5 0.5 0 of 241,1-DICHLOROETHANE 0.5 0.5 0.5 0.5 0.5 0.5 0.5 0.5 0.5 0.5 0.5 0.5 0.5 0.5 0 of 241,1-DICHLOROETHENE 0.5 0.5 0.5 0.5 0.5 0.5 0.5 0.5 0.5 0.5 0.5 0.5 0.5 0.5 0 of 241,2-DICHLOROBENZENE 0.5 0.5 0.5 0.5 0.5 0.5 0.5 0.5 0.5 0.5 0.5 0.5 0.5 0.5 0 of 241,2-DICHLOROETHANE 0.5 0.5 0.5 0.5 0.5 0.5 0.5 0.5 0.5 0.5 0.5 0.5 0.5 0.5 0 of 241,2-DICHLOROPROPANE 0.5 0.5 0.5 0.5 0.5 0.5 0.5 0.5 0.5 0.5 0.5 0.5 0.5 0.5 0 of 241,3-DICHLOROBENZENE 0.5 0.5 0.5 0.5 0.5 0.5 0.5 0.5 0.5 0.5 0.5 0.5 0.5 0.5 0 of 241,4-DICHLOROBENZENE 0.5 0.5 0.5 0.5 0.5 0.5 0.5 0.5 0.5 0.5 0.5 0.5 0.5 0.5 0 of 242-BUTANONE 0.5 3.72 5.08 4.65 1.71 0.5 2.04 0.5 0.5 0.5 0.5 0.5 1.51 7.72 8 of 242-CHLOROETHYL VINYL ETHER 0.5 0.5 0.5 0.5 0.5 0.5 0.5 0.5 0.5 0.5 0.5 0.5 0.5 0.5 0 of 242-HEXANONE 0.5 0.5 0.5 0.5 0.5 0.5 0.5 0.5 0.5 0.5 0.5 0.5 0.5 0.5 0 of 244-METHYL-2-PENTANONE 0.5 0.5 0.5 0.5 0.5 0.5 0.5 0.5 0.5 0.5 0.5 0.5 0.5 0.5 0 of 24ACETONE 111 189 119 126 84.5 181 84.1 81.1 134 102 126 46.9 111 191 23 of 24ACROLEIN 0.5 0.5 0.5 0.5 0.5 0.5 0.5 1 1 1 1 1 0.743 1 0 of 24ACRYLONITRILE 0.5 0.5 0.5 0.5 0.5 0.5 0.5 1 1 1 1 1 0.743 1 0 of 24BENZENE 0.5 0.5 0.5 0.5 0.5 0.5 3.64 0.5 2.18 0.5 0.5 0.5 0.969 3.91 3 of 24BROMODICHLOROMETHANE 0.5 0.5 0.5 0.5 0.5 0.5 0.5 0.5 0.5 0.5 0.5 0.5 0.5 0.5 0 of 24BROMOFORM 0.5 0.5 0.5 0.5 0.5 0.5 0.5 0.5 0.5 0.5 0.5 0.5 0.5 0.5 0 of 24BROMOMETHANE 0.5 0.5 0.5 0.5 0.5 0.5 0.5 0.5 0.5 0.5 0.5 0.5 0.5 0.5 0 of 24CARBON DISULFIDE 0.5 8.12 0.5 0.5 5.16 0.5 1.5 0.5 1.97 0.5 0.5 0.5 1.6 9.64 5 of 24CARBON TETRACHLORIDE 0.5 0.5 0.5 0.5 0.5 0.5 0.5 0.5 0.5 0.5 0.5 0.5 0.5 0.5 0 of 24CHLOROBENZENE 0.5 0.5 0.5 0.5 0.5 0.5 0.5 0.5 0.5 0.5 0.5 0.5 0.5 0.5 0 of 24CHLOROETHANE 0.5 0.5 0.5 0.5 0.5 0.5 0.5 0.5 0.5 0.5 0.5 0.5 0.5 0.5 0 of 24CHLOROFORM 6.81 8.2 6.4 4.71 3.78 4 4.8 6.14 5.95 6.52 7.63 3.68 5.65 8.7 23 of 24CHLOROMETHANE 0.5 0.5 0.5 0.5 0.5 0.5 0.5 0.5 0.5 0.5 0.5 0.5 0.5 0.5 0 of 24CIS-1,2-DICHLOROETHENE 0.5 0.5 0.5 0.5 0.5 0.5 0.5 0.5 0.5 0.5 0.5 0.5 0.5 0.5 0 of 24CIS-1,3-DICHLOROPROPENE 0.5 0.5 0.5 0.5 0.5 0.5 0.5 0.5 0.5 0.5 0.5 0.5 0.5 0.5 0 of 24DIBROMOCHLOROMETHANE 0.5 0.5 0.5 0.5 0.5 0.5 0.5 0.5 0.5 0.5 0.5 0.5 0.5 0.5 0 of 24ETHYLBENZENE 0.5 0.5 0.5 0.5 0.5 0.5 0.5 0.5 0.5 0.5 0.5 0.5 0.5 0.5 0 of 24M,P-XYLENE 0.5 0.5 0.5 0.5 0.5 0.5 0.5 1 1 1 1 1 0.743 1 0 of 24METHYLENE CHLORIDE 0.5 2.93 1.83 0.5 0.5 0.5 0.5 0.5 0.5 0.5 1.54 0.5 0.807 3.21 4 of 24O-XYLENE 0.5 0.5 0.5 0.5 0.5 0.5 0.5 0.5 0.5 0.5 0.5 0.5 0.5 0.5 0 of 24STYRENE 0.5 0.5 0.5 0.5 0.5 0.5 0.5 0.5 0.5 0.5 0.5 0.5 0.5 0.5 0 of 24TETRACHLOROETHENE 0.5 0.5 2.3 1.6 0.5 0.5 0.5 3.12 3.17 1.24 1.84 0.5 1.35 4.17 8 of 24TOLUENE 6.7 5.49 4.72 6.16 4.46 3.65 6.26 4.21 0.5 2.69 3 0.5 3.79 11.9 19 of 24TRANS-1,2-DICHLOROETHENE 0.5 0.5 0.5 0.5 0.5 0.5 0.5 0.5 0.5 0.5 0.5 0.5 0.5 0.5 0 of 24TRANS-1,3-DICHLOROPROPENE 0.5 0.5 0.5 0.5 0.5 0.5 0.5 0.5 0.5 0.5 0.5 0.5 0.5 0.5 0 of 24TRICHLOROETHENE 0.5 0.5 0.5 0.5 0.5 0.5 0.5 0.5 0.5 0.5 0.5 0.5 0.5 0.5 0 of 24TRICHLOROFLUOROMETHANE 0.5 0.5 0.5 0.5 0.5 0.5 0.5 0.5 0.5 0.5 0.5 0.5 0.5 0.5 0 of 24VINYL ACETATE 0.5 0.5 0.5 0.5 0.5 0.5 0.5 0.5 0.5 0.5 0.5 0.5 0.5 0.5 0 of 24VINYL CHLORIDE 0.5 0.5 0.5 0.5 0.5 0.5 0.5 0.5 0.5 0.5 0.5 0.5 0.5 0.5 0 of 24
Notes~: No data or no samples takenResults in bold indicate one or more detects that monthYearly averages are calculated from individual results collected during the fiscal year.Non-detected compounds are assumed to equal one half of the detection limit for metals and inorganics and one tenth of the reporting limit for organic compounds.
Table A-4. Deer Island Influent Characterization (North System), FY03 (cont.)
A-23

Metals (lbs/day) TimesJul Aug Sep Oct Nov Dec Jan Feb Mar Apr May Jun Average Maximum Detected
ANTIMONY 17.3 13.2 ~ 11.4 18.7 18.3 25.4 17.6 16.5 19.3 14.7 24.4 17.9 25.7 0 of 22ARSENIC 3.14 1.31 ~ 0.61 0.748 1.89 1.01 1.4 1.74 1.03 3.16 0.976 1.55 3.39 9 of 23BERYLLIUM 0.482 0.379 ~ 0.381 0.468 0.459 0.634 0.507 0.549 0.644 0.489 0.61 0.509 0.664 0 of 22BORON 394 293 ~ 527 701 351 317 376 274 322 245 305 373 803 8 of 22CADMIUM 0.948 0.62 ~ 0.68 0.427 0.844 0.99 0.83 0.899 1.25 0.861 0.839 0.835 1.44 22 of 22CHROMIUM 9.69 7.42 ~ 6.87 4.18 8.36 8.36 9.34 7.5 8.63 6.05 7 7.58 15.4 22 of 22COPPER 172 151 ~ 139 108 119 123 139 102 120 108 83.7 124 236 22 of 22HEXAVALENT CHROMIUM 4.14 3.81 3.92 4.19 5.64 4.67 6.34 4.96 5.89 9.36 4.85 5.87 5.3 12 0 of 24IRON 5510 3950 ~ 2550 2820 3960 4170 4670 3520 4630 3880 3150 3890 7440 22 of 22LEAD 51.9 14.4 ~ 20.7 18.6 13.2 19.7 37.8 12.4 17.2 14.5 14.8 21.4 84.9 22 of 22MERCURY 0.334 0.365 ~ 0.367 0.263 0.266 0.285 0.484 0.337 0.566 0.41 0.267 0.359 0.863 22 of 22MOLYBDENUM 20.5 20.8 ~ 21.1 22.4 7.58 15.8 32.3 19.8 23.8 13.3 24.4 20.1 35.9 22 of 22NICKEL 10.7 8.7 ~ 6.39 8.65 11.3 10.8 9.45 8.24 10.2 7.78 10.2 9.3 16.6 22 of 22SELENIUM 0.868 0.681 ~ 0.686 0.842 0.826 1.14 0.913 0.987 1.16 0.88 1.1 0.917 1.19 0 of 22SILVER 3.58 3.09 ~ 5.14 4.27 4.09 4.12 4.3 4.31 4.19 4.56 3.56 4.11 8.07 23 of 23THALLIUM 0.965 0.757 ~ 0.763 0.935 0.917 1.27 1.01 1.1 1.29 0.978 1.22 1.02 1.33 0 of 22ZINC 321 232 ~ 210 164 212 266 262 225 260 211 187 232 469 22 of 22
Cyanide and Phenols (lbs/day) TimesJul Aug Sep Oct Nov Dec Jan Feb Mar Apr May Jun Average Maximum Detected
CYANIDE 8.29 7.61 7.84 8.37 11.3 9.34 12.7 9.92 11.8 18.7 9.69 11.7 10.6 24 0 of 24PHENOL 54.7 136 33.5 28.9 37.9 32.6 ~ ~ ~ ~ ~ ~ 56.3 157 10 of 11
Oil and Grease, Surfactants, and Petroleum Hydrocarbons (lbs/day) TimesJul Aug Sep Oct Nov Dec Jan Feb Mar Apr May Jun Average Maximum Detected
FATS OIL AND GREASE 54000 94600 82400 62800 96700 66300 53400 93300 70300 110000 76500 63500 77600 154000 23 of 23MBAS 9710 8160 7050 7900 7430 6450 6150 5500 6140 5830 7090 7160 7050 10500 24 of 24PETROLEUM HYDROCARBON 763 557 991 660 1260 700 2250 810 952 951 941 1720 1050 3590 24 of 24
Table A-5. Deer Island Influent Loadings (North System), FY03
A-24

Organochlorine Pesticides and PCBs (lbs/day) TimesJul Aug Sep Oct Nov Dec Jan Feb Mar Apr May Jun Average Maximum Detected
2,4'-DDD 0.000245 0.00016 0.000184 0.00024 ~ 0.000563 ~ 0.00023 ~ 0.0003 ~ 0.000324 0.000283 0.00093 0 of 172,4'-DDE 0.000245 0.00016 0.000184 0.00024 ~ 0.000563 ~ 0.00023 ~ 0.0003 ~ 0.000324 0.000283 0.00093 0 of 172,4'-DDT 0.000245 0.00016 0.000184 0.00024 ~ 0.000563 ~ 0.00023 ~ 0.0003 ~ 0.000324 0.000283 0.00093 0 of 174,4'-DDD 0.00418 0.00286 0.00223 0.00255 0.00397 0.00519 0.00555 0.00398 0.00466 0.00389 0.00423 0.00524 0.00404 0.00597 15 of 414,4'-DDE 0.00596 0.00549 0.00399 0.00414 0.00397 0.00371 0.00555 0.00502 0.00466 0.0119 0.00423 0.00799 0.00555 0.0181 18 of 414,4'-DDT 0.00477 0.00309 0.00241 0.00404 0.00397 0.00229 0.00555 0.0061 0.00466 0.00472 0.00423 0.00219 0.004 0.00637 13 of 41ALDRIN 0.00337 0.00188 0.00194 0.0018 0.00397 0.00229 0.00555 0.00272 0.00466 0.00296 0.00423 0.00194 0.00311 0.00597 0 of 41ALPHA-BHC 0.00458 0.00361 0.00369 0.00336 0.00397 0.00401 0.00555 0.0052 0.00466 0.00561 0.00423 0.00519 0.00447 0.00603 0 of 24ALPHA-CHLORDANE 0.00542 0.00704 0.00313 0.00397 0.00397 0.00536 0.00555 0.00482 0.00466 0.00756 0.00423 0.00865 0.00536 0.00924 16 of 41AROCLOR-1016 0.115 0.0902 0.0922 0.0841 0.0994 0.1 0.139 0.13 0.117 0.14 0.106 0.13 0.112 0.151 0 of 24AROCLOR-1221 0.229 0.18 0.184 0.168 0.199 0.201 0.278 0.26 0.234 0.281 0.211 0.26 0.224 0.303 0 of 24AROCLOR-1232 0.115 0.0902 0.0922 0.0841 0.0994 0.1 0.139 0.13 0.117 0.14 0.106 0.13 0.112 0.151 0 of 24AROCLOR-1242 0.115 0.0902 0.0922 0.0841 0.0994 0.1 0.139 0.13 0.117 0.14 0.106 0.13 0.112 0.151 0 of 24AROCLOR-1248 0.115 0.0902 0.0922 0.0841 0.0994 0.1 0.139 0.13 0.117 0.14 0.106 0.13 0.112 0.151 0 of 24AROCLOR-1254 0.115 0.0902 0.0922 0.0841 0.0994 0.1 0.139 0.13 0.117 0.14 0.106 0.13 0.112 0.151 0 of 24AROCLOR-1260 0.115 0.0902 0.0922 0.0841 0.0994 0.1 0.139 0.13 0.117 0.14 0.106 0.13 0.112 0.151 0 of 24BETA-BHC 0.00458 0.00361 0.00369 0.00336 0.00397 0.00401 0.00555 0.0052 0.00466 0.00561 0.00423 0.00519 0.00447 0.00603 0 of 24CHLORDANE (TECHNICAL) 0.115 0.0902 0.0922 0.0841 0.0994 0.1 0.139 0.13 0.117 0.14 0.106 0.13 0.112 0.151 0 of 24DDMU 0.000245 0.00016 0.000184 0.00024 ~ 0.000563 ~ 0.00023 ~ 0.0003 ~ 0.000324 0.000283 0.00093 0 of 17DELTA-BHC 0.00458 0.00361 0.00369 0.00336 0.00397 0.00401 0.00555 0.0052 0.00466 0.00561 0.00423 0.00519 0.00447 0.00603 0 of 24DIELDRIN 0.00337 0.00188 0.00194 0.0018 0.00397 0.00229 0.00555 0.00272 0.00466 0.00539 0.00423 0.00286 0.00339 0.00597 6 of 41ENDOSULFAN I 0.00458 0.00361 0.00369 0.00336 0.00397 0.00401 0.00555 0.0052 0.00466 0.00561 0.00423 0.00519 0.00447 0.00603 0 of 24ENDOSULFAN II 0.00458 0.00361 0.00369 0.00336 0.00397 0.00401 0.00555 0.0052 0.00466 0.00561 0.00423 0.00519 0.00447 0.00603 0 of 24ENDOSULFAN SULFATE 0.00458 0.00361 0.00369 0.00336 0.00397 0.00401 0.00555 0.0052 0.00466 0.00561 0.00423 0.00519 0.00447 0.00603 0 of 24ENDRIN 0.00337 0.00188 0.00194 0.0018 0.00397 0.00229 0.00555 0.00272 0.00466 0.00296 0.00423 0.00194 0.00311 0.00597 0 of 41ENDRIN ALDEHYDE 0.00458 0.00361 0.00369 0.00336 0.00397 0.00401 0.00555 0.0052 0.00466 0.00561 0.00423 0.00519 0.00447 0.00603 0 of 24ENDRIN KETONE 0.00458 0.00361 0.00369 0.00336 0.00397 0.00401 0.00555 0.0052 0.00466 0.00561 0.00423 0.00519 0.00447 0.00603 0 of 24GAMMA-BHC (LINDANE) 0.00425 0.00505 0.0041 0.00305 0.00397 0.00229 0.00555 0.00272 0.00466 0.00428 0.00423 0.00194 0.00384 0.00597 9 of 41GAMMA-CHLORDANE 0.0058 0.00692 0.00354 0.00407 0.00397 0.00473 0.00555 0.0055 0.00466 0.00717 0.00423 0.00815 0.00536 0.00864 16 of 41HEPTACHLOR 0.00337 0.00188 0.00194 0.0018 0.00397 0.00229 0.00555 0.00272 0.00466 0.00296 0.00423 0.00194 0.00311 0.00597 0 of 41HEPTACHLOR EPOXIDE 0.00337 0.00188 0.00194 0.0018 0.00397 0.00229 0.00555 0.00272 0.00466 0.00296 0.00423 0.00194 0.00311 0.00597 0 of 41HEXACHLOROBENZENE 0.000245 0.00016 0.000184 0.00024 ~ 0.000563 ~ 0.00023 ~ 0.0003 ~ 0.000324 0.000283 0.00093 0 of 17METHOXYCHLOR 0.0458 0.0361 0.0369 0.0336 0.0397 0.0401 0.0555 0.052 0.0466 0.0561 0.0423 0.0519 0.0447 0.0603 0 of 24MIREX 0.000245 0.00016 0.000184 0.00024 ~ 0.000563 ~ 0.00023 ~ 0.0003 ~ 0.000324 0.000283 0.00093 0 of 17TOTAL CHLORDANE 0.024 0.0255 0.006 0.0123 ~ 0.0153 ~ 0.0125 ~ 0.0232 ~ 0.0163 0.0164 0.0311 15 of 17TOTAL DDT 0.0199 0.0121 0.00964 0.0111 ~ 0.00967 ~ 0.0146 ~ 0.0112 ~ 0.0103 0.0118 0.0199 17 of 17TOXAPHENE 0.115 0.0902 0.0922 0.0841 0.0994 0.1 0.139 0.13 0.117 0.14 0.106 0.13 0.112 0.151 0 of 24TRANS-NONACHLOR 0.00563 0.00484 0.00368 0.00292 ~ 0.00341 ~ 0.00227 ~ 0.00493 ~ 0.00467 0.00394 0.00662 16 of 17
Table A-5. Deer Island Influent Loadings (North System), FY03 (cont.)
A-25

Semivolatile Organics (lbs/day) TimesJul Aug Sep Oct Nov Dec Jan Feb Mar Apr May Jun Average Maximum Detected
1,2,4-TRICHLOROBENZENE 2.02 1.61 1.76 1.72 1.98 1.92 2.64 2.13 2.49 2.85 1.96 2.71 2.15 3.05 0 of 241,2-DICHLOROBENZENE 2.02 1.61 1.76 1.72 1.98 1.92 2.64 2.13 2.49 2.85 1.96 2.71 2.15 3.05 0 of 241,2-DIPHENYLHYDRAZINE (AS AZOBENZENE) 2.02 1.61 1.76 1.72 1.98 1.92 2.64 2.13 2.49 2.85 1.96 2.71 2.15 3.05 0 of 241,3-DICHLOROBENZENE 2.02 1.61 1.76 1.72 1.98 1.92 2.64 2.13 2.49 2.85 1.96 2.71 2.15 3.05 0 of 241,4-DICHLOROBENZENE 2.02 1.61 1.76 1.72 1.98 1.92 2.64 2.13 2.49 2.85 1.96 2.71 2.15 3.05 0 of 242,2'-OXYBIS(1-CHLOROPROPANE) 2.02 1.61 1.76 1.72 1.98 1.92 2.64 2.13 2.49 2.85 1.96 2.71 2.15 3.05 0 of 242,4,5-TRICHLOROPHENOL 2.02 1.61 1.76 1.72 1.98 1.92 2.64 2.13 2.49 2.85 1.96 2.71 2.15 3.05 0 of 242,4,6-TRICHLOROPHENOL 2.02 1.61 1.76 1.72 1.98 1.92 2.64 2.13 2.49 2.85 1.96 2.71 2.15 3.05 0 of 242,4-DICHLOROPHENOL 2.02 1.61 1.76 1.72 1.98 1.92 2.64 2.13 2.49 2.85 1.96 2.71 2.15 3.05 0 of 242,4-DIMETHYLPHENOL 2.02 1.61 1.76 1.72 1.98 1.92 2.64 2.13 2.49 2.85 1.96 2.71 2.15 3.05 0 of 242,4-DINITROPHENOL 4.04 3.22 3.52 3.44 3.97 3.83 5.28 4.27 4.98 5.7 3.91 5.43 4.3 6.11 0 of 242,4-DINITROTOLUENE 2.02 1.61 1.76 1.72 1.98 1.92 2.64 2.13 2.49 2.85 1.96 2.71 2.15 3.05 0 of 242,6-DINITROTOLUENE 2.02 1.61 1.76 1.72 1.98 1.92 2.64 2.13 2.49 2.85 1.96 2.71 2.15 3.05 0 of 242-CHLORONAPHTHALENE 2.02 1.61 1.76 1.72 1.98 1.92 2.64 2.13 2.49 2.85 1.96 2.71 2.15 3.05 0 of 242-CHLOROPHENOL 2.02 1.61 1.76 1.72 1.98 1.92 2.64 2.13 2.49 2.85 1.96 2.71 2.15 3.05 0 of 242-METHYL-4,6-DINITROPHENOL 20.2 16.1 17.6 17.2 19.8 19.2 26.4 21.3 24.9 28.5 19.6 27.1 21.5 30.5 0 of 242-METHYLNAPHTHALENE 2.02 1.61 1.76 1.72 1.98 1.92 2.64 2.13 2.49 2.85 1.96 2.71 2.15 3.05 0 of 242-METHYLPHENOL 2.02 1.61 1.76 1.72 1.98 1.92 2.64 2.13 2.49 2.85 1.96 2.71 2.15 3.05 0 of 242-NITROANILINE 2.02 1.61 1.76 1.72 1.98 1.92 2.64 2.13 2.49 2.85 1.96 2.71 2.15 3.05 0 of 242-NITROPHENOL 2.02 1.61 1.76 1.72 1.98 1.92 2.64 2.13 2.49 2.85 1.96 2.71 2.15 3.05 0 of 243,3'-DICHLOROBENZIDINE 4.04 3.22 3.52 3.44 3.97 3.83 5.28 4.27 4.98 5.7 3.91 5.43 4.3 6.11 0 of 243-NITROANILINE 2.02 1.61 1.76 1.72 1.98 1.92 2.64 2.13 2.49 2.85 1.96 2.71 2.15 3.05 0 of 244-BROMOPHENYL PHENYL ETHER 2.02 1.61 1.76 1.72 1.98 1.92 2.64 2.13 2.49 2.85 1.96 2.71 2.15 3.05 0 of 244-CHLORO-3-METHYLPHENOL 2.02 1.61 1.76 1.72 1.98 1.92 2.64 2.13 2.49 2.85 1.96 2.71 2.15 3.05 0 of 244-CHLOROANILINE 2.02 1.61 1.76 1.72 1.98 1.92 2.64 2.13 2.49 2.85 1.96 2.71 2.15 3.05 0 of 244-CHLOROPHENYL PHENYL ETHER 2.02 1.61 1.76 1.72 1.98 1.92 2.64 2.13 2.49 2.85 1.96 2.71 2.15 3.05 0 of 244-METHYLPHENOL (INCLUDES 3-METHYLPHENOL) 9.21 14.5 22.4 30.6 1.98 8.68 2.64 15.3 8.61 11.9 22.8 13.2 13.5 34.5 14 of 244-NITROANILINE 2.02 1.61 1.76 1.72 1.98 1.92 2.64 2.13 2.49 2.85 1.96 2.71 2.15 3.05 0 of 244-NITROPHENOL 4.04 3.22 3.52 3.44 3.97 3.83 5.28 4.27 4.98 5.7 3.91 5.43 4.3 6.11 0 of 24ACENAPHTHENE 2.02 1.61 1.76 1.72 1.98 1.92 2.64 2.13 2.49 2.85 1.96 2.71 2.15 3.05 0 of 24ACENAPHTHYLENE 2.02 1.61 1.76 1.72 1.98 1.92 2.64 2.13 2.49 2.85 1.96 2.71 2.15 3.05 0 of 24ANILINE 2.02 1.61 1.76 1.72 1.98 1.92 2.64 2.13 2.49 2.85 1.96 2.71 2.15 3.05 0 of 24ANTHRACENE 2.02 1.61 1.76 1.72 1.98 1.92 2.64 2.13 2.49 2.85 1.96 2.71 2.15 3.05 0 of 24BENZIDINE 10.1 8.06 8.8 8.61 9.91 9.58 13.2 10.7 12.5 14.2 9.78 13.6 10.8 15.3 0 of 24
Table A-5. Deer Island Influent Loadings (North System), FY03 (cont.)
A-26

Semivolatile Organics (lbs/day) TimesJul Aug Sep Oct Nov Dec Jan Feb Mar Apr May Jun Average Maximum Detected
BENZO(A)ANTHRACENE 2.02 1.61 1.76 1.72 1.98 1.92 2.64 2.13 2.49 2.85 1.96 2.71 2.15 3.05 0 of 24BENZO(A)PYRENE 2.02 1.61 1.76 1.72 1.98 1.92 2.64 2.13 2.49 2.85 1.96 2.71 2.15 3.05 0 of 24BENZO(B)FLUORANTHENE 2.02 1.61 1.76 1.72 1.98 1.92 2.64 2.13 2.49 2.85 1.96 2.71 2.15 3.05 0 of 24BENZO(GHI)PERYLENE 2.02 1.61 1.76 1.72 1.98 1.92 2.64 2.13 2.49 2.85 1.96 2.71 2.15 3.05 0 of 24BENZO(K)FLUORANTHENE 2.02 1.61 1.76 1.72 1.98 1.92 2.64 2.13 2.49 2.85 1.96 2.71 2.15 3.05 0 of 24BENZOIC ACID 4.04 3.22 3.52 34 3.97 3.83 5.28 4.27 20.4 18.3 3.91 5.43 9.19 45.1 4 of 24BENZYL ALCOHOL 7.37 1.61 11.2 29.2 1.98 1.92 2.64 7.78 24.9 11.4 9.76 24.4 11.2 39.5 12 of 24BIS(2-CHLOROETHOXY)METHANE 2.02 1.61 1.76 1.72 1.98 1.92 2.64 2.13 2.49 2.85 1.96 2.71 2.15 3.05 0 of 24BIS(2-CHLOROETHYL)ETHER 2.02 1.61 1.76 1.72 1.98 1.92 2.64 2.13 2.49 2.85 1.96 2.71 2.15 3.05 0 of 24BIS(2-ETHYLHEXYL)PHTHALATE 29.3 27.4 35.9 46.3 31.3 31.5 26.1 41.3 27.9 37.5 19.5 24.7 31.5 56.4 24 of 24BUTYL BENZYL PHTHALATE 2.02 1.61 1.76 1.72 1.98 1.92 2.64 2.13 2.49 2.85 1.96 2.71 2.15 3.05 0 of 24CHRYSENE 2.02 1.61 1.76 1.72 1.98 1.92 2.64 2.13 2.49 2.85 1.96 2.71 2.15 3.05 0 of 24DI-N-BUTYLPHTHALATE 2.02 1.61 1.76 8.42 1.98 1.92 2.64 2.13 2.49 2.85 1.96 2.71 2.71 15 1 of 24DI-N-OCTYLPHTHALATE 2.02 1.61 1.76 1.72 1.98 1.92 2.64 2.13 2.49 2.85 1.96 2.71 2.15 3.05 0 of 24DIBENZO(A,H)ANTHRACENE 2.02 1.61 1.76 1.72 1.98 1.92 2.64 2.13 2.49 2.85 1.96 2.71 2.15 3.05 0 of 24DIBENZOFURAN 2.02 1.61 1.76 1.72 1.98 1.92 2.64 2.13 2.49 2.85 1.96 2.71 2.15 3.05 0 of 24DIETHYL PHTHALATE 2.02 1.61 1.76 10 1.98 1.92 2.64 2.13 2.49 2.85 1.96 2.71 2.84 10.1 2 of 24DIMETHYL PHTHALATE 2.02 1.61 1.76 1.72 1.98 1.92 2.64 2.13 2.49 2.85 1.96 2.71 2.15 3.05 0 of 24FLUORANTHENE 2.02 1.61 1.76 1.72 1.98 1.92 2.64 2.13 2.49 2.85 1.96 2.71 2.15 3.05 0 of 24FLUORENE 2.02 1.61 1.76 1.72 1.98 1.92 2.64 2.13 2.49 2.85 1.96 2.71 2.15 3.05 0 of 24HEXACHLOROBENZENE 2.02 1.61 1.76 1.72 1.98 1.92 2.64 2.13 2.49 2.85 1.96 2.71 2.15 3.05 0 of 24HEXACHLOROBUTADIENE 2.02 1.61 1.76 1.72 1.98 1.92 2.64 2.13 2.49 2.85 1.96 2.71 2.15 3.05 0 of 24HEXACHLOROCYCLOPENTADIENE 10.1 8.06 8.8 8.61 9.91 9.58 13.2 10.7 12.5 14.2 9.78 13.6 10.8 15.3 0 of 24HEXACHLOROETHANE 2.02 1.61 1.76 1.72 1.98 1.92 2.64 2.13 2.49 2.85 1.96 2.71 2.15 3.05 0 of 24INDENO(1,2,3-CD)PYRENE 2.02 1.61 1.76 1.72 1.98 1.92 2.64 2.13 2.49 2.85 1.96 2.71 2.15 3.05 0 of 24ISOPHORONE 2.02 1.61 1.76 1.72 1.98 1.92 2.64 2.13 2.49 2.85 1.96 2.71 2.15 3.05 0 of 24N-NITROSODI-N-PROPYLAMINE 2.02 1.61 1.76 1.72 1.98 1.92 2.64 2.13 2.49 2.85 1.96 2.71 2.15 3.05 0 of 24N-NITROSODIMETHYLAMINE 2.02 1.61 1.76 1.72 1.98 1.92 2.64 2.13 2.49 2.85 1.96 2.71 2.15 3.05 0 of 24N-NITROSODIPHENYLAMINE 2.02 1.61 1.76 1.72 1.98 1.92 2.64 2.13 2.49 2.85 1.96 2.71 2.15 3.05 0 of 24NAPHTHALENE 2.02 1.61 1.76 1.72 1.98 1.92 2.64 2.13 2.49 2.85 1.96 2.71 2.15 3.05 0 of 24NITROBENZENE 2.02 1.61 1.76 1.72 1.98 1.92 2.64 2.13 2.49 2.85 1.96 2.71 2.15 3.05 0 of 24PENTACHLOROPHENOL 6.07 4.84 5.28 5.17 5.95 5.75 7.92 6.4 7.48 8.55 5.87 8.14 6.45 9.16 0 of 24PHENANTHRENE 0.202 0.161 0.176 0.172 0.198 0.192 0.264 0.213 0.249 0.285 0.196 0.271 0.215 0.305 0 of 24PHENOL 4.04 3.22 3.52 3.44 3.97 3.83 5.28 4.27 4.98 5.7 3.91 5.43 4.3 6.11 0 of 24PYRENE 2.02 1.61 1.76 1.72 1.98 1.92 2.64 2.13 2.49 2.85 1.96 2.71 2.15 3.05 0 of 24
Table A-5. Deer Island Influent Loadings (North System), FY03 (cont.)
A-27

Volatile Organics (lbs/day) TimesJul Aug Sep Oct Nov Dec Jan Feb Mar Apr May Jun Average Maximum Detected
1,1,1-TRICHLOROETHANE 0.829 0.761 0.784 0.837 1.13 0.934 1.27 0.992 1.18 1.87 0.969 1.17 1.06 2.4 0 of 241,1,2,2-TETRACHLOROETHANE 0.829 0.761 0.784 0.837 1.13 0.934 1.27 0.992 1.18 1.87 0.969 1.17 1.06 2.4 0 of 241,1,2-TRICHLOROETHANE 0.829 0.761 0.784 0.837 1.13 0.934 1.27 0.992 1.18 1.87 0.969 1.17 1.06 2.4 0 of 241,1-DICHLOROETHANE 0.829 0.761 0.784 0.837 1.13 0.934 1.27 0.992 1.18 1.87 0.969 1.17 1.06 2.4 0 of 241,1-DICHLOROETHENE 0.829 0.761 0.784 0.837 1.13 0.934 1.27 0.992 1.18 1.87 0.969 1.17 1.06 2.4 0 of 241,2-DICHLOROBENZENE 0.829 0.761 0.784 0.837 1.13 0.934 1.27 0.992 1.18 1.87 0.969 1.17 1.06 2.4 0 of 241,2-DICHLOROETHANE 0.829 0.761 0.784 0.837 1.13 0.934 1.27 0.992 1.18 1.87 0.969 1.17 1.06 2.4 0 of 241,2-DICHLOROPROPANE 0.829 0.761 0.784 0.837 1.13 0.934 1.27 0.992 1.18 1.87 0.969 1.17 1.06 2.4 0 of 241,3-DICHLOROBENZENE 0.829 0.761 0.784 0.837 1.13 0.934 1.27 0.992 1.18 1.87 0.969 1.17 1.06 2.4 0 of 241,4-DICHLOROBENZENE 0.829 0.761 0.784 0.837 1.13 0.934 1.27 0.992 1.18 1.87 0.969 1.17 1.06 2.4 0 of 242-BUTANONE 0.829 5.66 7.96 7.78 3.85 0.934 5.17 0.992 1.18 1.87 0.969 1.17 3.2 11.9 8 of 242-CHLOROETHYL VINYL ETHER 0.829 0.761 0.784 0.837 1.13 0.934 1.27 0.992 1.18 1.87 0.969 1.17 1.06 2.4 0 of 242-HEXANONE 0.829 0.761 0.784 0.837 1.13 0.934 1.27 0.992 1.18 1.87 0.969 1.17 1.06 2.4 0 of 244-METHYL-2-PENTANONE 0.829 0.761 0.784 0.837 1.13 0.934 1.27 0.992 1.18 1.87 0.969 1.17 1.06 2.4 0 of 24ACETONE 185 287 186 211 191 338 213 161 316 381 245 110 235 437 23 of 24ACROLEIN 0.829 0.761 0.784 0.837 1.13 0.934 1.27 1.98 2.36 3.74 1.94 2.35 1.58 4.8 0 of 24ACRYLONITRILE 0.829 0.761 0.784 0.837 1.13 0.934 1.27 1.98 2.36 3.74 1.94 2.35 1.58 4.8 0 of 24BENZENE 0.829 0.761 0.784 0.837 1.13 0.934 9.24 0.992 5.15 1.87 0.969 1.17 2.06 10 3 of 24BROMODICHLOROMETHANE 0.829 0.761 0.784 0.837 1.13 0.934 1.27 0.992 1.18 1.87 0.969 1.17 1.06 2.4 0 of 24BROMOFORM 0.829 0.761 0.784 0.837 1.13 0.934 1.27 0.992 1.18 1.87 0.969 1.17 1.06 2.4 0 of 24BROMOMETHANE 0.829 0.761 0.784 0.837 1.13 0.934 1.27 0.992 1.18 1.87 0.969 1.17 1.06 2.4 0 of 24CARBON DISULFIDE 0.829 12.4 0.784 0.837 11.6 0.934 3.8 0.992 4.64 1.87 0.969 1.17 3.4 22.4 5 of 24CARBON TETRACHLORIDE 0.829 0.761 0.784 0.837 1.13 0.934 1.27 0.992 1.18 1.87 0.969 1.17 1.06 2.4 0 of 24CHLOROBENZENE 0.829 0.761 0.784 0.837 1.13 0.934 1.27 0.992 1.18 1.87 0.969 1.17 1.06 2.4 0 of 24CHLOROETHANE 0.829 0.761 0.784 0.837 1.13 0.934 1.27 0.992 1.18 1.87 0.969 1.17 1.06 2.4 0 of 24CHLOROFORM 11.3 12.5 10 7.88 8.53 7.47 12.2 12.2 14 24.4 14.8 8.65 12 34.1 23 of 24CHLOROMETHANE 0.829 0.761 0.784 0.837 1.13 0.934 1.27 0.992 1.18 1.87 0.969 1.17 1.06 2.4 0 of 24CIS-1,2-DICHLOROETHENE 0.829 0.761 0.784 0.837 1.13 0.934 1.27 0.992 1.18 1.87 0.969 1.17 1.06 2.4 0 of 24CIS-1,3-DICHLOROPROPENE 0.829 0.761 0.784 0.837 1.13 0.934 1.27 0.992 1.18 1.87 0.969 1.17 1.06 2.4 0 of 24DIBROMOCHLOROMETHANE 0.829 0.761 0.784 0.837 1.13 0.934 1.27 0.992 1.18 1.87 0.969 1.17 1.06 2.4 0 of 24ETHYLBENZENE 0.829 0.761 0.784 0.837 1.13 0.934 1.27 0.992 1.18 1.87 0.969 1.17 1.06 2.4 0 of 24M,P-XYLENE 0.829 0.761 0.784 0.837 1.13 0.934 1.27 1.98 2.36 3.74 1.94 2.35 1.58 4.8 0 of 24METHYLENE CHLORIDE 0.829 4.45 2.87 0.837 1.13 0.934 1.27 0.992 1.18 1.87 2.99 1.17 1.71 5.02 4 of 24O-XYLENE 0.829 0.761 0.784 0.837 1.13 0.934 1.27 0.992 1.18 1.87 0.969 1.17 1.06 2.4 0 of 24STYRENE 0.829 0.761 0.784 0.837 1.13 0.934 1.27 0.992 1.18 1.87 0.969 1.17 1.06 2.4 0 of 24TETRACHLOROETHENE 0.829 0.761 3.61 2.69 1.13 0.934 1.27 6.2 7.46 4.62 3.57 1.17 2.85 7.79 8 of 24TOLUENE 11.1 8.36 7.4 10.3 10.1 6.82 15.9 8.35 1.18 10.1 5.82 1.17 8.04 30.5 19 of 24TRANS-1,2-DICHLOROETHENE 0.829 0.761 0.784 0.837 1.13 0.934 1.27 0.992 1.18 1.87 0.969 1.17 1.06 2.4 0 of 24TRANS-1,3-DICHLOROPROPENE 0.829 0.761 0.784 0.837 1.13 0.934 1.27 0.992 1.18 1.87 0.969 1.17 1.06 2.4 0 of 24TRICHLOROETHENE 0.829 0.761 0.784 0.837 1.13 0.934 1.27 0.992 1.18 1.87 0.969 1.17 1.06 2.4 0 of 24TRICHLOROFLUOROMETHANE 0.829 0.761 0.784 0.837 1.13 0.934 1.27 0.992 1.18 1.87 0.969 1.17 1.06 2.4 0 of 24VINYL ACETATE 0.829 0.761 0.784 0.837 1.13 0.934 1.27 0.992 1.18 1.87 0.969 1.17 1.06 2.4 0 of 24VINYL CHLORIDE 0.829 0.761 0.784 0.837 1.13 0.934 1.27 0.992 1.18 1.87 0.969 1.17 1.06 2.4 0 of 24
Notes~: No data or no samples takenResults in bold indicate one or more detects that monthYearly averages are calculated from individual results collected during the fiscal year.Non-detected compounds are assumed to equal one half of the detection limit for metals and inorganics and one tenth of the reporting limit for organic compounds.
Table A-5. Deer Island Influent Loadings (North System), FY03 (cont.)
A-28

Metals (ug/L) TimesJul Aug Sep Oct Nov Dec Jan Feb Mar Apr May Jun Average Maximum Detected
ANTIMONY 8.87 8.74 7.5 7.5 10 10 8.73 8.71 7.5 8.74 7.5 10 8.74 10 0 of 23ARSENIC 0.4 0.4 0.4 0.4 0.4 0.686 0.4 0.4 0.4 0.4 1.3 0.4 0.504 1.59 3 of 23BERYLLIUM 0.25 0.25 0.25 0.25 0.25 0.25 0.25 0.25 0.25 0.25 0.25 0.25 0.25 0.25 0 of 23BORON 203 275 387 461 351 315 125 275 125 125 125 125 204 470 12 of 23CADMIUM 0.363 0.256 0.207 0.235 0.178 0.249 0.3 0.995 0.308 0.565 1.04 0.391 0.453 1.46 23 of 23CHROMIUM 2.88 4.91 2.86 2.41 2.15 3 2.26 5.34 2.91 2.8 7.88 2.92 3.49 10.4 23 of 23COPPER 62.7 72.8 75.2 70.6 57.9 46.1 31.1 108 40.8 49.8 137 44 62.1 151 23 of 23HEXAVALENT CHROMIUM 2.5 2.5 2.5 2.5 2.5 2.5 2.5 2.5 2.5 2.5 2.5 2.5 2.5 2.5 0 of 24IRON 1530 1440 1660 1510 1400 1580 1100 2980 1500 1910 4130 1540 1860 4740 23 of 23LEAD 4.62 3.53 6.8 6.08 4.52 4.66 2.59 10.7 2.5 6.81 14.6 5.22 5.96 18.5 20 of 23MERCURY 0.111 0.105 0.185 0.168 0.121 0.233 0.152 0.259 0.125 0.21 0.5 0.146 0.197 0.598 23 of 23MOLYBDENUM 6.86 6.88 3.88 3.44 3.39 2.73 0.5 4.42 2.35 4.69 8.74 3.96 4.08 12.5 21 of 23NICKEL 4.1 3.53 2.71 2.66 2.49 3.93 2.18 4.6 3.47 4.14 13.3 4.58 4.46 20.4 23 of 23SELENIUM 0.45 0.45 0.45 0.45 0.45 0.45 0.45 0.45 0.45 0.45 0.45 0.45 0.45 0.45 0 of 23SILVER 0.986 1.83 1.33 2.11 1.94 1.33 1.11 2.14 1.24 1.59 4.48 1.99 1.84 5.19 23 of 23THALLIUM 0.5 0.5 0.5 0.5 0.5 0.5 0.5 0.5 0.5 0.5 0.5 0.5 0.5 0.5 0 of 23ZINC 93.4 90.7 101 103 79 83.4 64.1 182 75.9 105 241 84 107 272 23 of 23
Cyanide and Phenols (ug/L) TimesJul Aug Sep Oct Nov Dec Jan Feb Mar Apr May Jun Average Maximum Detected
CYANIDE 5 5 5 5 5 5 5 5 5 5 5 5 5 5 0 of 24PHENOL 37.7 55.4 74.5 ~ 35.9 28.3 ~ ~ ~ ~ ~ ~ 45.4 120 9 of 9
Oil and Grease, Surfactants, and Petroleum Hydrocarbons (mg/L) TimesJul Aug Sep Oct Nov Dec Jan Feb Mar Apr May Jun Average Maximum Detected
FATS OIL AND GREASE 41.5 46.8 49 48 50.1 31.5 20 52.5 28 32.5 32 22.5 34.7 55 23 of 23MBAS 6.27 7.29 5.73 6.03 6.38 3.44 1.7 4.32 2.85 2.03 3.65 2.24 3.72 7.39 24 of 24PETROLEUM HYDROCARBON 0.771 0.535 0.561 0.597 0.441 0.433 0.261 0.747 0.704 0.51 1 0.892 0.617 2 23 of 24
Table A-6. Deer Island Influent Characterization (South System), FY03
A-29

Organochlorine Pesticides and PCBs (ug/L) TimesJul Aug Sep Oct Nov Dec Jan Feb Mar Apr May Jun Average Maximum Detected
2,4'-DDD 0.000105 0.000105 0.000118 0.000106 ~ 0.000103 ~ 0.000118 ~ 0.00011 ~ 0.000103 0.000108 0.000133 0 of 172,4'-DDE 0.000105 0.000105 0.000118 0.000106 ~ 0.000103 ~ 0.000118 ~ 0.00011 ~ 0.000103 0.000108 0.000133 0 of 172,4'-DDT 0.000105 0.000105 0.000118 0.000106 ~ 0.000103 ~ 0.000118 ~ 0.00011 ~ 0.000103 0.000108 0.000133 0 of 174,4'-DDD 0.00179 0.00188 0.0019 0.00141 0.00215 0.00201 0.00212 0.00183 0.00212 0.00164 0.00218 0.00155 0.00188 0.00233 17 of 404,4'-DDE 0.00224 0.0025 0.00274 0.00268 0.00215 0.0023 0.00212 0.00261 0.00212 0.00212 0.00218 0.00317 0.0024 0.0042 18 of 404,4'-DDT 0.00195 0.00151 0.00168 0.000703 0.00215 0.00115 0.00212 0.00254 0.00212 0.00208 0.00796 0.000836 0.00229 0.014 10 of 40ALDRIN 0.00163 0.00116 0.00134 0.000703 0.00215 0.00115 0.00212 0.00109 0.00212 0.00137 0.00218 0.000766 0.00151 0.00233 0 of 40ALPHA-BHC 0.00218 0.00222 0.00257 0.00241 0.00215 0.0022 0.00212 0.00207 0.00212 0.00262 0.00218 0.00209 0.00224 0.00308 0 of 23ALPHA-CHLORDANE 0.00254 0.00324 0.00467 0.00747 0.00215 0.00502 0.00212 0.00358 0.00212 0.00521 0.0153 0.00697 0.00512 0.0178 19 of 40AROCLOR-1016 0.0545 0.0556 0.0641 0.0602 0.0537 0.0551 0.0532 0.0518 0.0529 0.0655 0.0545 0.0524 0.0559 0.0769 0 of 23AROCLOR-1221 0.109 0.111 0.129 0.12 0.107 0.11 0.106 0.103 0.106 0.131 0.109 0.105 0.112 0.154 0 of 23AROCLOR-1232 0.0545 0.0556 0.0641 0.0602 0.0537 0.0551 0.0532 0.0518 0.0529 0.0655 0.0545 0.0524 0.0559 0.0769 0 of 23AROCLOR-1242 0.0545 0.0556 0.0641 0.0602 0.0537 0.0551 0.0532 0.0518 0.0529 0.0655 0.0545 0.0524 0.0559 0.0769 0 of 23AROCLOR-1248 0.0545 0.0556 0.0641 0.0602 0.0537 0.0551 0.0532 0.0518 0.0529 0.0655 0.0545 0.0524 0.0559 0.0769 0 of 23AROCLOR-1254 0.0545 0.0556 0.0641 0.0602 0.0537 0.0551 0.0532 0.0518 0.0529 0.0655 0.0545 0.0524 0.0559 0.0769 0 of 23AROCLOR-1260 0.0545 0.0556 0.0641 0.0602 0.0537 0.0551 0.0532 0.0518 0.0529 0.0655 0.0545 0.0524 0.0559 0.0769 0 of 23BETA-BHC 0.00218 0.00222 0.00257 0.00241 0.00215 0.0022 0.00212 0.00207 0.00212 0.00262 0.00218 0.00209 0.00224 0.00308 0 of 23CHLORDANE (TECHNICAL) 0.0545 0.0556 0.0641 0.0602 0.0537 0.0551 0.0532 0.0518 0.0529 0.0655 0.0545 0.0524 0.0559 0.0769 0 of 23DDMU 0.000105 0.000105 0.000118 0.000106 0.000103 ~ 0.000118 ~ 0.00011 ~ 0.000103 0.000108 0.000133 0 of 17DELTA-BHC 0.00218 0.00222 0.00257 0.00241 0.00215 0.0022 0.00212 0.00207 0.00212 0.00262 0.00218 0.00209 0.00224 0.00308 0 of 23DIELDRIN 0.00163 0.00116 0.00134 0.000703 0.00215 0.00115 0.00212 0.00109 0.00212 0.00267 0.00218 0.00234 0.00188 0.00306 6 of 40ENDOSULFAN I 0.00218 0.00222 0.00257 0.00241 0.00215 0.0022 0.00212 0.00207 0.00212 0.00262 0.00218 0.00209 0.00224 0.00308 0 of 23ENDOSULFAN II 0.00218 0.00222 0.00257 0.00241 0.00215 0.0022 0.00212 0.00207 0.00212 0.00262 0.00218 0.00209 0.00224 0.00308 0 of 23ENDOSULFAN SULFATE 0.00218 0.00222 0.00257 0.00241 0.00215 0.0022 0.00212 0.00207 0.00212 0.00262 0.00218 0.00209 0.00224 0.00308 0 of 23ENDRIN 0.00163 0.00116 0.00134 0.000703 0.00215 0.00115 0.00212 0.00109 0.00212 0.00137 0.00218 0.000766 0.00151 0.00233 0 of 40ENDRIN ALDEHYDE 0.00218 0.00222 0.00257 0.00241 0.00215 0.0022 0.00212 0.00207 0.00212 0.00262 0.00218 0.00209 0.00224 0.00308 0 of 23ENDRIN KETONE 0.00218 0.00222 0.00257 0.00241 0.00215 0.0022 0.00212 0.00207 0.00212 0.00262 0.00218 0.00209 0.00224 0.00308 0 of 23GAMMA-BHC (LINDANE) 0.00204 0.00209 0.00217 0.00581 0.00215 0.00115 0.00212 0.00109 0.00212 0.00219 0.00218 0.000766 0.002 0.00886 9 of 40GAMMA-CHLORDANE 0.00267 0.00369 0.00523 0.00891 0.00215 0.00382 0.00212 0.00388 0.00212 0.00516 0.0141 0.00772 0.00517 0.019 20 of 40HEPTACHLOR 0.00163 0.00116 0.00134 0.000703 0.00215 0.00115 0.00212 0.00109 0.00212 0.00137 0.00218 0.000766 0.00151 0.00233 0 of 40HEPTACHLOR EPOXIDE 0.00163 0.00116 0.00134 0.000703 0.00215 0.00115 0.00212 0.00109 0.00212 0.00137 0.00218 0.000766 0.00151 0.00233 0 of 40HEXACHLOROBENZENE 0.000105 0.000105 0.000118 0.000106 ~ 0.000103 ~ 0.000118 ~ 0.00011 ~ 0.000103 0.000108 0.000133 0 of 17METHOXYCHLOR 0.0218 0.0222 0.0257 0.0241 0.0215 0.022 0.0212 0.0207 0.0212 0.0262 0.0218 0.0209 0.0224 0.0308 0 of 23MIREX 0.000105 0.000105 0.000118 0.000106 ~ 0.000103 ~ 0.000118 ~ 0.00011 ~ 0.000103 0.000108 0.000133 0 of 17TOTAL CHLORDANE 0.00962 0.012 0.00489 0.0251 ~ 0.0154 ~ 0.0132 ~ 0.0191 ~ 0.021 0.0163 0.0311 17 of 17TOTAL DDT 0.00431 0.00505 0.0211 0.00405 ~ 0.00421 ~ 0.00768 ~ 0.00382 ~ 0.0034 0.00601 0.0274 17 of 17TOXAPHENE 0.0545 0.0556 0.0641 0.0602 0.0537 0.0551 0.0532 0.0518 0.0529 0.0655 0.0545 0.0524 0.0559 0.0769 0 of 23TRANS-NONACHLOR 0.0023 0.0026 0.00646 0.00623 ~ 0.00215 ~ 0.00245 ~ 0.00361 ~ 0.00338 0.00355 0.00854 17 of 17
Table A-6. Deer Island Influent Characterization (South System), FY03 (cont.)
A-30

Semivolatile Organics (ug/L) TimesJul Aug Sep Oct Nov Dec Jan Feb Mar Apr May Jun Average Maximum Detected
1,2,4-TRICHLOROBENZENE 1.04 1.08 5.96 1.2 1.07 1.02 1.12 1.12 1.03 1.14 1.04 1.03 1.36 10.6 0 of 221,2-DICHLOROBENZENE 1.04 1.08 5.96 1.2 1.07 1.02 1.12 1.12 1.03 1.14 1.04 1.03 1.36 10.6 0 of 221,2-DIPHENYLHYDRAZINE (AS AZOBENZENE) 1.04 1.08 5.96 1.2 1.07 1.02 1.12 1.12 1.03 1.14 1.04 1.03 1.36 10.6 0 of 221,3-DICHLOROBENZENE 1.04 1.08 5.96 1.2 1.07 1.02 1.12 1.12 1.03 1.14 1.04 1.03 1.36 10.6 0 of 221,4-DICHLOROBENZENE 1.04 1.08 5.96 1.2 1.07 1.02 1.12 1.12 1.03 1.14 1.04 1.03 1.36 10.6 0 of 222,2'-OXYBIS(1-CHLOROPROPANE) 1.04 1.08 5.96 1.2 1.07 1.02 1.12 1.12 1.03 1.14 1.04 1.03 1.36 10.6 0 of 222,4,5-TRICHLOROPHENOL 1.04 1.08 5.96 1.2 1.07 1.02 1.12 1.12 1.03 1.14 1.04 1.03 1.36 10.6 0 of 222,4,6-TRICHLOROPHENOL 1.04 1.08 5.96 1.2 1.07 1.02 1.12 1.12 1.03 1.14 1.04 1.03 1.36 10.6 0 of 222,4-DICHLOROPHENOL 1.04 1.08 5.96 1.2 1.07 1.02 1.12 1.12 1.03 1.14 1.04 1.03 1.36 10.6 0 of 222,4-DIMETHYLPHENOL 1.04 1.08 5.96 1.2 1.07 1.02 1.12 1.12 1.03 1.14 1.04 1.03 1.36 10.6 0 of 222,4-DINITROPHENOL 2.07 2.16 11.9 2.4 2.14 2.04 2.24 2.24 2.05 2.27 2.08 2.06 2.72 21.2 0 of 222,4-DINITROTOLUENE 1.04 1.08 5.96 1.2 1.07 1.02 1.12 1.12 1.03 1.14 1.04 1.03 1.36 10.6 0 of 222,6-DINITROTOLUENE 1.04 1.08 5.96 1.2 1.07 1.02 1.12 1.12 1.03 1.14 1.04 1.03 1.36 10.6 0 of 222-CHLORONAPHTHALENE 1.04 1.08 5.96 1.2 1.07 1.02 1.12 1.12 1.03 1.14 1.04 1.03 1.36 10.6 0 of 222-CHLOROPHENOL 1.04 1.08 5.96 1.2 1.07 1.02 1.12 1.12 1.03 1.14 1.04 1.03 1.36 10.6 0 of 222-METHYL-4,6-DINITROPHENOL 10.4 10.8 59.6 12 10.7 10.2 11.2 11.2 10.3 11.4 10.4 10.3 13.6 106 0 of 222-METHYLNAPHTHALENE 1.04 1.08 5.96 1.2 1.07 1.02 1.12 1.12 1.03 1.14 1.04 1.03 1.36 10.6 0 of 222-METHYLPHENOL 1.04 1.08 5.96 1.2 1.07 1.02 1.12 1.12 1.03 1.14 1.04 1.03 1.36 10.6 0 of 222-NITROANILINE 1.04 1.08 5.96 1.2 1.07 1.02 1.12 1.12 1.03 1.14 1.04 1.03 1.36 10.6 0 of 222-NITROPHENOL 1.04 1.08 5.96 1.2 1.07 1.02 1.12 1.12 1.03 1.14 1.04 1.03 1.36 10.6 0 of 223,3'-DICHLOROBENZIDINE 2.07 2.16 11.9 2.4 2.14 2.04 2.24 2.24 2.05 2.27 2.08 2.06 2.72 21.2 0 of 223-NITROANILINE 1.04 1.08 5.96 1.2 1.07 1.02 1.12 1.12 1.03 1.14 1.04 1.03 1.36 10.6 0 of 224-BROMOPHENYL PHENYL ETHER 1.04 1.08 5.96 1.2 1.07 1.02 1.12 1.12 1.03 1.14 1.04 1.03 1.36 10.6 0 of 224-CHLORO-3-METHYLPHENOL 1.04 1.08 5.96 1.2 1.07 1.02 1.12 1.12 1.03 1.14 1.04 1.03 1.36 10.6 0 of 224-CHLOROANILINE 1.04 1.08 8.04 1.2 1.07 1.02 1.12 1.12 1.03 1.14 1.04 1.03 1.48 10.6 1 of 224-CHLOROPHENYL PHENYL ETHER 1.04 1.08 5.96 1.2 1.07 1.02 1.12 1.12 1.03 1.14 1.04 1.03 1.36 10.6 0 of 224-METHYLPHENOL (INCLUDES 3-METHYLPHENOL) 21.4 14.1 18.9 37.1 28.2 5.94 1.12 30.9 6.96 1.14 53.8 3.55 15.1 63.3 14 of 224-NITROANILINE 1.04 1.08 5.96 1.2 1.07 1.02 1.12 1.12 1.03 1.14 1.04 1.03 1.36 10.6 0 of 224-NITROPHENOL 2.07 2.16 11.9 2.4 2.14 2.04 2.24 2.24 2.05 2.27 2.08 2.06 2.72 21.2 0 of 22ACENAPHTHENE 1.04 1.08 5.96 1.2 1.07 1.02 1.12 1.12 1.03 1.14 1.04 1.03 1.36 10.6 0 of 22ACENAPHTHYLENE 1.04 1.08 5.96 1.2 1.07 1.02 1.12 1.12 1.03 1.14 1.04 1.03 1.36 10.6 0 of 22ANILINE 1.04 1.08 5.96 1.2 1.07 1.02 1.12 1.12 1.03 1.14 1.04 1.03 1.36 10.6 0 of 22ANTHRACENE 1.04 1.08 5.96 1.2 1.07 1.02 1.12 1.12 1.03 1.14 1.04 1.03 1.36 10.6 0 of 22BENZIDINE 5.19 5.4 40.5 6 5.35 5.1 5.61 5.6 5.13 5.68 5.2 5.14 7.41 53 1 of 22
Table A-6. Deer Island Influent Characterization (South System), FY03 (cont.)
A-31

Semivolatile Organics (ug/L) TimesJul Aug Sep Oct Nov Dec Jan Feb Mar Apr May Jun Average Maximum Detected
BENZO(A)ANTHRACENE 1.04 1.08 5.96 1.2 1.07 1.02 1.12 1.12 1.03 1.14 1.04 1.03 1.36 10.6 0 of 22BENZO(A)PYRENE 1.04 1.08 5.96 1.2 1.07 1.02 1.12 1.12 1.03 1.14 1.04 1.03 1.36 10.6 0 of 22BENZO(B)FLUORANTHENE 1.04 1.08 5.96 1.2 1.07 1.02 1.12 1.12 1.03 1.14 1.04 1.03 1.36 10.6 0 of 22BENZO(GHI)PERYLENE 1.04 1.08 5.96 1.2 1.07 1.02 1.12 1.12 1.03 1.14 1.04 1.03 1.36 10.6 0 of 22BENZO(K)FLUORANTHENE 1.04 1.08 5.96 1.2 1.07 1.02 1.12 1.12 1.03 1.14 1.04 1.03 1.36 10.6 0 of 22BENZOIC ACID 17.4 16.7 11.9 45 39.9 2.04 2.24 11.8 8.23 2.27 2.08 2.06 9.02 51 8 of 22BENZYL ALCOHOL 8.24 6.22 8.6 15.3 10.3 1.02 1.12 4.13 6.04 1.14 7.21 1.03 4.41 15.3 12 of 22BIS(2-CHLOROETHOXY)METHANE 1.04 1.08 5.96 1.2 1.07 1.02 1.12 1.12 1.03 1.14 1.04 1.03 1.36 10.6 0 of 22BIS(2-CHLOROETHYL)ETHER 1.04 1.08 5.96 1.2 1.07 1.02 1.12 1.12 1.03 1.14 1.04 1.03 1.36 10.6 0 of 22BIS(2-ETHYLHEXYL)PHTHALATE 10.4 12.4 16.9 13.9 11.8 14.7 8.47 21.5 10.1 15.6 23 1.03 12.6 24 18 of 22BUTYL BENZYL PHTHALATE 1.04 1.08 5.96 1.2 1.07 1.02 1.12 1.12 1.03 1.14 1.04 1.03 1.36 10.6 0 of 22CHRYSENE 1.04 1.08 5.96 1.2 1.07 1.02 1.12 1.12 1.03 1.14 1.04 1.03 1.36 10.6 0 of 22DI-N-BUTYLPHTHALATE 1.04 1.08 5.96 1.2 1.07 1.02 1.12 1.12 1.03 1.14 1.04 1.03 1.36 10.6 0 of 22DI-N-OCTYLPHTHALATE 1.04 1.08 5.96 1.2 1.07 1.02 1.12 1.12 1.03 1.14 1.04 1.03 1.36 10.6 0 of 22DIBENZO(A,H)ANTHRACENE 1.04 1.08 5.96 1.2 1.07 1.02 1.12 1.12 1.03 1.14 1.04 1.03 1.36 10.6 0 of 22DIBENZOFURAN 1.04 1.08 5.96 1.2 1.07 1.02 1.12 1.12 1.03 1.14 1.04 1.03 1.36 10.6 0 of 22DIETHYL PHTHALATE 1.04 1.08 8.41 1.2 4.17 1.02 1.12 1.12 1.03 1.14 1.04 1.03 1.69 10.6 2 of 22DIMETHYL PHTHALATE 1.04 1.08 5.96 1.2 1.07 1.02 1.12 1.12 1.03 1.14 1.04 1.03 1.36 10.6 0 of 22FLUORANTHENE 1.04 1.08 5.96 1.2 1.07 1.02 1.12 1.12 1.03 1.14 1.04 1.03 1.36 10.6 0 of 22FLUORENE 1.04 1.08 5.96 1.2 1.07 1.02 1.12 1.12 1.03 1.14 1.04 1.03 1.36 10.6 0 of 22HEXACHLOROBENZENE 1.04 1.08 5.96 1.2 1.07 1.02 1.12 1.12 1.03 1.14 1.04 1.03 1.36 10.6 0 of 22HEXACHLOROBUTADIENE 1.04 1.08 5.96 1.2 1.07 1.02 1.12 1.12 1.03 1.14 1.04 1.03 1.36 10.6 0 of 22HEXACHLOROCYCLOPENTADIENE 5.19 5.4 29.8 6 5.35 5.1 5.61 5.6 5.13 5.68 5.2 5.14 6.79 53 0 of 22HEXACHLOROETHANE 1.04 1.08 5.96 1.2 1.07 1.02 1.12 1.12 1.03 1.14 1.04 1.03 1.36 10.6 0 of 22INDENO(1,2,3-CD)PYRENE 1.04 1.08 5.96 1.2 1.07 1.02 1.12 1.12 1.03 1.14 1.04 1.03 1.36 10.6 0 of 22ISOPHORONE 1.04 1.08 5.96 1.2 1.07 1.02 1.12 1.12 1.03 1.14 1.04 1.03 1.36 10.6 0 of 22N-NITROSODI-N-PROPYLAMINE 1.04 1.08 5.96 1.2 1.07 1.02 1.12 1.12 1.03 1.14 1.04 1.03 1.36 10.6 0 of 22N-NITROSODIMETHYLAMINE 1.04 1.08 5.96 1.2 1.07 1.02 1.12 1.12 1.03 1.14 1.04 1.03 1.36 10.6 0 of 22N-NITROSODIPHENYLAMINE 1.04 1.08 5.96 1.2 1.07 1.02 1.12 1.12 1.03 1.14 1.04 1.03 1.36 10.6 0 of 22NAPHTHALENE 1.04 1.08 5.96 1.2 1.07 1.02 1.12 1.12 1.03 1.14 1.04 1.03 1.36 10.6 0 of 22NITROBENZENE 1.04 1.08 5.96 1.2 1.07 1.02 1.12 1.12 1.03 1.14 1.04 1.03 1.36 10.6 0 of 22PENTACHLOROPHENOL 3.11 3.24 17.9 3.6 3.21 3.06 3.36 3.36 3.08 3.41 3.12 3.08 4.08 31.8 0 of 22PHENANTHRENE 0.104 0.108 0.596 0.12 0.107 0.102 0.112 0.112 0.103 0.114 0.104 0.103 0.136 1.06 0 of 22PHENOL 2.07 2.16 11.9 13.7 2.14 2.04 2.24 2.24 2.05 2.27 2.08 2.06 3.04 21.2 1 of 22PYRENE 1.04 1.08 5.96 1.2 1.07 1.02 1.12 1.12 1.03 1.14 1.04 1.03 1.36 10.6 0 of 22
Table A-6. Deer Island Influent Characterization (South System), FY03 (cont.)
A-32

Volatile Organics (ug/L) TimesJul Aug Sep Oct Nov Dec Jan Feb Mar Apr May Jun Average Maximum Detected
1,1,1-TRICHLOROETHANE 0.5 0.5 0.5 0.5 0.5 0.5 0.5 0.5 0.5 0.5 0.5 0.5 0.5 0.5 0 of 241,1,2,2-TETRACHLOROETHANE 0.5 0.5 0.5 0.5 0.5 0.5 0.5 0.5 0.5 0.5 0.5 0.5 0.5 0.5 0 of 241,1,2-TRICHLOROETHANE 0.5 0.5 0.5 0.5 0.5 0.5 0.5 0.5 0.5 0.5 0.5 0.5 0.5 0.5 0 of 241,1-DICHLOROETHANE 0.5 0.5 0.5 0.5 0.5 0.5 0.5 0.5 0.5 0.5 0.5 0.5 0.5 0.5 0 of 241,1-DICHLOROETHENE 0.5 0.5 0.5 0.5 0.5 0.5 0.5 0.5 0.5 0.5 0.5 0.5 0.5 0.5 0 of 241,2-DICHLOROBENZENE 0.5 0.5 0.5 0.5 0.5 0.5 0.5 0.5 0.5 0.5 0.5 0.5 0.5 0.5 0 of 241,2-DICHLOROETHANE 0.5 0.5 0.5 0.5 0.5 0.5 0.5 0.5 0.5 0.5 0.5 0.5 0.5 0.5 0 of 241,2-DICHLOROPROPANE 0.5 0.5 0.5 0.5 0.5 0.5 0.5 0.5 0.5 0.5 0.5 0.5 0.5 0.5 0 of 241,3-DICHLOROBENZENE 0.5 0.5 1.84 0.5 0.5 0.5 0.5 0.5 0.5 0.5 0.5 0.5 0.574 3.16 1 of 241,4-DICHLOROBENZENE 2.48 1.63 3.19 1.71 0.5 0.5 0.5 0.5 0.5 0.5 0.5 0.5 0.892 4.31 5 of 242-BUTANONE 10.6 7.47 8.69 12.6 5.24 5.48 0.5 2.19 0.5 0.5 0.5 6.53 4.1 15.8 14 of 242-CHLOROETHYL VINYL ETHER 0.5 0.5 0.5 0.5 0.5 0.5 0.5 0.5 0.5 0.5 0.5 0.5 0.5 0.5 0 of 242-HEXANONE 0.5 0.5 0.5 0.5 0.5 0.5 0.5 0.5 0.5 0.5 0.5 0.5 0.5 0.5 0 of 244-METHYL-2-PENTANONE 0.5 0.5 0.5 0.5 0.5 0.5 0.5 0.5 0.5 0.5 0.5 0.5 0.5 0.5 0 of 24ACETONE 142 151 193 324 183 161 85.9 66.8 102 215 412 111 172 743 24 of 24ACROLEIN 0.5 0.5 0.5 0.5 0.5 0.5 0.5 1 1 1 1 1 0.754 1 0 of 24ACRYLONITRILE 0.5 0.5 0.5 0.5 0.5 0.5 0.5 1 2.29 1 1 1 0.876 3.61 1 of 24BENZENE 0.5 0.5 0.5 0.5 0.5 0.5 0.5 0.5 0.5 0.5 0.5 0.5 0.5 0.5 0 of 24BROMODICHLOROMETHANE 0.5 0.5 0.5 0.5 0.5 0.5 0.5 0.5 0.5 0.5 0.5 0.5 0.5 0.5 0 of 24BROMOFORM 0.5 0.5 0.5 0.5 0.5 0.5 0.5 0.5 0.5 0.5 0.5 0.5 0.5 0.5 0 of 24BROMOMETHANE 0.5 0.5 0.5 0.5 0.5 0.5 0.5 0.5 0.5 0.5 0.5 0.5 0.5 0.5 0 of 24CARBON DISULFIDE 0.5 1.71 0.5 1.96 0.5 0.5 0.5 0.5 0.5 0.5 0.5 0.5 0.639 3.3 2 of 24CARBON TETRACHLORIDE 0.5 0.5 0.5 0.5 0.5 0.5 0.5 0.5 0.5 0.5 0.5 0.5 0.5 0.5 0 of 24CHLOROBENZENE 0.5 0.5 0.5 0.5 0.5 0.5 0.5 0.5 0.5 0.5 0.5 0.5 0.5 0.5 0 of 24CHLOROETHANE 0.5 0.5 0.5 0.5 0.5 0.5 0.5 0.5 0.5 0.5 0.5 0.5 0.5 0.5 0 of 24CHLOROFORM 6.19 6.76 6.64 5.66 4.06 3.46 1.63 4.67 4.08 3.45 6.02 5.13 4.47 6.8 23 of 24CHLOROMETHANE 0.5 0.5 0.5 0.5 0.5 0.5 0.5 0.5 0.5 0.5 0.5 0.5 0.5 0.5 0 of 24CIS-1,2-DICHLOROETHENE 0.5 0.5 0.5 0.5 0.5 0.5 0.5 0.5 0.5 0.5 0.5 0.5 0.5 0.5 0 of 24CIS-1,3-DICHLOROPROPENE 0.5 0.5 0.5 0.5 0.5 0.5 0.5 0.5 0.5 0.5 0.5 0.5 0.5 0.5 0 of 24DIBROMOCHLOROMETHANE 0.5 0.5 0.5 0.5 0.5 0.5 0.5 0.5 0.5 0.5 0.5 0.5 0.5 0.5 0 of 24ETHYLBENZENE 0.5 0.5 0.5 0.5 0.5 0.5 0.5 0.5 0.5 0.5 0.5 0.5 0.5 0.5 0 of 24M,P-XYLENE 0.5 4.75 0.5 0.5 0.5 0.5 0.5 1 1.93 1 1 1 1.06 9.5 2 of 24METHYLENE CHLORIDE 0.5 3.48 1.6 2.03 0.5 0.5 0.5 1.54 0.5 1.52 0.5 1.7 1.15 4.27 7 of 24O-XYLENE 0.5 1.9 0.5 0.5 0.5 0.5 0.5 0.5 0.5 0.5 0.5 0.5 0.572 3.47 1 of 24STYRENE 0.5 0.5 0.5 0.5 0.5 3.07 0.5 0.5 0.5 0.5 11 0.5 1.63 21.7 2 of 24TETRACHLOROETHENE 5.25 9.23 2.2 3.21 3.75 5.9 3.73 18.9 4.61 3.7 3.47 2.03 5.23 28.5 18 of 24TOLUENE 8.78 5.53 7.06 6.67 4.35 2.83 0.5 3 6.08 0.5 2.53 1.82 3.45 12.5 18 of 24TRANS-1,2-DICHLOROETHENE 0.5 0.5 0.5 0.5 0.5 0.5 0.5 0.5 0.5 0.5 0.5 0.5 0.5 0.5 0 of 24TRANS-1,3-DICHLOROPROPENE 0.5 0.5 0.5 0.5 0.5 0.5 0.5 0.5 0.5 0.5 0.5 0.5 0.5 0.5 0 of 24TRICHLOROETHENE 1.58 0.5 0.5 0.5 0.5 0.5 0.5 1.65 0.5 0.5 0.5 0.5 0.657 2.85 2 of 24TRICHLOROFLUOROMETHANE 0.5 0.5 0.5 0.5 0.5 0.5 0.5 0.5 0.5 0.5 0.5 0.5 0.5 0.5 0 of 24VINYL ACETATE 0.5 0.5 0.5 0.5 0.5 0.5 0.5 0.5 0.5 0.5 0.5 0.5 0.5 0.5 0 of 24VINYL CHLORIDE 0.5 0.5 0.5 0.5 0.5 0.5 0.5 0.5 0.5 0.5 0.5 0.5 0.5 0.5 0 of 24
Notes~: No data or no samples takenResults in bold indicate one or more detects that monthYearly averages are calculated from individual results collected during the fiscal year.Non-detected compounds are assumed to equal one half of the detection limit for metals and inorganics and one tenth of the reporting limit for organic compounds.
Table A-6. Deer Island Influent Characterization (South System), FY03 (cont.)
A-33

Metals (lbs/day) TimesJul Aug Sep Oct Nov Dec Jan Feb Mar Apr May Jun Average Maximum Detected
ANTIMONY 6.88 5.81 5.41 5 7.41 9.99 14.4 8.48 9.42 14.4 8.44 15.8 9.46 16.7 0 of 23ARSENIC 0.31 0.266 0.288 0.267 0.297 0.685 0.659 0.39 0.502 0.661 1.46 0.632 0.545 1.77 3 of 23BERYLLIUM 0.194 0.166 0.18 0.167 0.185 0.25 0.412 0.243 0.314 0.413 0.281 0.395 0.27 0.418 0 of 23BORON 157 183 279 307 260 315 206 268 157 206 141 198 221 325 12 of 23CADMIUM 0.282 0.17 0.149 0.157 0.132 0.248 0.494 0.969 0.387 0.934 1.18 0.618 0.49 1.47 23 of 23CHROMIUM 2.23 3.26 2.06 1.6 1.59 3 3.72 5.2 3.65 4.63 8.87 4.62 3.77 11.6 23 of 23COPPER 48.6 48.4 54.2 47.1 42.9 46 51.3 105 51.2 82.2 154 69.6 67.2 168 23 of 23HEXAVALENT CHROMIUM 1.9 1.61 1.73 1.65 2.12 2.43 3.93 2.47 2.96 4.08 2.77 3.58 2.6 4.09 0 of 24IRON 1180 957 1200 1000 1040 1580 1810 2900 1880 3150 4650 2430 2020 5280 23 of 23LEAD 3.58 2.34 4.9 4.05 3.35 4.66 4.27 10.4 3.14 11.2 16.4 8.26 6.45 20.6 20 of 23MERCURY 0.0858 0.0696 0.133 0.112 0.0897 0.233 0.25 0.252 0.157 0.348 0.563 0.231 0.214 0.666 23 of 23MOLYBDENUM 5.32 4.57 2.8 2.29 2.52 2.73 0.824 4.3 2.95 7.75 9.84 6.26 4.41 13.9 21 of 23NICKEL 3.18 2.34 1.95 1.77 1.85 3.92 3.6 4.48 4.36 6.83 15 7.23 4.83 22.7 23 of 23SELENIUM 0.349 0.299 0.324 0.3 0.334 0.45 0.741 0.438 0.565 0.743 0.507 0.711 0.487 0.753 0 of 23SILVER 0.765 1.21 0.959 1.41 1.44 1.32 1.82 2.08 1.56 2.62 5.05 3.14 1.99 5.78 23 of 23THALLIUM 0.388 0.332 0.36 0.333 0.371 0.5 0.824 0.487 0.628 0.826 0.563 0.791 0.541 0.837 0 of 23ZINC 72.4 60.3 72.8 68.8 58.6 83.3 106 177 95.4 173 272 133 116 303 23 of 23
Cyanide and Phenols (lbs/day) TimesJul Aug Sep Oct Nov Dec Jan Feb Mar Apr May Jun Average Maximum Detected
CYANIDE 3.81 3.21 3.46 3.3 4.25 4.86 7.85 4.94 5.93 8.17 5.54 7.15 5.21 8.18 0 of 24PHENOL 26.5 36.8 52.2 ~ 26.6 28.2 ~ ~ ~ ~ ~ ~ 34.9 81.8 9 of 9
Oil and Grease, Surfactants, and Petroleum Hydrocarbons (lbs/day) TimesJul Aug Sep Oct Nov Dec Jan Feb Mar Apr May Jun Average Maximum Detected
FATS OIL AND GREASE 31600 30100 33900 33000 42600 30600 31400 51900 33200 53100 35400 32200 36700 55600 23 of 23MBAS 4870 4850 4020 4020 4730 3440 2800 4210 3580 3340 4100 3540 3960 5480 24 of 24PETROLEUM HYDROCARBON 587 344 388 394 375 421 409 739 834 833 1110 1280 643 2200 23 of 24
Table A-7. Deer Island Influent Loadings (South System), FY03
A-34

Organochlorine Pesticides and PCBs (lbs/day) TimesJul Aug Sep Oct Nov Dec Jan Feb Mar Apr May Jun Average Maximum Detected
2,4'-DDD 0.000089 0.0000694 0.000083 0.000071 ~ 0.000103 ~ 0.000115 ~ 0.000181 ~ 0.000164 0.000111 0.00019 0 of 172,4'-DDE 0.000089 0.0000694 0.000083 0.000071 ~ 0.000103 ~ 0.000115 ~ 0.000181 ~ 0.000164 0.000111 0.00019 0 of 172,4'-DDT 0.000089 0.0000694 0.000083 0.000071 ~ 0.000103 ~ 0.000115 ~ 0.000181 ~ 0.000164 0.000111 0.00019 0 of 174,4'-DDD 0.00139 0.00125 0.00134 0.000938 0.00159 0.00201 0.0035 0.00178 0.00266 0.00271 0.00246 0.00246 0.00201 0.00351 17 of 404,4'-DDE 0.00174 0.00166 0.00192 0.00178 0.00159 0.0023 0.0035 0.00254 0.00266 0.00351 0.00246 0.00502 0.00256 0.00702 18 of 404,4'-DDT 0.00151 0.001 0.00118 0.000468 0.00159 0.00115 0.0035 0.00247 0.00266 0.00343 0.00896 0.00132 0.00244 0.0156 10 of 40ALDRIN 0.00127 0.000774 0.000941 0.000468 0.00159 0.00115 0.0035 0.00107 0.00266 0.00225 0.00246 0.00121 0.00161 0.00351 0 of 40ALPHA-BHC 0.00169 0.00148 0.0018 0.00166 0.00159 0.0022 0.0035 0.00201 0.00266 0.00433 0.00246 0.00331 0.00242 0.00504 0 of 23ALPHA-CHLORDANE 0.00197 0.00215 0.00328 0.00497 0.00159 0.00502 0.0035 0.00348 0.00266 0.00861 0.0172 0.011 0.00545 0.0198 19 of 40AROCLOR-1016 0.0423 0.037 0.045 0.0415 0.0398 0.0551 0.0876 0.0504 0.0664 0.108 0.0614 0.0828 0.0606 0.126 0 of 23AROCLOR-1221 0.0846 0.0737 0.0901 0.0828 0.0796 0.11 0.175 0.101 0.133 0.217 0.123 0.165 0.121 0.252 0 of 23AROCLOR-1232 0.0423 0.037 0.045 0.0415 0.0398 0.0551 0.0876 0.0504 0.0664 0.108 0.0614 0.0828 0.0606 0.126 0 of 23AROCLOR-1242 0.0423 0.037 0.045 0.0415 0.0398 0.0551 0.0876 0.0504 0.0664 0.108 0.0614 0.0828 0.0606 0.126 0 of 23AROCLOR-1248 0.0423 0.037 0.045 0.0415 0.0398 0.0551 0.0876 0.0504 0.0664 0.108 0.0614 0.0828 0.0606 0.126 0 of 23AROCLOR-1254 0.0423 0.037 0.045 0.0415 0.0398 0.0551 0.0876 0.0504 0.0664 0.108 0.0614 0.0828 0.0606 0.126 0 of 23AROCLOR-1260 0.0423 0.037 0.045 0.0415 0.0398 0.0551 0.0876 0.0504 0.0664 0.108 0.0614 0.0828 0.0606 0.126 0 of 23BETA-BHC 0.00169 0.00148 0.0018 0.00166 0.00159 0.0022 0.0035 0.00201 0.00266 0.00433 0.00246 0.00331 0.00242 0.00504 0 of 23CHLORDANE (TECHNICAL) 0.0423 0.037 0.045 0.0415 0.0398 0.0551 0.0876 0.0504 0.0664 0.108 0.0614 0.0828 0.0606 0.126 0 of 23DDMU 0.000089 0.0000694 0.000083 0.000071 ~ 0.000103 ~ 0.000115 ~ 0.000181 ~ 0.000164 0.000111 0.00019 0 of 17DELTA-BHC 0.00169 0.00148 0.0018 0.00166 0.00159 0.0022 0.0035 0.00201 0.00266 0.00433 0.00246 0.00331 0.00242 0.00504 0 of 23DIELDRIN 0.00127 0.000774 0.000941 0.000468 0.00159 0.00115 0.0035 0.00107 0.00266 0.0044 0.00246 0.00369 0.002 0.0051 6 of 40ENDOSULFAN I 0.00169 0.00148 0.0018 0.00166 0.00159 0.0022 0.0035 0.00201 0.00266 0.00433 0.00246 0.00331 0.00242 0.00504 0 of 23ENDOSULFAN II 0.00169 0.00148 0.0018 0.00166 0.00159 0.0022 0.0035 0.00201 0.00266 0.00433 0.00246 0.00331 0.00242 0.00504 0 of 23ENDOSULFAN SULFATE 0.00169 0.00148 0.0018 0.00166 0.00159 0.0022 0.0035 0.00201 0.00266 0.00433 0.00246 0.00331 0.00242 0.00504 0 of 23ENDRIN 0.00127 0.000774 0.000941 0.000468 0.00159 0.00115 0.0035 0.00107 0.00266 0.00225 0.00246 0.00121 0.00161 0.00351 0 of 40ENDRIN ALDEHYDE 0.00169 0.00148 0.0018 0.00166 0.00159 0.0022 0.0035 0.00201 0.00266 0.00433 0.00246 0.00331 0.00242 0.00504 0 of 23ENDRIN KETONE 0.00169 0.00148 0.0018 0.00166 0.00159 0.0022 0.0035 0.00201 0.00266 0.00433 0.00246 0.00331 0.00242 0.00504 0 of 23GAMMA-BHC (LINDANE) 0.00158 0.00139 0.00152 0.00387 0.00159 0.00115 0.0035 0.00107 0.00266 0.00362 0.00246 0.00121 0.00213 0.0057 9 of 40GAMMA-CHLORDANE 0.00207 0.00245 0.00367 0.00594 0.00159 0.00381 0.0035 0.00378 0.00266 0.00852 0.0158 0.0122 0.0055 0.0212 20 of 40HEPTACHLOR 0.00127 0.000774 0.000941 0.000468 0.00159 0.00115 0.0035 0.00107 0.00266 0.00225 0.00246 0.00121 0.00161 0.00351 0 of 40HEPTACHLOR EPOXIDE 0.00127 0.000774 0.000941 0.000468 0.00159 0.00115 0.0035 0.00107 0.00266 0.00225 0.00246 0.00121 0.00161 0.00351 0 of 40HEXACHLOROBENZENE 0.000089 0.0000694 0.000083 0.000071 ~ 0.000103 ~ 0.000115 ~ 0.000181 ~ 0.000164 0.000111 0.00019 0 of 17METHOXYCHLOR 0.0169 0.0148 0.018 0.0166 0.0159 0.022 0.035 0.0202 0.0266 0.0433 0.0246 0.0331 0.0242 0.0504 0 of 23MIREX 0.000089 0.0000694 0.000083 0.000071 ~ 0.000103 ~ 0.000115 ~ 0.000181 ~ 0.000164 0.000111 0.00019 0 of 17TOTAL CHLORDANE 0.00815 0.00797 0.00343 0.0167 ~ 0.0154 ~ 0.0129 ~ 0.0316 ~ 0.0332 0.0167 0.0372 17 of 17TOTAL DDT 0.00365 0.00335 0.0148 0.0027 ~ 0.00421 ~ 0.00748 ~ 0.00631 ~ 0.00538 0.00614 0.0198 17 of 17TOXAPHENE 0.0423 0.037 0.045 0.0415 0.0398 0.0551 0.0876 0.0504 0.0664 0.108 0.0614 0.0828 0.0606 0.126 0 of 23TRANS-NONACHLOR 0.00195 0.00173 0.00453 0.00415 ~ 0.00215 ~ 0.00239 ~ 0.00596 ~ 0.00535 0.00363 0.0071 17 of 17
Table A-7. Deer Island Influent Loadings (South System), FY03 (cont.)
A-35

Semivolatile Organics (lbs/day) TimesJul Aug Sep Oct Nov Dec Jan Feb Mar Apr May Jun Average Maximum Detected
1,2,4-TRICHLOROBENZENE 0.805 0.721 4.18 0.828 0.793 1.02 1.85 1.09 1.26 1.88 1.17 1.63 1.49 7.64 0 of 221,2-DICHLOROBENZENE 0.805 0.721 4.18 0.828 0.793 1.02 1.85 1.09 1.26 1.88 1.17 1.63 1.49 7.64 0 of 221,2-DIPHENYLHYDRAZINE (AS AZOBENZENE) 0.805 0.721 4.18 0.828 0.793 1.02 1.85 1.09 1.26 1.88 1.17 1.63 1.49 7.64 0 of 221,3-DICHLOROBENZENE 0.805 0.721 4.18 0.828 0.793 1.02 1.85 1.09 1.26 1.88 1.17 1.63 1.49 7.64 0 of 221,4-DICHLOROBENZENE 0.805 0.721 4.18 0.828 0.793 1.02 1.85 1.09 1.26 1.88 1.17 1.63 1.49 7.64 0 of 222,2'-OXYBIS(1-CHLOROPROPANE) 0.805 0.721 4.18 0.828 0.793 1.02 1.85 1.09 1.26 1.88 1.17 1.63 1.49 7.64 0 of 222,4,5-TRICHLOROPHENOL 0.805 0.721 4.18 0.828 0.793 1.02 1.85 1.09 1.26 1.88 1.17 1.63 1.49 7.64 0 of 222,4,6-TRICHLOROPHENOL 0.805 0.721 4.18 0.828 0.793 1.02 1.85 1.09 1.26 1.88 1.17 1.63 1.49 7.64 0 of 222,4-DICHLOROPHENOL 0.805 0.721 4.18 0.828 0.793 1.02 1.85 1.09 1.26 1.88 1.17 1.63 1.49 7.64 0 of 222,4-DIMETHYLPHENOL 0.805 0.721 4.18 0.828 0.793 1.02 1.85 1.09 1.26 1.88 1.17 1.63 1.49 7.64 0 of 222,4-DINITROPHENOL 1.61 1.44 8.36 1.66 1.59 2.04 3.69 2.18 2.52 3.75 2.34 3.25 2.99 15.3 0 of 222,4-DINITROTOLUENE 0.805 0.721 4.18 0.828 0.793 1.02 1.85 1.09 1.26 1.88 1.17 1.63 1.49 7.64 0 of 222,6-DINITROTOLUENE 0.805 0.721 4.18 0.828 0.793 1.02 1.85 1.09 1.26 1.88 1.17 1.63 1.49 7.64 0 of 222-CHLORONAPHTHALENE 0.805 0.721 4.18 0.828 0.793 1.02 1.85 1.09 1.26 1.88 1.17 1.63 1.49 7.64 0 of 222-CHLOROPHENOL 0.805 0.721 4.18 0.828 0.793 1.02 1.85 1.09 1.26 1.88 1.17 1.63 1.49 7.64 0 of 222-METHYL-4,6-DINITROPHENOL 8.05 7.21 41.8 8.28 7.93 10.2 18.5 10.9 12.6 18.8 11.7 16.3 14.9 76.4 0 of 222-METHYLNAPHTHALENE 0.805 0.721 4.18 0.828 0.793 1.02 1.85 1.09 1.26 1.88 1.17 1.63 1.49 7.64 0 of 222-METHYLPHENOL 0.805 0.721 4.18 0.828 0.793 1.02 1.85 1.09 1.26 1.88 1.17 1.63 1.49 7.64 0 of 222-NITROANILINE 0.805 0.721 4.18 0.828 0.793 1.02 1.85 1.09 1.26 1.88 1.17 1.63 1.49 7.64 0 of 222-NITROPHENOL 0.805 0.721 4.18 0.828 0.793 1.02 1.85 1.09 1.26 1.88 1.17 1.63 1.49 7.64 0 of 223,3'-DICHLOROBENZIDINE 1.61 1.44 8.36 1.66 1.59 2.04 3.69 2.18 2.52 3.75 2.34 3.25 2.99 15.3 0 of 223-NITROANILINE 0.805 0.721 4.18 0.828 0.793 1.02 1.85 1.09 1.26 1.88 1.17 1.63 1.49 7.64 0 of 224-BROMOPHENYL PHENYL ETHER 0.805 0.721 4.18 0.828 0.793 1.02 1.85 1.09 1.26 1.88 1.17 1.63 1.49 7.64 0 of 224-CHLORO-3-METHYLPHENOL 0.805 0.721 4.18 0.828 0.793 1.02 1.85 1.09 1.26 1.88 1.17 1.63 1.49 7.64 0 of 224-CHLOROANILINE 0.805 0.721 5.64 0.828 0.793 1.02 1.85 1.09 1.26 1.88 1.17 1.63 1.63 7.64 1 of 224-CHLOROPHENYL PHENYL ETHER 0.805 0.721 4.18 0.828 0.793 1.02 1.85 1.09 1.26 1.88 1.17 1.63 1.49 7.64 0 of 224-METHYLPHENOL (INCLUDES 3-METHYLPHENOL) 16.6 9.43 13.3 25.6 20.9 5.94 1.85 30.1 8.56 1.88 60.5 5.61 16.6 70.5 14 of 224-NITROANILINE 0.805 0.721 4.18 0.828 0.793 1.02 1.85 1.09 1.26 1.88 1.17 1.63 1.49 7.64 0 of 224-NITROPHENOL 1.61 1.44 8.36 1.66 1.59 2.04 3.69 2.18 2.52 3.75 2.34 3.25 2.99 15.3 0 of 22ACENAPHTHENE 0.805 0.721 4.18 0.828 0.793 1.02 1.85 1.09 1.26 1.88 1.17 1.63 1.49 7.64 0 of 22ACENAPHTHYLENE 0.805 0.721 4.18 0.828 0.793 1.02 1.85 1.09 1.26 1.88 1.17 1.63 1.49 7.64 0 of 22ANILINE 0.805 0.721 4.18 0.828 0.793 1.02 1.85 1.09 1.26 1.88 1.17 1.63 1.49 7.64 0 of 22ANTHRACENE 0.805 0.721 4.18 0.828 0.793 1.02 1.85 1.09 1.26 1.88 1.17 1.63 1.49 7.64 0 of 22BENZIDINE 4.02 3.6 28.4 4.14 3.97 5.1 9.23 5.45 6.3 9.38 5.86 8.13 8.16 38.2 1 of 22
Table A-7. Deer Island Influent Loadings (South System), FY03 (cont.)
A-36

Semivolatile Organics (lbs/day) TimesJul Aug Sep Oct Nov Dec Jan Feb Mar Apr May Jun Average Maximum Detected
BENZO(A)ANTHRACENE 0.805 0.721 4.18 0.828 0.793 1.02 1.85 1.09 1.26 1.88 1.17 1.63 1.49 7.64 0 of 22BENZO(A)PYRENE 0.805 0.721 4.18 0.828 0.793 1.02 1.85 1.09 1.26 1.88 1.17 1.63 1.49 7.64 0 of 22BENZO(B)FLUORANTHENE 0.805 0.721 4.18 0.828 0.793 1.02 1.85 1.09 1.26 1.88 1.17 1.63 1.49 7.64 0 of 22BENZO(GHI)PERYLENE 0.805 0.721 4.18 0.828 0.793 1.02 1.85 1.09 1.26 1.88 1.17 1.63 1.49 7.64 0 of 22BENZO(K)FLUORANTHENE 0.805 0.721 4.18 0.828 0.793 1.02 1.85 1.09 1.26 1.88 1.17 1.63 1.49 7.64 0 of 22BENZOIC ACID 13.5 11.2 8.36 31.1 29.6 2.04 3.69 11.5 10.1 3.75 2.34 3.25 9.93 39 8 of 22BENZYL ALCOHOL 6.4 4.15 6.03 10.6 7.62 1.02 1.85 4.02 7.42 1.88 8.12 1.63 4.85 10.6 12 of 22BIS(2-CHLOROETHOXY)METHANE 0.805 0.721 4.18 0.828 0.793 1.02 1.85 1.09 1.26 1.88 1.17 1.63 1.49 7.64 0 of 22BIS(2-CHLOROETHYL)ETHER 0.805 0.721 4.18 0.828 0.793 1.02 1.85 1.09 1.26 1.88 1.17 1.63 1.49 7.64 0 of 22BIS(2-ETHYLHEXYL)PHTHALATE 8.08 8.26 11.9 9.62 8.73 14.7 14 20.9 12.4 25.7 25.9 1.63 13.9 31.1 18 of 22BUTYL BENZYL PHTHALATE 0.805 0.721 4.18 0.828 0.793 1.02 1.85 1.09 1.26 1.88 1.17 1.63 1.49 7.64 0 of 22CHRYSENE 0.805 0.721 4.18 0.828 0.793 1.02 1.85 1.09 1.26 1.88 1.17 1.63 1.49 7.64 0 of 22DI-N-BUTYLPHTHALATE 0.805 0.721 4.18 0.828 0.793 1.02 1.85 1.09 1.26 1.88 1.17 1.63 1.49 7.64 0 of 22DI-N-OCTYLPHTHALATE 0.805 0.721 4.18 0.828 0.793 1.02 1.85 1.09 1.26 1.88 1.17 1.63 1.49 7.64 0 of 22DIBENZO(A,H)ANTHRACENE 0.805 0.721 4.18 0.828 0.793 1.02 1.85 1.09 1.26 1.88 1.17 1.63 1.49 7.64 0 of 22DIBENZOFURAN 0.805 0.721 4.18 0.828 0.793 1.02 1.85 1.09 1.26 1.88 1.17 1.63 1.49 7.64 0 of 22DIETHYL PHTHALATE 0.805 0.721 5.9 0.828 3.09 1.02 1.85 1.09 1.26 1.88 1.17 1.63 1.86 7.64 2 of 22DIMETHYL PHTHALATE 0.805 0.721 4.18 0.828 0.793 1.02 1.85 1.09 1.26 1.88 1.17 1.63 1.49 7.64 0 of 22FLUORANTHENE 0.805 0.721 4.18 0.828 0.793 1.02 1.85 1.09 1.26 1.88 1.17 1.63 1.49 7.64 0 of 22FLUORENE 0.805 0.721 4.18 0.828 0.793 1.02 1.85 1.09 1.26 1.88 1.17 1.63 1.49 7.64 0 of 22HEXACHLOROBENZENE 0.805 0.721 4.18 0.828 0.793 1.02 1.85 1.09 1.26 1.88 1.17 1.63 1.49 7.64 0 of 22HEXACHLOROBUTADIENE 0.805 0.721 4.18 0.828 0.793 1.02 1.85 1.09 1.26 1.88 1.17 1.63 1.49 7.64 0 of 22HEXACHLOROCYCLOPENTADIENE 4.02 3.6 20.9 4.14 3.97 5.1 9.23 5.45 6.3 9.38 5.86 8.13 7.47 38.2 0 of 22HEXACHLOROETHANE 0.805 0.721 4.18 0.828 0.793 1.02 1.85 1.09 1.26 1.88 1.17 1.63 1.49 7.64 0 of 22INDENO(1,2,3-CD)PYRENE 0.805 0.721 4.18 0.828 0.793 1.02 1.85 1.09 1.26 1.88 1.17 1.63 1.49 7.64 0 of 22ISOPHORONE 0.805 0.721 4.18 0.828 0.793 1.02 1.85 1.09 1.26 1.88 1.17 1.63 1.49 7.64 0 of 22N-NITROSODI-N-PROPYLAMINE 0.805 0.721 4.18 0.828 0.793 1.02 1.85 1.09 1.26 1.88 1.17 1.63 1.49 7.64 0 of 22N-NITROSODIMETHYLAMINE 0.805 0.721 4.18 0.828 0.793 1.02 1.85 1.09 1.26 1.88 1.17 1.63 1.49 7.64 0 of 22N-NITROSODIPHENYLAMINE 0.805 0.721 4.18 0.828 0.793 1.02 1.85 1.09 1.26 1.88 1.17 1.63 1.49 7.64 0 of 22NAPHTHALENE 0.805 0.721 4.18 0.828 0.793 1.02 1.85 1.09 1.26 1.88 1.17 1.63 1.49 7.64 0 of 22NITROBENZENE 0.805 0.721 4.18 0.828 0.793 1.02 1.85 1.09 1.26 1.88 1.17 1.63 1.49 7.64 0 of 22PENTACHLOROPHENOL 2.41 2.16 12.5 2.48 2.38 3.06 5.54 3.27 3.78 5.63 3.51 4.88 4.48 22.9 0 of 22PHENANTHRENE 0.0805 0.0721 0.418 0.0828 0.0793 0.102 0.185 0.109 0.126 0.188 0.117 0.163 0.149 0.764 0 of 22PHENOL 1.61 1.44 8.36 9.45 1.59 2.04 3.69 2.18 2.52 3.75 2.34 3.25 3.34 15.3 1 of 22PYRENE 0.805 0.721 4.18 0.828 0.793 1.02 1.85 1.09 1.26 1.88 1.17 1.63 1.49 7.64 0 of 22
Table A-7. Deer Island Influent Loadings (South System), FY03 (cont.)
A-37

Volatile Organics (lbs/day) TimesJul Aug Sep Oct Nov Dec Jan Feb Mar Apr May Jun Average Maximum Detected
1,1,1-TRICHLOROETHANE 0.381 0.321 0.346 0.33 0.425 0.486 0.785 0.494 0.593 0.817 0.554 0.715 0.521 0.818 0 of 241,1,2,2-TETRACHLOROETHANE 0.381 0.321 0.346 0.33 0.425 0.486 0.785 0.494 0.593 0.817 0.554 0.715 0.521 0.818 0 of 241,1,2-TRICHLOROETHANE 0.381 0.321 0.346 0.33 0.425 0.486 0.785 0.494 0.593 0.817 0.554 0.715 0.521 0.818 0 of 241,1-DICHLOROETHANE 0.381 0.321 0.346 0.33 0.425 0.486 0.785 0.494 0.593 0.817 0.554 0.715 0.521 0.818 0 of 241,1-DICHLOROETHENE 0.381 0.321 0.346 0.33 0.425 0.486 0.785 0.494 0.593 0.817 0.554 0.715 0.521 0.818 0 of 241,2-DICHLOROBENZENE 0.381 0.321 0.346 0.33 0.425 0.486 0.785 0.494 0.593 0.817 0.554 0.715 0.521 0.818 0 of 241,2-DICHLOROETHANE 0.381 0.321 0.346 0.33 0.425 0.486 0.785 0.494 0.593 0.817 0.554 0.715 0.521 0.818 0 of 241,2-DICHLOROPROPANE 0.381 0.321 0.346 0.33 0.425 0.486 0.785 0.494 0.593 0.817 0.554 0.715 0.521 0.818 0 of 241,3-DICHLOROBENZENE 0.381 0.321 1.28 0.33 0.425 0.486 0.785 0.494 0.593 0.817 0.554 0.715 0.598 2.21 1 of 241,4-DICHLOROBENZENE 1.89 1.05 2.21 1.12 0.425 0.486 0.785 0.494 0.593 0.817 0.554 0.715 0.928 3.41 5 of 242-BUTANONE 8.06 4.8 6.01 8.32 4.45 5.33 0.785 2.17 0.593 0.817 0.554 9.34 4.27 11.9 14 of 242-CHLOROETHYL VINYL ETHER 0.381 0.321 0.346 0.33 0.425 0.486 0.785 0.494 0.593 0.817 0.554 0.715 0.521 0.818 0 of 242-HEXANONE 0.381 0.321 0.346 0.33 0.425 0.486 0.785 0.494 0.593 0.817 0.554 0.715 0.521 0.818 0 of 244-METHYL-2-PENTANONE 0.381 0.321 0.346 0.33 0.425 0.486 0.785 0.494 0.593 0.817 0.554 0.715 0.521 0.818 0 of 24ACETONE 108 97.4 134 213 156 156 135 66 120 351 457 158 179 819 24 of 24ACROLEIN 0.381 0.321 0.346 0.33 0.425 0.486 0.785 0.988 1.19 1.63 1.11 1.43 0.785 1.64 0 of 24ACRYLONITRILE 0.381 0.321 0.346 0.33 0.425 0.486 0.785 0.988 2.71 1.63 1.11 1.43 0.912 4.23 1 of 24BENZENE 0.381 0.321 0.346 0.33 0.425 0.486 0.785 0.494 0.593 0.817 0.554 0.715 0.521 0.818 0 of 24BROMODICHLOROMETHANE 0.381 0.321 0.346 0.33 0.425 0.486 0.785 0.494 0.593 0.817 0.554 0.715 0.521 0.818 0 of 24BROMOFORM 0.381 0.321 0.346 0.33 0.425 0.486 0.785 0.494 0.593 0.817 0.554 0.715 0.521 0.818 0 of 24BROMOMETHANE 0.381 0.321 0.346 0.33 0.425 0.486 0.785 0.494 0.593 0.817 0.554 0.715 0.521 0.818 0 of 24CARBON DISULFIDE 0.381 1.1 0.346 1.29 0.425 0.486 0.785 0.494 0.593 0.817 0.554 0.715 0.666 2.27 2 of 24CARBON TETRACHLORIDE 0.381 0.321 0.346 0.33 0.425 0.486 0.785 0.494 0.593 0.817 0.554 0.715 0.521 0.818 0 of 24CHLOROBENZENE 0.381 0.321 0.346 0.33 0.425 0.486 0.785 0.494 0.593 0.817 0.554 0.715 0.521 0.818 0 of 24CHLOROETHANE 0.381 0.321 0.346 0.33 0.425 0.486 0.785 0.494 0.593 0.817 0.554 0.715 0.521 0.818 0 of 24CHLOROFORM 4.71 4.35 4.59 3.73 3.45 3.36 2.55 4.61 4.84 5.63 6.67 7.33 4.65 8.1 23 of 24CHLOROMETHANE 0.381 0.321 0.346 0.33 0.425 0.486 0.785 0.494 0.593 0.817 0.554 0.715 0.521 0.818 0 of 24CIS-1,2-DICHLOROETHENE 0.381 0.321 0.346 0.33 0.425 0.486 0.785 0.494 0.593 0.817 0.554 0.715 0.521 0.818 0 of 24CIS-1,3-DICHLOROPROPENE 0.381 0.321 0.346 0.33 0.425 0.486 0.785 0.494 0.593 0.817 0.554 0.715 0.521 0.818 0 of 24DIBROMOCHLOROMETHANE 0.381 0.321 0.346 0.33 0.425 0.486 0.785 0.494 0.593 0.817 0.554 0.715 0.521 0.818 0 of 24ETHYLBENZENE 0.381 0.321 0.346 0.33 0.425 0.486 0.785 0.494 0.593 0.817 0.554 0.715 0.521 0.818 0 of 24M,P-XYLENE 0.381 3.05 0.346 0.33 0.425 0.486 0.785 0.988 2.29 1.63 1.11 1.43 1.1 5.77 2 of 24METHYLENE CHLORIDE 0.381 2.24 1.11 1.34 0.425 0.486 0.785 1.53 0.593 2.49 0.554 2.44 1.2 4.16 7 of 24O-XYLENE 0.381 1.22 0.346 0.33 0.425 0.486 0.785 0.494 0.593 0.817 0.554 0.715 0.596 2.11 1 of 24STYRENE 0.381 0.321 0.346 0.33 0.425 2.98 0.785 0.494 0.593 0.817 12.2 0.715 1.7 23.9 2 of 24TETRACHLOROETHENE 4 5.94 1.52 2.11 3.19 5.73 5.85 18.7 5.47 6.04 3.85 2.9 5.44 27.6 18 of 24TOLUENE 6.68 3.55 4.89 4.39 3.69 2.75 0.785 2.96 7.21 0.817 2.81 2.61 3.6 11.4 18 of 24TRANS-1,2-DICHLOROETHENE 0.381 0.321 0.346 0.33 0.425 0.486 0.785 0.494 0.593 0.817 0.554 0.715 0.521 0.818 0 of 24TRANS-1,3-DICHLOROPROPENE 0.381 0.321 0.346 0.33 0.425 0.486 0.785 0.494 0.593 0.817 0.554 0.715 0.521 0.818 0 of 24TRICHLOROETHENE 1.2 0.321 0.346 0.33 0.425 0.486 0.785 1.63 0.593 0.817 0.554 0.715 0.684 2.77 2 of 24TRICHLOROFLUOROMETHANE 0.381 0.321 0.346 0.33 0.425 0.486 0.785 0.494 0.593 0.817 0.554 0.715 0.521 0.818 0 of 24VINYL ACETATE 0.381 0.321 0.346 0.33 0.425 0.486 0.785 0.494 0.593 0.817 0.554 0.715 0.521 0.818 0 of 24VINYL CHLORIDE 0.381 0.321 0.346 0.33 0.425 0.486 0.785 0.494 0.593 0.817 0.554 0.715 0.521 0.818 0 of 24
Notes~: No data or no samples takenResults in bold indicate one or more detects that monthYearly averages are calculated from individual results collected during the fiscal year.Non-detected compounds are assumed to equal one half of the detection limit for metals and inorganics and one tenth of the reporting limit for organic compounds.
Table A-7. Deer Island Influent Loadings (South System), FY03 (cont.)
A-38

Metals (ug/L) TimesJul Aug Sep Oct Nov Dec Jan Feb Mar Apr May Jun Average Maximum Detected
ARSENIC 0.4 0.4 ~ 0.4 0.4 0.4 0.4 0.4 0.4 0.4 0.4 0.4 0.4 0.4 0 of 23COPPER 13.6 21.4 14.8 13.5 10.7 12.4 13 16.9 18.3 12.3 10.7 9.06 13.9 39.6 106 of 125LEAD ~ ~ ~ ~ ~ ~ 1.54 1.73 2.3 1.71 1.02 1.44 1.63 2.3 6 of 6MERCURY 0.0125 0.0387 0.0635 0.0306 0.0197 0.021 0.0244 0.0345 0.038 0.0175 0.0138 0.0164 0.0258 0.106 103 of 110
Cyanide (ug/L) TimesJul Aug Sep Oct Nov Dec Jan Feb Mar Apr May Jun Average Maximum Detected
CYANIDE 5 5 5 5 5 5 5 5 5 5 5 5 5 5 0 of 22
Organochlorine Pesticides and PCBs (ug/L) TimesJul Aug Sep Oct Nov Dec Jan Feb Mar Apr May Jun Average Maximum Detected
4,4'-DDD 0.00217 0.00216 0.00207 0.00208 0.00212 0.00217 0.00207 0.00211 0.0022 0.00211 0.00205 0.00216 0.00212 0.00235 0 of 234,4'-DDE 0.00217 0.00216 0.00207 0.00208 0.00212 0.00686 0.00207 0.00211 0.0022 0.00211 0.00205 0.00216 0.00249 0.0115 1 of 234,4'-DDT 0.00217 0.00216 0.00207 0.00208 0.00212 0.00217 0.00207 0.00211 0.0022 0.00211 0.00205 0.00216 0.00212 0.00235 0 of 23ALDRIN 0.00217 0.00216 0.00207 0.00208 0.00212 0.00217 0.00207 0.00211 0.0022 0.00211 0.00205 0.00216 0.00212 0.00235 0 of 23ALPHA-BHC 0.00217 0.00216 0.00207 0.00208 0.00212 0.00217 0.00207 0.00211 0.0022 0.00211 0.00205 0.00216 0.00212 0.00235 0 of 23ALPHA-CHLORDANE 0.00217 0.00216 0.00207 0.00208 0.00212 0.00217 0.00207 0.00211 0.0022 0.00211 0.00205 0.00216 0.00212 0.00235 0 of 23AROCLOR-1016 0.0543 0.0541 0.0518 0.0521 0.053 0.0542 0.0516 0.0526 0.0549 0.0527 0.0513 0.0539 0.0531 0.0588 0 of 23AROCLOR-1221 0.109 0.108 0.104 0.104 0.106 0.108 0.103 0.105 0.11 0.105 0.103 0.108 0.106 0.118 0 of 23AROCLOR-1232 0.0543 0.0541 0.0518 0.0521 0.053 0.0542 0.0516 0.0526 0.0549 0.0527 0.0513 0.0539 0.0531 0.0588 0 of 23AROCLOR-1242 0.0543 0.0541 0.0518 0.0521 0.053 0.0542 0.0516 0.0526 0.0549 0.0527 0.0513 0.0539 0.0531 0.0588 0 of 23AROCLOR-1248 0.0543 0.0541 0.0518 0.0521 0.053 0.0542 0.0516 0.0526 0.0549 0.0527 0.0513 0.0539 0.0531 0.0588 0 of 23AROCLOR-1254 0.0543 0.0541 0.0518 0.0521 0.053 0.0542 0.0516 0.0526 0.0549 0.0527 0.0513 0.0539 0.0531 0.0588 0 of 23AROCLOR-1260 0.0543 0.0541 0.0518 0.0521 0.053 0.0542 0.0516 0.0526 0.0549 0.0527 0.0513 0.0539 0.0531 0.0588 0 of 23BETA-BHC 0.00217 0.00216 0.00207 0.00208 0.00212 0.00217 0.00207 0.00211 0.0022 0.00211 0.00205 0.00216 0.00212 0.00235 0 of 23CHLORDANE (TECHNICAL) 0.0543 0.0541 0.0518 0.0521 0.053 0.0542 0.0516 0.0526 0.0549 0.0527 0.0513 0.0539 0.0531 0.0588 0 of 23DELTA-BHC 0.00217 0.00216 0.00207 0.00208 0.00212 0.00217 0.00207 0.00211 0.0022 0.00211 0.00205 0.00216 0.00212 0.00235 0 of 23DIELDRIN 0.00217 0.00216 0.00207 0.00208 0.00212 0.00217 0.00207 0.00211 0.0022 0.00211 0.00205 0.00216 0.00212 0.00235 0 of 23ENDOSULFAN I 0.00217 0.00216 0.00207 0.00208 0.00212 0.00217 0.00207 0.00211 0.0022 0.00211 0.00205 0.00216 0.00212 0.00235 0 of 23ENDOSULFAN II 0.00217 0.00216 0.00207 0.00208 0.00212 0.00217 0.00207 0.00211 0.0022 0.00211 0.00205 0.00216 0.00212 0.00235 0 of 23ENDOSULFAN SULFATE 0.00217 0.00216 0.00207 0.00208 0.00212 0.00217 0.00207 0.00211 0.0022 0.00211 0.00205 0.00216 0.00212 0.00235 0 of 23ENDRIN 0.00217 0.00216 0.00207 0.00208 0.00212 0.00217 0.00207 0.00211 0.0022 0.00211 0.00205 0.00216 0.00212 0.00235 0 of 23ENDRIN ALDEHYDE 0.00217 0.00216 0.00207 0.00208 0.00212 0.00217 0.00207 0.00211 0.0022 0.00211 0.00205 0.00216 0.00212 0.00235 0 of 23ENDRIN KETONE 0.00217 0.00216 0.00207 0.00208 0.00212 0.00217 0.00207 0.00211 0.0022 0.00211 0.00205 0.00216 0.00212 0.00235 0 of 23GAMMA-BHC (LINDANE) 0.00217 0.00216 0.00207 0.00208 0.00212 0.00217 0.00207 0.00211 0.0022 0.00211 0.00205 0.00216 0.00212 0.00235 0 of 23GAMMA-CHLORDANE 0.00217 0.00216 0.00207 0.00208 0.00212 0.00217 0.00207 0.00211 0.0022 0.00211 0.00205 0.00216 0.00212 0.00235 0 of 23HEPTACHLOR 0.00217 0.00216 0.00207 0.00208 0.00212 0.00217 0.00207 0.00211 0.0022 0.00211 0.00205 0.00216 0.00212 0.00235 0 of 23HEPTACHLOR EPOXIDE 0.00217 0.00216 0.00207 0.00208 0.00212 0.00217 0.00207 0.00211 0.0022 0.00211 0.00205 0.00216 0.00212 0.00235 0 of 23HEXACHLOROBENZENE 0.00217 0.00216 0.00207 0.00208 0.00212 0.00217 0.00207 0.00211 0.0022 0.00211 0.00205 0.00216 0.00212 0.00235 0 of 23METHOXYCHLOR 0.0217 0.0216 0.0207 0.0208 0.0212 0.0217 0.0207 0.0211 0.022 0.0211 0.0205 0.0216 0.0212 0.0235 0 of 23TOXAPHENE 0.0543 0.0541 0.0518 0.0521 0.053 0.0542 0.0516 0.0526 0.0549 0.0527 0.0513 0.0539 0.0531 0.0588 0 of 23
Table A-8. Deer Island Effluent Characterization, FY03
A-39

Volatile Organics (ug/L) TimesJul Aug Sep Oct Nov Dec Jan Feb Mar Apr May Jun Average Maximum Detected
1,1,1-TRICHLOROETHANE 0.5 0.5 0.5 0.5 0.5 0.5 0.5 0.5 0.5 0.5 0.5 0.5 0.5 0.5 0 of 241,1,2,2-TETRACHLOROETHANE 0.5 0.5 0.5 0.5 0.5 0.5 0.5 0.5 0.5 0.5 0.5 0.5 0.5 0.5 0 of 241,1,2-TRICHLOROETHANE 0.5 0.5 0.5 0.5 0.5 0.5 0.5 0.5 0.5 0.5 0.5 0.5 0.5 0.5 0 of 241,1-DICHLOROETHANE 0.5 0.5 0.5 0.5 0.5 0.5 0.5 0.5 0.5 0.5 0.5 0.5 0.5 0.5 0 of 241,1-DICHLOROETHENE 0.5 0.5 0.5 0.5 0.5 0.5 0.5 0.5 0.5 0.5 0.5 0.5 0.5 0.5 0 of 241,2-DICHLOROBENZENE 0.5 0.5 0.5 0.5 0.5 0.5 0.5 0.5 0.5 0.5 0.5 0.5 0.5 0.5 0 of 241,2-DICHLOROETHANE 0.5 0.5 0.5 0.5 0.5 0.5 0.5 0.5 0.5 0.5 0.5 0.5 0.5 0.5 0 of 241,2-DICHLOROPROPANE 0.5 0.5 0.5 0.5 0.5 0.5 0.5 0.5 0.5 0.5 0.5 0.5 0.5 0.5 0 of 241,3-DICHLOROBENZENE 0.5 0.5 0.5 0.5 0.5 0.5 0.5 0.5 0.5 0.5 0.5 0.5 0.5 0.5 0 of 241,4-DICHLOROBENZENE 1.57 0.5 0.5 1.55 0.5 0.5 0.5 0.5 0.5 0.5 0.5 0.5 0.633 2.62 2 of 242-BUTANONE 0.5 0.5 0.5 0.5 0.5 0.5 0.5 0.5 0.5 0.5 0.5 0.5 0.5 0.5 0 of 242-CHLOROETHYL VINYL ETHER 0.5 0.5 0.5 0.5 0.5 0.5 0.5 0.5 0.5 0.5 0.5 0.5 0.5 0.5 0 of 242-HEXANONE 0.5 0.5 0.5 0.5 0.5 0.5 0.5 0.5 0.5 0.5 0.5 0.5 0.5 0.5 0 of 244-METHYL-2-PENTANONE 0.5 0.5 0.5 0.5 0.5 0.5 0.5 0.5 0.5 0.5 0.5 0.5 0.5 0.5 0 of 24ACETONE 7.37 7.45 15.3 13.7 61.5 2.65 5.46 9.82 8.45 5.91 4.64 4.18 11.8 77.1 21 of 24ACROLEIN 0.5 0.5 0.5 0.5 0.5 0.5 0.5 1 1 1 1 1 0.741 1 0 of 24ACRYLONITRILE 0.5 0.5 0.5 0.5 0.5 0.5 0.5 1 1 1 1 1 0.741 1 0 of 24BENZENE 0.5 0.5 0.5 0.5 0.5 0.5 0.5 0.5 0.5 0.5 0.5 0.5 0.5 0.5 0 of 24BROMODICHLOROMETHANE 0.5 0.5 0.5 0.5 0.5 0.5 0.5 0.5 0.5 0.5 0.5 0.5 0.5 0.5 0 of 24BROMOFORM 0.5 0.5 0.5 0.5 0.5 0.5 0.5 0.5 0.5 0.5 0.5 0.5 0.5 0.5 0 of 24BROMOMETHANE 0.5 0.5 0.5 0.5 0.5 0.5 0.5 0.5 0.5 0.5 0.5 0.5 0.5 0.5 0 of 24CARBON DISULFIDE 0.5 0.5 0.5 0.5 0.5 0.5 0.5 0.5 0.5 0.5 0.5 0.5 0.5 0.5 0 of 24CARBON TETRACHLORIDE 0.5 0.5 0.5 0.5 0.5 0.5 0.5 0.5 0.5 0.5 0.5 0.5 0.5 0.5 0 of 24CHLOROBENZENE 0.5 0.5 0.5 0.5 0.5 0.5 0.5 0.5 0.5 0.5 0.5 0.5 0.5 0.5 0 of 24CHLOROETHANE 0.5 0.5 0.5 0.5 0.5 0.5 0.5 0.5 0.5 0.5 0.5 0.5 0.5 0.5 0 of 24CHLOROFORM 7.23 8.19 6.29 6.28 4.97 3.75 3.64 5.67 5.9 5.04 8.4 7.59 5.93 8.99 24 of 24CHLOROMETHANE 0.5 0.5 0.5 0.5 0.5 0.5 0.5 0.5 0.5 0.5 0.5 0.5 0.5 0.5 0 of 24CIS-1,2-DICHLOROETHENE 0.5 0.5 0.5 0.5 0.5 0.5 0.5 0.5 0.5 0.5 0.5 0.5 0.5 0.5 0 of 24CIS-1,3-DICHLOROPROPENE 0.5 0.5 0.5 0.5 0.5 0.5 0.5 0.5 0.5 0.5 0.5 0.5 0.5 0.5 0 of 24DIBROMOCHLOROMETHANE 0.5 0.5 0.5 0.5 0.5 0.5 0.5 0.5 0.5 0.5 0.5 0.5 0.5 0.5 0 of 24ETHYLBENZENE 0.5 0.5 0.5 0.5 0.5 0.5 0.5 0.5 0.5 0.5 0.5 0.5 0.5 0.5 0 of 24M,P-XYLENE 0.5 0.5 0.5 0.5 0.5 0.5 0.5 1 1 1 1 1 0.741 1 0 of 24METHYLENE CHLORIDE 2.14 2.98 3.39 2.19 0.5 0.5 0.5 1.68 0.5 0.5 0.5 0.5 1.13 3.94 7 of 24O-XYLENE 0.5 0.5 0.5 0.5 0.5 0.5 0.5 0.5 0.5 0.5 0.5 0.5 0.5 0.5 0 of 24STYRENE 0.5 0.5 0.5 0.5 0.5 0.5 0.5 0.5 0.5 0.5 0.5 0.5 0.5 0.5 0 of 24TETRACHLOROETHENE 2.53 1.78 2.77 3.43 1.81 2.08 3.65 12.2 6.17 3.45 4.6 1.58 3.91 19.3 17 of 24TOLUENE 0.5 0.5 0.5 0.5 3.67 0.5 0.5 0.5 0.5 0.5 0.5 0.5 0.767 5.72 1 of 24TRANS-1,2-DICHLOROETHENE 0.5 0.5 0.5 0.5 0.5 0.5 0.5 0.5 0.5 0.5 0.5 0.5 0.5 0.5 0 of 24TRANS-1,3-DICHLOROPROPENE 0.5 0.5 0.5 0.5 0.5 0.5 0.5 0.5 0.5 0.5 0.5 0.5 0.5 0.5 0 of 24TRICHLOROETHENE 0.5 0.5 0.5 0.5 0.5 0.5 0.5 0.5 0.5 0.5 0.5 0.5 0.5 0.5 0 of 24TRICHLOROFLUOROMETHANE 0.5 0.5 0.5 0.5 0.5 0.5 0.5 0.5 0.5 0.5 0.5 0.5 0.5 0.5 0 of 24VINYL ACETATE 0.5 0.5 0.5 0.5 0.5 0.5 0.5 0.5 0.5 0.5 0.5 0.5 0.5 0.5 0 of 24VINYL CHLORIDE 0.5 0.5 0.5 0.5 0.5 0.5 0.5 0.5 0.5 0.5 0.5 0.5 0.5 0.5 0 of 24
NotesMany of the compounds previously found in this Appendix have moved to the low-detection limit studies found in Appendix A-10.~: No data or no samples takenResults in bold indicate one or more detects that monthYearly averages are calculated from individual results collected during the fiscal year.Non-detected compounds are assumed to equal one half of the detection limit for metals and inorganics and one tenth of the reporting limit for organic compounds.
Table A-8. Deer Island Effluent Characterization, FY03 (cont.)
A-40

Metals (lbs/day) TimesJul Aug Sep Oct Nov Dec Jan Feb Mar Apr May Jun Average Maximum Detected
ARSENIC 1.02 0.854 ~ 0.874 1.04 1.13 1.71 1.2 1.45 1.73 1.23 1.61 1.25 1.75 0 of 23COPPER 32.9 49.4 37.2 30.4 33.1 42.8 47.8 55.6 74.7 49.1 33.3 33.7 43.7 118 106 of 125LEAD ~ ~ ~ ~ ~ ~ 6.44 5.43 7.95 7.38 3.12 5.48 5.97 7.95 6 of 6MERCURY 0.0303 0.0894 0.159 0.0688 0.061 0.0723 0.0899 0.114 0.155 0.0698 0.0428 0.0611 0.0812 0.367 103 of 110
Cyanide and Phenols (lbs/day) TimesJul Aug Sep Oct Nov Dec Jan Feb Mar Apr May Jun Average Maximum Detected
CYANIDE 12.1 10.9 11.3 11.2 15.5 14.2 20.9 14.9 18.1 21.6 15.2 18.9 15.3 21.6 0 of 22
Organochlorine Pesticides and PCBs (lbs/day) TimesJul Aug Sep Oct Nov Dec Jan Feb Mar Apr May Jun Average Maximum Detected
4,4'-DDD 0.00586 0.00462 0.00465 0.00454 0.00553 0.00613 0.00884 0.00633 0.00796 0.00909 0.00632 0.00867 0.00663 0.00974 0 of 234,4'-DDE 0.00586 0.00462 0.00465 0.00454 0.00553 0.0194 0.00884 0.00633 0.00796 0.00909 0.00632 0.00867 0.00779 0.0325 1 of 234,4'-DDT 0.00586 0.00462 0.00465 0.00454 0.00553 0.00613 0.00884 0.00633 0.00796 0.00909 0.00632 0.00867 0.00663 0.00974 0 of 23ALDRIN 0.00586 0.00462 0.00465 0.00454 0.00553 0.00613 0.00884 0.00633 0.00796 0.00909 0.00632 0.00867 0.00663 0.00974 0 of 23ALPHA-BHC 0.00586 0.00462 0.00465 0.00454 0.00553 0.00613 0.00884 0.00633 0.00796 0.00909 0.00632 0.00867 0.00663 0.00974 0 of 23ALPHA-CHLORDANE 0.00586 0.00462 0.00465 0.00454 0.00553 0.00613 0.00884 0.00633 0.00796 0.00909 0.00632 0.00867 0.00663 0.00974 0 of 23AROCLOR-1016 0.147 0.116 0.116 0.114 0.138 0.153 0.221 0.158 0.199 0.227 0.158 0.217 0.166 0.243 0 of 23AROCLOR-1221 0.294 0.231 0.232 0.227 0.276 0.306 0.441 0.316 0.398 0.453 0.316 0.434 0.331 0.487 0 of 23AROCLOR-1232 0.147 0.116 0.116 0.114 0.138 0.153 0.221 0.158 0.199 0.227 0.158 0.217 0.166 0.243 0 of 23AROCLOR-1242 0.147 0.116 0.116 0.114 0.138 0.153 0.221 0.158 0.199 0.227 0.158 0.217 0.166 0.243 0 of 23AROCLOR-1248 0.147 0.116 0.116 0.114 0.138 0.153 0.221 0.158 0.199 0.227 0.158 0.217 0.166 0.243 0 of 23AROCLOR-1254 0.147 0.116 0.116 0.114 0.138 0.153 0.221 0.158 0.199 0.227 0.158 0.217 0.166 0.243 0 of 23AROCLOR-1260 0.147 0.116 0.116 0.114 0.138 0.153 0.221 0.158 0.199 0.227 0.158 0.217 0.166 0.243 0 of 23BETA-BHC 0.00586 0.00462 0.00465 0.00454 0.00553 0.00613 0.00884 0.00633 0.00796 0.00909 0.00632 0.00867 0.00663 0.00974 0 of 23CHLORDANE (TECHNICAL) 0.147 0.116 0.116 0.114 0.138 0.153 0.221 0.158 0.199 0.227 0.158 0.217 0.166 0.243 0 of 23DELTA-BHC 0.00586 0.00462 0.00465 0.00454 0.00553 0.00613 0.00884 0.00633 0.00796 0.00909 0.00632 0.00867 0.00663 0.00974 0 of 23DIELDRIN 0.00586 0.00462 0.00465 0.00454 0.00553 0.00613 0.00884 0.00633 0.00796 0.00909 0.00632 0.00867 0.00663 0.00974 0 of 23ENDOSULFAN I 0.00586 0.00462 0.00465 0.00454 0.00553 0.00613 0.00884 0.00633 0.00796 0.00909 0.00632 0.00867 0.00663 0.00974 0 of 23ENDOSULFAN II 0.00586 0.00462 0.00465 0.00454 0.00553 0.00613 0.00884 0.00633 0.00796 0.00909 0.00632 0.00867 0.00663 0.00974 0 of 23ENDOSULFAN SULFATE 0.00586 0.00462 0.00465 0.00454 0.00553 0.00613 0.00884 0.00633 0.00796 0.00909 0.00632 0.00867 0.00663 0.00974 0 of 23ENDRIN 0.00586 0.00462 0.00465 0.00454 0.00553 0.00613 0.00884 0.00633 0.00796 0.00909 0.00632 0.00867 0.00663 0.00974 0 of 23ENDRIN ALDEHYDE 0.00586 0.00462 0.00465 0.00454 0.00553 0.00613 0.00884 0.00633 0.00796 0.00909 0.00632 0.00867 0.00663 0.00974 0 of 23ENDRIN KETONE 0.00586 0.00462 0.00465 0.00454 0.00553 0.00613 0.00884 0.00633 0.00796 0.00909 0.00632 0.00867 0.00663 0.00974 0 of 23GAMMA-BHC (LINDANE) 0.00586 0.00462 0.00465 0.00454 0.00553 0.00613 0.00884 0.00633 0.00796 0.00909 0.00632 0.00867 0.00663 0.00974 0 of 23GAMMA-CHLORDANE 0.00586 0.00462 0.00465 0.00454 0.00553 0.00613 0.00884 0.00633 0.00796 0.00909 0.00632 0.00867 0.00663 0.00974 0 of 23HEPTACHLOR 0.00586 0.00462 0.00465 0.00454 0.00553 0.00613 0.00884 0.00633 0.00796 0.00909 0.00632 0.00867 0.00663 0.00974 0 of 23HEPTACHLOR EPOXIDE 0.00586 0.00462 0.00465 0.00454 0.00553 0.00613 0.00884 0.00633 0.00796 0.00909 0.00632 0.00867 0.00663 0.00974 0 of 23HEXACHLOROBENZENE 0.00586 0.00462 0.00465 0.00454 0.00553 0.00613 0.00884 0.00633 0.00796 0.00909 0.00632 0.00867 0.00663 0.00974 0 of 23METHOXYCHLOR 0.0586 0.0462 0.0465 0.0454 0.0553 0.0613 0.0884 0.0633 0.0796 0.0909 0.0632 0.0867 0.0663 0.0974 0 of 23TOXAPHENE 0.147 0.116 0.116 0.114 0.138 0.153 0.221 0.158 0.199 0.227 0.158 0.217 0.166 0.243 0 of 23
Table A-9. Deer Island Effluent Loadings, FY03
A-41
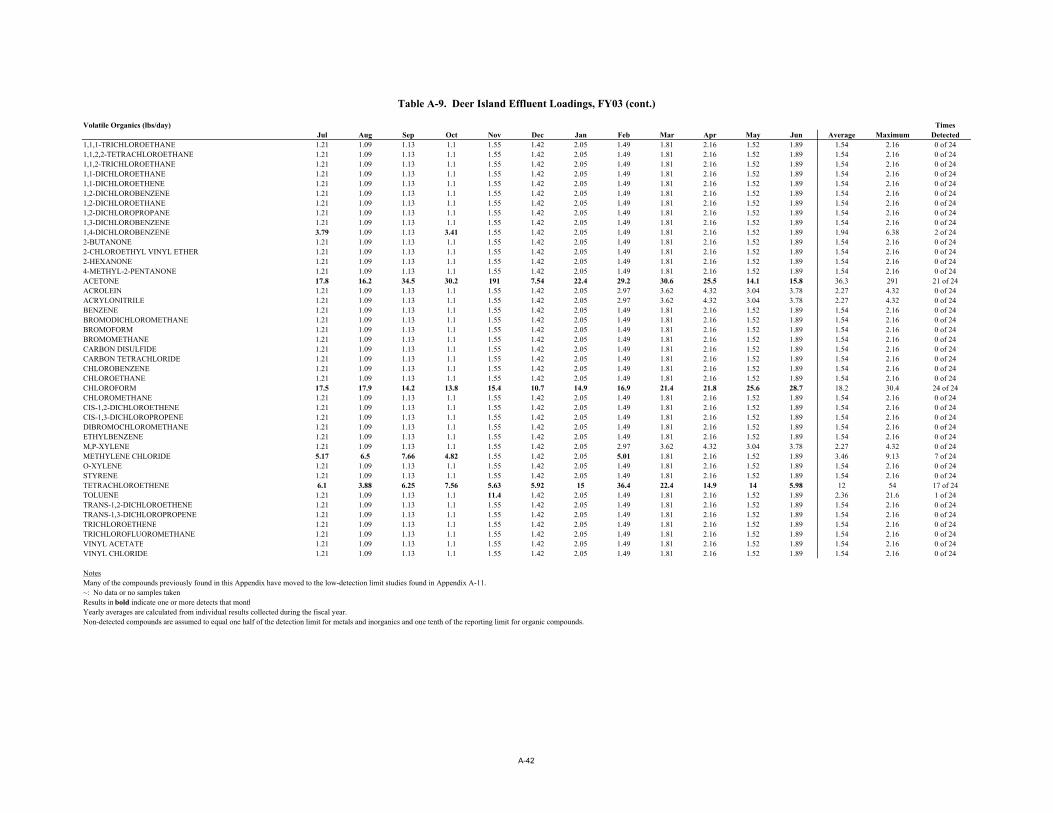
Volatile Organics (lbs/day) TimesJul Aug Sep Oct Nov Dec Jan Feb Mar Apr May Jun Average Maximum Detected
1,1,1-TRICHLOROETHANE 1.21 1.09 1.13 1.1 1.55 1.42 2.05 1.49 1.81 2.16 1.52 1.89 1.54 2.16 0 of 241,1,2,2-TETRACHLOROETHANE 1.21 1.09 1.13 1.1 1.55 1.42 2.05 1.49 1.81 2.16 1.52 1.89 1.54 2.16 0 of 241,1,2-TRICHLOROETHANE 1.21 1.09 1.13 1.1 1.55 1.42 2.05 1.49 1.81 2.16 1.52 1.89 1.54 2.16 0 of 241,1-DICHLOROETHANE 1.21 1.09 1.13 1.1 1.55 1.42 2.05 1.49 1.81 2.16 1.52 1.89 1.54 2.16 0 of 241,1-DICHLOROETHENE 1.21 1.09 1.13 1.1 1.55 1.42 2.05 1.49 1.81 2.16 1.52 1.89 1.54 2.16 0 of 241,2-DICHLOROBENZENE 1.21 1.09 1.13 1.1 1.55 1.42 2.05 1.49 1.81 2.16 1.52 1.89 1.54 2.16 0 of 241,2-DICHLOROETHANE 1.21 1.09 1.13 1.1 1.55 1.42 2.05 1.49 1.81 2.16 1.52 1.89 1.54 2.16 0 of 241,2-DICHLOROPROPANE 1.21 1.09 1.13 1.1 1.55 1.42 2.05 1.49 1.81 2.16 1.52 1.89 1.54 2.16 0 of 241,3-DICHLOROBENZENE 1.21 1.09 1.13 1.1 1.55 1.42 2.05 1.49 1.81 2.16 1.52 1.89 1.54 2.16 0 of 241,4-DICHLOROBENZENE 3.79 1.09 1.13 3.41 1.55 1.42 2.05 1.49 1.81 2.16 1.52 1.89 1.94 6.38 2 of 242-BUTANONE 1.21 1.09 1.13 1.1 1.55 1.42 2.05 1.49 1.81 2.16 1.52 1.89 1.54 2.16 0 of 242-CHLOROETHYL VINYL ETHER 1.21 1.09 1.13 1.1 1.55 1.42 2.05 1.49 1.81 2.16 1.52 1.89 1.54 2.16 0 of 242-HEXANONE 1.21 1.09 1.13 1.1 1.55 1.42 2.05 1.49 1.81 2.16 1.52 1.89 1.54 2.16 0 of 244-METHYL-2-PENTANONE 1.21 1.09 1.13 1.1 1.55 1.42 2.05 1.49 1.81 2.16 1.52 1.89 1.54 2.16 0 of 24ACETONE 17.8 16.2 34.5 30.2 191 7.54 22.4 29.2 30.6 25.5 14.1 15.8 36.3 291 21 of 24ACROLEIN 1.21 1.09 1.13 1.1 1.55 1.42 2.05 2.97 3.62 4.32 3.04 3.78 2.27 4.32 0 of 24ACRYLONITRILE 1.21 1.09 1.13 1.1 1.55 1.42 2.05 2.97 3.62 4.32 3.04 3.78 2.27 4.32 0 of 24BENZENE 1.21 1.09 1.13 1.1 1.55 1.42 2.05 1.49 1.81 2.16 1.52 1.89 1.54 2.16 0 of 24BROMODICHLOROMETHANE 1.21 1.09 1.13 1.1 1.55 1.42 2.05 1.49 1.81 2.16 1.52 1.89 1.54 2.16 0 of 24BROMOFORM 1.21 1.09 1.13 1.1 1.55 1.42 2.05 1.49 1.81 2.16 1.52 1.89 1.54 2.16 0 of 24BROMOMETHANE 1.21 1.09 1.13 1.1 1.55 1.42 2.05 1.49 1.81 2.16 1.52 1.89 1.54 2.16 0 of 24CARBON DISULFIDE 1.21 1.09 1.13 1.1 1.55 1.42 2.05 1.49 1.81 2.16 1.52 1.89 1.54 2.16 0 of 24CARBON TETRACHLORIDE 1.21 1.09 1.13 1.1 1.55 1.42 2.05 1.49 1.81 2.16 1.52 1.89 1.54 2.16 0 of 24CHLOROBENZENE 1.21 1.09 1.13 1.1 1.55 1.42 2.05 1.49 1.81 2.16 1.52 1.89 1.54 2.16 0 of 24CHLOROETHANE 1.21 1.09 1.13 1.1 1.55 1.42 2.05 1.49 1.81 2.16 1.52 1.89 1.54 2.16 0 of 24CHLOROFORM 17.5 17.9 14.2 13.8 15.4 10.7 14.9 16.9 21.4 21.8 25.6 28.7 18.2 30.4 24 of 24CHLOROMETHANE 1.21 1.09 1.13 1.1 1.55 1.42 2.05 1.49 1.81 2.16 1.52 1.89 1.54 2.16 0 of 24CIS-1,2-DICHLOROETHENE 1.21 1.09 1.13 1.1 1.55 1.42 2.05 1.49 1.81 2.16 1.52 1.89 1.54 2.16 0 of 24CIS-1,3-DICHLOROPROPENE 1.21 1.09 1.13 1.1 1.55 1.42 2.05 1.49 1.81 2.16 1.52 1.89 1.54 2.16 0 of 24DIBROMOCHLOROMETHANE 1.21 1.09 1.13 1.1 1.55 1.42 2.05 1.49 1.81 2.16 1.52 1.89 1.54 2.16 0 of 24ETHYLBENZENE 1.21 1.09 1.13 1.1 1.55 1.42 2.05 1.49 1.81 2.16 1.52 1.89 1.54 2.16 0 of 24M,P-XYLENE 1.21 1.09 1.13 1.1 1.55 1.42 2.05 2.97 3.62 4.32 3.04 3.78 2.27 4.32 0 of 24METHYLENE CHLORIDE 5.17 6.5 7.66 4.82 1.55 1.42 2.05 5.01 1.81 2.16 1.52 1.89 3.46 9.13 7 of 24O-XYLENE 1.21 1.09 1.13 1.1 1.55 1.42 2.05 1.49 1.81 2.16 1.52 1.89 1.54 2.16 0 of 24STYRENE 1.21 1.09 1.13 1.1 1.55 1.42 2.05 1.49 1.81 2.16 1.52 1.89 1.54 2.16 0 of 24TETRACHLOROETHENE 6.1 3.88 6.25 7.56 5.63 5.92 15 36.4 22.4 14.9 14 5.98 12 54 17 of 24TOLUENE 1.21 1.09 1.13 1.1 11.4 1.42 2.05 1.49 1.81 2.16 1.52 1.89 2.36 21.6 1 of 24TRANS-1,2-DICHLOROETHENE 1.21 1.09 1.13 1.1 1.55 1.42 2.05 1.49 1.81 2.16 1.52 1.89 1.54 2.16 0 of 24TRANS-1,3-DICHLOROPROPENE 1.21 1.09 1.13 1.1 1.55 1.42 2.05 1.49 1.81 2.16 1.52 1.89 1.54 2.16 0 of 24TRICHLOROETHENE 1.21 1.09 1.13 1.1 1.55 1.42 2.05 1.49 1.81 2.16 1.52 1.89 1.54 2.16 0 of 24TRICHLOROFLUOROMETHANE 1.21 1.09 1.13 1.1 1.55 1.42 2.05 1.49 1.81 2.16 1.52 1.89 1.54 2.16 0 of 24VINYL ACETATE 1.21 1.09 1.13 1.1 1.55 1.42 2.05 1.49 1.81 2.16 1.52 1.89 1.54 2.16 0 of 24VINYL CHLORIDE 1.21 1.09 1.13 1.1 1.55 1.42 2.05 1.49 1.81 2.16 1.52 1.89 1.54 2.16 0 of 24
NotesMany of the compounds previously found in this Appendix have moved to the low-detection limit studies found in Appendix A-11.~: No data or no samples takenResults in bold indicate one or more detects that monthYearly averages are calculated from individual results collected during the fiscal year.Non-detected compounds are assumed to equal one half of the detection limit for metals and inorganics and one tenth of the reporting limit for organic compounds.
Table A-9. Deer Island Effluent Loadings, FY03 (cont.)
A-42

Metals (ug/L) TimesJul Aug Sep Oct Nov Dec Jan Feb Mar Apr May Jun Average Maximum Detected
ANTIMONY 10 7.5 ~ 7.5 10 10 10 8.69 8.81 7.5 7.5 10 8.95 10 0 of 23BERYLLIUM 0.25 0.25 ~ 0.25 0.25 0.25 0.25 0.25 0.25 0.25 0.25 0.25 0.25 0.25 0 of 23BORON 309 200 ~ 384 336 296 125 191 286 125 125 125 215 432 12 of 23CADMIUM 0.042 0.0946 0.0438 0.0391 0.0537 0.0974 0.108 0.101 0.181 0.153 0.121 0.139 0.109 0.241 74 of 86CHROMIUM 0.894 1.41 0.981 1.02 0.964 4 1.24 1.8 1.74 0.732 0.435 0.999 1.29 8.11 73 of 86COPPER ~ ~ ~ ~ 13.3 ~ ~ ~ ~ ~ ~ ~ 13.3 13.3 1 of 1HEXAVALENT CHROMIUM 2.5 2.5 2.5 2.5 2.5 2.5 2.5 2.5 2.5 2.5 2.5 2.5 2.5 2.5 0 of 24IRON 357 357 ~ 451 460 205 437 418 440 413 230 264 367 572 23 of 23LEAD 1.2 2.06 1.2 1.2 1.2 1.91 1.2 2.03 3.2 1.2 1.2 1.7 1.7 7.82 11 of 87MOLYBDENUM 10.7 10.2 8.84 9.45 7.54 7.18 7.62 6.97 6.64 7.93 10.4 8.73 8.5 18.8 65 of 65NICKEL 3.46 3.95 3.44 2.94 3.31 2.99 3.15 2.96 3.05 3.09 2.9 2.65 3.14 5.85 87 of 87SELENIUM 0.45 0.45 ~ 0.45 0.45 0.45 0.45 0.45 0.45 0.45 0.45 0.45 0.45 0.45 0 of 23SILVER 0.301 0.874 0.544 0.489 0.448 0.424 0.585 0.523 0.51 0.426 0.407 0.365 0.498 4.21 85 of 86THALLIUM 0.5 0.5 ~ 0.5 0.5 0.5 0.5 0.5 0.5 0.5 0.5 0.5 0.5 0.5 0 of 23ZINC 22.7 39.2 30.8 24.2 22.3 30.3 40.7 43.2 50.5 34.2 25 28 34 81.9 86 of 86
Phenols (ug/L) TimesJul Aug Sep Oct Nov Dec Jan Feb Mar Apr May Jun Average Maximum Detected
PHENOL 1 1 20.2 ~ 1 1 ~ ~ ~ ~ ~ ~ 4.44 29.8 2 of 10
Oil and Grease, Surfactants, and Petroleum Hydrocarbons (mg/L) TimesJul Aug Sep Oct Nov Dec Jan Feb Mar Apr May Jun Average Maximum Detected
FATS OIL AND GREASE 0.7 0.7 0.7 0.7 3.55 2.88 0.7 0.7 0.7 0.7 0.7 0.7 1.22 13 3 of 66MBAS 0.372 0.821 0.47 0.528 0.52 0.19 0.286 0.362 0.544 0.163 0.23 0.383 0.384 1.7 41 of 41PETROLEUM HYDROCARBON 0.032 0.125 0.0993 0.049 0.0884 0.158 0.087 0.173 0.127 0.0648 0.151 0.0198 0.102 0.49 35 of 66
Organochlorine Pesticides and PCBs (ug/L) TimesJul Aug Sep Oct Nov Dec Jan Feb Mar Apr May Jun Average Maximum Detected
2,4'-DDD 0.000115 0.000113 0.000113 0.000111 0.00012 0.000116 0.000115 0.000103 0.000115 0.000111 0.000106 0.0000932 0.000111 0.000154 0 of 752,4'-DDE 0.000115 0.000113 0.000113 0.00013 0.00012 0.000116 0.000115 0.000103 0.000115 0.000111 0.000106 0.0000932 0.000112 0.00021 1 of 752,4'-DDT 0.000115 0.000113 0.000113 0.000111 0.00012 0.000116 0.000115 0.000103 0.000115 0.000111 0.000106 0.0000932 0.000111 0.000154 0 of 754,4'-DDD 0.000156 0.000218 0.000284 0.000146 0.00012 0.00048 0.00021 0.000187 0.000296 0.000203 0.000191 0.000296 0.00023 0.00084 43 of 754,4'-DDE 0.000512 0.00101 0.000539 0.000639 0.000335 0.00051 0.000274 0.000515 0.00059 0.000366 0.000389 0.000232 0.000501 0.00367 59 of 754,4'-DDT 0.000115 0.000113 0.000113 0.00025 0.000276 0.000116 0.000615 0.000294 0.000356 0.00032 0.00029 0.000185 0.00026 0.00174 22 of 75ALDRIN 0.000115 0.000113 0.000113 0.000111 0.00012 0.000116 0.000115 0.000103 0.000115 0.000111 0.000106 0.0000932 0.000111 0.000154 0 of 75ALPHA-CHLORDANE 0.00112 0.002 0.000722 0.00101 0.000848 0.00161 0.00137 0.00096 0.00164 0.00139 0.00106 0.00109 0.00127 0.00447 74 of 75DDMU 0.000115 0.000113 0.000113 0.000111 0.00012 0.000116 0.000115 0.000103 0.000115 0.000111 0.000106 0.0000932 0.000111 0.000154 0 of 75DIELDRIN 9.6E-05 0.000113 0.000113 0.000111 0.00012 0.000116 0.000115 0.000103 0.000297 0.000111 0.000106 0.0000932 0.000131 0.00075 2 of 75ENDRIN 0.000115 0.000113 0.000113 0.000111 0.00012 0.000116 0.000115 0.000103 0.000115 0.000111 0.000106 0.0000932 0.000111 0.000154 0 of 75GAMMA-BHC (LINDANE) 0.00269 0.00382 0.00217 0.00288 0.00157 0.00121 0.0014 0.00145 0.00095 0.000942 0.00133 0.000433 0.00173 0.00866 63 of 75GAMMA-CHLORDANE 0.00138 0.00243 0.000829 0.00134 0.00109 0.00218 0.00113 0.00102 0.00139 0.00121 0.00113 0.000975 0.00135 0.00548 75 of 75HEPTACHLOR 0.000115 0.00369 0.000113 0.000111 0.00012 0.000116 0.000115 0.000103 0.000115 0.000111 0.000106 0.0000932 0.000493 0.00635 6 of 75HEPTACHLOR EPOXIDE 0.000195 0.000113 0.000113 0.000111 0.00012 0.000116 0.000115 0.000103 0.000115 0.000111 0.000106 0.0000932 0.000117 0.0004 2 of 75HEXACHLOROBENZENE 0.000115 0.000113 0.000113 0.000111 0.00012 0.000116 0.000115 0.000103 0.000115 0.000111 0.000106 0.0000932 0.000111 0.000154 0 of 75MIREX 0.000115 0.000113 0.000113 0.000111 0.00012 0.000116 0.000115 0.000103 0.000115 0.000111 0.000106 0.0000932 0.000111 0.000154 0 of 75TOTAL CHLORDANE 0.00335 0.00994 0.00154 0.00283 0.00242 0.00477 0.00276 0.00244 0.00379 0.00345 0.00255 0.00279 0.00374 0.0199 75 of 75TOTAL DDT 0.000573 0.00116 0.00135 0.000903 0.00053 0.000925 0.000922 0.000879 0.0012 0.000835 0.000994 0.000642 0.000914 0.00367 65 of 75TRANS-NONACHLOR 0.000773 0.00157 0.000555 0.000629 0.000485 0.00101 0.000278 0.000455 0.000765 0.000848 0.000538 0.000728 0.000741 0.00391 72 of 75
Table A-10. Deer Island Efffluent Characterization (DEC), FY03
A-43

Semivolatile Organics (ug/L) TimesJul Aug Sep Oct Nov Dec Jan Feb Mar Apr May Jun Average Maximum Detected
1,2,4-TRICHLOROBENZENE 1.03 1.05 1.11 1.14 1.07 1.06 1.08 1.02 1.02 1 1.06 1.13 1.06 1.22 0 of 221,2-DICHLOROBENZENE 1.03 1.05 1.11 1.14 1.07 1.06 1.08 1.02 1.02 1 1.06 1.13 1.06 1.22 0 of 221,2-DIPHENYLHYDRAZINE (AS AZOBENZENE) 1.03 1.05 1.11 1.14 1.07 1.06 1.08 1.02 1.02 1 1.06 1.13 1.06 1.22 0 of 221,3-DICHLOROBENZENE 1.03 1.05 1.11 1.14 1.07 1.06 1.08 1.02 1.02 1 1.06 1.13 1.06 1.22 0 of 221,4-DICHLOROBENZENE 1.03 1.05 1.11 1.14 1.07 1.06 1.08 1.02 1.02 1 1.06 1.13 1.06 1.22 0 of 222,2'-OXYBIS(1-CHLOROPROPANE) 1.03 1.05 1.11 1.14 1.07 1.06 1.08 1.02 1.02 1 1.06 1.13 1.06 1.22 0 of 222,4,5-TRICHLOROPHENOL 1.03 1.05 1.11 1.14 1.07 1.06 1.08 1.02 1.02 1 1.06 1.13 1.06 1.22 0 of 222,4,6-TRICHLOROPHENOL 1.03 1.05 1.11 1.14 1.07 1.06 1.08 1.02 1.02 1 1.06 1.13 1.06 1.22 0 of 222,4-DICHLOROPHENOL 1.03 1.05 1.11 1.14 1.07 1.06 1.08 1.02 1.02 1 1.06 1.13 1.06 1.22 0 of 222,4-DIMETHYLPHENOL 1.03 1.05 1.11 1.14 1.07 1.06 1.08 1.02 1.02 1 1.06 1.13 1.06 1.22 0 of 222,4-DINITROPHENOL 2.06 2.1 2.22 2.28 2.13 2.11 2.16 2.05 2.04 2 2.12 2.25 2.12 2.44 0 of 222,4-DINITROTOLUENE 1.03 1.05 1.11 1.14 1.07 1.06 1.08 1.02 1.02 1 1.06 1.13 1.06 1.22 0 of 222,6-DINITROTOLUENE 1.03 1.05 1.11 1.14 1.07 1.06 1.08 1.02 1.02 1 1.06 1.13 1.06 1.22 0 of 222-CHLORONAPHTHALENE 1.03 1.05 1.11 1.14 1.07 1.06 1.08 1.02 1.02 1 1.06 1.13 1.06 1.22 0 of 222-CHLOROPHENOL 1.03 1.05 1.11 1.14 1.07 1.06 1.08 1.02 1.02 1 1.06 1.13 1.06 1.22 0 of 222-METHYL-4,6-DINITROPHENOL 10.3 10.5 11.1 11.4 10.7 10.6 10.8 10.2 10.2 10 10.6 11.3 10.6 12.2 0 of 222-METHYLNAPHTHALENE 1.03 1.05 1.11 1.14 1.07 1.06 1.08 1.02 1.02 1 1.06 1.13 1.06 1.22 0 of 222-METHYLPHENOL 1.03 1.05 1.11 1.14 1.07 1.06 1.08 1.02 1.02 1 1.06 1.13 1.06 1.22 0 of 222-NITROANILINE 1.03 1.05 1.11 1.14 1.07 1.06 1.08 1.02 1.02 1 1.06 1.13 1.06 1.22 0 of 222-NITROPHENOL 1.03 1.05 1.11 1.14 1.07 1.06 1.08 1.02 1.02 1 1.06 1.13 1.06 1.22 0 of 223,3'-DICHLOROBENZIDINE 2.06 2.1 2.22 2.28 2.13 2.11 2.16 2.05 2.04 2 2.12 2.25 2.12 2.44 0 of 223-NITROANILINE 1.03 1.05 1.11 1.14 1.07 1.06 1.08 1.02 1.02 1 1.06 1.13 1.06 1.22 0 of 224-BROMOPHENYL PHENYL ETHER 1.03 1.05 1.11 1.14 1.07 1.06 1.08 1.02 1.02 1 1.06 1.13 1.06 1.22 0 of 224-CHLORO-3-METHYLPHENOL 1.03 1.05 1.11 1.14 1.07 1.06 1.08 1.02 1.02 1 1.06 1.13 1.06 1.22 0 of 224-CHLOROANILINE 1.03 1.05 1.11 1.14 1.07 1.06 1.08 1.02 1.02 1 1.06 1.13 1.06 1.22 0 of 224-CHLOROPHENYL PHENYL ETHER 1.03 1.05 1.11 1.14 1.07 1.06 1.08 1.02 1.02 1 1.06 1.13 1.06 1.22 0 of 224-METHYLPHENOL (INCLUDES 3-METHYLPHENOL) 1.03 1.05 1.11 1.14 1.07 1.06 1.08 1.02 1.02 1 1.06 1.13 1.06 1.22 0 of 224-NITROANILINE 1.03 1.05 1.11 1.14 1.07 1.06 1.08 1.02 1.02 1 1.06 1.13 1.06 1.22 0 of 224-NITROPHENOL 2.06 2.1 2.22 2.28 2.13 2.11 2.16 2.05 2.04 2 2.12 2.25 2.12 2.44 0 of 22ACENAPHTHENE 1.03 1.05 1.11 1.14 1.07 1.06 1.08 1.02 1.02 1 1.06 1.13 1.06 1.22 0 of 22ACENAPHTHYLENE 1.03 1.05 1.11 1.14 1.07 1.06 1.08 1.02 1.02 1 1.06 1.13 1.06 1.22 0 of 22ANILINE 1.03 1.05 1.11 1.14 1.07 1.06 1.08 1.02 1.02 1 1.06 1.13 1.06 1.22 0 of 22ANTHRACENE 1.03 1.05 1.11 1.14 1.07 1.06 1.08 1.02 1.02 1 1.06 1.13 1.06 1.22 0 of 22
Table A-10. Deer Island Efffluent Characterization (DEC), FY03 (cont.)
A-44

Semivolatile Organics (ug/L) TimesJul Aug Sep Oct Nov Dec Jan Feb Mar Apr May Jun Average Maximum Detected
BENZIDINE 5.14 5.25 5.56 5.7 5.33 5.28 5.41 5.12 5.1 5 5.3 5.63 5.29 6.1 0 of 22BENZO(A)ANTHRACENE 1.03 1.05 1.11 1.14 1.07 1.06 1.08 1.02 1.02 1 1.06 1.13 1.06 1.22 0 of 22BENZO(A)PYRENE 1.03 1.05 1.11 1.14 1.07 1.06 1.08 1.02 1.02 1 1.06 1.13 1.06 1.22 0 of 22BENZO(B)FLUORANTHENE 1.03 1.05 1.11 1.14 1.07 1.06 1.08 1.02 1.02 1 1.06 1.13 1.06 1.22 0 of 22BENZO(GHI)PERYLENE 1.03 1.05 1.11 1.14 1.07 1.06 1.08 1.02 1.02 1 1.06 1.13 1.06 1.22 0 of 22BENZO(K)FLUORANTHENE 1.03 1.05 1.11 1.14 1.07 1.06 1.08 1.02 1.02 1 1.06 1.13 1.06 1.22 0 of 22BENZOIC ACID 2.06 2.1 2.22 2.28 2.13 2.11 2.16 2.05 2.04 2 2.12 2.25 2.12 2.44 0 of 22BENZYL ALCOHOL 1.03 1.05 1.11 1.14 1.07 1.06 1.08 1.02 1.02 1 1.06 1.13 1.06 1.22 0 of 22BIS(2-CHLOROETHOXY)METHANE 1.03 1.05 1.11 1.14 1.07 1.06 1.08 1.02 1.02 1 1.06 1.13 1.06 1.22 0 of 22BIS(2-CHLOROETHYL)ETHER 1.03 1.05 1.11 1.14 1.07 1.06 1.08 1.02 1.02 1 1.06 1.13 1.06 1.22 0 of 22BIS(2-ETHYLHEXYL)PHTHALATE 1.03 1.05 1.11 1.14 1.07 1.06 1.08 1.02 1.02 1 1.06 1.13 1.06 1.22 0 of 22BUTYL BENZYL PHTHALATE 1.03 1.05 1.11 1.14 1.07 1.06 1.08 1.02 1.02 1 1.06 1.13 1.06 1.22 0 of 22CHRYSENE 1.03 1.05 1.11 1.14 1.07 1.06 1.08 1.02 1.02 1 1.06 1.13 1.06 1.22 0 of 22DI-N-BUTYLPHTHALATE 1.03 1.05 1.11 1.14 1.07 1.06 1.08 1.02 1.02 1 1.06 1.13 1.06 1.22 0 of 22DI-N-OCTYLPHTHALATE 1.03 1.05 1.11 1.14 1.07 1.06 1.08 1.02 1.02 1 1.06 1.13 1.06 1.22 0 of 22DIBENZO(A,H)ANTHRACENE 1.03 1.05 1.11 1.14 1.07 1.06 1.08 1.02 1.02 1 1.06 1.13 1.06 1.22 0 of 22DIBENZOFURAN 1.03 1.05 1.11 1.14 1.07 1.06 1.08 1.02 1.02 1 1.06 1.13 1.06 1.22 0 of 22DIETHYL PHTHALATE 1.03 1.05 1.11 1.14 1.07 1.06 1.08 1.02 1.02 1 1.06 1.13 1.06 1.22 0 of 22DIMETHYL PHTHALATE 1.03 1.05 1.11 1.14 1.07 1.06 1.08 1.02 1.02 1 1.06 1.13 1.06 1.22 0 of 22FLUORANTHENE 1.03 1.05 1.11 1.14 1.07 1.06 1.08 1.02 1.02 1 1.06 1.13 1.06 1.22 0 of 22FLUORENE 1.03 1.05 1.11 1.14 1.07 1.06 1.08 1.02 1.02 1 1.06 1.13 1.06 1.22 0 of 22HEXACHLOROBENZENE 1.03 1.05 1.11 1.14 1.07 1.06 1.08 1.02 1.02 1 1.06 1.13 1.06 1.22 0 of 22HEXACHLOROBUTADIENE 1.03 1.05 1.11 1.14 1.07 1.06 1.08 1.02 1.02 1 1.06 1.13 1.06 1.22 0 of 22HEXACHLOROCYCLOPENTADIENE 5.14 5.25 5.56 5.7 5.33 5.28 5.41 5.12 5.1 5 5.3 5.63 5.29 6.1 0 of 22HEXACHLOROETHANE 1.03 1.05 1.11 1.14 1.07 1.06 1.08 1.02 1.02 1 1.06 1.13 1.06 1.22 0 of 22INDENO(1,2,3-CD)PYRENE 1.03 1.05 1.11 1.14 1.07 1.06 1.08 1.02 1.02 1 1.06 1.13 1.06 1.22 0 of 22ISOPHORONE 1.03 1.05 1.11 1.14 1.07 1.06 1.08 1.02 1.02 1 1.06 1.13 1.06 1.22 0 of 22N-NITROSODI-N-PROPYLAMINE 1.03 1.05 1.11 1.14 1.07 1.06 1.08 1.02 1.02 1 1.06 1.13 1.06 1.22 0 of 22N-NITROSODIMETHYLAMINE 1.03 1.05 1.11 1.14 1.07 1.06 1.08 1.02 1.02 1 1.06 1.13 1.06 1.22 0 of 22N-NITROSODIPHENYLAMINE 1.03 1.05 1.11 1.14 1.07 1.06 1.08 1.02 1.02 1 1.06 1.13 1.06 1.22 0 of 22NAPHTHALENE 1.03 1.05 1.11 1.14 1.07 1.06 1.08 1.02 1.02 1 1.06 1.13 1.06 1.22 0 of 22NITROBENZENE 1.03 1.05 1.11 1.14 1.07 1.06 1.08 1.02 1.02 1 1.06 1.13 1.06 1.22 0 of 22PENTACHLOROPHENOL 3.09 3.15 3.34 3.42 3.2 3.17 3.25 3.07 3.06 3 3.18 3.38 3.18 3.66 0 of 22PHENANTHRENE 0.103 0.105 0.111 0.114 0.107 0.106 0.108 0.102 0.102 0.1 0.106 0.113 0.106 0.122 0 of 22PHENOL 2.06 2.1 2.22 2.28 2.13 2.11 2.16 2.05 2.04 2 2.12 2.25 2.12 2.44 0 of 22PYRENE 1.03 1.05 1.11 1.14 1.07 1.06 1.08 1.02 1.02 1 1.06 1.13 1.06 1.22 0 of 22
NotesDEC is the now-defunct Detailed Effluent Characterization project, which includes low-detection limit methods not approved by the EPA. DEC sampling is now carried out under the NP-EM project.~: No data or no samples takenResults in bold indicate one or more detects that monthYearly averages are calculated from individual results collected during the fiscal year.Non-detected compounds are assumed to equal one half of the detection limit for metals and inorganics and one tenth of the reporting limit for organic compounds.
Table A-10. Deer Island Efffluent Characterization (DEC), FY03 (cont.)
A-45

Metals (ug/L) TimesJul Aug Sep Oct Nov Dec Jan Feb Mar Apr May Jun Average Maximum Detected
ANTIMONY 25.6 16 ~ 16.4 26.1 28.3 42.8 26.1 31.9 32.4 23.1 40.2 28 43.7 0 of 23BERYLLIUM 0.64 0.534 ~ 0.546 0.652 0.708 1.07 0.752 0.905 1.08 0.77 1 0.781 1.09 0 of 23BORON 791 427 ~ 838 876 837 534 575 1030 540 385 502 673 1640 12 of 23CADMIUM 0.102 0.218 0.11 0.088 0.155 0.341 0.396 0.333 0.737 0.609 0.376 0.516 0.339 1.64 74 of 86CHROMIUM 2.17 3.25 2.46 2.29 2.79 14 4.55 5.94 7.11 2.92 1.35 3.71 4.03 44.9 73 of 86COPPER ~ ~ ~ ~ 51.7 ~ ~ ~ ~ ~ ~ ~ 51.7 51.7 1 of 1HEXAVALENT CHROMIUM 6.04 5.45 5.65 5.51 7.76 7.11 10.3 7.43 9.06 10.8 7.61 9.45 7.68 10.8 0 of 24IRON 913 762 ~ 986 1200 580 1870 1260 1590 1790 710 1060 1150 2210 23 of 23LEAD 2.91 4.76 3.01 2.7 3.47 6.7 4.42 6.68 13.1 4.78 3.72 6.33 5.29 41.1 11 of 87MOLYBDENUM 26.2 24.2 23.2 21.5 22.2 26.8 26.1 23.2 26.5 32.2 31.6 29.6 26 54.5 65 of 65NICKEL 8.4 9.12 8.64 6.63 9.58 10.5 11.6 9.75 12.4 12.3 9 9.86 9.8 21.4 87 of 87SELENIUM 1.15 0.961 ~ 0.983 1.17 1.27 1.92 1.35 1.63 1.94 1.39 1.81 1.41 1.97 0 of 23SILVER 0.73 2.02 1.37 1.1 1.29 1.48 2.15 1.72 2.08 1.7 1.26 1.36 1.55 10.8 85 of 86THALLIUM 1.28 1.07 ~ 1.09 1.3 1.42 2.14 1.5 1.81 2.16 1.54 2.01 1.56 2.18 0 of 23ZINC 55.2 90.4 77.3 54.4 64.4 106 150 142 206 136 77.5 104 106 373 86 of 86
Phenols (ug/L) TimesJul Aug Sep Oct Nov Dec Jan Feb Mar Apr May Jun Average Maximum Detected
PHENOL 2.7 2.13 45.3 ~ 2.61 2.83 ~ ~ ~ ~ ~ ~ 11.1 66.7 2 of 10
Oil and Grease, Surfactants, and Petroleum Hydrocarbons (mg/L) TimesJul Aug Sep Oct Nov Dec Jan Feb Mar Apr May Jun Average Maximum Detected
FATS OIL AND GREASE 1680 1520 1810 1630 11600 10200 2390 2090 2790 2940 2360 2460 3860 49100 3 of 66MBAS 960 1740 1040 1150 1350 538 1230 1120 2200 650 732 1850 1200 4310 41 of 41PETROLEUM HYDROCARBON 76.8 272 256 113 288 558 297 516 505 273 509 68.5 321 1730 35 of 66
Organochlorine Pesticides and PCBs (ug/L) TimesJul Aug Sep Oct Nov Dec Jan Feb Mar Apr May Jun Average Maximum Detected
2,4'-DDD 0.000281 0.000268 0.00028 0.000251 0.000352 0.000434 0.000395 0.000343 0.000459 0.000453 0.000322 0.000316 0.000335 0.00072 0 of 752,4'-DDE 0.000281 0.000268 0.00028 0.000294 0.000352 0.000434 0.000395 0.000343 0.000459 0.000453 0.000322 0.000316 0.000339 0.00072 1 of 752,4'-DDT 0.000281 0.000268 0.00028 0.000251 0.000352 0.000434 0.000395 0.000343 0.000459 0.000453 0.000322 0.000316 0.000335 0.00072 0 of 754,4'-DDD 0.000382 0.000518 0.000702 0.000331 0.000352 0.00179 0.000718 0.000621 0.00118 0.000824 0.00058 0.00101 0.000697 0.00466 43 of 754,4'-DDE 0.00125 0.00239 0.00133 0.00145 0.000987 0.0019 0.000937 0.00171 0.00236 0.00149 0.00118 0.000786 0.00152 0.00768 59 of 754,4'-DDT 0.000281 0.000268 0.00028 0.000567 0.000815 0.000434 0.00211 0.000979 0.00142 0.0013 0.000881 0.000627 0.000786 0.00534 22 of 75ALDRIN 0.000281 0.000268 0.00028 0.000251 0.000352 0.000434 0.000395 0.000343 0.000459 0.000453 0.000322 0.000316 0.000335 0.00072 0 of 75ALPHA-CHLORDANE 0.00272 0.00476 0.00179 0.00228 0.0025 0.00601 0.00469 0.0032 0.00654 0.00565 0.00322 0.00369 0.00386 0.0161 74 of 75DDMU 0.000281 0.000268 0.00028 0.000251 0.000352 0.000434 0.000395 0.000343 0.000459 0.000453 0.000322 0.000316 0.000335 0.00072 0 of 75DIELDRIN 0.000234 0.000268 0.00028 0.000251 0.000352 0.000434 0.000395 0.000343 0.00119 0.000453 0.000322 0.000316 0.000396 0.00509 2 of 75ENDRIN 0.000281 0.000268 0.00028 0.000251 0.000352 0.000434 0.000395 0.000343 0.000459 0.000453 0.000322 0.000316 0.000335 0.00072 0 of 75GAMMA-BHC (LINDANE) 0.00657 0.00906 0.00536 0.00654 0.00464 0.00454 0.0048 0.00484 0.0038 0.00383 0.00404 0.00147 0.00524 0.0192 63 of 75GAMMA-CHLORDANE 0.00337 0.00576 0.00205 0.00303 0.0032 0.00814 0.00386 0.00341 0.00556 0.00491 0.00343 0.00331 0.0041 0.0206 75 of 75HEPTACHLOR 0.000281 0.00877 0.00028 0.000251 0.000352 0.000434 0.000395 0.000343 0.000459 0.000453 0.000322 0.000316 0.00149 0.0224 6 of 75HEPTACHLOR EPOXIDE 0.000476 0.000268 0.00028 0.000251 0.000352 0.000434 0.000395 0.000343 0.000459 0.000453 0.000322 0.000316 0.000356 0.00125 2 of 75HEXACHLOROBENZENE 0.000281 0.000268 0.00028 0.000251 0.000352 0.000434 0.000395 0.000343 0.000459 0.000453 0.000322 0.000316 0.000335 0.00072 0 of 75MIREX 0.000281 0.000268 0.00028 0.000251 0.000352 0.000434 0.000395 0.000343 0.000459 0.000453 0.000322 0.000316 0.000335 0.00072 0 of 75TOTAL CHLORDANE 0.00818 0.0236 0.00381 0.00642 0.00714 0.0178 0.00944 0.00812 0.0152 0.014 0.00776 0.00947 0.0113 0.0457 75 of 75TOTAL DDT 0.0014 0.00274 0.00335 0.00205 0.00156 0.00346 0.00316 0.00293 0.0048 0.00339 0.00302 0.00218 0.00277 0.0134 65 of 75TRANS-NONACHLOR 0.00189 0.00373 0.00137 0.00143 0.00143 0.00378 0.000951 0.00152 0.00306 0.00345 0.00163 0.00247 0.00224 0.00903 72 of 75
Table A-11. Deer Island Efffluent Loadings (DEC), FY03
A-46

Semivolatile Organics (ug/L) TimesJul Aug Sep Oct Nov Dec Jan Feb Mar Apr May Jun Average Maximum Detected
1,2,4-TRICHLOROBENZENE 2.78 2.27 2.62 2.49 2.78 2.99 4.63 3.08 3.69 4.32 3.27 4.52 3.37 5.16 0 of 221,2-DICHLOROBENZENE 2.78 2.27 2.62 2.49 2.78 2.99 4.63 3.08 3.69 4.32 3.27 4.52 3.37 5.16 0 of 221,2-DIPHENYLHYDRAZINE (AS AZOBENZENE) 2.78 2.27 2.62 2.49 2.78 2.99 4.63 3.08 3.69 4.32 3.27 4.52 3.37 5.16 0 of 221,3-DICHLOROBENZENE 2.78 2.27 2.62 2.49 2.78 2.99 4.63 3.08 3.69 4.32 3.27 4.52 3.37 5.16 0 of 221,4-DICHLOROBENZENE 2.78 2.27 2.62 2.49 2.78 2.99 4.63 3.08 3.69 4.32 3.27 4.52 3.37 5.16 0 of 222,2'-OXYBIS(1-CHLOROPROPANE) 2.78 2.27 2.62 2.49 2.78 2.99 4.63 3.08 3.69 4.32 3.27 4.52 3.37 5.16 0 of 222,4,5-TRICHLOROPHENOL 2.78 2.27 2.62 2.49 2.78 2.99 4.63 3.08 3.69 4.32 3.27 4.52 3.37 5.16 0 of 222,4,6-TRICHLOROPHENOL 2.78 2.27 2.62 2.49 2.78 2.99 4.63 3.08 3.69 4.32 3.27 4.52 3.37 5.16 0 of 222,4-DICHLOROPHENOL 2.78 2.27 2.62 2.49 2.78 2.99 4.63 3.08 3.69 4.32 3.27 4.52 3.37 5.16 0 of 222,4-DIMETHYLPHENOL 2.78 2.27 2.62 2.49 2.78 2.99 4.63 3.08 3.69 4.32 3.27 4.52 3.37 5.16 0 of 222,4-DINITROPHENOL 5.56 4.54 5.24 4.98 5.56 5.97 9.25 6.16 7.38 8.64 6.53 9.04 6.74 10.3 0 of 222,4-DINITROTOLUENE 2.78 2.27 2.62 2.49 2.78 2.99 4.63 3.08 3.69 4.32 3.27 4.52 3.37 5.16 0 of 222,6-DINITROTOLUENE 2.78 2.27 2.62 2.49 2.78 2.99 4.63 3.08 3.69 4.32 3.27 4.52 3.37 5.16 0 of 222-CHLORONAPHTHALENE 2.78 2.27 2.62 2.49 2.78 2.99 4.63 3.08 3.69 4.32 3.27 4.52 3.37 5.16 0 of 222-CHLOROPHENOL 2.78 2.27 2.62 2.49 2.78 2.99 4.63 3.08 3.69 4.32 3.27 4.52 3.37 5.16 0 of 222-METHYL-4,6-DINITROPHENOL 27.8 22.7 26.2 24.9 27.8 29.9 46.3 30.8 36.9 43.2 32.7 45.2 33.7 51.6 0 of 222-METHYLNAPHTHALENE 2.78 2.27 2.62 2.49 2.78 2.99 4.63 3.08 3.69 4.32 3.27 4.52 3.37 5.16 0 of 222-METHYLPHENOL 2.78 2.27 2.62 2.49 2.78 2.99 4.63 3.08 3.69 4.32 3.27 4.52 3.37 5.16 0 of 222-NITROANILINE 2.78 2.27 2.62 2.49 2.78 2.99 4.63 3.08 3.69 4.32 3.27 4.52 3.37 5.16 0 of 222-NITROPHENOL 2.78 2.27 2.62 2.49 2.78 2.99 4.63 3.08 3.69 4.32 3.27 4.52 3.37 5.16 0 of 223,3'-DICHLOROBENZIDINE 5.56 4.54 5.24 4.98 5.56 5.97 9.25 6.16 7.38 8.64 6.53 9.04 6.74 10.3 0 of 223-NITROANILINE 2.78 2.27 2.62 2.49 2.78 2.99 4.63 3.08 3.69 4.32 3.27 4.52 3.37 5.16 0 of 224-BROMOPHENYL PHENYL ETHER 2.78 2.27 2.62 2.49 2.78 2.99 4.63 3.08 3.69 4.32 3.27 4.52 3.37 5.16 0 of 224-CHLORO-3-METHYLPHENOL 2.78 2.27 2.62 2.49 2.78 2.99 4.63 3.08 3.69 4.32 3.27 4.52 3.37 5.16 0 of 224-CHLOROANILINE 2.78 2.27 2.62 2.49 2.78 2.99 4.63 3.08 3.69 4.32 3.27 4.52 3.37 5.16 0 of 224-CHLOROPHENYL PHENYL ETHER 2.78 2.27 2.62 2.49 2.78 2.99 4.63 3.08 3.69 4.32 3.27 4.52 3.37 5.16 0 of 224-METHYLPHENOL (INCLUDES 3-METHYLPHENOL) 2.78 2.27 2.62 2.49 2.78 2.99 4.63 3.08 3.69 4.32 3.27 4.52 3.37 5.16 0 of 224-NITROANILINE 2.78 2.27 2.62 2.49 2.78 2.99 4.63 3.08 3.69 4.32 3.27 4.52 3.37 5.16 0 of 224-NITROPHENOL 5.56 4.54 5.24 4.98 5.56 5.97 9.25 6.16 7.38 8.64 6.53 9.04 6.74 10.3 0 of 22ACENAPHTHENE 2.78 2.27 2.62 2.49 2.78 2.99 4.63 3.08 3.69 4.32 3.27 4.52 3.37 5.16 0 of 22ACENAPHTHYLENE 2.78 2.27 2.62 2.49 2.78 2.99 4.63 3.08 3.69 4.32 3.27 4.52 3.37 5.16 0 of 22ANILINE 2.78 2.27 2.62 2.49 2.78 2.99 4.63 3.08 3.69 4.32 3.27 4.52 3.37 5.16 0 of 22ANTHRACENE 2.78 2.27 2.62 2.49 2.78 2.99 4.63 3.08 3.69 4.32 3.27 4.52 3.37 5.16 0 of 22
Table A-11. Deer Island Efffluent Loadings (DEC), FY03 (cont.)
A-47

Semivolatile Organics (ug/L) TimesJul Aug Sep Oct Nov Dec Jan Feb Mar Apr May Jun Average Maximum Detected
BENZIDINE 13.9 11.3 13.1 12.4 13.9 14.9 23.1 15.4 18.5 21.6 16.3 22.6 16.8 25.8 0 of 22BENZO(A)ANTHRACENE 2.78 2.27 2.62 2.49 2.78 2.99 4.63 3.08 3.69 4.32 3.27 4.52 3.37 5.16 0 of 22BENZO(A)PYRENE 2.78 2.27 2.62 2.49 2.78 2.99 4.63 3.08 3.69 4.32 3.27 4.52 3.37 5.16 0 of 22BENZO(B)FLUORANTHENE 2.78 2.27 2.62 2.49 2.78 2.99 4.63 3.08 3.69 4.32 3.27 4.52 3.37 5.16 0 of 22BENZO(GHI)PERYLENE 2.78 2.27 2.62 2.49 2.78 2.99 4.63 3.08 3.69 4.32 3.27 4.52 3.37 5.16 0 of 22BENZO(K)FLUORANTHENE 2.78 2.27 2.62 2.49 2.78 2.99 4.63 3.08 3.69 4.32 3.27 4.52 3.37 5.16 0 of 22BENZOIC ACID 5.56 4.54 5.24 4.98 5.56 5.97 9.25 6.16 7.38 8.64 6.53 9.04 6.74 10.3 0 of 22BENZYL ALCOHOL 2.78 2.27 2.62 2.49 2.78 2.99 4.63 3.08 3.69 4.32 3.27 4.52 3.37 5.16 0 of 22BIS(2-CHLOROETHOXY)METHANE 2.78 2.27 2.62 2.49 2.78 2.99 4.63 3.08 3.69 4.32 3.27 4.52 3.37 5.16 0 of 22BIS(2-CHLOROETHYL)ETHER 2.78 2.27 2.62 2.49 2.78 2.99 4.63 3.08 3.69 4.32 3.27 4.52 3.37 5.16 0 of 22BIS(2-ETHYLHEXYL)PHTHALATE 2.78 2.27 2.62 2.49 2.78 2.99 4.63 3.08 3.69 4.32 3.27 4.52 3.37 5.16 0 of 22BUTYL BENZYL PHTHALATE 2.78 2.27 2.62 2.49 2.78 2.99 4.63 3.08 3.69 4.32 3.27 4.52 3.37 5.16 0 of 22CHRYSENE 2.78 2.27 2.62 2.49 2.78 2.99 4.63 3.08 3.69 4.32 3.27 4.52 3.37 5.16 0 of 22DI-N-BUTYLPHTHALATE 2.78 2.27 2.62 2.49 2.78 2.99 4.63 3.08 3.69 4.32 3.27 4.52 3.37 5.16 0 of 22DI-N-OCTYLPHTHALATE 2.78 2.27 2.62 2.49 2.78 2.99 4.63 3.08 3.69 4.32 3.27 4.52 3.37 5.16 0 of 22DIBENZO(A,H)ANTHRACENE 2.78 2.27 2.62 2.49 2.78 2.99 4.63 3.08 3.69 4.32 3.27 4.52 3.37 5.16 0 of 22DIBENZOFURAN 2.78 2.27 2.62 2.49 2.78 2.99 4.63 3.08 3.69 4.32 3.27 4.52 3.37 5.16 0 of 22DIETHYL PHTHALATE 2.78 2.27 2.62 2.49 2.78 2.99 4.63 3.08 3.69 4.32 3.27 4.52 3.37 5.16 0 of 22DIMETHYL PHTHALATE 2.78 2.27 2.62 2.49 2.78 2.99 4.63 3.08 3.69 4.32 3.27 4.52 3.37 5.16 0 of 22FLUORANTHENE 2.78 2.27 2.62 2.49 2.78 2.99 4.63 3.08 3.69 4.32 3.27 4.52 3.37 5.16 0 of 22FLUORENE 2.78 2.27 2.62 2.49 2.78 2.99 4.63 3.08 3.69 4.32 3.27 4.52 3.37 5.16 0 of 22HEXACHLOROBENZENE 2.78 2.27 2.62 2.49 2.78 2.99 4.63 3.08 3.69 4.32 3.27 4.52 3.37 5.16 0 of 22HEXACHLOROBUTADIENE 2.78 2.27 2.62 2.49 2.78 2.99 4.63 3.08 3.69 4.32 3.27 4.52 3.37 5.16 0 of 22HEXACHLOROCYCLOPENTADIENE 13.9 11.3 13.1 12.4 13.9 14.9 23.1 15.4 18.5 21.6 16.3 22.6 16.8 25.8 0 of 22HEXACHLOROETHANE 2.78 2.27 2.62 2.49 2.78 2.99 4.63 3.08 3.69 4.32 3.27 4.52 3.37 5.16 0 of 22INDENO(1,2,3-CD)PYRENE 2.78 2.27 2.62 2.49 2.78 2.99 4.63 3.08 3.69 4.32 3.27 4.52 3.37 5.16 0 of 22ISOPHORONE 2.78 2.27 2.62 2.49 2.78 2.99 4.63 3.08 3.69 4.32 3.27 4.52 3.37 5.16 0 of 22N-NITROSODI-N-PROPYLAMINE 2.78 2.27 2.62 2.49 2.78 2.99 4.63 3.08 3.69 4.32 3.27 4.52 3.37 5.16 0 of 22N-NITROSODIMETHYLAMINE 2.78 2.27 2.62 2.49 2.78 2.99 4.63 3.08 3.69 4.32 3.27 4.52 3.37 5.16 0 of 22N-NITROSODIPHENYLAMINE 2.78 2.27 2.62 2.49 2.78 2.99 4.63 3.08 3.69 4.32 3.27 4.52 3.37 5.16 0 of 22NAPHTHALENE 2.78 2.27 2.62 2.49 2.78 2.99 4.63 3.08 3.69 4.32 3.27 4.52 3.37 5.16 0 of 22NITROBENZENE 2.78 2.27 2.62 2.49 2.78 2.99 4.63 3.08 3.69 4.32 3.27 4.52 3.37 5.16 0 of 22PENTACHLOROPHENOL 8.34 6.81 7.86 7.47 8.34 8.96 13.9 9.24 11.1 13 9.8 13.6 10.1 15.5 0 of 22PHENANTHRENE 0.278 0.227 0.262 0.249 0.278 0.299 0.463 0.308 0.369 0.432 0.327 0.452 0.337 0.516 0 of 22PHENOL 5.56 4.54 5.24 4.98 5.56 5.97 9.25 6.16 7.38 8.64 6.53 9.04 6.74 10.3 0 of 22PYRENE 2.78 2.27 2.62 2.49 2.78 2.99 4.63 3.08 3.69 4.32 3.27 4.52 3.37 5.16 0 of 22
NotesDEC is the now-defunct Detailed Effluent Characterization project, which includes low-detection limit methods not approved by the EPA. DEC sampling is now carried out under the NP-EM project.~: No data or no samples takenResults in bold indicate one or more detects that monthYearly averages are calculated from individual results collected during the fiscal year.Non-detected compounds are assumed to equal one half of the detection limit for metals and inorganics and one tenth of the reporting limit for organic compounds.
Table A-11. Deer Island Efffluent Loadings (DEC), FY03 (cont.)
A-48

Appendix B Table B-1 Cottage Farm CSO Facility Operations Summary, Fiscal Year 2003 Table B-2 Cottage Farm CSO Facility Effluent Characterization, Fiscal Year 2003 Table B-3 Cottage Farm CSO Facility Effluent Loadings, Fiscal Year 2003

Discharge Total Peak Effluent Effluent Fecal ChlorineDate Rainfall Duration Volume Flow pH BOD TSS Coliform Residual
(inches) (hours) (MG) (MG) (SU) (mg/L) (mg/L) (col/100 ml) (mg/L)July
No ActivationAugust
No ActivationSeptember
No ActivationOctober
26 1.74 5.08 12.41 ND 6.7 84.7 116.0 23000 0.06.7 49.0 16000 0.06.8 66.0 520 0.06.7 40.0 490 0.0
November16 0.4717 1.25 2.50 2.81 ND 6.4 22.8 37.0 10 0.0
December14 1.99 6.50 20.62 143.00 6.5 59.7 70.0 10 0.0
6.6 66.0 20 0.06.7 68.0 10 0.06.6 80.0 10 0.06.9 40.0 10 0.07.0 40.0 10 0.0
15* 0.00 0.50 1.59 ND20 1.11 4.75 9.01 127.00
JanuaryNo Activation
February22 0.69 2.62 13.00 16.4023 0.51 4.93 2.00 5.10
March2 0.85 5.13 9.21 60.0029 0.55 0.58 1.02 83.0030* 1.30 4.58 9.54 83.00 7.1 63.3 69.5 1775 0.0
6.6 51.5 240 0.06.8 54.0 430 0.06.6 46.0 70 0.06.5 40.5 50 0.06.4 42.0 70 0.0
April11 1.27 3.92 9.01 78.0026 0.80 1.75 0.91 39.00
May26 1.24 5.00 8.88 56.3028 1.47 0.92 2.08 70.00
June1 1.14 6.00 5.60 37.1021 0.2122 1.76 6.50 9.02 57.30
Total 61.26 116.71Average 3.83 7.29 57.6 54.0 90 0.0Minimum 0.50 0.91 5.10 6.4 22.8 37.0 10 0.0Maximum** 6.50 20.62 143.00 7.1 84.7 67.8 3112 0.0
No. of Times CSO Activated 14 No. of Days CSO Activated 16ND = No Data; * = continued from previous day; ** = per the NPDES permit, maximum chlorine residual is the highest single sample
Table B-1. Cottage Farm CSO Facility Operations Summary, FY03
B-1

TimesJul Aug Sep Oct Nov Dec Jan Feb Mar Apr May Jun AVG MAX Detected
Metals (ug/L)CADMIUM NA NA NA 0.59 0.23 0.38 NA ~ ~ ~ ~ ~ 0.40 0.59 3 of 6COPPER NA NA NA 50.50 31.20 33.00 NA ~ ~ ~ ~ ~ 38.23 50.50 3 of 3LEAD NA NA NA 46.00 24.90 26.50 NA ~ ~ ~ ~ ~ 32.47 46.00 3 of 3MERCURY NA NA NA 0.18 0.18 0.08 NA ~ ~ ~ ~ ~ 0.15 0.18 3 of 3NICKEL NA NA NA 12.10 2.56 5.16 NA ~ ~ ~ ~ ~ 6.61 12.10 3 of 4ZINC NA NA NA 109.00 64.80 78.50 NA ~ ~ ~ ~ ~ 84.10 109.00 3 of 3
Surfactants (mg/L)SURFACTANTS NA NA NA 3.36 0.41 2.34 NA ~ ~ ~ ~ ~ 2.04 3.36 3 of 3
TimesJul Aug Sep Oct Nov Dec Jan Feb Mar Apr May Jun AVG MAX Detected
Metals (lbs/day)CADMIUM NA NA NA 0.06 0.01 0.07 NA ~ ~ ~ ~ ~ 0.04 0.07 3 of 6COPPER NA NA NA 5.23 0.73 5.68 NA ~ ~ ~ ~ ~ 3.88 5.68 3 of 3LEAD NA NA NA 4.76 0.58 4.56 NA ~ ~ ~ ~ ~ 3.30 4.76 3 of 3MERCURY NA NA NA 0.02 0.00 0.01 NA ~ ~ ~ ~ ~ 0.01 0.02 3 of 3NICKEL NA NA NA 1.25 0.06 0.89 NA ~ ~ ~ ~ ~ 0.73 1.25 3 of 4ZINC NA NA NA 11.28 1.52 13.50 NA ~ ~ ~ ~ ~ 8.77 13.50 3 of 3
Surfactants (lbs/day)SURFACTANTS NA NA NA 347.76 9.51 402.41 NA ~ ~ ~ ~ ~ 253.23 402.41 3 of 3
NA: No activation~: Activation that month, but no data or no sample takenResults in bold indicate one or more detects in the month.Yearly averages are calculated from individual results collected in the fiscal year.Non-detected compounds are assumed to equal one half of the detection limit for metals and inorganics and one tenth of the reporting limit for organic compounds.
Table B-2. Cottage Farm CSO Facility Effluent Characterization, FY03
Table B-3. Cottage Farm CSO Facility Effluent Loadings, FY03
B-2

Appendix C Table C-1 Prison Point CSO Facility Operations Summary, Fiscal Year 2003 Table C-2 Prison Point CSO Facility Effluent Characterization, Fiscal Year 2003 Table C-3 Prison Point CSO Facility Effluent Loadings, Fiscal Year 2003

Discharge Total Peak Effluent Effluent Fecal ChlorineDate Rainfall Duration Volume Flow pH BOD TSS Coliform Residual
(inches) (hours) (MG) (MG) (SU) (mg/L) (mg/L) (col/100 ml) (mg/L)July
No ActivationAugust
29 0.84 1.75 2.16 NDSeptember
2 0.513 0.39 1.33 1.64 ND22 0.1123 0.91 5.72 12.16 ND
October16 0.71 7.28 7.02 ND 6.7 24.7 704.0 140 0.0
6.6 126.0 1200 0.06.9 70.0 200 0.066.8 94.0 50 0.03
26 1.74 8.03 25.96 ND 6.7 24.1 78.0 1900 0.06.6 52.0 90 0.06.9 56.0 60 0.06.5 70.0 25000 0.06.8 50.0 32000 0.06.6 46.0 28000 0.06.7 36.0 400 0.06.6 26.0 40 0.0
November6 0.88 2.42 2.08 58.57 7.0 22.3 34.0 30 0.0312 0.69 0.67 1.11 ND 6.6 35.8 53.0 110 0.013* 0.58 0.42 0.70 ND 6.6 32.5 10 0.0317 1.25 6.25 10.75 ND 6.2 6.02 37.0 300 0.0
6.2 42.0 240 0.06.3 52.0 110 0.06.5 32.0 40 0.016.5 33.0 30 0.01
18 0.19 0.33 0.47 NDDecember
11 0.2212 0.52 3.45 3.56 48.0014 1.99 12.92 27.77 157.0020 1.11 3.57 15.06 270.00
January3 0.514 0.50 0.75 1.09 26.00
February22 0.69 3.33 8.10 88.0023 0.51 6.33 7.49 60.00
March2 0.85 5.33 14.71 180.0029 0.55 0.50 1.18 14.7330 1.30 8.42 17.84 4.28
April11 1.27 5.75 19.00 143.0012 0.45 1.62 0.98 53.0026 0.80 4.00 7.15 93.70
May26 1.24 6.67 21.74 128.0028 1.47 5.70 13.13 100.00
June1 1.14 5.25 22.97 107.007 0.80 1.33 3.55 24.4821 0.2122 1.76 10.35 31.34 200.00
Total 119.47 280.71Average 4.42 10.40 22.6 76.5 96 0.01Minimum 0.33 0.47 4.28 6.2 6.0 32.5 10 0.00Maximum** 12.92 31.34 270.00 7.0 35.8 248.5 1177 0.06
No. of Times CSO Activated 26No. of Days CSO Activated 27ND = No Data; * = continued from previous day; ** = per the NPDES permit, maximum chlorine residual is the highest single sampl
Table C-1. Prison Point CSO Facility Operations Summary, FY03
C-1

TimesJul Aug Sep Oct Nov Dec Jan Feb Mar Apr May Jun AVG MAX Detected
Metals (ug/L)CADMIUM NA ~ ~ 0.55 0.60 ~ ~ ~ ~ ~ ~ ~ 0.57 0.60 3 of 6COPPER NA ~ ~ 42.10 42.30 ~ ~ ~ ~ ~ ~ ~ 42.17 46.90 3 of 3LEAD NA ~ ~ 58.70 52.90 ~ ~ ~ ~ ~ ~ ~ 56.77 59.00 3 of 3MERCURY NA ~ ~ 0.08 0.07 ~ ~ ~ ~ ~ ~ ~ 0.07 0.08 3 of 3NICKEL NA ~ ~ 3.68 2.36 ~ ~ ~ ~ ~ ~ ~ 3.24 4.96 3 of 5ZINC NA ~ ~ 136.00 141.00 ~ ~ ~ ~ ~ ~ ~ 137.67 161.00 3 of 3
Surfactants (mg/L)SURFACTANTS NA ~ ~ 0.69 0.69 ~ ~ ~ ~ ~ ~ ~ 0.69 0.84 3 of 3
TimesJul Aug Sep Oct Nov Dec Jan Feb Mar Apr May Jun AVG MAX Detected
Metals (lbs/day)CADMIUM NA ~ ~ 0.07 0.01 ~ ~ ~ ~ ~ ~ ~ 0.05 0.11 3 of 6COPPER NA ~ ~ 5.41 0.73 ~ ~ ~ ~ ~ ~ ~ 3.85 8.08 3 of 3LEAD NA ~ ~ 8.10 0.92 ~ ~ ~ ~ ~ ~ ~ 5.70 12.77 3 of 3MERCURY NA ~ ~ 0.01 0.001 ~ ~ ~ ~ ~ ~ ~ 0.01 0.02 3 of 3NICKEL NA ~ ~ 0.40 0.04 ~ ~ ~ ~ ~ ~ ~ 0.28 0.52 3 of 5ZINC NA ~ ~ 16.73 2.45 ~ ~ ~ ~ ~ ~ ~ 11.97 24.03 3 of 3
Surfactants (lbs/day)SURFACTANTS NA ~ ~ 106.87 12.04 ~ ~ ~ ~ ~ ~ ~ 75.26 182.30 3 of 3
NA: No activation~: No data or no sample takenResults in bold indicate one or more detects in the month.Yearly averages are calculated from individual results collected in the fiscal yearNon-detected compounds are assumed to equal one half of the detection limit for metals and inorganics and one tenth of the reporting limit for organic compounds
Table C-2. Prison Point CSO Facility Effluent Characterization, FY03
Table C-3. Prison Point CSO Facility Effluent Loadings, FY03
C-2

Appendix D Table D-1 Somerville Marginal CSO Facility Operations Summary, Fiscal Year 2003 Table D-2 Somerville Marginal CSO Facility Effluent Characterization, Fiscal Year 2003 Table D-3 Somerville Marginal CSO Facility Effluent Loadings, Fiscal Year 2003

Discharge Total Peak Effluent Effluent Fecal ChlorineDate Rainfall Duration Volume Flow pH BOD TSS Coliform Residual
(inches) (hours) (MG) (MG) (SU) (mg/L) (mg/L) (col/100 ml) (mg/L)July
19 0.20 1.02 0.417 NDAugust
29 0.84 1.07 0.10 ND 6.5 ND 101.0 126000 0.00September
15 0.2516 0.20 1.17 0.18 ND22 0.1123 0.91 2.37 1.73 ND
October16 0.71 2.68 1.35 24.85 6.7 11.2 49.5 10 0.026 1.74 9.25 6.76 102.81
November6 0.88 1.05 0.20 10.70
11 0.0712 0.69 1.35 0.90 10.0016 0.4717 1.25 2.92 1.56 ND 8.2 6.8 36.0 10 0.0
7.0 14.5 10 1.27.0 29.5 30 0.02
18 0.19 1.50 0.67 14.3022 0.56 0.65 0.24 13.19
December11 0.2212 0.52 1.57 0.97 32.0014 1.99 10.50 6.04 70.0020 1.11 1.95 3.19 69.70 7.6 7.8 60.0 60 0.05
JanuaryNo Activation
February22 0.69 2.08 2.13 59.5023 0.51 2.80 1.48 56.00
March2 0.85 4.67 4.35 83.90
21 0.34 1.08 0.43 13.0029 0.55 5.63 3.97 43.9030* 1.30 1.07 0.97 60.00
April11 1.27 6.40 3.40 66.0022 0.49 0.17 0.05 13.0026 0.80 3.40 0.99 31.00
May26 1.24 4.12 3.54 70.0028 1.47 0.57 0.14 67.23
June1 1.14 3.98 3.11 55.00
21 0.2122 1.76 4.28 4.54 68.7523* 0.03 0.60 0.64 ND
Total 79.90 54.05Average 2.85 1.93 8.6 59.3 182 0.1Minimum 0.17 0.05 10.00 6.5 6.8 26.7 10 0.0Maximum** 10.50 6.76 102.81 8.2 11.2 101.0 126000 1.2
No. of Times CSO Activated 26No. of Days CSO Activated 28ND = No Data; * = continued from previous day; ** = per the NPDES permit, maximum chlorine residual is the highest single sampl
Table D-1. Somerville Marginal CSO Facility Operations Summary, FY03
D-1

TimesJul Aug Sep Oct Nov Dec Jan Feb Mar Apr May Jun AVG MAX Detected
Metals (ug/L)CADMIUM ~ ~ ~ 0.32 0.23 0.38 NA ~ ~ 0.34 ~ ~ 0.32 0.38 4 of 8COPPER ~ ~ ~ 27.20 17.00 20.50 NA ~ ~ 25.60 ~ ~ 22.58 27.20 4 of 4LEAD ~ ~ ~ 44.70 22.60 48.10 NA ~ ~ 26.30 ~ ~ 35.43 48.10 4 of 4MERCURY ~ ~ ~ 0.06 0.03 0.14 NA ~ ~ 0.06 ~ ~ 0.07 0.14 4 of 4NICKEL ~ ~ ~ 4.41 3.68 6.28 NA ~ ~ 2.35 ~ ~ 4.18 6.28 4 of 6ZINC ~ ~ ~ 126.00 63.90 101.00 NA ~ ~ 93.70 ~ ~ 96.15 126.00 4 of 4
Surfactants (mg/L)SURFACTANTS ~ ~ ~ 0.56 0.05 0.70 NA ~ ~ 0.55 ~ ~ 0.46 0.70 4 of 4
TimesJul Aug Sep Oct Nov Dec Jan Feb Mar Apr May Jun AVG MAX Detected
Metals (lbs/day)CADMIUM ~ ~ ~ 0.02 0.003 0.01 NA ~ ~ 0.003 ~ ~ 0.01 0.02 4 of 8COPPER ~ ~ ~ 0.004 0.22 0.55 NA ~ ~ 0.21 ~ ~ 0.25 0.55 4 of 4LEAD ~ ~ ~ 0.50 0.29 1.28 NA ~ ~ 0.22 ~ ~ 0.57 1.28 4 of 4MERCURY ~ ~ ~ 0.001 0.0004 0.004 NA ~ ~ 0.0005 ~ ~ 0.00 0.00 4 of 4NICKEL ~ ~ ~ 0.05 0.05 0.17 NA ~ ~ 0.02 ~ ~ 0.07 0.17 4 of 6ZINC ~ ~ ~ 1.42 0.83 2.69 NA ~ ~ 0.77 ~ ~ 1.43 2.69 4 of 4
Surfactants (lbs/day)SURFACTANTS ~ ~ ~ 6.25 0.64 18.57 NA ~ ~ 4.53 ~ ~ 7.50 18.57 4 of 4
NA: No activation~: No data or no sample takenResults in bold indicate one or more detects in the month.Yearly averages are calculated from individual results collected in the fiscal year.Non-detected compounds are assumed to equal one half of the detection limit for metals and inorganics and one tenth of the reporting limit for organic compounds.
Table D-2. Somerville Marginal CSO Facility Effluent Characterization, FY03
Table D-3. Somerville Marginal CSO Facility Effluent Loadings, FY03
D-2

Appendix E Table E-1 Fox Point CSO Facility Operations Summary, Fiscal Year 2003 Table E-2 Fox Point CSO Facility Effluent Characterization, Fiscal Year 2003 Table E-3 Fox Point CSO Facility Effluent Loadings, Fiscal Year 2003

Discharge Total Peak Effluent Effluent Fecal ChlorineDate Rainfall Duration Volume Flow pH BOD TSS Coliform Residual
(inches) (hours) (MG) (MG) (SU) (mg/L) (mg/L) (col/100 ml) (mg/L)July
9 0.61 0.50 2.43 14.0019 0.20 0.43 0.34 23.0023 0.46 1.73 0.649 21.0029 0.00 0.28 0.22 27.50
August29 0.84 3.90 2.35 18.50 7.7 4.37 69.0 10 0.08
7.9 36.0 10 0.057.1 80.0 60 0.08
September15 0.2516 0.20 0.38 1.00 ND22 0.1123 0.91 2.23 2.89 36.60
October16 0.71 1.98 1.37 32.40 7.2 4.0 25.5 10 0.026 1.74 3.00 2.465 43.00
November6 0.88 4.05 2.83 24.09 8.2 1.8 126.0 10 0.03
8.1 24.0 10 0.0412 0.69 3.33 2.08 29.00 7.0 14.0 25.0 10 0.0
8.0 43.0 10 0.013 0.58 1.80 1.16 13.0016 0.4717 1.25 5.33 3.23 23.14 7.9 2.86 20.5 10 0.66
7.7 19.0 10 0.018 0.19 2.57 0.86 27.4022 0.56 1.73 1.10 25.00
December11 0.22 0.17 0.06 15.0012* 0.52 3.52 1.68 17.3014 1.99 7.67 4.70 28.0015* 0.00 1.00 0.61 ND20 1.11 4.75 3.28 79.00
January3 0.514 0.50 2.62 2.02 24.70
February22 0.69 4.43 3.09 33.8023 0.51 3.17 2.47 29.10
March2 0.85 4.07 5.71 50.20
29 0.5030 1.30 6.30 7.16 30.30
April11 1.27 7.50 5.01 28.7012* 0.45 3.00 2.01 ND22 0.49 0.75 0.47 18.0026 0.80 3.97 1.46 13.00
May26 1.24 2.58 2.88 24.1028 1.47 1.72 2.36 87.90
June1 1.14 4.70 1.71 35.75
22 1.76 2.27 4.27 75.00Total 97.43 75.92Average 2.95 2.30 5.4 43.2 11 0.1Minimum 0.17 0.06 13.00 7.0 1.8 19.8 10 0.0Maximum** 7.67 7.16 87.90 8.2 14.0 75.0 18 0.7
No. of Times CSO Activated 30 No. of Days CSO Activated 33ND = No Data; * = continued from previous day; ** = per the NPDES permit, maximum chlorine residual is the highest single sample
Table E-1. Fox Point CSO Facility Operations Summary, FY03
E-1

TimesJul Aug Sep Oct Nov Dec Jan Feb Mar Apr May Jun AVG MAX Detected
Metals (ug/L)CADMIUM ~ 0.37 ~ <0.15 <0.03 ~ ~ ~ ~ ~ ~ ~ 0.12 0.37 1 of 5COPPER ~ 13.20 ~ 6.71 22.16 ~ ~ ~ ~ ~ ~ ~ 14.02 35.50 5 of 5LEAD ~ 23.20 ~ 8.78 30.60 ~ ~ ~ ~ ~ ~ ~ 23.29 55.50 4 of 5MERCURY ~ 0.09 ~ 0.02 0.06 ~ ~ ~ ~ ~ ~ ~ 0.06 0.09 4 of 4NICKEL ~ 3.37 ~ 5.99 3.31 ~ ~ ~ ~ ~ ~ ~ 4.22 5.99 3 of 5ZINC ~ 94.40 ~ 53.90 76.55 ~ ~ ~ ~ ~ ~ ~ 75.35 102.00 4 of 4
Surfactants (mg/L)SURFACTANTS ~ 0.31 ~ 0.08 0.04 ~ ~ ~ ~ ~ ~ ~ 0.14 0.31 3 of 3
TimesJul Aug Sep Oct Nov Dec Jan Feb Mar Apr May Jun AVG MAX Detected
Metals (lbs/day)CADMIUM ~ 0.01 ~ 0.001 0.0004 ~ ~ ~ ~ ~ ~ ~ 0.003 0.01 1 of 5COPPER ~ 0.26 ~ 0.08 0.52 ~ ~ ~ ~ ~ ~ ~ 0.286 0.84 5 of 5LEAD ~ 0.45 ~ 0.10 0.72 ~ ~ ~ ~ ~ ~ ~ 0.426 1.31 4 of 5MERCURY ~ 0.002 ~ 0.0002 0.002 ~ ~ ~ ~ ~ ~ ~ 0.001 0.003 4 of 4NICKEL ~ 0.07 ~ 0.07 0.08 ~ ~ ~ ~ ~ ~ ~ 0.071 0.08 3 of 5ZINC ~ 1.85 ~ 0.62 1.81 ~ ~ ~ ~ ~ ~ ~ 1.424 2.41 4 of 4
Surfactants (lbs/day)SURFACTANTS ~ 6.06 ~ 0.86 0.98 ~ ~ ~ ~ ~ ~ ~ 2.633 6.06 3 of 3
NA: No activation~: No data or no sample takenResults in bold indicate one or more detects in the month.Yearly averages are calculated from individual results collected in the fiscal year.Non-detected compounds are assumed to equal one half of the detection limit for metals and inorganics and one tenth of the reporting limit for organic compounds.
Table E-2. Fox Point CSO Facility Effluent Characterization, FY03
Table E-3. Fox Point CSO Facility Effluent Loadings, FY03
E-2

Appendix F Table F-1 Commercial Point CSO Facility Operations Summary, Fiscal Year 2003 Table F-2 Commercial Point CSO Facility Effluent Characterization, Fiscal Year 2003 Table F-3 Commercial Point CSO Facility Effluent Loadings, Fiscal Year 2003

Discharge Total Peak Fecal ChlorineDate Rainfall Duration Volume Flow pH Effluent Effluent Coliform Residual
(inches) (hours) (MG) (MG) Min (mg/L) (mg/L) (col/100 ml) (mg/L)July
9 0.61 2.45 1.75 64.4015 0.05 1.43 0.71 ND19 0.20 0.72 1.42 23.7023 0.46 2.21 2.08 24.00
AugustNo Activation
September2 0.51 5.83 1.82 ND
15 0.2516 0.20 4.85 0.57 ND22 0.1123 0.91 1.92 2.13 ND27 0.3028 0.14 0.17 0.29 ND
October16 0.71 2.30 1.25 24.8026 1.74 5.77 2.99 41.50
November6 0.88 1.18 1.11 26.90 8.0 ND 32.0 10 2.96
11 0.0712 0.69 1.35 0.83 22.8816 0.4717 1.25 2.55 5.01 26.00 7.0 12.4 148.0 10 0.0118 0.19 0.83 1.00 19.0022 0.56 0.87 0.67 19.00
December11 0.2212 0.52 1.33 1.26 26.9014 1.99 14.70 7.30 41.8020 1.11 3.67 1.47 27.90
January3 0.514 0.50 3.00 2.52 30.00
February22 0.69 3.00 3.69 60.0023 0.51 3.20 2.70 34.60
March2 0.85 3.75 4.23 65.40
29 0.5530 1.30 7.80 1.65 25.50
April11 1.27 6.32 2.34 53.20 6.9 9.46 181.0 20 9.70
7.8 121.0 10 0.146.7 46.0 10 0.00
12* 0.45 3.17 1.17 ND22 0.49 0.10 0.16 14.0026 0.80 1.17 1.11 38.50
May25 0.0826 1.24 3.48 3.55 52.00 6.4 19.8 105.0 10 4.20
7.1 156.0 20 2.8028 1.47 0.17 0.05 12.80
June1 1.14 4.17 3.53 87.70
22 1.76 4.38 3.48 70.0023* 0.03 0.83 0.66 ND
Total 98.67 64.50Average 3.08 2.02 13.9 106.6 12 2.4Minimum 0.10 0.05 12.80 6.4 9.5 32.0 10 0.0Maximum** 14.70 7.30 87.70 8.0 19.8 148.0 14 9.7
No. of Times CSO Activated 30 No. of Days CSO Activated 32ND = No Data; * = continued from previous day; ** = per the NPDES permit, maximum chlorine residual is the highest single sample
Table F-1. Commercial Point CSO Facility Operations Summary, FY03
TSSBOD
F-1

TimesJul Aug Sep Oct Nov Dec Jan Feb Mar Apr May Jun AVG MAX Detected
Metals (ug/L)CADMIUM ~ NA ~ ~ 0.18 ~ ~ ~ ~ 0.38 ~ ~ 0.28 0.38 2 of 3COPPER ~ NA ~ ~ 26.50 ~ ~ ~ ~ 22.30 ~ ~ 24.40 26.50 2 of 2LEAD ~ NA ~ ~ 32.20 ~ ~ ~ ~ 67.40 ~ ~ 49.80 67.40 2 of 2MERCURY ~ NA ~ ~ 0.05 ~ ~ ~ ~ 0.43 ~ ~ 0.24 0.43 2 of 2NICKEL ~ NA ~ ~ 2.91 ~ ~ ~ ~ 5.11 ~ ~ 4.01 5.11 3 of 3ZINC ~ NA ~ ~ 77.10 ~ ~ ~ ~ 109.00 ~ ~ 93.05 109.00 2 of 2
Surfactants (mg/L)SURFACTANTS ~ NA ~ ~ 0.27 ~ ~ ~ ~ 0.44 ~ ~ 0.35 0.44 2 of 2
TimesJul Aug Sep Oct Nov Dec Jan Feb Mar Apr May Jun AVG MAX Detected
Metals (lbs/day)CADMIUM ~ NA ~ ~ 0.002 ~ ~ ~ ~ 0.01 ~ ~ 0.005 0.01 2 of 3COPPER ~ NA ~ ~ 0.25 ~ ~ ~ ~ 0.44 ~ ~ 0.34 0.44 2 of 2LEAD ~ NA ~ ~ 0.30 ~ ~ ~ ~ 1.32 ~ ~ 0.81 1.32 2 of 2MERCURY ~ NA ~ ~ 0.0004 ~ ~ ~ ~ 0.008 ~ ~ 0.004 0.01 2 of 2NICKEL ~ NA ~ ~ 0.03 ~ ~ ~ ~ 0.10 ~ ~ 0.06 0.10 3 of 3ZINC ~ NA ~ ~ 0.71 ~ ~ ~ ~ 2.13 ~ ~ 1.42 2.13 2 of 2
Surfactants (lbs/day)SURFACTANTS ~ NA ~ ~ 2.45 ~ ~ ~ ~ 8.66 ~ ~ 5.56 8.66 2 of 2
NA: No activation~: No data or no sample takenResults in bold indicate one or more detects in the month.Yearly averages are calculated from individual results collected in the fiscal year.Non-detected compounds are assumed to equal one half of the detection limit for metals and inorganics and one tenth of the reporting limit for organic compounds.
Table F-2. Commercial Point CSO Facility Effluent Characterization, FY03
Table F-3. Commercial Point CSO Facility Effluent Loadings, FY03
F-2

G-1
Appendix G: NPDES Monitoring Requirements
Overview The Environmental Protection Agency (EPA) mandates that any discharge to a body of water must be permitted through the National Pollutant Discharge Elimination System (NPDES). The EPA and the Massachusetts Department of Environmental Protection (DEP) jointly issued a NPDES permit to MWRA for the Deer Island treatment plant and six CSO treatment facilities: Cottage Farm, Prison Point, Somerville Marginal, Constitution Beach, Fox Point, and Commercial Point. The limits set in the MWRA NPDES permit are limitations for secondary treatment plants. In March 2001, secondary Battery C underwent start-up at Deer Island, substantially finishing the construction process at the plant. Before the completion of Battery C, though, plant effluent was already largely in compliance with the new permit. Additionally, in September of 2000, Constitution Beach, one of the six permitted CSO facilities, shut down, leaving five permitted and operational CSO facilities. In addition, MWRA monitors the influent quality of wastewater. Those monitoring results provide the basis for determining the adequacy of existing local limits to protect the treatment plants and Boston Harbor. Local Limits, enforced by MWRA’s Toxic Reduction and Control (TRAC) department, allow the discharge of toxic chemicals from industrial sources to be regulated. The MWRA submitted proposed local limits in FY00 reflecting the new secondary treatment requirements. Regulators approved the new local limits and they became effective in June 2003, at the end of FY03. Under the pretreatment program requirements, local limits must be re-evaluated every five years. MWRA not only monitors to comply with the NPDES effluent requirements, but also has its own monitoring programs, including monitoring at DITP, Boston Harbor, and Massachusetts Bay. These monitoring programs serve to assure appropriate control of discharges to the system, to assure the most cost-effective wastewater treatment while meeting water quality standards, and to assure the quality of life of the organisms and health of the animal communities living in the receiving waters.
G.1 NPDES Permit
Under the NPDES permit, “in compliance with the provisions of the Clean Water Act, as amended, 33 U.S.C. §§ 1251 et seq., and the Massachusetts Clean Water Act, as amended, Mass. Gen. Laws, ch. 21, §§ 26-53, Massachusetts Water Resources Authority is authorized to discharge from MWRA Publicly Owned Treatment Works, Deer Island Treatment Plant, Deer Island, Boston, MA 02152 (Discharge serial number T01), which discharges to receiving waters located in Massachusetts Bay, which is adjacent to Cape Cod Bay, and a part of the Gulf of Maine; and from Combined Sewer Overflow Outfalls, which discharge to the Charles River, Inner Harbor, Mystic River, Boston Harbor, Dorchester Bay, Alewife Brook; in accordance with effluent limitations, monitoring requirements and other conditions set in the permit…”
G-2
G.1.a Monitoring Requirements and Effluent Limitations
The NPDES permit establishes monitoring requirements for the new Deer Island outfall tunnel (T01). The permit also regulates CSO treatment facility outfalls at Cottage Farm (MWR201), Prison Point (MWR203), Somerville Marginal (which has two outfalls from a single facility, the primary outfall, MWR205, and the relief outfall, MWR205A), Constitution Beach (MWR207, now closed), Fox Point (MWR209), and Commercial Point (MWR211). The permit also establishes a comprehensive receiving water monitoring plan, the Ambient Monitoring Plan, in Massachusetts Bay.
G.1.b Reporting Requirements
In addition to Deer Island and CSO monitoring requirements, the NPDES permit requires numerous reports on the state of MWRA sewerage and operational systems. These include reports on infiltration/inflow, CSO facilities and collection systems maintenance and inspection, operational upsets, dry weather and sanitary sewer overflows, operational bypasses, monthly Discharge Monitoring Reports (DMRs), and reporting on the effects of discharges through the Ambient Monitoring Plan. In addition, the Contingency Plan mandates a number of additional thresholds and stipulates actions needed if they are exceeded. Table G-1 presents a summary of the permit limits and monitoring requirements for Deer Island and Table G-2 does the same for the CSOs.

G-3
Table G-1. Effluent Limitations and Monitoring Requirements for DITP Outfall T01
Discharge Limitation Effluent Characteristic Average Monthly Average Weekly Maximum Daily Flow Report* N/A Report Dry Day Flow 436 MGD N/A Report cBOD 25 mg/L 40 mg/L Report TSS 30 mg/L 45 mg/L Report pH Not less than 6.0 nor greater than 9.0 at any time. Fecal Coliforma N/A 14,000
colonies/100mL 14,000
colonies/100mL Chlorine, Total Residual 456 µg/L N/A 631 µg/L PCBs, Arochlors: 1016, 1221, 1232, 122, 1248, 1254, 1260
0.000045 µg/L N/A Report
Settleable Solids N/A Report Report Chlorides, Influent N/A N/A Report Mercury Report N/A Report Chlordane Report N/A Report 4,4-DDT Report N/A Report Dieldrin Report N/A Report Heptachlor Report N/A Report Ammonia-Nitrogen Report N/A N/A Total Kjeldahl Nitrogen Report N/A N/A Total Nitrate Report N/A N/A Total Nitrite Report N/A N/A Cyanide, Total Report N/A Report Copper, Total Report N/A Report Arsenic, Total Report N/A Report Hexachlorobenzene Report N/A Report Aldrin Report N/A Report Heptachlor Epoxide Report N/A Report PCBs, Total Report N/A Report Volatile Organic Compounds
Report N/A Report
LC50b
Tests involve using mysid shrimp (Mysidopsis bahia) and inland silverside (Menidia beryllina) in 48 hour acute toxicity tests. LC50 must be achieved in a solution that is 50% effluent.
C-NOECc C-NOEC tests involve larval inland silverside (Menidia beryllina) and sea urchin (Arbacia punctulata). Menidia tests involve a week’s worth of exposure to various effluent concentrations. The Arbacia toxicity test tests fertilization in the test organism. In both cases, no chronic effects must be observed in a solution composed of 1.5% effluent.
Footnotes *, a, b, and c are listed underneath Table G-2 on the next page.

G-4
Table G-2. Effluent Limitations and Monitoring Requirements for CSO Outfalls
Discharge Limitation Effluent Characteristic Average Monthly Average Weekly Rainfall Report* Report Flow Report Report TSS Report Report BOD Report Report Chlorine, Total Residual 0.1 mg/L 0.25 mg/L max hourly pH Not less than 6.5 nor greater than 8.5 Fecal Coliform Must meet Massachusetts Water Quality Standards LC50b Since Cottage Farm and Somerville Marginal’s relief outfall both
discharge in freshwater, acute toxicity tests are required with daphnids (Ceriodaphnia dubia) and fathead minnows (Pimpephales promelas). There is no limit to effluent concentration used to determine LC50, but results are reportable.
All other CSO facilities discharge to marine waters, so the acute test organisms are mysid shrimp (Mysidopsis bahia) and inland silverside (Menidia beryllina). LC50 results are reportable.
* No limit, but values reported to EPA and DEP. a There are two other fecal coliform limits. The first is that not more than 10% of the individual samples collected in a month can have a count higher than 14,000 colonies/100mL. Typically, given 3 samples a day, this means no more than 9 samples can have a count higher than 14,000 in a given month. The second limit is that no more than 3 consecutive samples can exceed 14,000 colonies/100mL. b LC50: the concentration of effluent in a sample that causes mortality in 50% of the test population at a specific time of observation. c C-NOEC: Chronic No Observed Effect Concentration is the highest concentration of effluent to which organisms are exposed in a life cycle or partial life cycle test which has no adverse effects (on growth, survival and reproduction).
G.2 Monitoring Programs
In FY03, MWRA conducted several monitoring programs. However, this report presents only the influent and effluent monitoring programs. The receiving water monitoring programs are too complex to cover in a single document. More information on monitoring in Massachusetts Bay and Boston Harbor can be found at: http://www.mwra.com/harbor/html/bhrecov.htm
G.2.a Treatment Plant Monitoring
Monitoring at DITP has two main components: influent monitoring and effluent monitoring. Influent monitoring characterizes the influent to the Deer Island Treatment Plant. Monitoring for conventional parameters is necessary for some parameters to meet NPDES reporting requirements, but monitoring many other parameters is critical for process control to ensure optimal plant functioning. Influent monitoring data provides influent loading rates and the basis for determining treatment plant efficiency. Influent monitoring for non-conventional parameters is an important part of MWRA’s source reduction and Local Limits program run by TRAC. Effluent monitoring characterizes the quality of the effluent discharged to Massachusetts Bay. With the addition of whole effluent toxicity (WET) testing, the parameters measured in the effluent are similar to those measured in the influent. The NPDES permit requires effluent monitoring and imposes permit limits on both conventional and priority pollutants to ensure the health of the receiving water. Additionally, the permit also requires the reporting of non-priority pollutants such as nutrients, although no limits are set on them. Table G-3 lists the treatment plant monitoring program parameters, including

G-5
sample type, sampling frequency and analytical procedures used.
G.2.b Combined Sewer Overflow Facilities Monitoring Program
The CSO Monitoring Program includes influent and effluent monitoring at the five CSO facilities (the sixth, Constitution Beach, was closed in early FY01). Influent and effluent samples are collected and tested for conventional parameters at all five CSO facilities. Selected priority pollutants and metals are also analyzed in the effluent. Table G-4 lists the CSO monitoring program parameters, including sample type, sampling frequency and analytical procedures used.
G.2.c Sewer System Monitoring Program
The sewer system monitoring program, which attempts to identify Sanitary Sewer Overflows (SSOs), involves conducting visual inspections of areas in the separate sewer system that have a history of discharging during or shortly after a heavy rainfall event. Because of the hydraulics of the South System, discharges occur in manholes or other low-lying areas, while discharges in the North System are the result of combined sewage overwhelming sewage system capacity.
G.3 Treatment of Results
It can be difficult to interpret laboratory results to ensure that they are representative of the sample, especially when the results are at or below method detection levels. For the conventional parameters measured in these monitoring programs, calculating the average concentration of a particular parameter is straightforward: the arithmetic average is used. However, the concentrations of metals, pesticides and organics are frequently below method detection levels, and data are manipulated. Appendix J gives a brief description of method detection limits and how measurements below detection limits are treated in this report. Daily loadings (in lbs/day) were calculated using the formula:
34.8××= CQLoading Q = flow (mgd)
C = concentration (mg/L) 8.34 = unit conversion factor
To calculate monthly average concentrations for priority pollutants (metals, cyanide, pesticides/PCBs and organic compounds), the loadings of the pollutant during each sampling event for that month were added and then divided by the total flow during those events. Average annual concentrations were calculated using the same method, taking each individual sampling event into account in the calculation. It should be kept in mind that with the large flows going through the Deer Island Treatment Plant, taking one small sample might not always be truly representative. It is also important to keep in mind that certain parameters (conventional) were analyzed daily while other parameters (priority pollutants)

G-6
were analyzed only two or three times per month.
Table G-3. POTW Monitoring Program Sampling Frequency
Parameter Sample Type1 Influent Effluent Analytical Method2
Metals Aluminum Composite 2 x month Weekly 200.7 Antimony Composite 2 x month 2 x month 200.7 Arsenic Composite 2 x month 2 x month 200.7, 206.2 Beryllium Composite 2 x month 2 x month 200.7 Boron Composite 2 x month 2 x month 200.7 Cadmium Composite 2 x month Weekly 200.7, 213.2 Chromium Composite 2 x month Weekly 200.7, 218.2 Chromium (Hexavalent) Composite 2 x month 2 x month 3500-CRD3 Copper Composite 2 x month Weekly 200.7, 200.8, 220.2 Iron Composite 2 x month 2 x month 200.7 Lead Composite 2 x month Weekly 200.7, 239.2 Mercury Composite 2 x month Weekly 245.2, 1631 Molybdenum Composite 2 x month Weekly 200.7, 246.2 Nickel Composite 2 x month Weekly 200.7, 249.2 Selenium Composite 2 x month 2 x month 200.7, 270.2 Silver Composite 2 x month Weekly 200.7, 272.2 Thallium Composite 2 x month 2 x month 200.7, 279.2 Zinc Composite 2 x month Weekly 200.7 Organics and Other Compounds Cyanide Grab 2 x month 4 x month 335.2 Fats, Oils, and Grease Grab 2 x month Weekly 1664 MBAS Composite 2 x month 2 x month 425.1 PAHs Composite 2 x month Weekly PCBs Composite 2 x month Weekly 8080 MOD Pesticides Composite 2 x month Weekly 608 Petroleum Hydrocarbons Grab 2 x month Weekly 418.1 Phenol Composite 2 x month Weekly 420.2 MO Semi-volatile Organics Composite 2 x month 2 x month 625 Sulfate Composite 2 x month * 300.0 Total Organic Carbon Composite * 2 x month 415.1 Volatile Organics Grab 2 x month 2 x month 624 Whole Effluent Toxicity Composite * 1 x month WET Test Protocols Conventional Biochemical O2 Demand Composite Daily Daily 5210 B3 Carbonaceous BOD Composite Daily Daily 5210 B3 Chemical O2 Demand Composite Daily Daily HACH 8000 Chlorides Composite Daily Daily 300.0 Enterococci Grab * Daily 9230 C3 Fecal Coliform Grab * 3 x Daily 9222 D3 pH Grab Daily Daily 150.1 Settleable Solids Grab Daily Daily 160.5 Temperature Grab Daily Daily 170.1 Total Chlorine Residual Grab * 3 x Daily 330.5 Total Coliform Grab * 3 x Daily 9222 B3 Total Suspended Solids Composite Daily Daily 160.2 Nutrients Alkalinity Composite Weekly * 310.1 Ammonia Composite Weekly Weekly 350.1 Nitrates Composite Weekly Weekly 353.2 Nitrate/Nitrite Composite * Weekly 353.2 Nitrites Composite Weekly Weekly 353.2 Orthophosphorus Composite Weekly * 365.1 Total Kjeldahl Nitrogen Composite Weekly Weekly 4500 N3 Total Phosphorus Composite Weekly * 365.1 * No sampling. 1 Influent and effluent composite samples are 24-hour time composite samples. 2 EPA Methods. 3 Standard Methods.

G-7
Table G-4. CSO Monitoring Program
Parameter Sample Type Sampling
Frequency Analytical Method1 Biochemical O2 Demand Grab/Composite3 4 x year 5210 B2 Fecal Coliform Grab4 4 x year 9222 D2 pH Grab 4 x year 150.1 Total Chlorine Residual Grab3 4 x year 330.5 Total Suspended Solids Grab3 4 x year 160.2 Whole Effluent Toxicity Composite5 2 x year WET Test Protocols 1 EPA Methods. 2 Standard Methods. 3 A grab sample must be collected within the first 2 hours of activation (30 minutes for Somerville Marginal in the first permit year) and then hourly samples are to be taken for the duration of the overflow, for not longer than 24 hours. All BOD samples are then composited. 4 A grab sample must be collected within the first 2 hours of activation (30 minutes for Somerville Marginal in the first permit year) and then hourly samples are to be taken for the duration of the overflow, for not longer than 24 hours. During the first permit year, the first sample is held and subsampled hourly for fecal coliforms. 5 Cottage Farm and the Somerville Marginal relief outfall discharge to freshwater so the organisms used for toxicity testing are the daphnid Ceriodaphnia dubia and the fathead minnow Pimpephales promelas. The other facilities discharge to marine waters, so the test organisms are the inland silverside Menidia beryllina and the mysid shrimp Mysidopsis bahia.

H-1
Appendix H: An Overview of the MWRA Sewerage System and Facilities
Overview The MWRA is responsible for the collection, transport, pumping, treatment,
and disposal of sewage in Boston and the greater Boston area. In addition to the Deer Island Treatment Plant, the MWRA operates another treatment plant, serving the town of Clinton and the Lancaster Sewer District, under special arrangements that originated when the Metropolitan District Commission (MDC) acquired land in Clinton for the Wachusett Reservoir. The Clinton Treatment Plant operates under a separate permit from the Boston NPDES permit and is not discussed in this report. The MWRA serves 43 communities with a total population of about two million people, 5,500 businesses, and 1,400 industries. More than 5,400 miles of town- and city-owned local sewers connect at over 1,800 points to over 230 miles of MWRA interceptor sewers. Also included in the vast sewerage system are eleven pumping stations, five headworks, over 80 combined sewer relief overflows and six CSO treatment facilities. Table H-1 lists the MWRA treatment facilities and relevant information pertaining to each facility. The Deer Island Treatment Plant in Winthrop serves the 43 communities in the metropolitan Boston sewerage system and is allowed to discharge under the Boston NPDES Permit. The sewerage system is divided into two major regions: the North and the South Systems. Table H-2 lists the sewerage service area population by community.

H-2
Facility LocationFirst Year of Operation Treatment Process
Design Flow (mgd) Conduit Size In Conduit Size Out
Outfall Number Receiving Water
1997 Primary 55 diffusers over 1.25mi T01 Massachusetts Bay1998 Secondary A&B 9' x 10'* MWR001*2000 Outfall T01 6' x 6.5'* MWR002*2001 Secondary C 9' diameter* MWR004*
9' diameter* MWR005*60" outfall* 101*60" outfall* 102*60" outfall* 103*Spillway* Spillway* Hingham Bay
Screening 72" N. Charles ReliefSettling 42" S. Charles ReliefChlorination 54" Brookline
2001 DechlorinationScreeningSettlingChlorination
2001 DechlorinationScreening 7' x 7.5'Chlorination 84" diameter
2001 DechlorinationScreeningChlorinationScreeningChlorination
* Maintained for emergency use only
† Rehabilitated in 1988
Publicly Owned Treatment Works (POTWs)
Combined Sewer Overflow (CSO) Facilities1971
Deer Island Treatment Plant
Deer Island, Winthrop, MA
Nut Island Headworks
Nut Island, Quincy, MA
360
Boston Harbor
MWR211 Dorchester Bay, Boston Harbor
10' x 12' 10' x 12' MWR209 Dorchester Bay, Boston Harbor
1270
15' x 11' 15' x 11'
8' diameter
Commercial Point Victory Rd., Dorchester, MA
1991 194
Fox Point Freeport St., Dorchester, MA
1989 119
Somerville Marginal McGrath Highway under I-93, Somerville, MA
245 6' x 8'1973†
MWR203 Boston Inner Harbor
MWR205 Mystic River
Prison Point Near Museum of Science bridge, Cambridge, MA
385 10' diameter1980
Table H-1. List of Treatment Facilities and Discharge Locations
Cottage Farm Memorial Dr. near Boston University bridge, Cambridge, MA
233
1998 Pretreatment of South System flows to DITP
96" outfall MWR201 Charles River
Boston Harbor
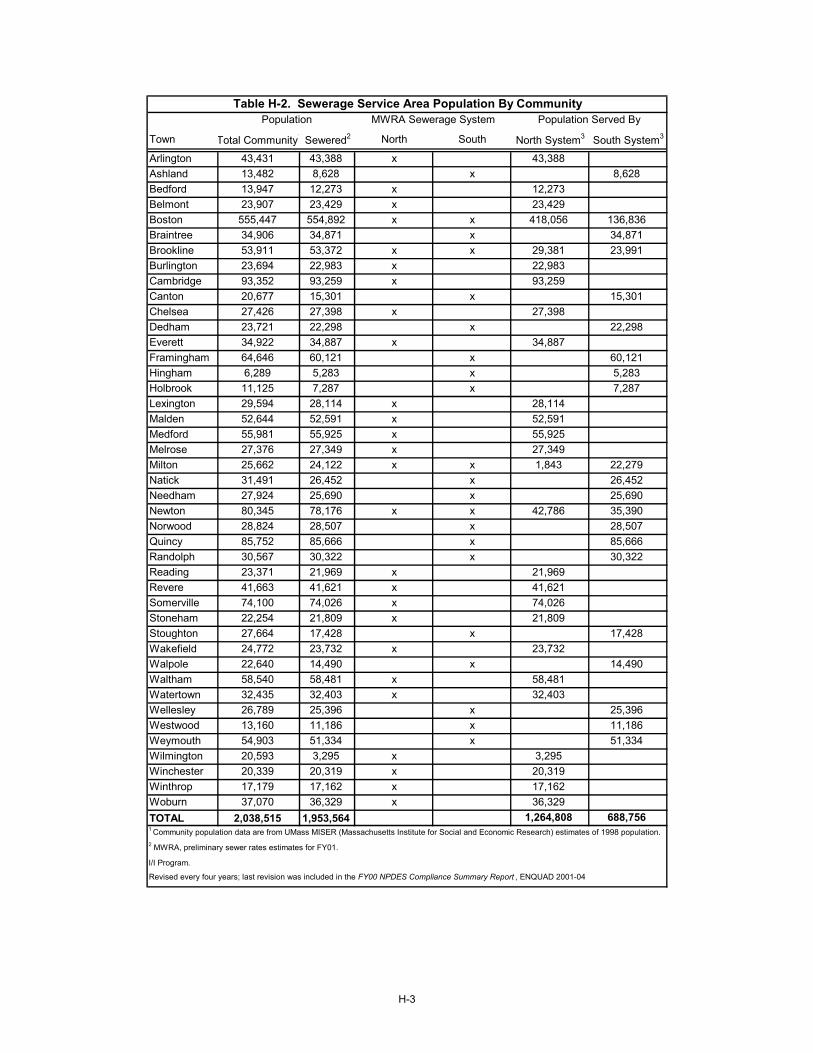
H-3
Town Total Community1 Sewered2 North South North System3 South System3
Arlington 43,431 43,388 x 43,388Ashland 13,482 8,628 x 8,628Bedford 13,947 12,273 x 12,273Belmont 23,907 23,429 x 23,429Boston 555,447 554,892 x x 418,056 136,836Braintree 34,906 34,871 x 34,871Brookline 53,911 53,372 x x 29,381 23,991Burlington 23,694 22,983 x 22,983Cambridge 93,352 93,259 x 93,259Canton 20,677 15,301 x 15,301Chelsea 27,426 27,398 x 27,398Dedham 23,721 22,298 x 22,298Everett 34,922 34,887 x 34,887Framingham 64,646 60,121 x 60,121Hingham 6,289 5,283 x 5,283Holbrook 11,125 7,287 x 7,287Lexington 29,594 28,114 x 28,114Malden 52,644 52,591 x 52,591Medford 55,981 55,925 x 55,925Melrose 27,376 27,349 x 27,349Milton 25,662 24,122 x x 1,843 22,279Natick 31,491 26,452 x 26,452Needham 27,924 25,690 x 25,690Newton 80,345 78,176 x x 42,786 35,390Norwood 28,824 28,507 x 28,507Quincy 85,752 85,666 x 85,666Randolph 30,567 30,322 x 30,322Reading 23,371 21,969 x 21,969Revere 41,663 41,621 x 41,621Somerville 74,100 74,026 x 74,026Stoneham 22,254 21,809 x 21,809Stoughton 27,664 17,428 x 17,428Wakefield 24,772 23,732 x 23,732Walpole 22,640 14,490 x 14,490Waltham 58,540 58,481 x 58,481Watertown 32,435 32,403 x 32,403Wellesley 26,789 25,396 x 25,396Westwood 13,160 11,186 x 11,186Weymouth 54,903 51,334 x 51,334Wilmington 20,593 3,295 x 3,295Winchester 20,339 20,319 x 20,319Winthrop 17,179 17,162 x 17,162Woburn 37,070 36,329 x 36,329TOTAL 2,038,515 1,953,564 1,264,808 688,756
Revised every four years; last revision was included in the FY00 NPDES Compliance Summary Report , ENQUAD 2001-04
1 Community population data are from UMass MISER (Massachusetts Institute for Social and Economic Research) estimates of 1998 population.2 MWRA, preliminary sewer rates estimates for FY01. y p yI/I Program.
Population MWRA Sewerage System Population Served ByTable H-2. Sewerage Service Area Population By Community

H-4
H.1 North System
The North System serves a population of about 1.3 million and is located to the north and west of Boston. It covers an area of about 168 square miles. Most of the North System is a separate system – different conduits carry sanitary wastewater and storm water. However, portions of Boston, Cambridge, Somerville, and Chelsea still have combined sewers, where the same conduits carry sanitary and storm water. Combined sewers serve about 20 percent of the North System service area. Community sewer lines tie into the MWRA system through interceptor lines that feed into the four headworks facilities in the North System. Two deep rock tunnels, the Boston Main Drainage Tunnel (BMDT) and the North Facilities Metropolitan Relief Tunnel (North Metro Relief), connect the three remote headworks to the North Main Pump Station (NMPS) on Deer Island. The seven-mile BMDT originates at the Ward Street Headworks, continues to the Columbus Park Headworks, and runs under Boston Harbor to the NMPS. The four-mile North Metro Relief Tunnel connects the Chelsea Creek Headworks to the NMPS. The two tunnels combined can handle approximately 800 mgd, matching the combined peak flow capacity of 788 mgd from the three remote headworks. A fourth headworks facility, the Winthrop Terminal, is located on Deer Island and receives flows from the city of Winthrop and the East Boston (Caruso) Pump Station through the North Metro Trunk Sewer. Figure H-1 on the next page shows the North System schematics. The MWRA North System has four pump stations. The Alewife Brook (64 mgd), Caruso (110 mgd), DeLauri (90 mgd), and Allison Hayes (11 mgd) pump stations convey wastewater to the headworks facilities. The four pump stations receive flow from interceptor lines as follows: Alewife Brook Pump Station Lexington Branch Sewer Alewife Branch Sewer Alewife Branch Conduit Caruso Pump Station Revere Branch Sewer East Boston Branch Sewer North Metro Relief Sewer* DeLauri Pump Station Cambridge Branch Sewer Charlestown Branch Sewer Medford-Somerville Branch Sewer Prison Point Pump Station Somerville Marginal CSO Overflow** Allison Hayes Pump Station Wakefield Branch Sewer
H.1.a North System Pump Stations
*: When flow to the Chelsea Creek Headworks is held back, wastewater is diverted to the Caruso Pump Station. **: During low-intensity rainfall when line capacity is not exceeded, the combined wastewater is pumped back to the trunk sewers and ultimately to the DeLauri station.

H-5
* See Figure H-4 for South System hydraulics.
Figure H-1. North System Pump Stations, Headworks, CSOs and Tunnel Hydraulic Schematic
Boston Marginal Conduit
Cambridge Marginal ConduitPrison Point CSO
E. Boston Branch Sewer
Chelsea Branch Sewer
Revere Branch SewerEast Boston
(Caruso)Pump Station
MWR203
WinthropTerminal
Headworks
North Metro
Trunk Sewer
Allison HayesPump Station
Wakefield Branchand Trunk Sewers
Millbrook ValleySewer and Relief Sewer
North MetroSewer and Relief Sewer
AlewifePump Station
North Metro Relief Sewer
ChelseaCreek
Headworks
Alewife Branch Sewer
Alewife Branch Conduit
Lexington Branch SewerDeLauri
Pump Station
North Metro Sewer
NorthMain Pump
Station
Deer IslandWastewaterTreatment
Plant
T01North Metro
Relief Tunnel
Charlestown Branch SewerCambridge Branch Sewer
Somerville-Medford Branch
Cottage Farm CSO
MWR201
Somerville Marginal CSO
MWR205
Ward StreetHeadworks
Boston Main Drainage Tunnel
North Charles Metro Sewer
South Charles Relief Sewer
Charles River Valley Sewer
Columbus Park
Headworks
Boston Main Interceptor
Dorchester Interceptor
Fox Point CSO
MWR209
Commercial Point CSO
MWR211
South System Pump
Station*
From Nut Island Headworks via the Inter-Island Tunnel

H-6
The Deer Island Treatment Plant receives North System flow from three remote headworks and the Winthrop Terminal headworks. The three remote headworks: Ward Street Headworks (256 mgd) located in Roxbury, Columbus Park Headworks (182 mgd) in South Boston, and Chelsea Creek Headworks (350 mgd) in Chelsea, have a combined pumping capacity of 788 mgd. The Winthrop Terminal Headworks (125 mgd) is located on Deer Island. The four North System headworks receive flows from interceptor lines or pump stations as follows: Ward Street Headworks South Charles Relief Sewer Charles River Valley Sewer North Charles Metro Sewer* Cottage Farm CSO* Columbus Park Headworks Boston Main Interceptor Dorchester Interceptor Chelsea Creek Headworks Alewife Pump Station North Metro Relief Sewer DeLauri Pump Station Caruso Pump Station Overflow Winthrop Terminal Headworks Winthrop Sewer Caruso Pump Station**
H.1.b North System Headworks
*: During low intensity rainfall when line or holding capacity is not exceeded, the combined wastewater is pumped back to the trunk sewers and ultimately to the Ward Street Headworks. **: Overflow from the Caruso Pump Station.
H.1.c Combined Sewer Overflow Facilities
The conditions for discharge of effluent from six CSO chlorination facilities are also included in MWRA’s Boston NPDES permit. These six facilities, Cottage Farm and Prison Point in Cambridge, Somerville Marginal in Somerville, Constitution Beach in East Boston, and Fox Point and Commercial Point in Dorchester, discharge to the Charles River, the Inner Harbor, the Mystic River, Winthrop Bay, Dorchester Bay and Dorchester Bay, respectively. Constitution Beach was closed in September 2000, leaving five active permitted CSO facilities. Discharge of combined wastewater from a CSO treatment facility outfall to a receiving body of water is defined in this report as a CSO activation. Discharge of combined wastewater to a non-facility CSO outfall pipe is defined as a CSO overflow. CSO overflows will not be discussed in this report. In general, CSO activations occur as a result of heavy rain, snowmelt, or choking at the headworks.

H-7
Choking is the process by which the headworks restrict the flow to Deer Island. During wet weather, when the wastewater volume exceeds the hydraulic capacity of the treatment plant, the headworks “choke” the flow and hold the wastewater in the lines. As a result, the combined wastewater backs up into the system, forcing the combined wastewater to overflow to CSO treatment facilities and non-facility CSO outfall pipes, resulting in potential CSO activations and overflow as well as potential SSOs. In addition to choking in response to hydraulic demand on the system, the headworks may choke so that emergency repairs, system testing, or maintenance work can be performed at the treatment plant. Choking at Ward Street and Columbus Park Headworks influences Cottage Farm activations. Choking at the Columbus Park Headworks can influence activations at Fox Point and Commercial Point CSOs. Backups at the DeLauri Pumping Station brought about by choking at the Chelsea Headworks can activate the Somerville Marginal CSO. At the CSO facilities, the combined wastewater is screened and chlorinated prior to discharge. Of the five CSO facilities, only Cottage Farm and Prison Point have tank storage capacity. This allows the chlorinated wastewater to be held at these facilities prior to discharge. When the CSO facility’s storage capacity is exceeded, treated wastewater overflows and is discharged to the river. The three other CSO facilities are gravity CSO facilities, which means that combined wastewater arrives and leaves the CSO facility by gravity. This type of facility provides disinfection and allows the chlorinated combined wastewater to overflow to the receiving water as quickly as the wastewater arrives at the facility. The five CSO facilities provide treatment for approximately 50% of the CSO volume while the other half overflows in any of 80-plus permitted CSO overflow structures of the sewerage system without the benefit of any type of treatment. Of the more than 80 permitted CSO overflow structures, 53 are located in Boston, 15 in Cambridge, 5 in Chelsea, and 12 in Somerville. These outfalls discharge into Boston Harbor, the Alewife Brook, the Mystic River, the Charles River, and the Neponset River.
Cottage Farm CSO Facility During dry weather conditions, wastewater arrives at the Ward Street Headworks where it is pumped to the Deer Island Plant. Under storm conditions, wastewater backs up into sewer lines and into the Cottage Farm CSO facility. Cottage Farm detains wastewater up to a volume of 1.3 MG. Any excess flow is screened, settled, chlorinated, and discharged to the Charles River through outfall MWR201. Combined wastewater that is held back is pumped back to the Ward Street Headworks. This facility, on-line since 1971, has a design pumping capacity of 233 mgd. An upgrade completed in FY01 adds a dechlorination system for the effluent.

H-8
Prison Point CSO Facility Prison Point is both a dry weather and storm water pumping station. The dry weather phase is a five-mgd capacity sewer pumping station that receives flow from the Boston Marginal Conduit and the Cambridge Marginal Conduit. Prison Point feeds into the DeLauri Pumping Station. The storm water phase has a maximum pumping capacity of 385 mgd. Treatment includes screening, disinfection, and detention. During wet weather, if the dry pumping capacity is exceeded, the combined flow is screened, chlorinated, and held in detention basins. Once the basins fill, treated flow is discharged downstream below the new Charles River Dam at outfall MWR203. Combined wastewater volume that is held back, up to 1.2 MG, is pumped back to the DeLauri Station. This facility came on-line in 1980.
Somerville Marginal CSO Facility Somerville Marginal CSO is an unmanned gravity facility with a design capacity of 245 mgd. It receives wet weather flow from the northeast portion of Somerville and part of Medford. Normally, dry weather flow from these areas arrives at the DeLauri Station via the Somerville-Medford trunk sewers. During wet weather, combined sewer flow backs up to the Somerville CSO facility. Unlike Cottage Farm or Prison Point, this facility does not provide any large-scale detention capacity during storm conditions. Treatment consists of screening and chlorination. Effluent is discharged to the lower Mystic River basin at outfall numbers MWR205. The relief outfall, MWR205A, discharges to freshwater above the dam. MWR205A only activates under specific conditions and the vast majority of discharges are released through MWR205. During low-intensity rainfall when line capacity is not exceeded, the combined wastewater is pumped back from a wet well to the DeLauri Station. This facility came on-line in 1973 and was upgraded in 1988. Figure H-2 on the following page shows a representative gravity CSO schematic applicable to Somerville Marginal as well as the Fox Point and Commercial Point facilities.
Fox Point CSO Facility Fox Point is an unmanned gravity facility with a design capacity of 119 mgd. It receives wet weather flows from the Dorchester Interceptor sewer line. Operation of this facility parallels that of the Constitution Beach CSO; treatment includes screening and disinfection. Effluent is discharged to Dorchester Bay through outfall number MWR209. This facility came on-line in 1989.

H-9
* At Somerville Marginal, injection occurs at the influent gate.
Figure H-2. Typical Gravity Combined Sewer Overflow Treatment Facility
Combined Flow
Gate
Collected Floatable Material
GateControl
AdjustableGate Chain
GuideInjection ofDisinfectant *
BarScreen
SupportColumn
ConveyorChain

H-10
Commercial Point CSO Facility Commercial Point is an unmanned gravity CSO with a design capacity of 194 mgd. This facility also receives wet weather backups from the Dorchester Interceptor. Treatment includes screening and disinfection. Effluent is discharged to Dorchester Bay through outfall number MWR211. This facility came on-line in 1991, and is in the start-up phase.
H.2 South System
The South System serves a population of about 700,000 people and is located to the south and southwest of Boston. The South System covers an area of approximately 237 square miles. Figure H-3 on the following page illustrates the South System hydraulic schematic. Community sewer lines tie into the South System through MWRA interceptor lines. The Framingham Extension Sewer, Wellesley Extension Sewer, Upper Neponset Valley Sewer, Wellesley Extension Relief Sewer, Neponset Valley Sewer, Walpole Extension Sewer, Stoughton Extension Sewer, Braintree-Randolph Trunk Sewer, and several other branch sewers discharge to the South System High Level Sewer. The High Level Sewer has a capacity of 360 mgd. Pump stations move the wastewater through the High Level Sewer to the Nut Island Headworks for preliminary treatment and grit removal. The South System flows are then conveyed to the South System Pump Station at Deer Island through the 4.7-mile Inter-Island Tunnel for treatment at the Deer Island Treatment Plant. Two force mains deliver the South System flow to one of two locations. The South System flow is normally discharged to the effluent channel of the Grit Facility, where it is combined with the North System and recycle flows, then split between Primary Clarifier Batteries A through D. The alternate discharge location is directly to the Primary Clarifier Battery D influent channel, which allows the South System flow to be isolated. Seven MWRA pump stations move wastewater from low-lying areas to the High Level Sewer: Hingham Pump Station (16.5 mgd), Braintree-Weymouth Pump Station (60 mgd), Squantum Pump Station (12 mgd), Houghs Neck Lift Station (2.8 mgd), Neponset Pump Station (90 mgd), Framingham Pump Station (48 mgd) and Quincy Pump Station (52 mgd). The seven pumping stations receive flow from interceptor or community lines as follows: Hingham Pump Station Weymouth-Hingham Sewer Lines Braintree-Weymouth Pump Station Braintree-Randolph Trunk Sewer Braintree-Weymouth Extension Sewer Holbrook Extension Sewer Hingham Pump Station Squantum Pump Station Squantum Sewers Houghs Neck Lift Station Houghs Neck Sewer Neponset Pump Station Neponset Valley Sewer Framingham Pump Station Framingham Sewers
H.2.a South System Pump Stations
Quincy Pump Station Quincy and Upstream Sewers

H-11
* See Figure H-2
Figure H-3. South System Pump Station, Headworks, and Tunnel Hydraulic Schematic
FraminghamPump Station
Framingham Extension
Sewer
Wellesley ExtensionReplacement Sewer
Wellesley ExtensionRelief Sewer
Upper Neponset Valley Sewer
Brighton BranchSewer
Neponset Valley Sewer
West RoxburyTunnel
High Level
Dedham Extension Sewer New Neponset
Pump StationWestwoodExtension Sewer
StoughtonExtension Sewer
New NeponsetValley Sewer
WalpoleExtension Sewer
QuincyPump Station
SquantumPump Station
Houghs NeckPump Station
Nut IslandHeadworks
101
102
103
Braintree/WeymouthPump Station
Braintree-WeymouthSewer
HinghamPump Station
Randolph Trunk Sewer
Holbrook Extension Sewer
South System Pump Station (DITP)*
Spillway
Inter-IslandTunnel

H-12
H.2.b South System Headworks
The Deer Island Treatment Plant receives South System flow from the new Nut Island Headworks. The Nut Island Headworks went on-line on July 7, 1998. It is located in Quincy and has a capacity of 360 mgd. Vortex grit separators similar to those used on Deer Island in the North System Grit Facility provide grit removal for South System flows.
H.3 Deer Island Treatment Plant
Until July 8, 1998, wastewater flows from the North System were treated at the Deer Island Treatment Plant and flows from the South System were treated at the Nut Island Treatment Plant. In July 1998, the Nut Island Treatment Plant was decommissioned and all flows were treated at Deer Island. Four lines convey sewage to the Deer Island Treatment Plant. North System wastewater is delivered to the plant via the Boston Main Drainage Tunnel (from the Ward Street and Columbus Park Headworks), the North Metropolitan Relief Tunnel (from the Chelsea Creek Headworks), and the North Metropolitan Trunk Sewer. South System wastewater is transferred to the plant from the Nut Island Headworks via the Inter-Island Tunnel. The Deer Island Treatment Plant receives wastewater at the North Main Pump Station (NMPS), the Winthrop Terminal, and the South System Pump Station (SSPS). The North Metro Relief Tunnel and the Boston Main Drainage Tunnel connect to the NMPS, which consists of ten pumps, each rated at 110 mgd, for a total pumping capacity of 1,100 mgd. The North Metro Trunk Sewer connects to the Winthrop Terminal. The Inter-Island Tunnel connects to the SSPS, which consists of eight pumps, each rated at 66.7 mgd, for a total capacity of 534 mgd. Grit removal and screening (preliminary treatment), which remove heavy particles and debris, is provided at the remote headworks and on-site at Deer Island. Flow from the South System receives preliminary treatment at the Nut Island Headworks. Grit and screenings are landfilled off-site. The upgraded primary treatment plant came on-line on January 21, 1995. The first battery of secondary treatment was initiated at Deer Island on August 1, 1997. Battery B came on-line on March 1, 1998, and the third and final secondary treatment battery, Battery C, started up on March 8, 2001. Wastewater from the North System flows through the grit chambers for additional grit removal. It, along with South System wastewater, then flows to the primary settling tanks where floatables (consisting mainly of oil, grease, and plastics) rise to the surface while the sludge (consisting of heavy solid particles) settles to the bottom. The majority of the primary effluent (the allowable capacity for secondary treatment) is sent to secondary treatment, while the remaining portion (from high flow conditions due to rainfall) bypasses secondary and is sent directly to the disinfection basins to be treated with sodium hypochlorite. Effluent from secondary treatment is then, if necessary, blended with primary effluent that bypassed secondary, and then sent to the disinfection basins, where it is chlorinated, detained, and then dechlorinated before discharge.

H-13
The scum (floatables) is skimmed off the top of the primary and secondary settling tanks while the sludge (settled solids) is scraped from the bottom of the tanks. Primary scum is pumped to the scum concentrator while the primary sludge is pumped to the gravity sludge thickeners. Scum and sludge from the secondary batteries are concentrated using centrifuges. After the scum and sludge are concentrated and thickened, they are conveyed to the anaerobic digesters for further treatment. The digested sludge/scum is barged to the Fore River Pelletizing Plant, where it is converted into fertilizer (refer to Chapter IV). Methane from the digestion process is stored and used to generate power and heat for DITP. Figure H-4 on the following page presents the Deer Island plant process flow diagram.
H.3.a Deer Island Treatment Plant Outfalls
On September 6, 2000, effluent from Deer Island was diverted to the new 9.5 mile outfall tunnel into Massachusetts Bay. Effluent is discharged through 53 operational risers over the last 1.25 miles of the tunnel. The tunnel has a capacity of 1,270 mgd, slightly greater than the old harbor outfall system. Before the effluent enters the outfall it is used to run a hydroelectric facility linked to the Deer Island power grid. Although sealed and non-operational, the old Deer Island harbor outfalls are subject to periodic inspections and remain available for emergency use. Effluent is channeled through a common conduit to four potential outfall pipes: 001, 002, 004, and 005
H.3.b Nut Island Outfalls
The former Nut Island Treatment Plant discharged treated wastewater through four outfalls. Although the Nut Island Treatment Plant no longer exists, outfalls 101, 102 and 103 remain operational in case of emergency at the Nut Island Headworks. These outfalls discharge to Boston Harbor; the new emergency spillway built concurrently with the new headworks discharges to Hingham Bay.
H.4 Collection and Transport System
An issue of concern in both the North System and the South System is the occurrence of Sanitary Sewer Overflows (SSOs). These occur during extreme rainfall events, when inflow and infiltration from heavy rains exceeds the capacity of the pipes, causing certain areas to become inundated. Whenever there is a high amount of rainfall, a crew from the Transport Department investigates a number of critical areas to visually monitor potential overflow sites. While some of these critical areas are the MWRA’s responsibility, most of them are the responsibility of the local communities. A list of these areas belonging to the MWRA is included in Table H-4 on page H-15. Not all of these areas are checked during every rainfall, and some are monitored by the MWRA only during extreme storm events. Table H-5 shows areas identified by MWRA staff as having the potential to overflow under certain conditions. SSOs have not, as of yet, occurred in these areas.

South System flows are degritted at Nut Island
Wastewater
Sludge, scum, or grit
Recycle flows from residuals processing
Chemical addition
Other
Figure H-4. Deer Island Treatment Plant Process Flow
North Metro ReliefTunnel
Boston MainDrainage Tunnel
North MetropolitanTrunk Sewer
South System Inter-Island Tunnel
North Main Pump Station
Winthrop Terminal
South System Pump Station
North System Grit Facility
Primary TreatmentBatteries A-D
Disinfection Basin Outfall T01Massachusetts Bay
Scum Screens
Gravity Thickeners
Landfill
Secondary Sludge and Scum Centrifuges
Egg-Shaped Digesters
DITP Power Plant
Fore River Pelletizing Plant
Digested Sludge
Centrifuges
Secondary TreatmentBatteries A-C
Hydroelectric pow
er from effluent
Methane gas from digestion
Centrate recycled to primary C
entrate recycled to primary effluent
Secondary sludge and scum
Prim
ary scum
Prim
ary sludge
Centrate recycled to prim
ary or secondary influent
Grit
Sodium hypochlorite
Sodium bisulfite
Barge
Pure oxygen
Secondary Bypass (high flow conditions only)
H-14

H-15
Table H-4. Known MWRA Sanitary Sewer Overflow Locations* System Location Description
Arlington, Section 80 Dudley St., Brattle Ct. manual plugs Arlington/Medford, Section 91B Headhouse, manholes, siphon Cambridge, Section B Near MBTA garage Cambridge, Section 43/B Alewife Brook Pump Station, influent yard
manhole Framingham, Section 133B Framingham Extension Sewer Malden, Section 41 Malden, Section 95 Medford, Section C Auburn St./Rt. 16 overflow relief point
Medford, Section 20 Pearl St. Medford, Section 107 Rt. 16 on-ramp, overflow weir Melrose, Section 50 Tremont St. Melrose, Section 51 Brunswick Park Wakefield, Section 204 Allison Hayes Pump Station influent Waltham, Section 212 (old 4A) Winchester, Section 47 Cummingsville Branch at Wedge Pond Winchester, Section 113 Ginn Field, Wedgemere siphons
North
Winchester, Section 114 Boston, Section 519 Neponset Valley Sewer, Business St. Boston, Section 571 High Level Sewer, Arboretum Braintree, Section 628 Pearl St. siphon Braintree/Weymouth, Section 626 Smelt Brook siphon headhouses Canton, Section 616 New Neponset Valley Relief Sewer, siphon
near Bell Mouth Dedham, Section 526 Neponset Valley Sewer, Rt. 1 Holbrook, Section 628B Holbrook Extension Sewer Milton, Section 561 Brook Rd. at Pine Tree Brook Newton, Section 529 Upper Neponset Valley Sewer, VFW
Parkway Newton, Section 530 Upper Neponset Valley Sewer, Vine St. area Norwood, Section 616 Walpole Extension Sewer, Overlook Dr. Norwood, Section 617 Walpole Extension Sewer, Meadow Brook
siphon Randolph, Section 628A Randolph siphon Roslindale, Section 570 High Level Sewer, manholes overland onto
street Roslindale, Section 570 High Level Sewer, Roslindale emergency
gates
South
Westwood, Section 636 Westwood Extension Sewer, siphon or lowest point
* Known SSOs occurring in MWRA lines from January 1, 1996 onwards.
Table H-5. Potential MWRA Sanitary Sewer Overflow Locations
System Location Description Boston, Section 564 High Level Sewer, Neponset River at
Monponset St. Canton, Section 614 New Neponset Valley Relief Sewer Pump
Station Hingham, Section 562 Hingham Pump Station
Quincy, Section 543 Nut Island emergency outfall Quincy, Section 543 Nut Island emergency spillway Quincy, Section 551B Quincy Pump Station Quincy, Section 621 Braintree-Weymouth Pump Station influent Squantum, Section 550B Squantum Pump Station
South
West Roxbury, Section 637A West Roxbury Tunnel and High Level Sewer junction

I-1
Appendix I: Instrument Detection Limits, Method Detection Limits, and Quantitation Limits
Overview An understanding of the detection limits of analysis is essential to reviewing
the data from chemical analyses. There are three different types of detection limits that are most often encountered:
• Instrument Detection Limits • Method Detection Limits • Quantitation Limits, also known as Reporting Limits.
I.1 Instrument Detection Limits
Instrument detection limits (IDL) reflect the capability of the instrument. This limit will be the lowest of the three detection limits. The IDL will not take into account the losses of the pollutant associated with the matrix (soil or wastewater) and extraction procedure. This discrepancy is known as matrix interference.
I.2 Method Detection Limits
Method detection limits (MDL) are the smallest amount of a substance that can be detected above background noise using a particular method. The MDL is statistically determined by running a series of analyses using various low concentrations of a pollutant. Using a Student's “T” test, the smallest concentration that has a 99% probability of being detected above the background is designated the MDL for that pollutant. The EPA, using several private laboratories, has determined what the MDLs are for most priority pollutants using their approved methods. These are published in the 40 CFR.
I.3 Quantitation Limits
In general, if a plot is made of pollutant concentration versus instrument response, it will show a linear relationship. As the pollutant concentration approaches zero, the linearity of the relationship is lost. At the point where the linearity is lost is called the Quantitation Limit (QL) or sometimes the Reporting Limit. In other words, the smallest concentration where the linear relationship holds is the smallest concentration that can be quantified. Generally, the QL is about five times the MDL. Quantitative limits are relevant to GC/MS analyses, that is, methods 608 (for pesticides), 624 (for volatile organics), and 625 (for semi-volatile organics). Specific limits are highly matrix-dependent.
I.4 Detection Limits, Non-Detects, and Reporting
In short, the IDL is the lowest concentration that a particular instrument can detect. The MDL is the lowest concentration that can be detected using a particular method. The QL is the smallest concentration that can be confidently considered to be accurate. Reported concentrations that are between the MDL and the QL indicate that a pollutant is present, but at a concentration too low to be accurately quantified. For example, using EPA method 624, chloroform has an MDL of 1.6 µg/L and a QL of 10 µg/L. If the concentration from an analysis is reported as 5 µg/L then it can be inferred that although the actual chloroform concentration in the
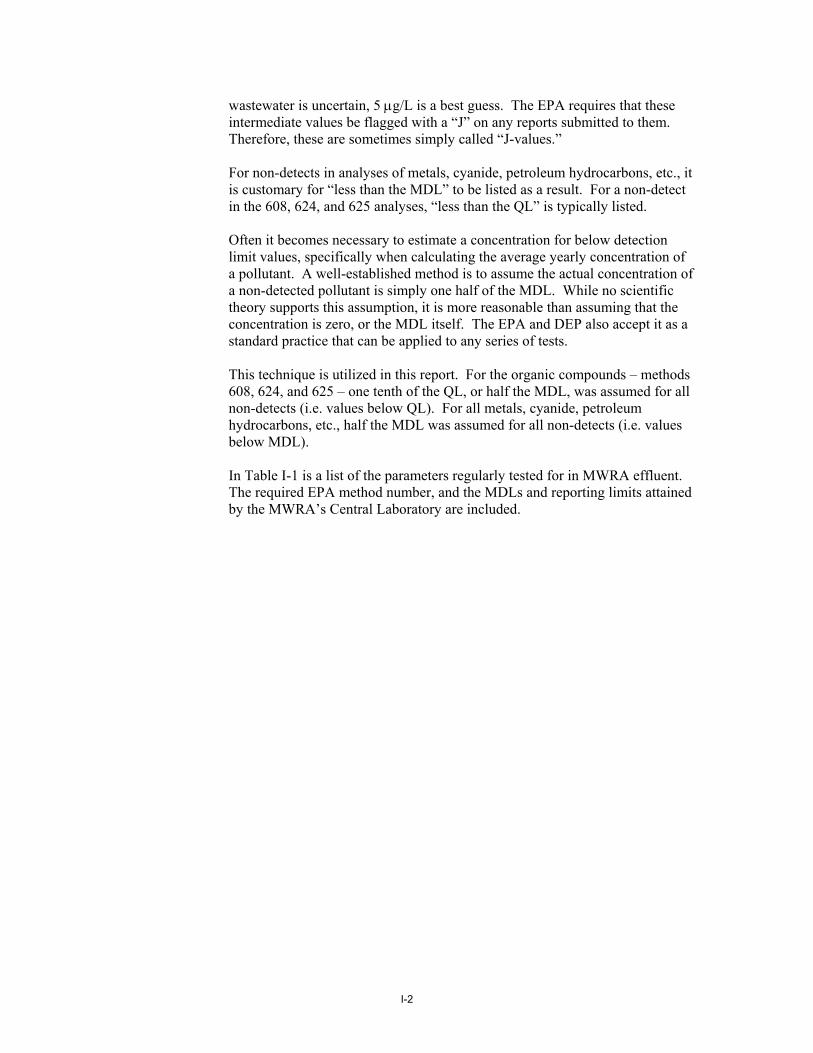
I-2
wastewater is uncertain, 5 µg/L is a best guess. The EPA requires that these intermediate values be flagged with a “J” on any reports submitted to them. Therefore, these are sometimes simply called “J-values.” For non-detects in analyses of metals, cyanide, petroleum hydrocarbons, etc., it is customary for “less than the MDL” to be listed as a result. For a non-detect in the 608, 624, and 625 analyses, “less than the QL” is typically listed. Often it becomes necessary to estimate a concentration for below detection limit values, specifically when calculating the average yearly concentration of a pollutant. A well-established method is to assume the actual concentration of a non-detected pollutant is simply one half of the MDL. While no scientific theory supports this assumption, it is more reasonable than assuming that the concentration is zero, or the MDL itself. The EPA and DEP also accept it as a standard practice that can be applied to any series of tests. This technique is utilized in this report. For the organic compounds – methods 608, 624, and 625 – one tenth of the QL, or half the MDL, was assumed for all non-detects (i.e. values below QL). For all metals, cyanide, petroleum hydrocarbons, etc., half the MDL was assumed for all non-detects (i.e. values below MDL). In Table I-1 is a list of the parameters regularly tested for in MWRA effluent. The required EPA method number, and the MDLs and reporting limits attained by the MWRA’s Central Laboratory are included.

I-3
Table I-1. List of Parameters Tested
Parameter EPA Method
Number MWRA MDL
(µg/L) MWRA QL
(µg/L) Metals Aluminum 200.7 90 <90 Antimony 200.7 0.8 <0.9 Arsenic 206.2 0.8 <0.8 200.7 43.8 <45 Beryllium 200.7 0.3 <0.5 Boron 200.7 9.5 <250 Cadmium 200.7 1.1 <2 213.2 .03 <0.03 Chromium 200.7 4.0 <4 218.2 0.7 <0.7 Copper 200.7 10.5 <10 220.2 0.6 <1 200.8 1 1
Hexavalent Chromium SM 3500-CR D2 1.8 <5 Iron 200.7 3 <30 Lead 200.7 12.0 <15 239.2 2.4 <2.4 Mercury 245.2 0.01 <0.01 1631 1 1
Molybdenum 200.7 3.4 <5 246.2 1.2 <1 Nickel 200.7 3.0 <3 249.2 0.7 <0.7 Selenium 200.7 48.2 <50 270.2 0.9 <0.9 Silver 200.7 1.4 <2 272.2 0.09 <0.09 Thallium 200.7 58.3 <60 279.2 1.0 <1 Zinc 200.7 5.7 <6 Other Inorganic Chemicals4 Cyanide 335.2 0.004 <0.01 Fats, Oil, and Grease (mg/L) 1664A 2.0 <7 Petroleum hydrocarbons (mg/L) 1 1
Phenol (mg/L) 420.2 MO 0.003 <0.01 Sulfate (mg/L) 300.0 0.2 <1 Total Organic Carbon (mg/L) 415.1 0.06 <0.3 Surfactants (mg/L) 425.1 0.03 <0.03 Pesticides (ng/L) 4,4’-DDD 608 6.8 <20 4-4’-DDE 608 8.8 <20 4-4’-DDT 608 15.8 <20 Aldrin 608 3.5 <20 alpha-BHC 608 6.3 <20 alpha-Chlordane 608 3.6 <20 beta-BHC 608 6.3 <20 Chlordane (Technical) 608 1 1
delta-BHC 608 6.7 <20 Dieldrin 608 5.5 <20 Endosulfan I 608 5.3 <20 Endosulfan II 608 4.0 <20 Endosulfan sulfate 608 16.7 <20 Endrin 608 13.7 <20 Endrin aldehyde 608 9.1 <20 Endrin ketone 608 5.4 <20 gamma-BHC (Lindane) 608 4.2 <20 Heptachlor 608 9.7 <20 Heptachlor epoxide 608 8.8 <20 Hexachlorobenzene 612 1 1
Methoxychlor 608 52.0 <200 Toxaphene 608 1 1

I-4
Table I-1. List of Parameters Tested (cont.)
PCBs (all in ng/L) Arochlor-1016 608 31.0 <500 Arochlor-1221 608 21.0 <1000 Arochlor-1232 608 14.0 <500 Arochlor-1242 608 1 1
Arochlor-1248 608 1 1
Arochlor-1254 608 10.0 <500 Arochlor-1260 608 32.0 <500 Volatile Organics 1,1,1-trichloroethane 624 1.0 <5 1,1,2,2-tetrachloroethane 624 1.3 <5 1,1,2-trichloroethane 624 0.6 <5 1,1-dichloroethane 624 0.8 <5 1,1-dichloroethene 624 1.3 <5 1,2-dichlorobenzene 624 0.4 <5 1,2-dichloroethane 624 0.6 <5 1,2-dichloropropane 624 0.4 <5 1,3-dichlorobenzene 624 0.5 <5 1,4-dichlorobenzene 624 0.4 <5 2-butanone 624 1.8 <5 2-chloroethylvinylether 624 0.8 <5 2-hexanone 624 1.5 <5 4-methyl-2-pentanone 624 1.3 <5 Acetone 624 16 <5 Acrolein 624 5.4 <5 Acrylonitrile 624 4.2 <5 Benzene 624 0.5 <5 Bromodichloromethane 624 0.4 <5 Bromoform 624 0.4 <5 Bromomethane 624 1.1 <5 Carbon disulfide 624 1.4 <5 Carbon tetrachloride 624 1.0 <5 Chlorobenzene 624 0.4 <5 Chloroethane 624 1.0 <5 Chloroform 624 0.5 <5 Chloromethane 624 0.7 <5 cis-1,2-dichloroethene 624 0.5 <5 cis-1,3-dichloropropane 624 0.3 <5 Dibromochloromethane 624 0.6 <5 Ethylbenzene 624 0.5 <5 m,p-xylene 624 1.4 <5 Methylene chloride 624 0.6 <5 o-xylene 624 0.5 <5 Styrene 624 0.4 <5 Tetrachloroethene 624 0.8 <5 Toluene 624 0.5 <5 trans-1,2-dichloroethene 624 1.1 <5 trans-1,3-dichloropropene 624 0.3 <5 Trichloroethene 624 1.0 <5 Trichlorofluoromethane 624 0.8 <5 Vinyl acetate 624 0.8 <5 Vinyl chloride 624 1.0 <5 Semi-Volatiles 1,2,4-trichlorobenzene 625 6.1 <10 1,2-dichlorobenzene 625 3.7 <10 1,2-diphenylhydrazine 625 8.7 <10 1,3-dichlorobenzene 625 2.9 <10 1,4-dichlorobenzene 625 3.2 <10 2,2’-oxybis(1-chloropropane) 625 3.9 <10 2,4,5-trichlorophenol 625 8.4 <10 2,4,6-trichlorophenol 625 9.6 <10 2,4-dichlorophenol 625 9.0 <10 2,4-dimethylphenol 625 8.1 <10
2,4-dinitrophenol 625 12.4 <20

I-5
Table I-1. List of Parameters Tested (cont.) Semi-Volatiles (cont.) 2,4-dinitrotoluene 625 7.6 <10 2,6-dinitrotoluene 625 10.0 <10 2-chloronaphthalene 625 9.2 <10 2-chlorophenol 625 4.2 <10 2-methyl-4,6-dinitrophenol 625 7.9 <100 2-methylnaphthalene 625 4.5 <10 2-methylphenol 625 7.5 <10 2-nitroaniline 625 6.9 <10 2-nitrophenol 625 6.2 <10 3-3’-dichlorobenzidine 625 8.4 <20 3-nitroaniline 625 8.6 <10 4-bromophenyl phenyl ether 625 7.8 <10 4-chloro-3-methylphenol 625 7.4 <10 4-chloroaniline 625 8.2 <10 4-chlorophenyl phenyl ether 625 9.0 <10 4-methylohenol (includes 3-methylphenol)
625 7.2 <10
4-nitroaniline 625 8.0 <10 4-nitrophenol 625 6.3 <20 Acenaphthene 625 6.8 <10 Acenaphthylene 625 7.2 <10 Aniline 625 6.6 <10 Anthracene 625 5.8 <10 Benzindine 625 0.5 <10 Benzo(a)anthracene 625 5.4 <10 Benzo(a)pyrene 625 5.4 <10 Benzo(b)fluoranthene 625 7.8 <10 Benzo(ghi)perylene 625 5.2 <10 Benzo(k)fluoranthene 625 4.1 <10 Benzoic acid 625 7.2 <20 Benzyl alcohol 625 5.8 <10 bis(2-chloroethoxy) methane 625 6.7 <10 bis(2-chloroethyl) ether 625 4.1 <10 bis(2-ethylhexyl) phthalate 625 4.9 <10 Butyl benzyl phthalate 625 6.6 <10 Chrysene 625 6.2 <10 di-n-butylphthalate 625 5.4 <10 di-n-octylphthalate 625 4.6 <10 Dibenzo(a,h)anthracene 625 5.2 <10 Dibenzofuran 625 6.8 <10 Diethyl phthalate 625 9.1 <10 Dimethyl phthalate 625 9.9 <10 Fluoranthene 625 5.1 <10 Fluorene 625 8.1 <10 Hexachlorobenzene 625 8.8 <10 Hexachlorobutadiene 625 6.2 <10 Hexachlorocyclopentadiene 625 10.7 <50 Hexachoroethane 625 3.5 <10 Indeno(1,2,3-cd) pyrene 625 6.4 <10 Isophrone 625 7.5 <10 n-nitroso-di-n-propylamine 625 3.1 <10 n-nitrosodimethylamine 625 4.3 <10 n-nitrosodiphenylamine 625 7.9 <10 Naphthalene 625 5.7 <10 Nitrobenzene 625 6.3 <10 Pentachlorophenol 625 6.9 <30 Phenanthrene 625 5.8 <1 Phenol 625 2.2 <20 Pyrene 625 6.0 <10
1 Data unavailable. 2 Standard Methods. 3 Native concentration too high for MDL determination. 4 Some expressed in mg/L as noted.

J-1
Appendix J: Priority Pollutants List and Other Parameters
Table J-1. EPA List of 126 Priority Pollutants Chlorinated Benzenes Chlorinated Ethanes Chlorinated Phenols
Chlorobenzene 1,2-dichlorobenzene 1,3-dichlorobenzene 1,4-dichlorobenzene 1,2,4-trichlorobenzene Hexachlorobenzene
Chloroethane 1,1-dichloroethane 1,2-dichloroethane 1,1,1-trichloroethane 1,1,2,2-tetrachloroethane Hexachloroethane
2-chlorophenol 2,4-dichlorophenol 2,4,6-trichlorophenol Parametachlorocresol (4-chloro-3-
methyl phenol)
DDT and Metabolites Haloethers Halomethanes 4,4-DDT 4,4-DDE (p,p-DDX) 4,4-DDD (p,p-DDE)
4-chlorophenyl phenyl ether 2-bromophenyl phenyl ether Bis(2-chloroisopropyl) ether
Methylene chloride (dichloromethane) Methyl chloride (chloromethane) Methyl bromide (bromomethane) Bromoform (tribromomethane) Dichlorobromomethane Chlorodibromomethane
Inorganics Nitroamines Pesticides and Metabolites Antimony Arsenic Asbestos Beryllium Cadmium Chromium (III) Chromium (VI) Copper Cyanide, total Lead Mercury Nickel Selenium Silver Thallium Zinc
N-nitrosodimethylamine N-nitrosodiphenylamine N-nitrosodi-n-propylamine
Aldrin Dieldrin Chlordane (technical mixture and
metabolites) Alpha-endosulfan Beta-endosulfan Endosulfan sulfate Endrin Endrin aldehyde Heptachlor Heptachlor epoxide (BHC-
hexachlorocyclohexane) Alpha-BHC Beta-BHC Gamma-BHC (Lindane) Delta-BHC Toxaphene
Phenols (other than chlorinated) Phthalate Esters Polychlorinated Biphenyls (PCBs) 2-nitrophenol 4-nitrophenol 2,4-dinitrophenol 4,6-dinitro-o-cresol (4,6-dinitro-2-
methylphenol) Pentachlorophenol Phenol 2,4-dimethylphenol
Bis(2-ethylhexyl)phthalate Butyl benzyl phthalate Di-n-butyl phthalate Di-n-octyl phthalate Diethyl phthalate Dimethyl phthalate
PCB-1242 (Aroclor 1242) PCB-1254 (Aroclor 1254) PCB-1221 (Aroclor 1221) PCB-1232 (Aroclor 1232) PCB-1248 (Aroclor 1248) PCB-1260 (Aroclor 1260) PCB-1016 (Aroclor 1016)
Polynuclear Aromatic Hydrocarbons (PAHs)
Other Chlorinated Organics Other Organics
Acenaphthene 1,2-benzanthracene (benzo(a)anthracene) Benzo(a)pyrene (3,4-benzo-pyrene) 3,4-benzofluoranthene (benzo(b)fluoranthene) 11,12-benzofluoranthene (benzo(k)fluoranthene) Chrysene Acenaphthylene Anthracene 1,12-benzoperylene (benzo(ghi)perylene) Fluorene Fluoranthene Phenanthrene 1,2,5,6-dibenzanthracene
(dibenzo(a,h)anthracene) Indeno (1,2,3-cd) pyrene (2,3-o-
phenylene pyrene) Pyrene
Chloroform (trichloromethane) Carbon tetrachloride
(tetrachloromethane) Bis(2-chloroethoxy)methane Bis(2-chloroethyl)ether 2-chloroethyl vinyl ether (mixed) 2-chloronaphthalene 3,3’-dichlorobenzidine 1,1-dichlorethylene 1,2-trans-dichloroethylene 1,2-dichloropropane 1,2-dichloropropylene (1,3-dichloropropene) Tetrachloroethylene Trichloroethylene Vinyl chloride (chloroethylene) Hexachlorobutadiene Hexachlorocyclopentadiene 2,3,7,8-tetrachloro-dibenzo-p-dioxin
(TCDD)
Acrolein Acrylonitrile Benzene Benzidine 2,4-dinitrotolulene 2,6-dinitrotolulene Ethylbenzene Isophrone Naphthalene Nitrobenzene Tolulene

J-2
Table J-2. NPDES Permit Application Testing Requirements
40 CFR 122, Appendix D, Tables II and III Volatile Organics Organic Pesticides Organic Base/Neutrals
acrolein acrylonitrile benzene bromoform carbon tetrachloride chlorobenzene chlorodibromomethane chloroethane 2-chloroethylvinyl ether chloroform dichlorobromomethane 1,1-dichloroethane 1,2-dichloroethane 1,1-dichloroethylene 1,2-dichloropropane 1,3-dichloropropylene ethyl benzene methyl bromide methyl chloride methylene chloride 1,1,2,2-tetrachloroethane tetrachloroethylene toluene 1,2-trans-dichloroethylene 1,1,1-trichloroethane 1,1,2-trichloroethane trichloroethylene vinyl chloride
aldrin alpha-BHC beta-BHC gamma-BHC delta-BHC chlordane 4,4'-DDT 4,4'-DDE 4,4'-DDD dieldrin alpha-endosulfan beta-endosulfan endosulfan sulfate endrin endrin aldehyde heptachlor heptachlor epoxide PCB-1242 PCB-1254 PCB-1221 PCB-1232 PCB-1248 PCB-1260 PCB-1016 toxaphene
acenaphthene acenaphthylene anthracene benzidine benzo(a)anthracene benzo(a)pyrene 3,4-benzofluoranthracene benzo(ghi)perylene benzo(k)fluoranthene bis(2-chloroethoxy)methane bis(2-chloroethyl)ether bis(2-ethylhexyl)phthalate 4-bromophenyl phenyl ether butylbenzyl phthalate 2-chloronaphthalene 4-chlorophenyl phenyl ether chrysene dibenzo(a,h)anthracene 1,2-dichlorobenzene 1,3-dichlorobenzene 1,4-dichlorobenzene 3-3’-dichlorobenzidine diethyl phthalate dimethyl phthalate di-n-butyl phthalate 2,4-dinitrotoluene 2,6-dinitrotoluene di-n-octyl phthalate 1,2-diphenylhydrazine fluoranthene fluorene hexachlorobenzene hexachlorobutadiene hexachlorocyclopentadiene hexachloroethane indeno(1,2,3-cd)pyrene isophorone napthalene nitrobenzene N-nitrosodimethylamine N-nitrosodi-n-propylamine N-nitrosodiphenylamine phenanthrene pyrene 1,2,4-trichlorobenzene
Organic Acids Metals Cyanide and Phenols 2-chlorophenol 2,4-dichlorophenol 2,4-dimethylphenol 4,6-dinitro-o-cresol (2-methyl-4,6-dinitrophenol) 2,4-dinitrophenol 2-nitrophenol 4-nitrophenol p-chloro-m-cresol (4-chloro-m-
cresol) pentachlorophenol phenol 2,4,6-trichlorophenol
antimony, total arsenic, total beryllium, total cadmium, total chromium, total copper, total lead, total mercury, total nickel, total selenium, total silver, total thallium, total zinc, total cyanide, total phenols, total
cyanide, total phenol, total

K-1
Appendix K: Glossary, Abbreviations/Acronyms, and Units
K.1 Glossary
40 CFR Part 122 - Code of Federal Regulations: Protection of the Environment. Part 122 is Administered Permit Programs: The National Pollutant Discharge Elimination System. (Appendix D of 40 CFR 122 lists the Permit Application Requirements.) Acid Base Neutrals (ABNs) - A category of organic chemical pollutants also called semi-volatile organics. See Appendix K. Acute - A stimulus severe enough to rapidly induce an effect; in aquatic toxicity tests, an effect observed in 96 hours or less is typically considered acute. When referring to aquatic toxicology or human health, an acute effect is not always measured in terms of lethality. Acute Criteria- The maximum concentration of a constituent in water that an organism may be exposed to for a total of one hour, once over three years, without dying. Acute Static Toxicity Test - Test designed to measure water quality effect on mortality. It measures the effect of the whole effluent sample on an organism. Animals are put in a vial with effluent, and the fatal effects are monitored. To calculate water quality standards, the test is run on sensitive animals. The concentration that shows a 95% mortality rate is then multiplied by two. Activation - An event when the wastewater flow exceeds the holding capacity of the sewer lines and the hydraulic capacity of the treatment plant, causing a diversion of flow to the CSO facilities. Aeration - The process of adding air to a liquid (e.g. wastewater). Aliquot - A measured portion of a sample. Anaerobic Digester - The structure where organic material is broken down by organisms in the absence of oxygen. Anoxia - The absence of oxygen. Average Monthly Discharge Limitation - The highest allowable average of “daily discharge” over a calendar month, calculated as the sum of all daily discharges measured during a calendar month divided by the number of daily discharges measured. Average Weekly Discharge Limitation - The highest allowable average of “daily discharge” over a calendar week, calculated as the sum of all daily discharges measured during a calendar week divided by the number of daily discharges measured during that week. Bar Screen - A screen made of bars designed to catch large debris (e.g. rags, wood, shoes) in waterways. Below Detection Limit/Level (BDL) - Values below the Reporting or Quantitation Limit. For further explanation see Appendix K. Bioaccumulation - The process in which industrial waste, toxic chemicals, and other pollutants gradually build up in living tissues and organs. Biochemical - Having to do with a chemical change resulting from the metabolic activities of living organisms.

K-2
Biochemical Oxygen Demand (BOD) - The amount of oxygen needed to oxidize inorganic materials and to degrade organic materials by biochemical reactions in a certain time at a certain temperature. BOD is used as a measure of organic pollution. Biomagnification - The process by which the concentration of a compound increases in species occupying successive trophic levels. BDL - See Below Detection Limit Bloom - A large mass of algae (microscopic and or macroscopic) in water. BOD - See Biochemical Oxygen Demand. Buffering Capacity - Measures the ability of certain water bodies to resist changes in pH from addition of acidic or caustic substances. CFR- See Code of Federal Regulations Chemical Oxygen Demand (COD) - The amount of oxygen needed for the chemical oxidation of chemicals in water. COD is used to measure the suitability of water for organisms that require oxygen. Chlorination - The addition of chlorine or chlorine compounds to wastewater. Chlorination is most often done for disinfection purposes. Choking - A process by which flows that cannot be handled by existing pumps are “choked back” into the sewer system, frequently leading to local overflows. Chronic - A stimulus that lingers or continues for a relatively long period of time, often one-tenth of the life span or more. Chronic should be considered a relative term depending on the life span of an organism. The measurement of a chronic effect can be reduced growth, reduced reproduction, etc., in addition to lethality. Chronic Criteria - The maximum concentration of a constituent in water that an organism may be exposed to for a total of four days over three years without showing long term, harmful effects, short of mortality. Chronic criteria involve sublethal effects on, among other things, the growth, reproductivity, and fertility of organisms. Chronic Reproduction Test - A test designed to measure the chronic effects of wastewater on reproduction and fertility. Chronic Survival and Growth Test - Test designed to see if any mortality occurs after the chronic criteria have been passed. After the organisms have survived, the size of the animals are measured after seven days and statistically compared to controls. Clean Water Act (CWA) - Formally referred to as the Federal Water Pollution Control Act or Federal Water Pollution Control Act Amendments of 1972. Pub. L. 92-500, as amended by Pub. L. 95-576, Pub. L. 96-483, and Pub. L. 97-117: 33 U.S.C. 1251 et seq. COD - See Chemical Oxygen Demand Code of Federal Regulations (CFR) - Codification of the general and permanent rules of the federal government. CFR 40 covers environmental protection. Combined Sewer - A sewer receiving both sanitary wastewater and stormwater runoff. Combined Sewer Overflow Facility - A place where overflow from combined sewers is screened, settled, and chlorinated before being discharged. Combined Sewer Overflow Pipe - A pipe that discharges overflow from combined sewers in order to prevent back-ups in the sewerage system.

K-3
Composite Sample - A sample consisting of a minimum of eight grab samples collected at equal intervals during a 24-hour period (or lesser period if specified) and combined proportional to flow, or a sample continuously collected proportionally to flow over that same time period. Conventional Parameters/Pollutants - Those pollutants and constituents that are removed from wastewater by conventional treatment. Generally these constituents are settleable solids, biochemical oxygen demand, total suspended solids, oil and grease, total coliform, fecal coliform, residual chlorine, and chlorides. Conventional Treatment - Well-known or well-established water or wastewater treatment methods, usually consisting of primary and secondary processes and may include advanced or tertiary treatment. Criteria - The numerical and or narrative elements of water quality standards. Critical Dilution - Dilution of the effluent required to meet Water Quality Standards. CWA - See Clean Water Act. Daily Discharge - The discharge of a pollutant measured during a calendar day or any 24-hours period that reasonably represents the calendar day for purposes of sampling. For pollutants with limitations expressed in units of mass, the daily discharge is calculated as the total mass of the pollutant discharged over the day. For pollutants with limitations expressed in other units of measurements, the daily discharge is calculated as the average measurement of the pollutant over the day. Designated Use - Specified use of a body of water included in state water quality standards. Digester - A place where organic matter is broken down either with oxygen (aerobically) or without oxygen (anaerobically). Disinfection - The destruction of pathogens (e.g. fecal coliform bacteria) in a water source or wastewater. Effluent - The wastewater or other water coming out of a treatment facility or process. Effluent Limitation - Any restriction imposed by the Director (the person authorized to sign NPDES permits by EPA and/or the State) on quantities, discharge rates, and concentrations of “pollutants” which are “discharged” from “point sources” into “waters of the United States,” the waters of the “contiguous zone,” or the ocean. Eutrophication - The natural process by which a body of water ages. Nutrients stimulate plant growth and lakes, estuaries, and bays evolve into bogs or marshes. Effluents high in nutrients cause excessive plant growth that accelerates eutrophication. Fecal Coliform - Bacteria found in the wastes of warm-blooded animals. Fecal coliform is used as an indicator that disease causing bacteria and viruses are present. It is a component of Total Coliform. Floatables - Constituents of wastewater that rise to the surface in the settling process, consisting mainly of oil, grease, and plastics. Grab Sample - An individual sample collected in a period of less than 15 minutes. Gravity Facility - A combined sewer overflow facility that receives flows by gravity (descending gradients from source to outfall) and requires no pumping. Grit - Heavy suspended mineral matter in wastewater like sand and gravel.

K-4
Grit Chamber - A detention tank were grit is separated by sedimentation (grit settles to the bottom). The settling is controlled by the velocity of the water. Headworks - A structure where wastewater are screened out and grit and other solids are trapped before the wastewater is pumped to a treatment facility. Human Health Criteria - Estimated concentrations or quantities of chemicals that can be expected to occur in the environment in water, sediment, or food and that are not likely to pose a significant risk to the exposed human population. Human health criteria are published under section 304(a) of the CWA and are based on the latest scientific information. This information is updated and issued to the states to serve as guidance for the development of criteria. Hydrocarbons - Chemical compounds only containing hydrogen and carbon. Hypochlorite - The chemical used for chlorine disinfection of wastewater (either calcium, sodium, or lithium hypochlorite). Hypoxia - The state of very low oxygen concentration. IDL - See Instrument Detection Limit. I/I - Infiltration and Inflow. See separate entries for each. Infiltration - Groundwater that enters sewer pipes through cracks. Inflow - Water that enters sewer pipes through illegal connections and storm water runoff. Inorganic - Not containing carbon. Influent - Wastewater or other water going into treatment facility or process. Instrument Detection Limit (IDL) - The smallest amount of a substance a particular instrument is capable of detecting. See Appendix K for further explanation. Interceptor - A large sewerage line collecting water from smaller sewerage pipes. J values - Values between the Method Detection Limit and the Quantitation (or Reporting) Limit. See Appendix J for further explanation. Lethal Concentration 50% (LC50) - The concentration of effluent in a sample that causes mortality to 50% of the test population at a specific time of observation. Limiting Nutrient - In a given ecosystem, the limiting nutritional factor that controls the growth of plants or animals. Usually the limiting nutrient for plant growth is nitrogen in the marine environment and phosphorus in the fresh water environment. The limiting nutrient can also be thought of as the specific nutrient that will have the most impact on a receiving body of water (for example, the accelerated eutrophication of fresh water bodies caused by phosphorus in wastewater effluent). Local Limits - The development of specific limits as part of MWRA’s General Pretreatment Program: “The permittee shall develop and enforce specific effluent limits for industrial users, and all other users, as appropriate, pursuant to 40 CFR 403.5.” Lowest Observed Effect Concentration (LOEC) - The lowest concentration of effluent to which organisms are exposed in a life cycle or partial life cycle test which contains an adverse effect (on survival, growth, and reproduction). Maximum Acceptable Toxicant Concentration (MATC)- The effluent concentration that may be present in a receiving water body without causing significant harm to productivity or other uses. The MATC is determined by the results of chronic tests of either a partial life cycle with sensitive life stages

K-5
or a full life cycle of the test organism. The MATC is the geometric mean of the No Observed Effect Concentration and the Lowest Observed Effect Concentration. Maximum Daily Discharge Limitation - The highest allowable daily discharge. MBAS - See Methylene Blue Anion Surfactant MDL - See Method Detection Limit Metals - A group of priority pollutants. See Appendix K for a complete list. Method Detection Limit (MDL) - The smallest amount of a substance that can be detected above background noise by following a particular method of analysis. See Appendix K for further explanation. Methylene Blue Anion Surfactant - A specific type of surfactant. See surfactant. Mixing Zone - Area where discharged effluent is first diluted. The area is extended to cover the secondary mixing in the ambient water body. A mixing zone is an allocated impact zone where water quality criteria can be exceeded as long as toxic conditions are prevented. National Pollutant Discharge Elimination System (NPDES) - The national program for issuing, modifying, revoking and reissuing, terminating, monitoring, and enforcing permits, and imposing and enforcing pretreatment requirements, under sections 307, 402, and 405 of the Clean Water Act (CWA). The term includes an “approved program.” Nine Minimum Controls - Part of the EPA’s CSO Policy. The Nine Minimum Controls are: 1) Proper operation and regular maintenance (O&M) programs for the sewer system and combined sewer overflow points 2) Maximum use of the collection system for storage 3) Review and modification of the pretreatment programs to assure CSO impacts are minimized 4) Maximization of flow to the POTW for treatment 5) Prohibition of CSO discharges during dry weather 6) Control of solid and floatable materials in CSO discharges 7) Pollution prevention programs that focus on contaminant reduction activities 8) Public notification to ensure that the public receives adequate notification of CSO occurrences and CSO impacts 9) Monitoring to effectively characterize CSO impacts and the efficacy of CSO controls. Nitrification - The conversion of ammonia and nitrite to nitrate. No Observed Acute Level (NOAL) - The highest concentration of effluent to which organisms are exposed in a short-term test in which at least 90% of the test organisms survive. No Observed Effect Concentration (NOEC) - The highest concentration of effluent to which organisms are exposed in a life cycle or partial life cycle test which contains no adverse effects (on growth, survival, and reproduction). NPDES - See National Pollutant Discharge Elimination System Nutrient - Any element or compound essential as raw material for organism growth and development. Examples: phosphorus and nitrogen. Oil and Grease - Fats, oils, and grease from animal and plant derivation. Also called FOGs.

K-6
Organic Compounds - Volatiles, Acid Compounds, Base/Neutral, and Pesticides. Organics are listed in 40 CFR Ch. 1 Appendix D under CWA Section 307(a). See Appendix K for a complete list. Orthophosphorus - A form of phosphorus, included in nutrients. Outfall - the site of initial discharge PAH - See Polynuclear Aromatic Hydrocarbon Pesticides/PCBs - Subdivision of priority pollutants. See Appendix K for a complete list. Petroleum Hydrocarbon (PHC) - Oil and grease from petroleum derivation. pH - The negative log of the hydrogen ion concentration used to express acidity (<7) and alkalinity (>7). PHC - See Petroleum Hydrocarbon. Pollutant - Dredged soil, solid waste, incinerator residue, filter backwash, sewage, garbage, sewage sludge, munitions, chemicals wastes, biological materials, radioactive materials, (except those regulated under the Atomic Energy Act of 1954, as amended (42 U.S.C. 2011 et seq.)), heat, wrecked or discarded equipment, rock, sand, cellar dirt and industrial, municipal, and agricultural waste discharged into water. It does not mean: (a) Sewage from vessels; or (b) Water, gas, or other material which is injected into a well to facilitate production of oil or gas, or water derived in association with oil and gas production and disposed or in a well, if the well used either to facilitate production or for disposal purposes is approved by authority of the State in which the well is located, and if the State in which the well is located, and if the State determines that the injection or disposal will not result in the degradation of ground or surface water resources. Polynuclear Aromatic Hydrocarbon (PAH) - A type of semi-volatile organic. Also known as polycyclic aromatic hydrocarbons. POTW - See Publicly Owned Treatment Work. Preaeration - The process by which air is added to primary influent to help in the removal of gases, floatation of grease, addition of oxygen, and in the settling or coagulation of wastewater. Prechlorination - The addition of chlorine to primary influent at or near the beginning of the treatment facility/process. Primary Settling - The detention of wastewater as part of primary treatment to settle out solids (sludge) and collect floatables (scum). Primary Treatment - Screening and settling of wastewater. Priority Pollutants - Refers to some of the chemicals listed in 40 CFR Ch. 1 Appendix D under Section 307(a) of the CWA. There are 65 compounds and families of compounds that are among the most persistent, prevalent, and toxic of chemicals know to man. These 65 compounds or families of compounds have been translated into 126 individual pollutants. See Appendix K, Table K-2 for the complete list. Priority Pollutant Scan - A series of chemical analyses to identify the presence of priority pollutants. Publicly Owned Treatment Work (POTW) - Any facility or system used in the treatment (including recycling and reclamation) of municipal sewage or industrial wastes of liquid nature that is owned by a “State” or a “municipality.” This definition includes sewers, pipes, or other conveyances only if they convey wastewater to a POTW providing treatment. Pumping Station - Structures where wastewater from low-lying areas is

K-7
pumped. Quantitation Limit - See Reporting Limit. Removal Rate - or Percent Removal. Defined as the influent concentration minus the effluent concentration, divided by the influent concentration. Reporting Limit - The smallest concentration that can be quantified. On a graph of pollutant concentration versus instrument response, the reporting limit is the smallest concentration where the linear relationship holds before starting to curve as the pollutant concentration goes to zero. Also called the Quantitation Limit. See Appendix J for further explanation. Residuals - Matter left over by treatment processes including screenings, scum, and sludge. Screening - The process by which sewage from interceptors first goes through headworks where grit and large objects like leaves, sticks, and hygiene products (like tampon applicators and condoms) are screened out. Screenings - The objects that are collected by the process of screening. Scum - Solids that float to the top of wastewater. Secondary Treatment - The treatment of wastewater beyond solids and grit removal. The process decreases the organic load. Sedimentation - The process by which solids are allowed to settle by gravity. Sedimentation Tank - Tanks used to detain wastewater while the solids settle out. Semi-Volatile Organics - Also known as Acid Base Neutrals (ABNs). A subcategory of organic pollutants. See Appendix K for a complete list. Separate Sewer - A sewerage system divided into a storm sewer and a sanitary sewer. Settleable Solids - The estimated amount of sludge that will settle by sedimentation. It is a fraction of the suspended-solids. Settled Solids - Sludge. (See sludge.) Sewage - Any wastes, including wastes from humans, households, commercial establishments, industries, and storm water runoff, that are discharged to or otherwise enter a POTW. Sludge - Solids, residues, and precipitate separated from or created in sewage by the unit processes of a POTW. SOP - See System Optimization Plan or Standard Operating Procedures Stratification - The separation of water into layers characterized by thermal differences. Standard Operating Procedures (SOP) - Documented protocols for plant operation, laboratory procedures, etc. Surcharging - When the capacity of the sewer is insufficient and sewage escapes through a manhole. Surfactant - Surface-active agent. Large organic molecules that cause foaming. They are usually found in detergents. System Optimization Plan (SOP) - Hydraulic improvements that, in conjunction with ongoing programs of municipal sewerage agencies, might promote a balanced hydraulic system. The SOP may include optimization of the collector/interceptor system upstream of regulators, to ensure that the storage and transport capacity of the system is maximized within constraints unalterable except for major structural modifications. Thickener - The structure where sludge is sent to be thickened by removing water.

K-8
TKN - See Total Kjeldahl Nitrogen. Total Coliform - Bacteria found in decaying matter, feces, and soil. It used as an indicator of pathogens that are present in wastewater. Total Kjeldahl Nitrogen (TKN) - The total organic and ammonia nitrogen. Total Phosphorus - A measure of all the forms of phosphorus, a nutrient, found in water (orthophosphates, polyphosphates, and organic phosphates). Total Suspended Solids (TSS) - The sum of insoluble solids that either float on the surface of, or are in suspension in water, wastewater, or other liquids. Toxic Pollutant - Any pollutant listed as toxic in Appendix D of 40 CFR Part 122, under Section 307(a)(1) of CWA. Toxics - Pollutants that have a toxic effect on living organisms. The “priority pollutants” of CWA Section 307(a) are a subset of this group of pollutants. Toxicity Test - A procedure to determine the toxicity of a chemical or an effluent using living organisms. A toxicity test measures the degree of effect on exposed test organisms of a specific chemical or effluent. TSS - See Total Suspended Solids. Twelve Month Running Average - The monthly average computed using the specific month and the previous 11 months. Unregulated Community - Dischargers not required to have Permits to discharge into MWRA sewerage system. They are not regulated or required to meet Local Limits, nor are they regulated under the Local Limits Discharge Program. Vertical Mixing - The vertical movement of the water column caused by wind, and/or density and/or temperature differences. Volatile Organic Acid (VOA) - Same as Volatile Organic Compound. Volatile Organic Compound (VOC) - Same as Volatile Organic Acid. Volatile Solids - Those solids of a suspended solid sample that are burned off in a muffle oven at 550±50 °C. Water Quality - The chemical, biological, and physical conditions of a body of water. Water Quality Criteria - Specific levels of pollutants that would make a body of water unsuitable for its designated use (i.e. harmful if used for drinking, swimming, farming, fishing, or industrial processes). Water Quality Standard - A law or regulation that consists of: the beneficial designated use or uses of a water body; the numeric and narrative water quality criteria that are necessary to protect the use or uses of that particular water body; and an antidegradation statement. Whole Effluent Toxicity (WET) - The total toxic effect of effluent, not chemical specific but rather the cumulative effect, whether it be synergistic or antagonistic, of the chemicals found in the effluent.
K.2 Abbreviations and Acronyms
ABNs - Acids Bases Neutrals BDL - Below Detection Limit BOD - Biochemical Oxygen Demand BWSC - Boston Water and Sewer Commission CFR - Code of Federal Regulations CSO - Combined Sewer Overflow CWA - Clean Water Act DEP - Massachusetts Department of Environmental Protection

K-9
DITP - Deer Island Treatment Plant ENQUAD - Environmental Quality Department EPA - United States Environmental Protection Agency FY - Fiscal Year IDL - Instrument Detection Level I/I - Infiltration and Inflow LC50 - Median Lethal Concentration LD50 - Median Lethal Dose LOAEL - Lowest Observed Adverse Effect Level LOEC - Lowest Observed Effect Concentration MATC - Maximum Acceptable Toxicant Concentration MDC - Metropolitan District Commission MDL - Method Detection Limit MPN - Most Probable Number MWRA - Massachusetts Water Resources Authority NITP - Nut Island Treatment Plant NOAL - No Observed Acute Level NOEC - No Observed Effect Concentration NPDES - National Pollutant Discharge Elimination System PAH - Polycyclic (or Polynuclear) Aromatic Hydrocarbon PCB - Polychlorinated Biphenyl PHC - Petroleum Hydrocarbon POTW - Publicly Owned Treatment Work SD - Standard Deviation SOP - Standard Operating Procedures or System Optimization Plan SSO - Sanitary Sewer Overflow TKN - Total Kjeldahl Nitrogen TRAC - Toxic Reduction and Control Department TSS - Total Suspended Solids VOA - Volatile Organic Acid VOC - Volatile Organic Compound WET - Whole Effluent Toxicity [test]
K.3 Units
in/yr - inches per year L - liter lbs - pounds lbs/day - pounds per day mL/L - milliliters per liter MG - million gallons mgd - million gallons per day mg/L - milligrams per liter µg/L (or ug/L) - micrograms per liter