npl’s activities dosimetry for proton and ion therapy
DESCRIPTION
NPL’s activities dosimetry for proton and ion therapy. Hugo Palmans Radiation Dosimetry Team, National Physical Laboratory, Middlesex, UK [email protected]. Why proton dosimetry at NPL?. Only one low-energy centre in the UK for tumours of the eye (Clatterbridge Centre of Oncology: CCO) - PowerPoint PPT PresentationTRANSCRIPT

NPL’s activities dosimetry for proton and ion therapy
Hugo Palmans
Radiation Dosimetry Team, National Physical Laboratory, Middlesex, UK

Why proton dosimetry at NPL?
• Only one low-energy centre in the UK for tumours of the eye (Clatterbridge Centre of Oncology: CCO)
• Since then: fail bids for high-energy proton facilities from CCO, Oxford, Daresbury, etc and now BASROC and LIBRA + NRAG documents
• In the mean time in USA (6+5), Japan (8), Germany (6), Italy (3), France (3), China (2) + new technologies (superconducting cyclotrons, dielectric wall accelerators, laser induced protons)
• Recent proton dosimetry projects with the aim of getting it to the level of photon and electron beam dosimetry: SR project 2002-2003, 2 NMS projects 2004-2007, 1 NMS project 2007-2010, LIBRA (Laser induced proton and ion beams) 2008-2011, EMRP JRP7 WP3 2008-2010
• Microbolometry with the aim of extending the scope of the quantiy of absorbed dose: SR project 2008, PhD UoS/NPL 2008-2011

Overview: 8 experiments or simulations, 1 slide each
• Graphite calorimetry• Total absorption calorimetry• Water equivalence of graphite and other materials I: DD
measurements• Water equivalence of graphite and other materials II:
Faraday cup attenuation measurements• Alanine dosimetry• Ionization chamber dosimetry• Near future: Microbolometry• Distant future: Biosensors

Calorimetry: Graphite calorimetry for protons (Palmans et al 2004, Phys Med Biol 49:3737-49)
T.khcD .
0.96
0.97
0.98
0.99
1.00
1.01
1.02
Dca
l/Dio
n
0.98
0.99
1.00
1.01
1.02
1.03
1.04
NE2561 (Co-60)
NACP02 (Co-60)
Markus (Co-60)
NACP02 (e-19)
Markus (e-19)
modulated beam
Jun-03
Jun-03
Jun-03
Jun-03
Jun-03
Jun-03
Jun-03
non-modulated beam
0.96
0.97
0.98
0.99
1.00
1.01
1.02
Dca
l/Dio
n
0.98
0.99
1.00
1.01
1.02
1.03
1.04
NE2561 (Co-60)
NACP02 (Co-60)
Markus (Co-60)
NACP02 (e-19)
Markus (e-19)
modulated beam
Jun-03
Jun-03
Jun-03
Jun-03
Jun-03
Jun-03
Jun-03
non-modulated beam
33,0
34,0
35,0
36,0
37,0
0 100 200 300 400
E (MeV)
wair
(J/C
) ECHED
AAPM-16
ICRU 59
IAEA TRS398
33,0
34,0
35,0
36,0
37,0
0 100 200 300 400
E (MeV)
wair
(J/C
) ECHED
AAPM-16
ICRU 59
IAEA TRS398
33,0
34,0
35,0
36,0
37,0
0 100 200 300 400
E (MeV)
wair
(J/C
)
33,0
34,0
35,0
36,0
37,0
0 100 200 300 400
E (MeV)
wair
(J/C
) ECHED
AAPM-16
ICRU 59
IAEA TRS398
ECHED
AAPM-16
ICRU 59
IAEA TRS398
ICRU 59ICRU 59
IAEA TRS398IAEA TRS398

Total absorption calorimetry (Palmans et al 2007 NPL report IR 4)
pin
p
n
pin
p
n
• Proton beam energy determination using total absorption calorimetry requires knowledge of the escaping energy fraction
• Simulations using PTRAN, MCNPX and Geant4

PlatesMarkus
Roos
Protonbeam
Markus
Roos
Protonbeam
0.98
0.99
1.00
1.01
1.02
1.03
1.04
0.0 0.5 1.0 1.5 2.0 2.5 3.0
depth (g cm-2)
flu
en
ce
co
rre
cti
on
fa
cto
r
r0 @ 50% distal
r0 @ 80% distal
r0 from ICRU49
Geant4 simulations:
0.980
0.990
1.000
1.010
1.020
1.030
1.040
0.0 0.5 1.0 1.5 2.0 2.5 3.0
water equivalent depth (g cm-2)
flu
en
ce
co
rre
cti
on
fa
cto
r
QGSP
QGSP BERT
QGSP BIC
precompund
Water equivalence of graphite I: PDD and TPR measurements
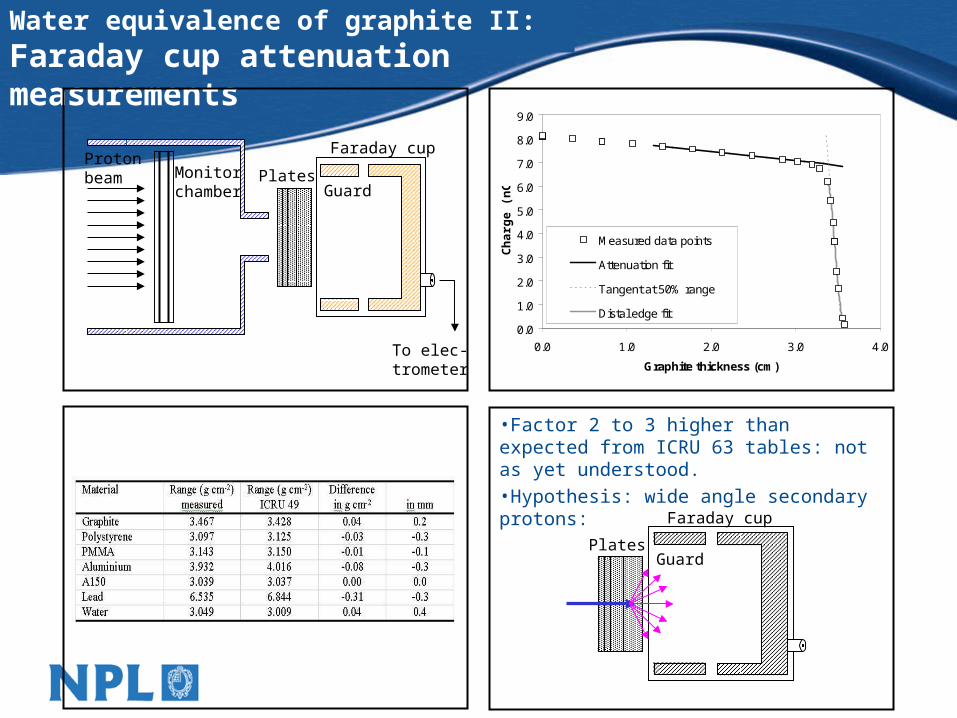
Water equivalence of graphite II: Faraday cup attenuation measurements
To elec-trometer
Plates
Faraday cup
Monitorchamber
Protonbeam
Guard
0.0
1.0
2.0
3.0
4.0
5.0
6.0
7.0
8.0
9.0
0.0 1.0 2.0 3.0 4.0
Graphite thickness (cm)
Ch
arg
e (
nC
)
Measured data points
Attenuation fit
Tangent at 50% range
Distal edge fit
•Factor 2 to 3 higher than expected from ICRU 63 tables: not as yet understood. •Hypothesis: wide angle secondary protons:
Plates
Faraday cup
Guard

Alanine dosimetry: CCO experiment I
0.0
0.5
1.0
1.5
2.0
2.5
3.0
3.5
4.0
0.0 0.5 1.0 1.5 2.0 2.5 3.0
depth (cm)
do
se p
er m
.u. (
Gy)
diodealanine pelletsresponse 1response 2
response 3
0.00
0.10
0.20
0.30
0.40
0.50
0.60
0.70
0.0 0.5 1.0 1.5 2.0 2.5 3.0
depth (cm)
do
se p
er m
.u. (
Gy)
ion chamberalanine pelletsresponse 1response 2response 3
0.40
0.50
0.60
0.70
0.80
0.90
1.00
1.10
0.00 0.50 1.00 1.50 2.00
log(Eeff)
rela
tive
eff
ecti
ven
ess
Bradshaw et al. (1962)Ebert et al. (1965)Hansen and Olsen (1985)Onori et al. (1997)Cuttone et al. (1999)Bartolotta et al. (1999)Fattibene et al. (2002)
NPL1 (range scaled)

Alanine dosimetry: CCO experiment II
0.60
0.70
0.80
0.90
1.00
0.01 0.1 1 10Rres (g cm-2)
Re
lati
ve
Eff
ec
tiv
en
es
s
Thin pellets per two
Stack of thin pellets
Thick pellets one by one
Full energy
0.60
0.70
0.80
0.90
1.00
0.01 0.1 1 10Rres (g cm-2)
Re
lati
ve
Eff
ec
tiv
en
es
s
Thin pellets per two
Stack of thin pellets
Thick pellets one by one
Stack of thick pellets
Full modulated
PlatesProtonbeam
MarkusPlatesProtonbeam
MarkusPlatesProtonbeam
Markus Plates
OR

Ionization chamber dosimetry
Ion recombination (Palmans et al 2006, Phys Med Biol 51:903-17)
BEAM
PHANTOM
IC AIR CAVITIES
IC1 IC2BEAM
PHANTOM
IC AIR CAVITIES
IC1 IC2
Ion chamber perturbations (Palmans 2006, Phys Med Biol 51:3483-501 + ongoing work)
1
2
3
Geometry interrogation region
Protonbeam
E
d /dE
0.0
10.0
20.0
30.0
40.0
50.0
60.0
70.0
0.0 10.0 20.0 30.0
Depth (mm)
D air p
er p
roto
n p
er c
m2
(Gy)
-5.0
0.0
5.0
Differen
ce pd
d an
d
recon
structio
n
Mobit et al. 2000 Med. Phys. 27:2780-2787
78 MeV protons
Jäkel et al. 2000 Phys. Med. Biol. 45:599-607
3 GeV 12C
0.0
0.5
1.0
1.5
2.0
2.5
0.0 20.0 40.0 60.0
depth (mm)
no
rmal
ised
do
se (
a.u
.)
AttixCapintec PR06Reconstructed
0.0
0.5
1.0
1.5
2.0
2.5
3.0
3.5
4.0
4.5
115.0 120.0 125.0 130.0
depth (mm)
rela
tive
do
se
ReferencePTW-30006Markus
Reconstructed 0.995
1.000
1.005
1.010
1.015
1.020
0 5 10 15
Chamber #
Dw
,NE
2571
/Dw
,Ch
C-C&PTW30002
A150-Al&NE2581
PMMA-Al&PTW30001
Nylon66-Al
IC18
ExrT2

Microbolometry
•Absorbed dose to water OK for conventional photon and electron beams•Not sufficient for protons and carbon ions ->absorbed dose * biological quality factor•Need for physical quantity that is relevant for biological effect expressed by CCRI/BIPM
Microbolometer
Energy absorption
Absorber
Squid Superconductor
•NPL SRER project in collaboration with quantum detection group
•UoS/NPL PhD project

Biosensor
• A biochemical system with a relevant biological response to ionising radiation that can be determined physically in a reproducible (and preferably reversible) way.
• Questions to explore:Where is the need?
Level of complexity of response?
How good are biological effects understood?
Engineering of such a system?
