nuclear safety and reliability library/20032208.pdf · nuclear safety and reliability —dan...
TRANSCRIPT

Nuclear Safety and Reliability —Dan Meneley Page 1 of 1
Rev. 1, Oct. 2003
NUCLEAR SAFETY AND RELIABILITY
WEEK 8
TABLE OF CONTENTS - WEEK 8Loss of Primary Coolant Analysis...............................................................................................1
(1) Plant analysis .....................................................................................................................1Potential Leaks or Breaks.....................................................................................................2Potential Causes of LOCA...................................................................................................8LOCA Classifications ..........................................................................................................8Components of LOCA Analysis........................................................................................10
Loss of Primary Coolant Analysis
The objective of this analysis is to calculate the radiation dose to the public, given a fullydefined accident sequence. Loss of coolant accidents (LOCA) are chosen for examination because(a) failure of the primary pressure boundary is a necessary part of any accident sequence whichmight result in radiation doses to the public due to radioactive material release from fuel, (b) allaccident sequences are analyzed to show the level of protection against radiation doses to thepublic, so that they include LOCA implicitly or explicitly as an event tree branch at some level ofprobability, and (c) LOCA accident sequences of various kinds are useful to test many of thecapabilities of the plant safety systems.
The major components of a LOCA analysis are:(1) Plant analysis(2) Containment analysis(3) Radioactive materials dispersion and dose
(1) Plant analysis
The key questions that must be answered are:
1. Where are the potential leaks or breaks in the HT, and how large might they be? 2. Given a coolant leak, what is the coolant discharge rate as a function of time? 3. What is the voiding rate in the core, and the resulting reactivity as a function of time? 4. When is the reactor tripped by SDS1 or SDS2, and what is the subsequent power rundown
as a function of time? 5. What is the coolant flow and inventory distribution around the HT system? 6. How much stored heat is removed from the fuel during blowdown? 7. When is the emergency coolant injection (ECI) flow initiated, and what is the flowrate as a
function of time? 8. At what time do the headers, feeders, and channels refill with water? 9. How is the decay heat removed in the long term?10. What is the reliability of shutdown, emergency cooling, and safety support systems (power,
instrument air, circulating cooling water) under LOCA conditions?

Nuclear Safety and Reliability —Dan Meneley Page 2 of 2
Rev. 1, Oct. 2003
11. If ECI fails after a LOCA, what is the subsequent behavior of fuel channels, and the amountof radioactive material released from fuel to containment?
12. Is there hydrogen produced during the accident sequence due to Zr-water reaction? Can itreach flammable concentrations?
13. Can jet or broken-pipe reaction forces damage containment or other systems in containment?
Many other questions arise in the course of the analysis. In the course of the safetyinvestigation, the designer or operator must address each of these questions.
Potential Leaks or Breaks
Figures 8.1 to 8.7 show the geometry of HT piping in the 600 MWe CANDU.

Nuclear Safety and Reliability —Dan Meneley Page 3 of 3
Rev. 1, Oct. 2003

Nuclear Safety and Reliability —Dan Meneley Page 4 of 4
Rev. 1, Oct. 2003

Nuclear Safety and Reliability —Dan Meneley Page 5 of 5
Rev. 1, Oct. 2003

Nuclear Safety and Reliability —Dan Meneley Page 6 of 6
Rev. 1, Oct. 2003

Nuclear Safety and Reliability —Dan Meneley Page 7 of 7
Rev. 1, Oct. 2003
Potential leak pathways for HT coolant escape are:
(a) Feed/bleed/relief systems - these are active systems which control inventory and pressure inthe HT system. Malfunctions could result in coolant loss through control or relief valvesassociated with the degasser/condenser or through rupture of small lines.
(b) Fueling machines - fueling operations take place about twice a day; during the sequence the HTboundary must be opened at two locations and then resealed.
(c) Pump seals - HT water escapes steadily, at a low rate, through each HT pump shaft seal.There are three seals in series. Massive seal failure (possibly initiated by shaft vibration)would result in a LOCA.
(d) Instrument tube rupture - small diameter, susceptible to vibration.
(e) Steam generator tubes - there are thousands of tubes in each SG; leakage is detected bypresence of heavy water in secondary side light water. Several tubes would have to failsimultaneously to produce significant HT water loss, but resulting LOCA would breach thecontainment boundary. Also, ECI water would not return to the recovery sump.
(f) Pressure tube failure (without calandria tube rupture) - discharge through end fitting bearingspaces ruptures annulus gas bellows.
(g) Feeder pipes or couplings - there are 760 feeders and Grayloc couplings in each unit. Each issubjected to thermal stress and fluid flow vibration. An inlet break can lead to flowstagnation.
Nuclear Safety and Reliability —Dan Meneley Page 8 of 8
Rev. 1, Oct. 2003
(h) End fittings - pressure tube guillotine rupture would result in end load being carried by theyoke on end fitting. Failure of this yoke would eject end fitting and fuel into the vault.Closure plug failure also would eject fuel.
(i) Pressure tube and calandria tube failure - discharge from HT system is into calandria tank --potential for tank overpressure, reaction forces damaging shutoff rod guide tubes andneighboring channels. Possible fuel discharge into calandria.
(j) Headers and large HT piping, pump casings - largest HT breaks considered in licensinganalysis; potential for damage of adjacent equipment or impairment of containment integrity.
(k) Emergency coolant injection lines - penetrate containment boundary, but have multipleisolation valves in series. Would result in LOCA outside containment, with no return of ECIwater for long-term makeup.
Potential Causes of LOCA
The following are listed as immediate causes. The root cause of any accident can be traced tohuman failure of some kind in management, design, manufacture, construction, or operation.
i) Control Malfunction - pressure and inventory control, fueling machine, reactor control, heatremoval control (leading to overpressure rupture) or manual intervention.
ii) Material Degradation - material flaws, either "built in" or due to aging (erosion, corrosion,wear, fatigue) of components. For example -- pressure tubes, steam generator tubes, weldareas in HT piping, piping materials, valves, and seals.
iii) Unusual Stresses - thermal (flow oscillations, flow blockage), mechanical (F/M loads appliedto end fittings, pipe hanger restrictions), hydraulic (pump cavitation, ECI injection) or external(earthquake, explosion).
LOCA Classifications
By Location: i) Inside core - pressure tube+calandria tubeii) Inside reactor vault or boiler room - P/T and annulus gas bellows, piping,feeders, end fittings, instrument tubes, relief valves, etc.iii) Outside containment (SG tubes, ECI lines)
By Size: i) < D2O feed system capacity
ii) ≤ largest feeder pipeiii) ≤ largest HT pipe
Each of these leak classifications introduces some unique challenges to safety systemscapability. Figure 8.8 shows typical total length distributions by piping size for a CANDU unit.

Nuclear Safety and Reliability —Dan Meneley Page 9 of 9
Rev. 1, Oct. 2003
If one presumes that the break probability is proportional to the total piping length (a somewhatquestionable assumption) it can be seen that the occurrence frequency of small LOCA is expectedto be much larger than that of large LOCA. Single instrument tube or SG tube failures result indischarge rates which are much less than the flow capability of the HT feed system at fullpressure, which is about 35 kg/s for two feed pumps. Rupture of the largest feeder pipe results in

Nuclear Safety and Reliability —Dan Meneley Page 10 of 10
Rev. 1, Oct. 2003
a discharge rate much lower than the flow capacity of the ECI system at its normal deliverypressure of around 5 MPa. At this pressure the HT pumps can be operated in low temperatureconditions without cavitation at their inlet. Very large breaks result in rapid systemdepressurization because their discharge rate is far beyond the flow capacity of the ECI system.
Components of LOCA Analysis
The major sub-models required in LOCA analysis are shown in Figure 8.9. Each of thesesub-models involves one or more computer codes of varying complexity and sophistication. Eachof these codes must be verified against plant data or experiments. The type of approximationused is dictated by the use for which the calculation is intended and the detailed characteristics ofthe transient being simulated.
Assumptions: These are determined by the requirements of design, operator information, or plantlicensing. The information requirements for design are closely related to eventual operating licenserequirements because the design must be satisfactory to licensing authorities. Within limits,virtually any level of safety can be designed for (not necessarily achieved), but the cost risesrapidly if requirements are excessive. Usually, licensing calculations must be conservative ratherthan realistic; the results often are not closely related to what one would expect to happen underthe defined accident conditions. Their purpose is merely to satisfy regulatory authorities thatpublic protection is assured during plant operation. In contrast, operations requirements are
Nuclear Safety and Reliability —Dan Meneley Page 11 of 11
Rev. 1, Oct. 2003
strictly for realistic estimates - transient conditions which the plant operators might expect toexperience, and for which they must be trained. The two sets of calculations might produceentirely different results, and must never be confused one for the other.
Once the assumptions are decided, the accident sequence is prepared as input to computer codesused in the analysis.
Heat Transport System Response: The assumed leak initiates an inventory and pressure transientin the HT system. Pressure and flow transients are detected both by the plant process controlsystems and the process trip parameters on SDS1 and SDS2. Coolant voiding in the reactorproduces reactivity changes which increase reactor power and change its spatial distribution.Control and shutdown actions also influence the power level and distribution. Calculation ofpower changes requires 3-dimensional neutronics models; the neutronic equations are couplednon-linearly to those describing fluid flow in the HT system. Fortunately, the coupling betweenneutronic transients and coolant behavior is weak, so the equations can be decoupled.
Emergency coolant injection and steam generator cooldown are initiated by off-normalprocess parameters. Injection and cooldown influence the HT system response by alteringcoolant inventory, temperature, and heat removal rate.
Fuel and Fuel Channel Behaviour: Fuel behavior is influenced primarily by the net heat input tofuel during the transient (stored + decay heat - heat removed by the discharging steam-watermixture and emergency coolant). Fuel burnup prior to the accident determines the total inventoryenclosed inside the fuel sheath. Calculated sheath temperature, stress, and strain conditions ofeach bundle are compared with sheath failure criteria measured experimentally. Post-failurefission product releases also are determined from experimental measurements. Under some severeaccident conditions bundle slumping, heat transfer to the pressure tube, pressure tube distortion,and heat conduction through the calandria tube to moderator water also influence the key releaseparameter, which is fuel temperature. Entry of cool water from the ECI system can add toreleases because of the resultant shattering of fuel particles.
Containment Response: The short term pressure-time dependence of the containment space isdetermined by the steam-water discharge from the HT system, dousing water flow, and vaultcooler heat removal. Containment ventilation pathways are isolated on detection of either highpressure or high radiation level. Hydrogen produced from the zirconium-water reaction enters thecontainment volume, and can reach combustible concentration under certain severe accidentconditions. Hydrogen burning increases containment pressure, which is the driving force forrelease of airborne radioactive species. Long-term pressure history is determined by the balanceof heat production and removal, instrument air inflow, and by activation of the filtered-ventdischarge system.
Radioactive Materials Release from Containment: Determined by the timing, amount, andchemical form of each isotope released through the break in the heat transport system, as well asby the pressure history and leakage pathways. The balance between airborne and water-borneinventories is an important quantity, because water-borne isotopes are effectively trapped insidethe containment space.

Nuclear Safety and Reliability —Dan Meneley Page 12 of 12
Rev. 1, Oct. 2003
Radioactive Materials Dispersion and Dose: This calculation is determined by the amount,timing, half-life, chemical form, biological uptake, and relative biological effectiveness of eachisotope released from containment. Weather conditions (wind, temperature profile, precipitation)and population distribution are important parameters. Dilution within the exclusion zone of 1 kmbetween station and the nearest residence reduces the maximum individual dose. The response ofpeople to the accident (stay-in, evacuation) also is an important factor in total dose accumulation.
Timing: Characteristic time scales of the different phenomena that must be modeled vary over awide range, from milliseconds in the case of rapid neutron power changes and some fluid flowbehavior to months or years in the case of fission product retention in containment. Detectionand shutdown take place within 1 second to a few minutes, heat removal from fuel must continuefor weeks to months, and containment requirements continue until the recovery and cleanupphases are complete. In the event of a severe accident this could be several years (e.g. Three MileIsland Unit 2). This wide time scale poses a considerable challenge to the analyst - he must ensureaccurate prediction of important short-term phenomena within a manageable calculation cost overthe long term.
Computer Models Used in Current CANDU Analysis: Table 8.1 lists the major codes now usedfor LOCA analysis of CANDU stations. Many other supporting codes and models are required.
TABLE 8.1 - Computer Codes Used in CANDU LOCA Analysis
System Modeled Calculation Model EEEEqqqquuuuaaaattttiiiioooonnnnssss SSSSoooollllvvvveeeeddddHeat transport systemresponse
SOPHT, FIREBIRDCATHENA
1-D transient 2-phase flowand heat transfer homogeneousequilibrium or two-fluid)
Space-time power transient CERBERUS, SMOKIN 3-D transient neutron fluxdistribution
Fuel & Fuel Channel Behavior CHAN-II 3-D radiative, conductive,convective heat transfer in fuelchannel
Containment response PRESCON2, PATRIC, VENT 1-D compressible flow, heattransfer, condensation,evaporation, hydrogendeflagration
Moderator thermal-hydraulics MODCIR, 2DMOTH Transient forced and free-convective flow, heat transferin clandria tank
Radioactive MaterialBehaviour in Containment
FI SSCON-II Transport, deposition,resuspension, chemicalkinetics in containment
Radioactive MaterialDispersion and Dose
CSA-N288.2 Modified Gaussian plumedispersion, deposition, humanuptake, cumulative dose
Some further details of these computer models are given below.

Nuclear Safety and Reliability —Dan Meneley Page 13 of 13
Rev. 1, Oct. 2003
Heat Transport System Response: The thermal-hydraulic transient following a LOCA ismodeled by the SOPHT code or equivalent. The main sub-models are:
(1) fluid flow network - HT, feed/bleed/relief, secondary side, ECI, break(2) heat production & transport - fuel, piping, heat exchangers(3) network components - pumps, tanks, valves(4) controllers - process controls, trip systems, digital control computer
A number of constitutive equations including the equations of state for water and variousheat transfer correlations for the various flow regimes also are included in the model. Thesteady-state (pre-accident) equations are solved to provide the initial condition for eachtransient.
(1) Fluid Flow Network
The steam-water mixture is represented by a one-dimensional homogeneous equilibriummodel, in which the steam and water phases are assumed to have equal velocity andtemperature. The piping is segmented into a number of nodes. These nodes are coupled bylinks, as shown in the following diagram. Mass and energy conservation equations are writtenfor the nodes, and the momentum equation is written for the links.
Node i Node j
M U P
A Qi i i
i i i
, ,
, ,ρ
Mass:
Energy:
Momentum:
v,→∑
i
+ +
−
+ ]W
Ai
Aj
Ai i
Aj j
Pkpump
2
21 1 1 1
ρ ρ∆
Link k M U P
A Q
j j j
j j j
, ,
, , ρ
W A L
D K
k k k
k k k
, ,
, , φ 2Ω
d
dtM W Wi
i i
( ) = −→ →
∑ ∑vv
vv, ,
d
dtU W h Wi
i i
( ) = −→ →
∑ ∑v vv
vv, ,
d
dtW
A
LP P
fLk
Dk
KW
kW
k
liA
k
g Hkk
ki j k k k i( ) = − − +
−
φρ
ρΩ ∆2 2

Nuclear Safety and Reliability —Dan Meneley Page 14 of 14
Rev. 1, Oct. 2003
Definitions:
Ak = flow area of link kDk = equivalent diameter of link kF = Darcy friction factorG = gravitational acceleration constant∆Hk = elevation change of link k – up is positive directionhv = specific enthalpy entering node ih*
v = specific enthalpy leaving node iKk = fitting lossesLk = length of link kMi = total mass in node iPi, Pj = pressure in node i, j∆Ppump = pressure change due to pump
Qi = energy entering fluid in node i (due to heat transfer)Ui = total internal energy in node iWk = mass flowrate in link k
ρi = average density in node I
ρli = liquid density in node i
ρi' = effective density
= αρ α ρv + −( )1 1 for homogenous flow model
= for slip flow model
α = void fraction χ = flow quality
φ 2Ωk = two-phase flow pressure drop multipliers
= sum over all links that initiate from node I
= sum over all links that terminate at node i
The mass, energy, and momentum equations are coupled through the water equation ofstate:
P=S(M,U)
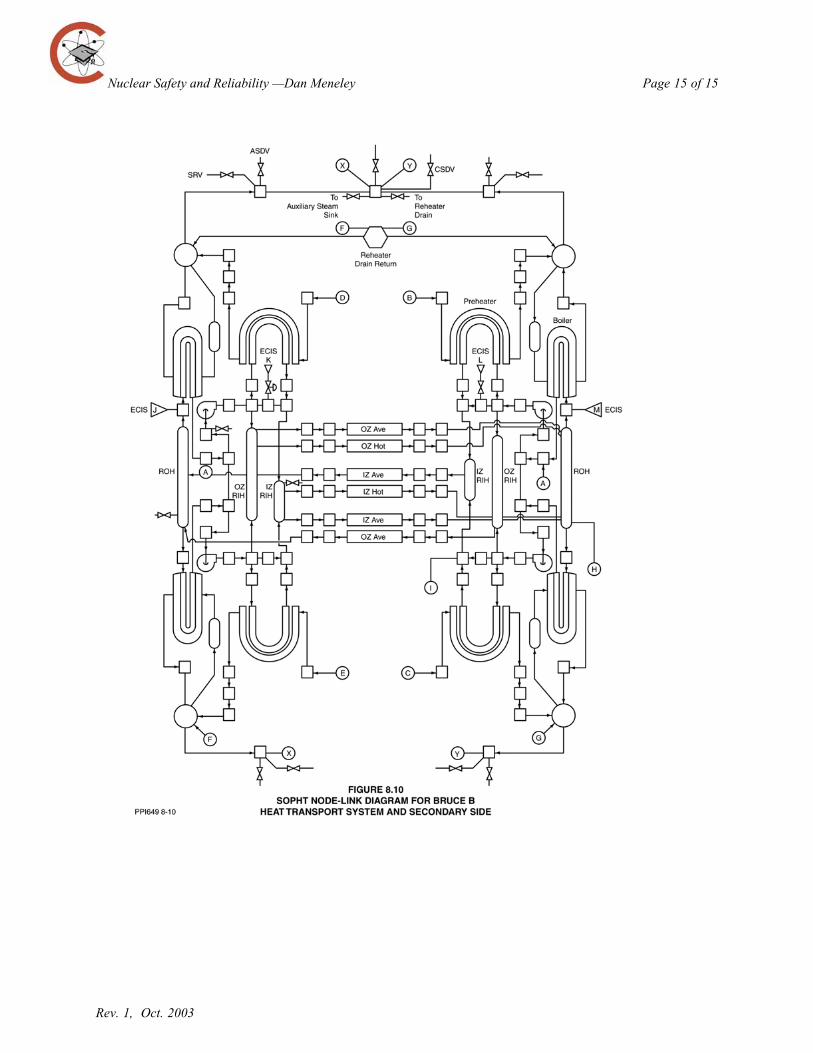
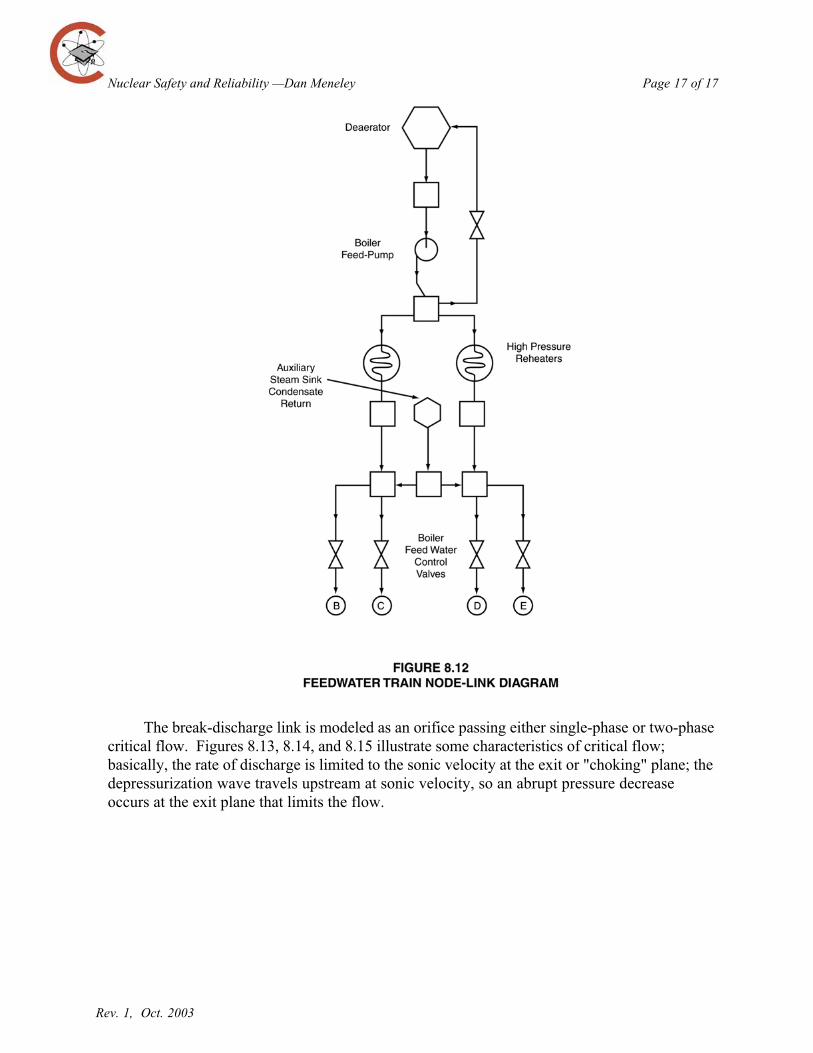
The time derivatives are replaced by their implicit difference form. They are solved ateach time step using a block iterative inversion procedure on the matrix that represents thefinite-difference form of the equations. Figures 8.10, 8.11, and 8.12 show typical node-linklayouts used in CANDU LOCA analysis.
χαρ
χα ρ
2 2
1
111v
+−−
−( )( )
v,i→∑
v,→∑
i
Nuclear Safety and Reliability —Dan Meneley Page 15 of 15
Rev. 1, Oct. 2003

Nuclear Safety and Reliability —Dan Meneley Page 16 of 16
Rev. 1, Oct. 2003
Nuclear Safety and Reliability —Dan Meneley Page 17 of 17
Rev. 1, Oct. 2003
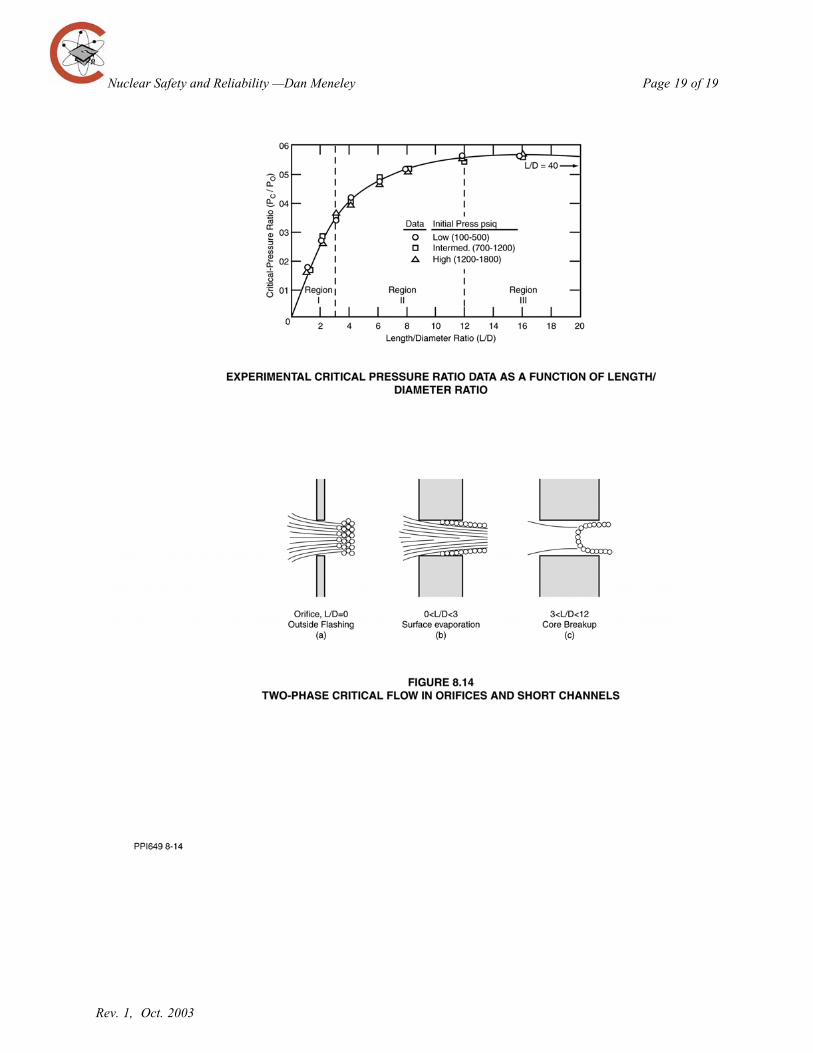
The break-discharge link is modeled as an orifice passing either single-phase or two-phasecritical flow. Figures 8.13, 8.14, and 8.15 illustrate some characteristics of critical flow;basically, the rate of discharge is limited to the sonic velocity at the exit or "choking" plane; thedepressurization wave travels upstream at sonic velocity, so an abrupt pressure decreaseoccurs at the exit plane that limits the flow.

Nuclear Safety and Reliability —Dan Meneley Page 18 of 18
Rev. 1, Oct. 2003
Nuclear Safety and Reliability —Dan Meneley Page 19 of 19
Rev. 1, Oct. 2003

Nuclear Safety and Reliability —Dan Meneley Page 20 of 20
Rev. 1, Oct. 2003
Nuclear Safety and Reliability —Dan Meneley Page 21 of 21
Rev. 1, Oct. 2003
In spite of the apparent complexity of this model, it is the simplest form that canapproximate the actual transient two-phase flow field. The primary strengths of the SOPHTcode are (a) its relative simplicity, (b) all controllers important to the HT system response aremodeled, and (c) it has been successfully checked against actual plant transients in a number ofcases, as well as against a number of LOCA simulation transients in experimental facilities. Itsprimary disadvantage is that it is incapable of modeling steam-liquid separation which occursunder low-flow conditions in some cases, particularly in horizontal fuel channels.
Figures 8.16 to 8.21 show some typical distributions of liquid, two-phase mixture, anddry steam as a function of time following a large HT pipe break - the term "35% Break" refersto a break with cross-sectional area equal to 35 percent of the total break area of the pipe for aguillotine rupture. This area is twice the physical cross-sectional area of the pipe.

Nuclear Safety and Reliability —Dan Meneley Page 22 of 22
Rev. 1, Oct. 2003

Nuclear Safety and Reliability —Dan Meneley Page 23 of 23
Rev. 1, Oct. 2003

Nuclear Safety and Reliability —Dan Meneley Page 24 of 24
Rev. 1, Oct. 2003

Nuclear Safety and Reliability —Dan Meneley Page 25 of 25
Rev. 1, Oct. 2003
Figures 8.22 and 8.23 show short-term pressure transients and medium-term flowtransients for the 35 percent inlet header break. It can be seen that the pressure continues todecrease even though the emergency injection flow initiates at about 10 seconds. In the mediumterm, a flow reversal occurs in one of the core passes; the long term flow pattern remains in theforward direction for this break as long as the HT pumps are on.

Nuclear Safety and Reliability —Dan Meneley Page 26 of 26
Rev. 1, Oct. 2003
Verification of LOCA flow predictions cannot, of course, be done by comparison withthe real thing, so several experimental facilities have been built by AECL-WNRE to test thesemodels. In order of increasing scale these facilities are RD4, RD12, and RD14, the last ofwhich is still in operation. RD14 is a figure-of-eight loop with two full-scale channelscontaining fuel bundle simulators heated by electricity. Feeders, headers, pumps, and steamgenerators are placed at the same vertical elevations as the 600 MWe reactor; components are

Nuclear Safety and Reliability —Dan Meneley Page 27 of 27
Rev. 1, Oct. 2003
scaled to approximately match the channel heat production. Blowdown, injection, and refilltests are done for comparison with calculated values. To date, the general conclusions are (a)depressurization, sheath temperature rise, and inventory during the blowdown phase are quitewell predicted in high channel flow conditions, (b) stratification of flow leads to poorprediction of peak sheath temperatures, and (c) refill of feeders and channels under low flowconditions requires separate predictive models based on experiments. The CanadianWestinghouse Injection Test (CWIT) facility, a full-scale model of headers, feeders, and fuelchannels, has provided the data for semi-empirical refill models that are reasonably good atprediction of refilling parameters.
The refill model is applied when the SOPHT model breaks down during a simulation.From separate tests, it has been found that SOPHT results are unreliable after one of thefollowing limit criteria is reached:
(a) < 50% mass inventory in the HT system(b) > 50% void in upstream reactor header
(c) < 250 kg/m2/sec mass flux in 2-phase channels
Summary: SOPHT or FIREBIRD models give reasonably good results under high flowconditions, but are unreliable when low flow develops. Unfortunately, they are very expensiveto run. There is scope for further development of simpler models that can give reasonablyaccurate results for limited ranges of accident conditions.