numbers, facts and trends shaping the...
TRANSCRIPT
FOR RELEASE FEBRUARY 16, 2017
FOR MEDIA OR OTHER INQUIRIES:
Carroll Doherty, Director of Political Research
Jocelyn Kiley, Associate Director, Research
Bridget Johnson, Communications Associate
202.419.4372
www.pewresearch.org
NUMBERS, FACTS AND TRENDS SHAPING THE WORLD
RECOMMENDED CITATION: Pew Research Center, February, 2017, “In First Month, Views of Trump Are Already Strongly Felt, Deeply Polarized”
PEW RESEARCH CENTER
www.pewresearch.org
About Pew Research Center
Pew Research Center is a nonpartisan fact tank that informs the public about the issues, attitudes
and trends shaping America and the world. It does not take policy positions. It conducts public
opinion polling, demographic research, content analysis and other data-driven social science
research. The Center studies U.S. politics and policy; journalism and media; internet, science and
technology; religion and public life; Hispanic trends; global attitudes and trends; and U.S. social
and demographic trends. All of the Center’s reports are available at www.pewresearch.org. Pew
Research Center is a subsidiary of The Pew Charitable Trusts, its primary funder.
© Pew Research Center 2017

PEW RESEARCH CENTER
www.pewresearch.org
Less than a month after Donald Trump took office, the public’s initial impressions of the new
president are strongly felt, deeply polarized and far more negative than positive.
The latest national survey by Pew Research Center conducted Feb. 7-12 among 1,503 adults, finds
that Trump’s overall job approval is much lower than those of prior presidents in their first weeks
in office: 39% approve of his job performance,
while 56% disapprove.
The intensity of the public’s early views of Trump
is striking: Fully 75% either approve or
disapprove of Trump strongly, compared with
just 17% who feel less strongly. Nearly half (46%)
strongly disapprove of his job performance,
while 29% strongly approve.
This level of strong disapproval already
surpasses strong disapproval for Barack Obama
at any point during the eight years of his
presidency. The only occasion when strong
disapproval of George W. Bush was higher than
for Trump currently was in December 2008,
near the end of his presidency.
And while all presidents dating back to Ronald
Reagan initially attracted at least modest support from the opposing party, Trump gets almost
none. Just 8% of Democrats and Democratic-leaning independents approve of his job
performance – by far the lowest rating for any new president from the opposing party in more
than three decades. By contrast, 84% of Republicans and Republican leaners approve of the way
he is handling his job as president, which is in line with the support past presidents received from
their own parties. For more, see detailed demographic tables on Trump job approval .
2
PEW RESEARCH CENTER
www.pewresearch.org
59
16
89
38
81
9
Total
Rep/Lean Rep
Dem/Lean Dem
Disapprove Approve
8
19
2
20
35
9
17
24
12
53
20
76
Total
Rep/Lean Rep
Dem/Lean Dem
Excellent Good Only fair Poor
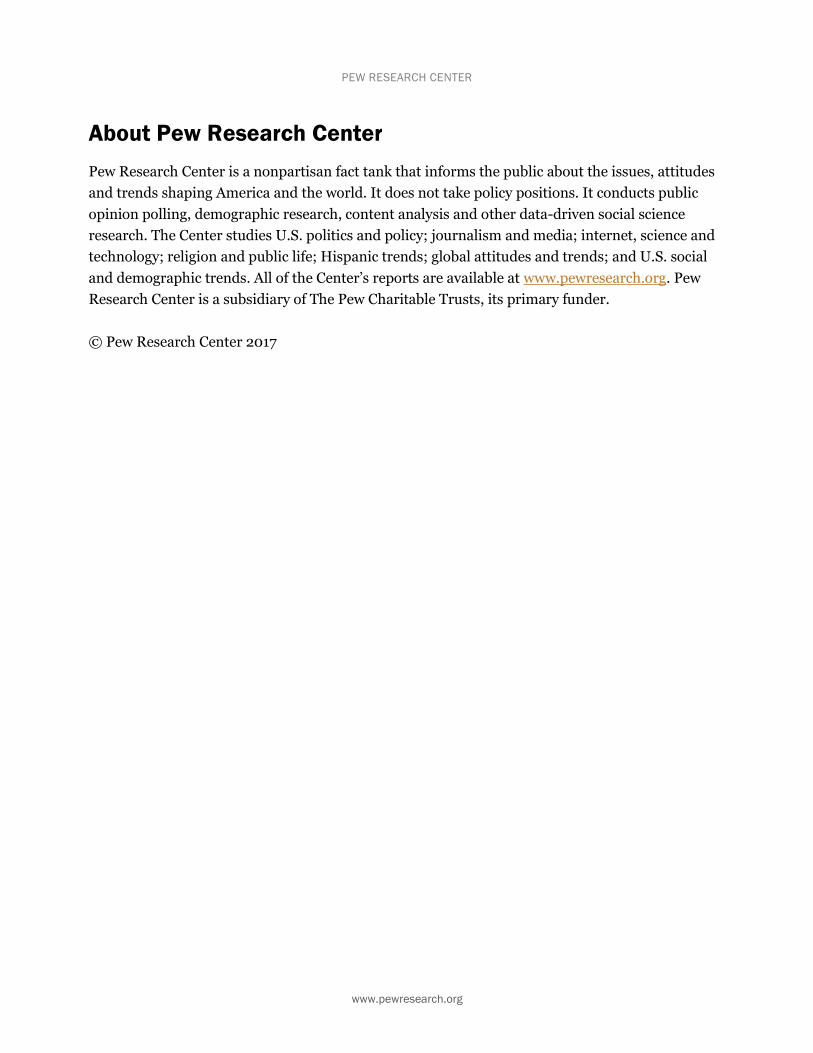
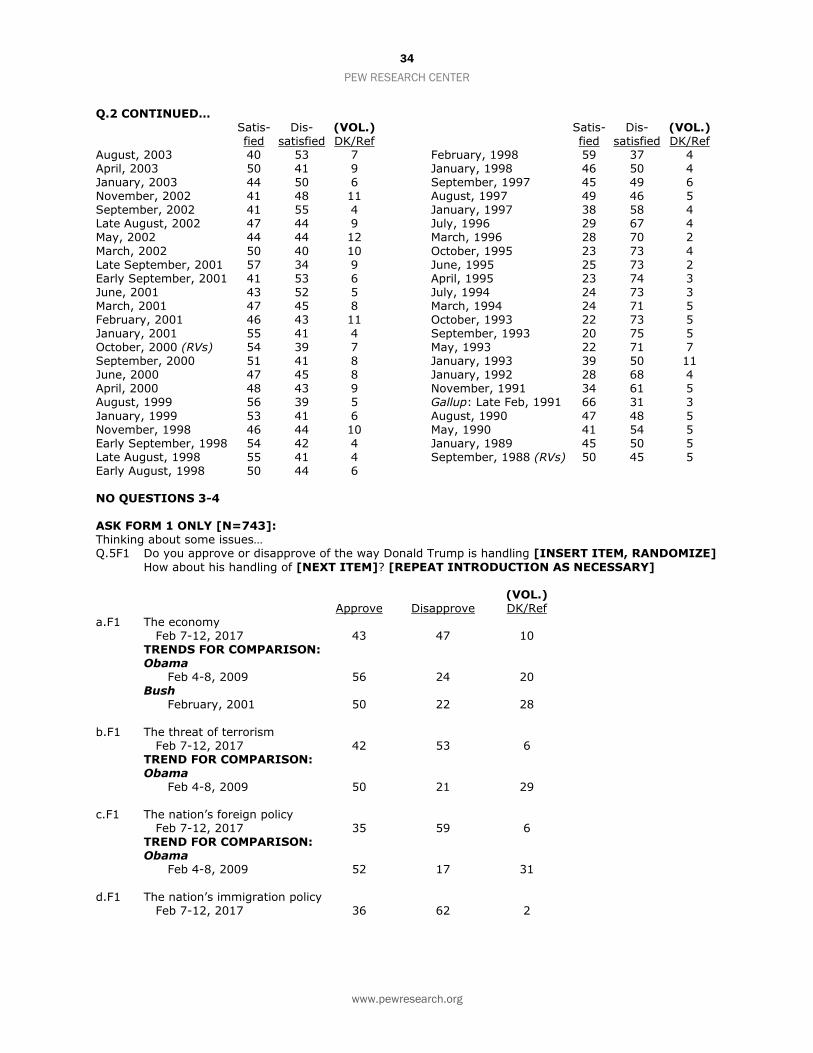
Opinion about Trump’s highest profile policy proposal to date – his executive order limiting entry
to the U.S. by refugees and people from seven Muslim-majority countries – is similar to his overall
job approval. About four-in-ten (38%) approve
of this policy, while 59% disapprove.
The public has a more critical view of how this
executive order, which has been blocked by the
courts, was implemented. Just 28% say that,
regardless of their view of the policy, they
believe the administration did an excellent or
good job of communicating the order and
putting it into effect. While 17% say the
administration did only a fair job of
implementing the policy, 53% say it did a poor
job in this regard.
Even Republicans, who overwhelmingly
approve of Trump’s job performance and the
policy behind the executive order, have mixed
views about the way it was carried out. While
54% say the administration did an excellent or
good job of putting the order into effect, 44%
say it did only fair or poor.
Disapproval of Trump’s refugee policy,
broad criticism of how it was executed
% who ____ of policy to stop refugees and to prevent
people from seven majority-Muslim countries from
entering the U.S.
% who say the Trump administration did an ___ job
communicating and putting into effect the exec order
Note: Don’t know responses not shown. Q36 & Q37.
Source: Survey conducted Feb. 7-12, 2017.
PEW RESEARCH CENTER
3
PEW RESEARCH CENTER
www.pewresearch.org
39
79
62
79
Trump
2017
Obama
2009
Bush
2001
Clinton
1993
37
76
60 63
Trump
2017
Obama
2009
Bush
2001
Clinton
1993
54
70
60
N/A
Trump
2017
Obama
2009
Bush
2001
Clinton
1993
34
92
N/A
84
Trump
2017
Obama
2009
Bush
2001
Clinton
1993
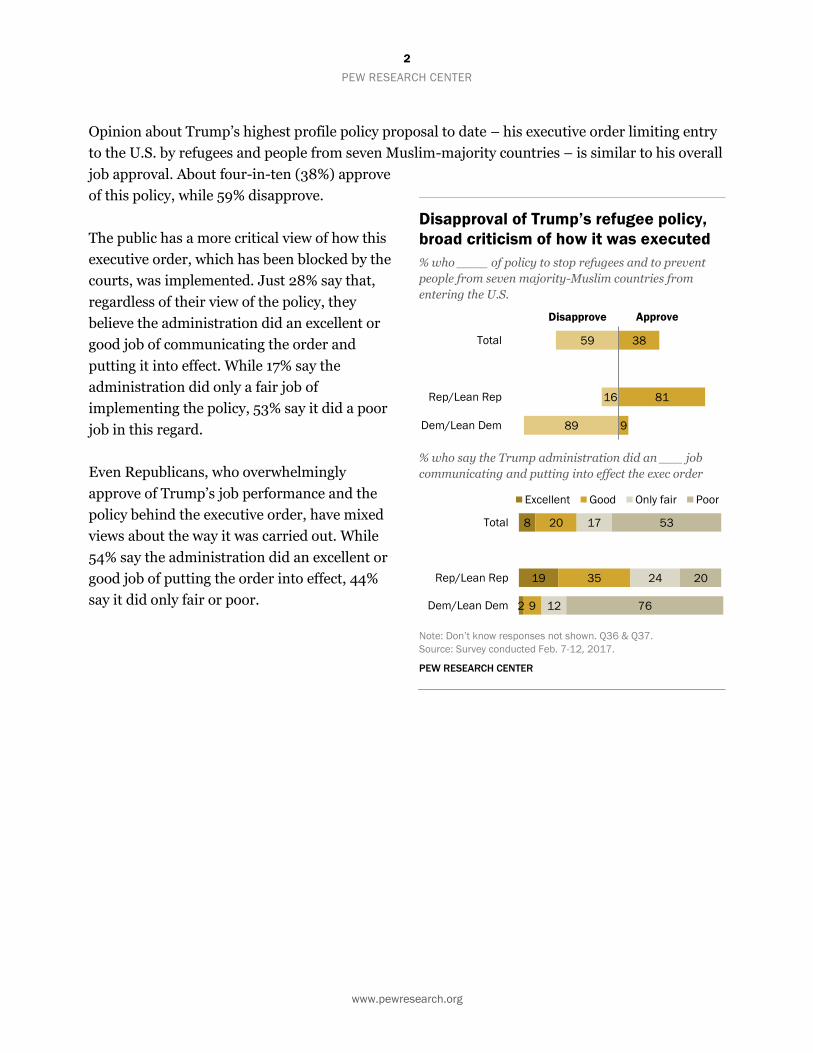
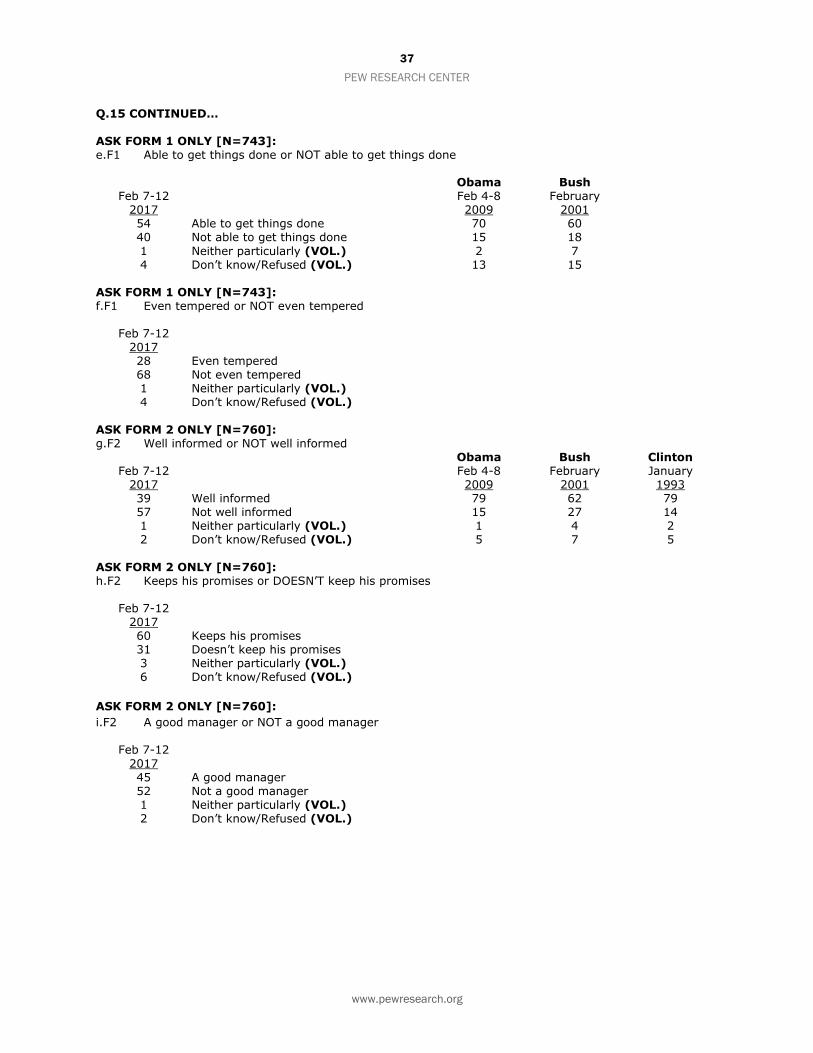
The survey finds that the public gives positive marks to Trump on keeping his promises (60% say
he does this) and his ability to
get things done (54%).
However, on seven other traits
and characteristics – ranging
from his temperament to
whether he is a good manager
– he is viewed more
negatively.
Just 28% of Americans say
Trump is “even-tempered,”
while more than twice as
many (68%) say this phrase
does not describe him.
Trump’s ratings on the traits
for which trends are available
are lower than they were for
Barack Obama, Bill Clinton or
George W. Bush. At similar
points in their presidencies,
majorities said Obama (76%),
Bush (60%) and Clinton
(63%) were trustworthy.
Currently, just 37% view
Trump as trustworthy.
While 39% say Trump is
“well-informed,” nearly twice
as many said that description
applied to Obama in February 2009 (79%) and Clinton in January 1993 (also 79%). In early 2001,
62% said Bush was well-informed.
Trump fares better relative to past presidents in views of his ability to get things done. While 54%
say this description applies to Trump, only somewhat more (60%) said it described Bush in 2001.
In February 2009, 70% said Obama could get things done.
Early impressions: Fewer view Trump as trustworthy,
well-informed compared with Obama, Bush or Clinton
% saying word or phrase describes each …
Trustworthy Well-informed
Able to get things done A good communicator
Note: Q15.
Source: Survey conducted Feb. 7-12, 2017.
PEW RESEARCH CENTER

4
PEW RESEARCH CENTER
www.pewresearch.org
26
16
27
42 45
45 48
39
28 39
24 18
08 09 10 11 12 13 14 15 16 17
Excellent/Good Only fair Poor
20
29
38
26
13
32
48
54
28
08 09 10 11 12 13 14 15 16 17
Same
Better
Worse
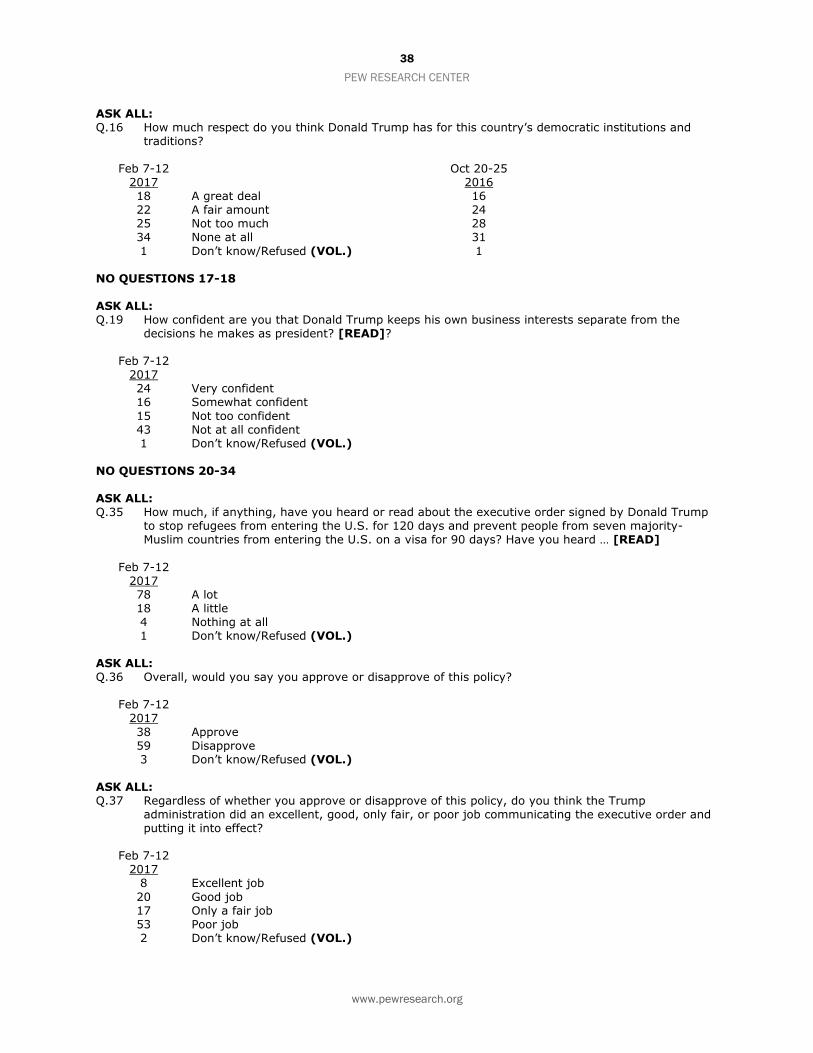
Improved views among Republicans help lift economic ratings. The public’s views of the nation’s
economy – both current and future conditions – continue to be relatively positive. Currently, 42%
rate economic conditions as excellent or good, up 11 percentage points since December. The share
of Republicans who take a positive view of economic conditions has nearly tripled since then, from
14% to 40%, while holding more stable among
Democrats. As in December, Republicans are
much more likely than Democrats to expect
economic conditions to improve (75% vs.
14%).
Most continue to say Trump has little or no
respect for democratic institutions. As was the
case in October, during the campaign, a
majority of Americans (59%) say Trump has
not too much (25%) or no respect at all (34%)
for the nation’s democratic institutions and
traditions; 40% say he has a great deal (18%)
or fair amount (22%) of respect for democratic
institutions.
Racial, ethnic diversity viewed more positively.
Currently, 64% say having an increasing
number of people from different races and
ethnic groups makes the country a better place
to live, up from 56% in August. About three-
quarters of Democrats (76%) and 51% of
Republicans think the nation’s growing
diversity makes it a better place to live.
Economic attitudes turn more positive
Economic conditions in the country today are … (%)
A year from now, economic conditions will be … (%)
Note: Don’t know responses not shown. Q62F1 & Q63F1.
Source: Survey conducted Feb 7-12, 2017.
PEW RESEARCH CENTER

5
PEW RESEARCH CENTER
www.pewresearch.org
56
17
21
25
13
18
39
64
53
56
63
55
6
19
26
19
24
27
Trump
Feb 2017
Obama
Feb 2009
Bush
Feb 2001
Clinton
Feb 1993
Bush
Feb 1989
Reagan
Feb 1981
Disapprove Approve Don't
know
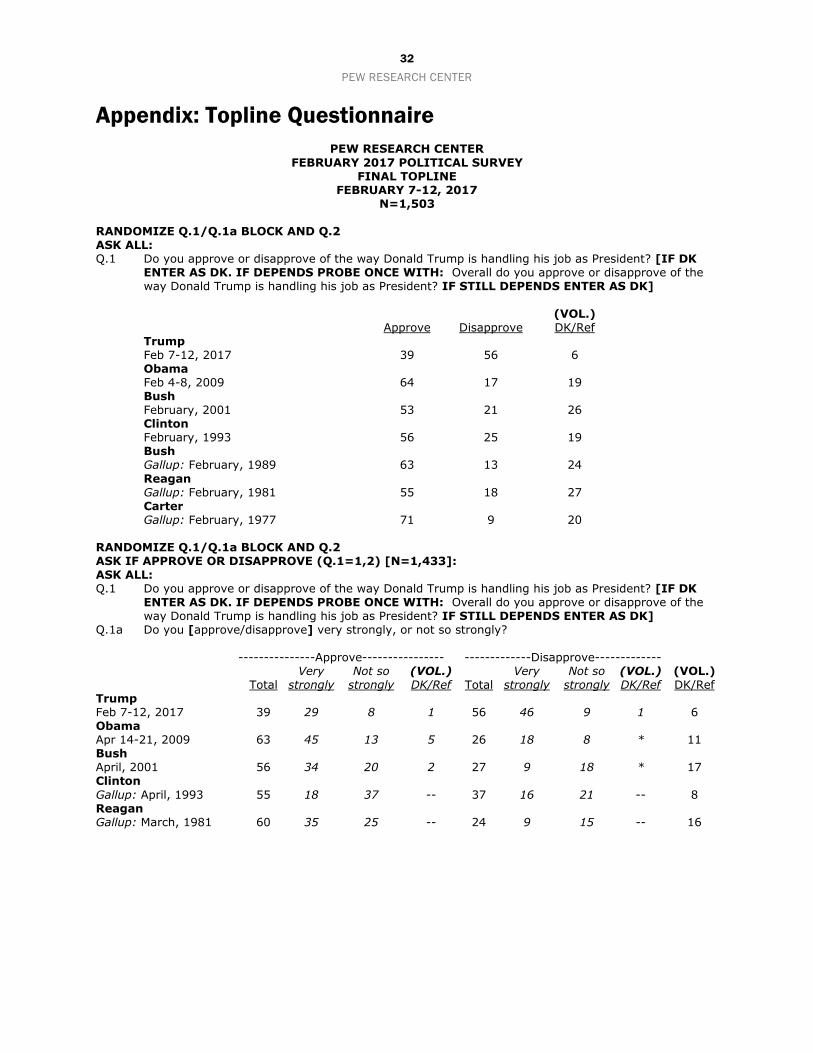
1. Early public attitudes about Donald Trump
Overall, 39% say they approve of how Trump
is handling his job as president, while 56% say
they disapprove and 6% do not offer a view.
Job ratings for Trump are more negative than
for other recent presidents at similar points in
their first terms.
By margins of more than two-to-one, larger
shares of the public approved than
disapproved of the early performance of
Ronald Reagan, George H. W. Bush, Bill
Clinton, George W. Bush and Barack Obama.
For example, in February 2001 – just a few
months after Bush defeated Al Gore, despite
narrowly losing the popular vote – 53%
approved of how he was handling his job,
compared with just 21% who said they
disapproved.
An overwhelming share of the public (94%)
offers a job rating for Trump; just 6% say they don’t know whether they approve or disapprove of
him. By contrast, about two-in-ten or more declined to offer an early view of prior presidents
dating back to Reagan in 1981.
More express early opinion on Trump’s
job than did so for predecessors
Do you approve or disapprove of the way __ is handling
his job as president? (%)
Note: Data for Reagan and George H.W. Bush from Gallup. Q1.
Source: Survey conducted Feb. 7-12, 2017.
PEW RESEARCH CENTER

6
PEW RESEARCH CENTER
www.pewresearch.org
The approval ratings of Trump’s recent predecessors followed different trajectories over the course
of their first years, with a few improving in the eyes of the public, while others saw their ratings
decline.
Clinton began his first term
with an approval rating of 56%,
but his ratings fell to around
40% by the summer of his first
year, before recovering
somewhat by the end of 1993.
Obama saw a gradual decline in
his initially high approval
ratings over his first year. By
contrast, ratings for George H.
W. Bush rose over the course
1989. Ratings for Reagan
initially moved higher, but then
declined later in the year.
Approval ratings for George W.
Bush were around 50% through
the summer of his first year, but
shot up to the mid-80s
following the Sept. 11, 2001 terrorist attacks.

7
PEW RESEARCH CENTER
www.pewresearch.org
Among Republicans and Republican-leaning
independents, 84% say they approve of the job
Trump is doing. This is in line with early levels of
support seen among members of the president’s
own party in recent administrations. However,
just 8% of Democrats and Democratic-leaning
independents say they approve of the job Trump
is doing. This is by far the lowest early approval
rating among members of the party not in
control of the White House over the last six
administrations. Early presidential approval
among out-party members has been no lower
than 30% in prior administrations dating to
Reagan.
8
PEW RESEARCH CENTER
www.pewresearch.org
46
38
54
40
63
56
55
48
41
40
61
54
45
39
55
32
56
48
63
46
79
76
67
61
48
47
69
62
54
51
61
38
29
34
25
39
5
10
15
27
35
40
20
26
29
34
27
46
39
45
33
49
14
17
24
35
47
48
28
35
39
43
36
56
Total
Men
Women
White
Black
Hispanic
18-29
30-49
50-64
65+
Postgrad
College grad
Some college
HS or less
College grad+
Non-college
Not strongly Strongly Not strongly Strongly
Disapprove Approve
Among whites...
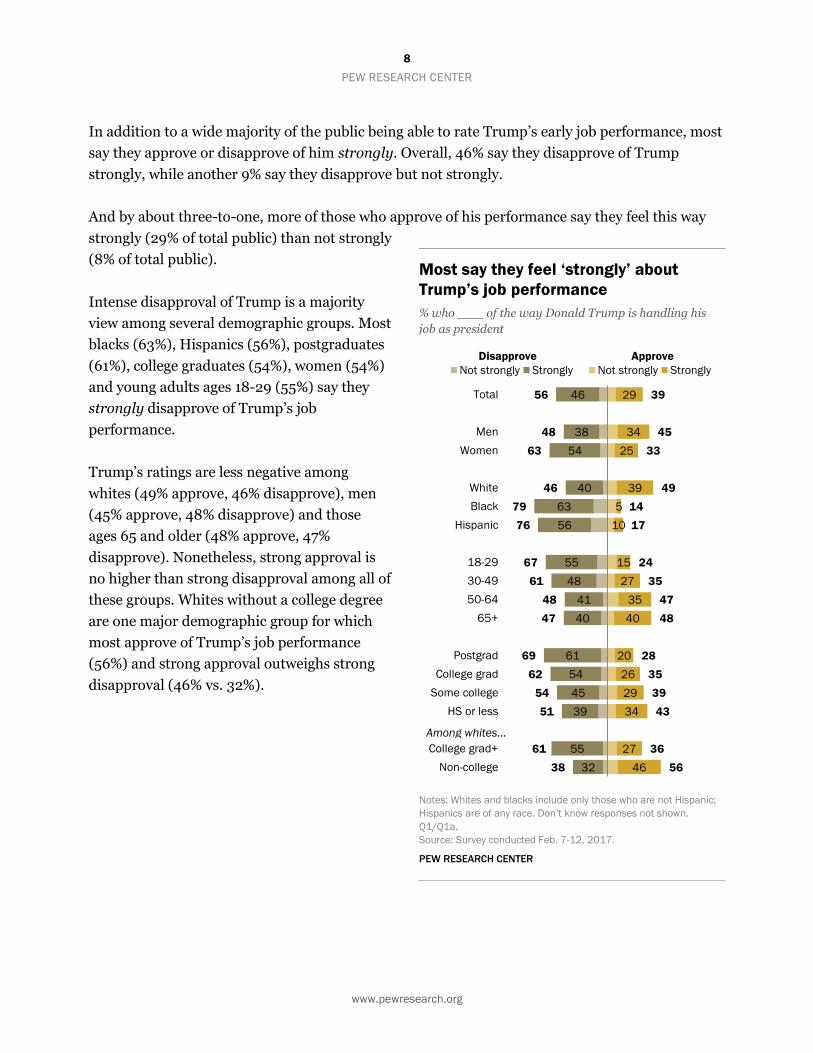
In addition to a wide majority of the public being able to rate Trump’s early job performance, most
say they approve or disapprove of him strongly. Overall, 46% say they disapprove of Trump
strongly, while another 9% say they disapprove but not strongly.
And by about three-to-one, more of those who approve of his performance say they feel this way
strongly (29% of total public) than not strongly
(8% of total public).
Intense disapproval of Trump is a majority
view among several demographic groups. Most
blacks (63%), Hispanics (56%), postgraduates
(61%), college graduates (54%), women (54%)
and young adults ages 18-29 (55%) say they
strongly disapprove of Trump’s job
performance.
Trump’s ratings are less negative among
whites (49% approve, 46% disapprove), men
(45% approve, 48% disapprove) and those
ages 65 and older (48% approve, 47%
disapprove). Nonetheless, strong approval is
no higher than strong disapproval among all of
these groups. Whites without a college degree
are one major demographic group for which
most approve of Trump’s job performance
(56%) and strong approval outweighs strong
disapproval (46% vs. 32%).
Most say they feel ‘strongly’ about
Trump’s job performance
% who of the way Donald Trump is handling his
job as president
Notes: Whites and blacks include only those who are not Hispanic;
Hispanics are of any race. Don’t know responses not shown.
Q1/Q1a.
Source: Survey conducted Feb. 7-12, 2017.
PEW RESEARCH CENTER

9
PEW RESEARCH CENTER
www.pewresearch.org
47
53
62
59
43
42
36
35
10
6
2
6
Economy
Threat of terrorism
Immigration policy
Foreign policy
Disapprove Approve Don't
know
When it comes to specific issues, Trump
receives negative ratings for his handling of
terrorism, immigration and foreign policy; his
ratings on the economy are more evenly split.
Overall, 43% approve of the way Trump is
handling the economy, while 47% say they
disapprove and 10% do not offer a view. More
disapprove (53%) than approve (42%) of how
he is handling the threat of terrorism. About
six-in-ten say they disapprove of how Trump is
handling the nation’s immigration policy
(62%) and foreign policy (59%).
Mixed views of Trump on economy,
negative ratings on other issues
% who ___ of Trump’s handling of … (%)
Note: Figures may not add to 100% because of rounding. Q5.
Source: Survey conducted Feb. 7-12, 2017.
PEW RESEARCH CENTER
10
PEW RESEARCH CENTER
www.pewresearch.org
No, does not describe Yes, describes
31
40
49
52
56
57
59
63
68
60
54
49
45
40
39
37
34
28
Keeps promises
Able to get
things done
Strong leader
Good manager
Cares about
people like me
Well-informed
Trustworthy
Good communicator
Even-tempered
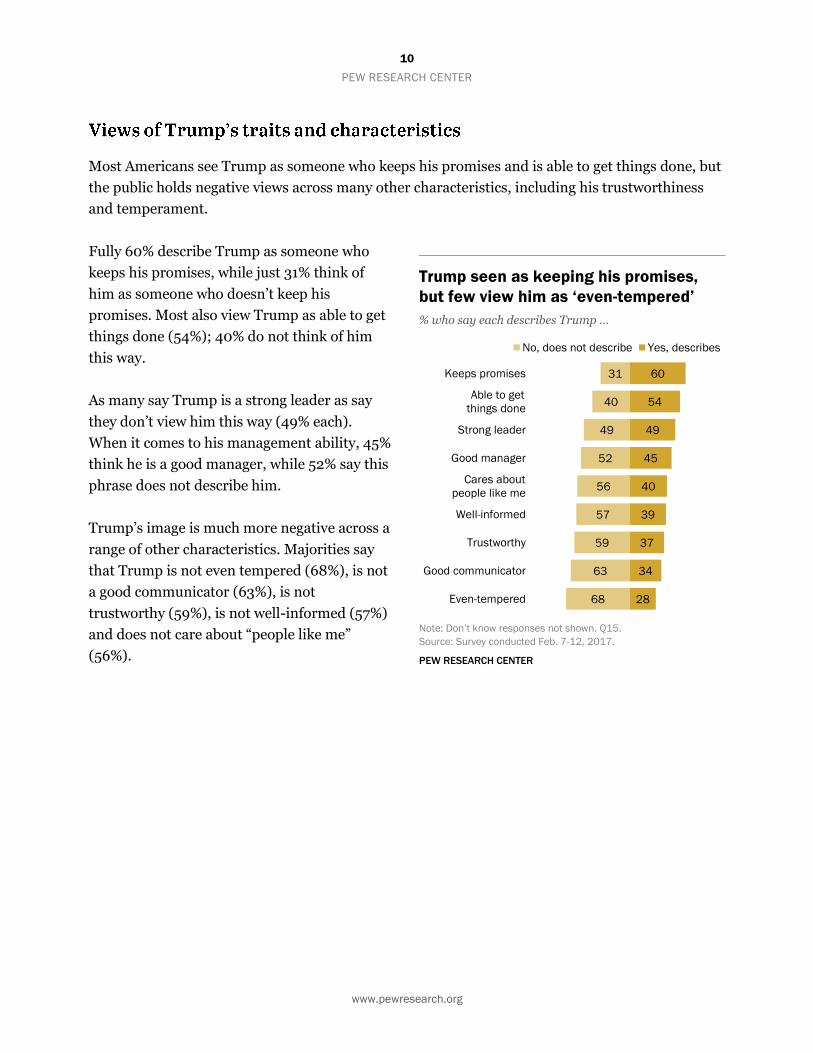
Most Americans see Trump as someone who keeps his promises and is able to get things done, but
the public holds negative views across many other characteristics, including his trustworthiness
and temperament.
Fully 60% describe Trump as someone who
keeps his promises, while just 31% think of
him as someone who doesn’t keep his
promises. Most also view Trump as able to get
things done (54%); 40% do not think of him
this way.
As many say Trump is a strong leader as say
they don’t view him this way (49% each).
When it comes to his management ability, 45%
think he is a good manager, while 52% say this
phrase does not describe him.
Trump’s image is much more negative across a
range of other characteristics. Majorities say
that Trump is not even tempered (68%), is not
a good communicator (63%), is not
trustworthy (59%), is not well-informed (57%)
and does not care about “people like me”
(56%).
Trump seen as keeping his promises,
but few view him as ‘even-tempered’
% who say each describes Trump …
Note: Don’t know responses not shown. Q15.
Source: Survey conducted Feb. 7-12, 2017.
PEW RESEARCH CENTER
11
PEW RESEARCH CENTER
www.pewresearch.org
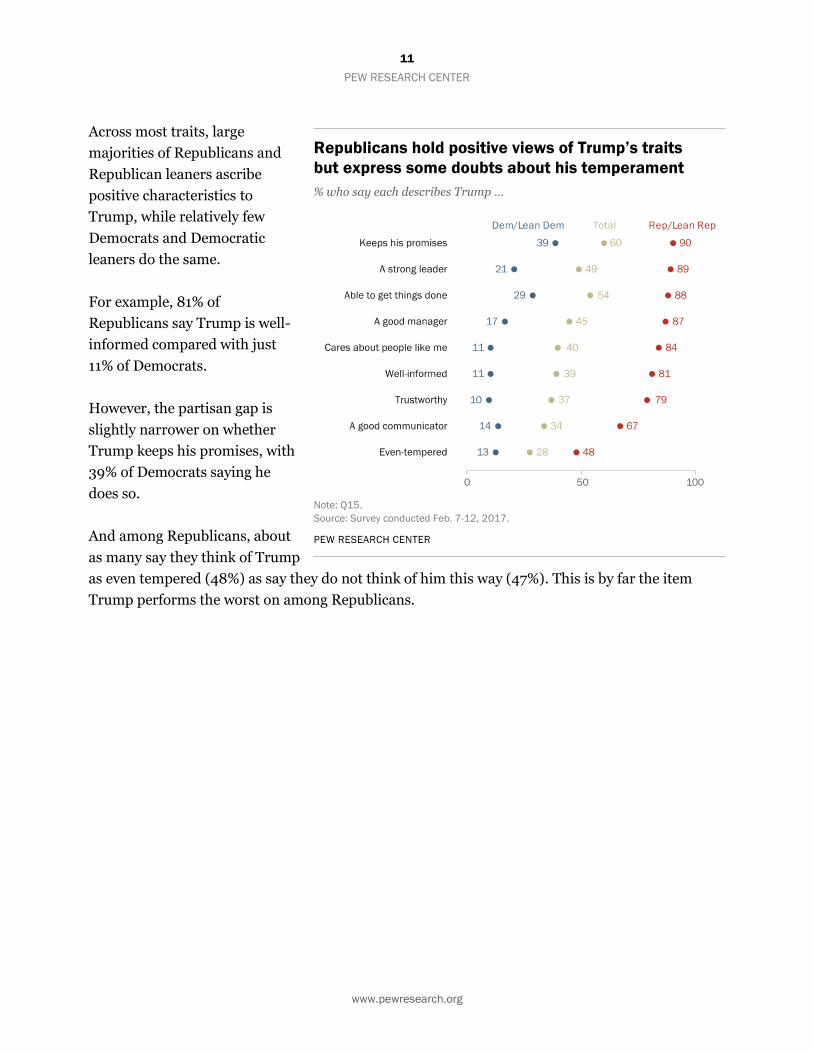
Across most traits, large
majorities of Republicans and
Republican leaners ascribe
positive characteristics to
Trump, while relatively few
Democrats and Democratic
leaners do the same.
For example, 81% of
Republicans say Trump is well-
informed compared with just
11% of Democrats.
However, the partisan gap is
slightly narrower on whether
Trump keeps his promises, with
39% of Democrats saying he
does so.
And among Republicans, about
as many say they think of Trump
as even tempered (48%) as say they do not think of him this way (47%). This is by far the item
Trump performs the worst on among Republicans.

12
PEW RESEARCH CENTER
www.pewresearch.org
59%
65
46
59
40%
33
52
39
Hopeful
Proud
Uneasy
Angry
No Yes
About half of the public (52%) says Trump
makes them feel uneasy; 46% say he does not
make them feel this way. Anger is a less-
commonly held negative emotion: 39% say
Trump makes them feel this way, compared
with 59% who say he does not.
A pair of positive reactions to Trump does not
register widely: 40% of the public says Trump
makes them feel hopeful (59% say he does
not), while 33% say he makes them feel proud
(65% say he does not).
Overall, 84% of Republicans say Trump makes
them feel hopeful and 72% say he makes them
feel proud. Few Republicans say Trump makes
them feel uneasy (16%) or angry (6%).
Among Democrats, more say Trump makes
them feel uneasy (80%) than angry (66%). Just
10% of Democrats say Trump makes them feel
hopeful and only 6% say he makes them feel
proud.
How does Donald Trump make you feel?
Notes: Don’t know responses not shown. Q6.
Source: Survey conducted Feb 7-12, 2017.
PEW RESEARCH CENTER
Large majority of Republicans say
Trump makes them feel ‘hopeful’
% who say Donald Trump makes them feel …
Total Rep/
Lean Rep Dem/
Lean Dem R-D diff
% % %
Hopeful 40 84 10 +74
Proud 33 72 6 +66
Uneasy 52 16 80 -64
Angry 39 6 66 -60
Note: Q6.
Source: Survey conducted Feb 7-12, 2017.
PEW RESEARCH CENTER
13
PEW RESEARCH CENTER
www.pewresearch.org
24
13
20
31
35
19
19
21
31
53
4
16
17
16
16
15
13
13
19
16
29
7
15
19
18
12
10
11
11
16
18
8
18
43
51
45
40
36
57
55
42
35
7
69
Total
18-29
30-49
50-64
65+
Postgrad
College grad
Some college
HS or less
Rep/Lean Rep
Dem/Lean Dem
Very Somewhat Not too Not at all
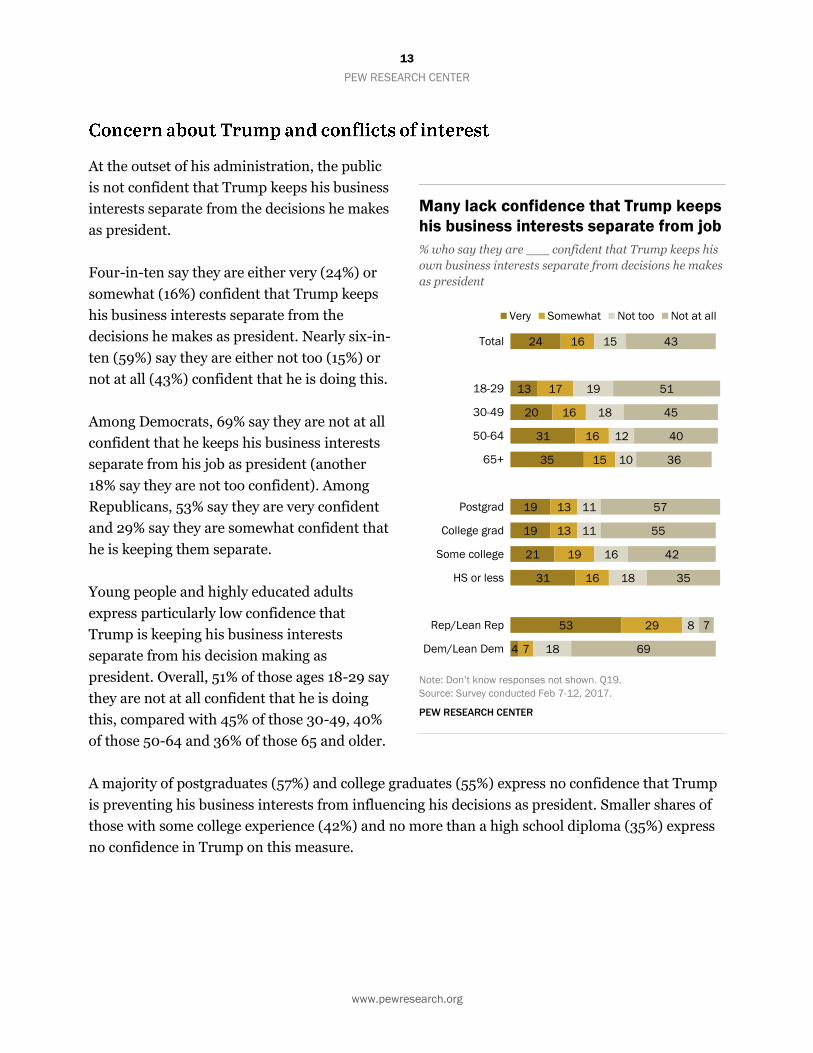
At the outset of his administration, the public
is not confident that Trump keeps his business
interests separate from the decisions he makes
as president.
Four-in-ten say they are either very (24%) or
somewhat (16%) confident that Trump keeps
his business interests separate from the
decisions he makes as president. Nearly six-in-
ten (59%) say they are either not too (15%) or
not at all (43%) confident that he is doing this.
Among Democrats, 69% say they are not at all
confident that he keeps his business interests
separate from his job as president (another
18% say they are not too confident). Among
Republicans, 53% say they are very confident
and 29% say they are somewhat confident that
he is keeping them separate.
Young people and highly educated adults
express particularly low confidence that
Trump is keeping his business interests
separate from his decision making as
president. Overall, 51% of those ages 18-29 say
they are not at all confident that he is doing
this, compared with 45% of those 30-49, 40%
of those 50-64 and 36% 0f those 65 and older.
A majority of postgraduates (57%) and college graduates (55%) express no confidence that Trump
is preventing his business interests from influencing his decisions as president. Smaller shares of
those with some college experience (42%) and no more than a high school diploma (35%) express
no confidence in Trump on this measure.
Many lack confidence that Trump keeps
his business interests separate from job
% who say they are confident that Trump keeps his
own business interests separate from decisions he makes
as president
Note: Don’t know responses not shown. Q19.
Source: Survey conducted Feb 7-12, 2017.
PEW RESEARCH CENTER
14
PEW RESEARCH CENTER
www.pewresearch.org
05
0 1 2 3
A great deal A fair amount Not too much None at all
18
42
2
22
34
13
25
17
31
34
5
54
Total
Rep/Lean Rep
Dem/Lean Dem
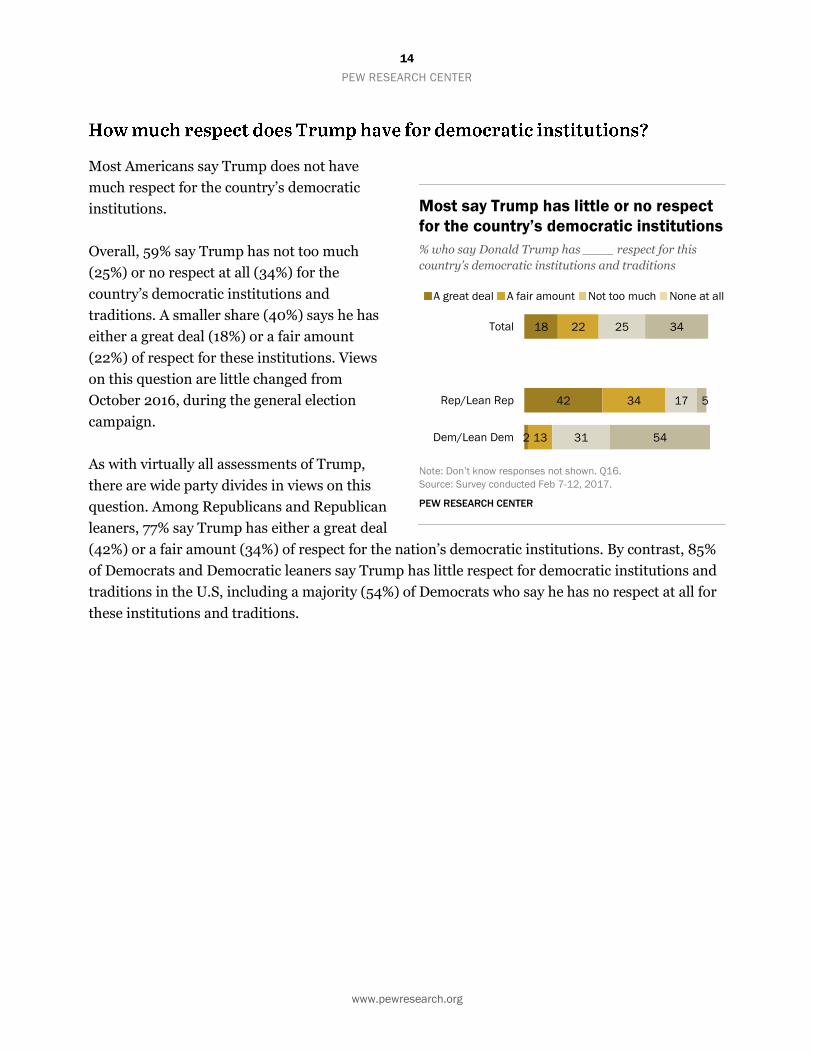
Most Americans say Trump does not have
much respect for the country’s democratic
institutions.
Overall, 59% say Trump has not too much
(25%) or no respect at all (34%) for the
country’s democratic institutions and
traditions. A smaller share (40%) says he has
either a great deal (18%) or a fair amount
(22%) of respect for these institutions. Views
on this question are little changed from
October 2016, during the general election
campaign.
As with virtually all assessments of Trump,
there are wide party divides in views on this
question. Among Republicans and Republican
leaners, 77% say Trump has either a great deal
(42%) or a fair amount (34%) of respect for the nation’s democratic institutions. By contrast, 85%
of Democrats and Democratic leaners say Trump has little respect for democratic institutions and
traditions in the U.S, including a majority (54%) of Democrats who say he has no respect at all for
these institutions and traditions.
Most say Trump has little or no respect
for the country’s democratic institutions
% who say Donald Trump has ____ respect for this
country’s democratic institutions and traditions
Note: Don’t know responses not shown. Q16.
Source: Survey conducted Feb 7-12, 2017.
PEW RESEARCH CENTER
15
PEW RESEARCH CENTER
www.pewresearch.org
57
49
64
48
80
72
71
61
47
47
68
62
56
52
13
87
61
41
41
48
33
51
12
25
26
37
48
52
31
36
41
45
86
11
38
57
Total
Men
Women
White
Black
Hispanic
18-29
30-49
50-64
65+
Postgrad
College grad
Some college
HS or less
Rep/Lean Rep
Dem/Lean Dem
College grad+
Non-college
Unfavorable Favorable
Among whites...
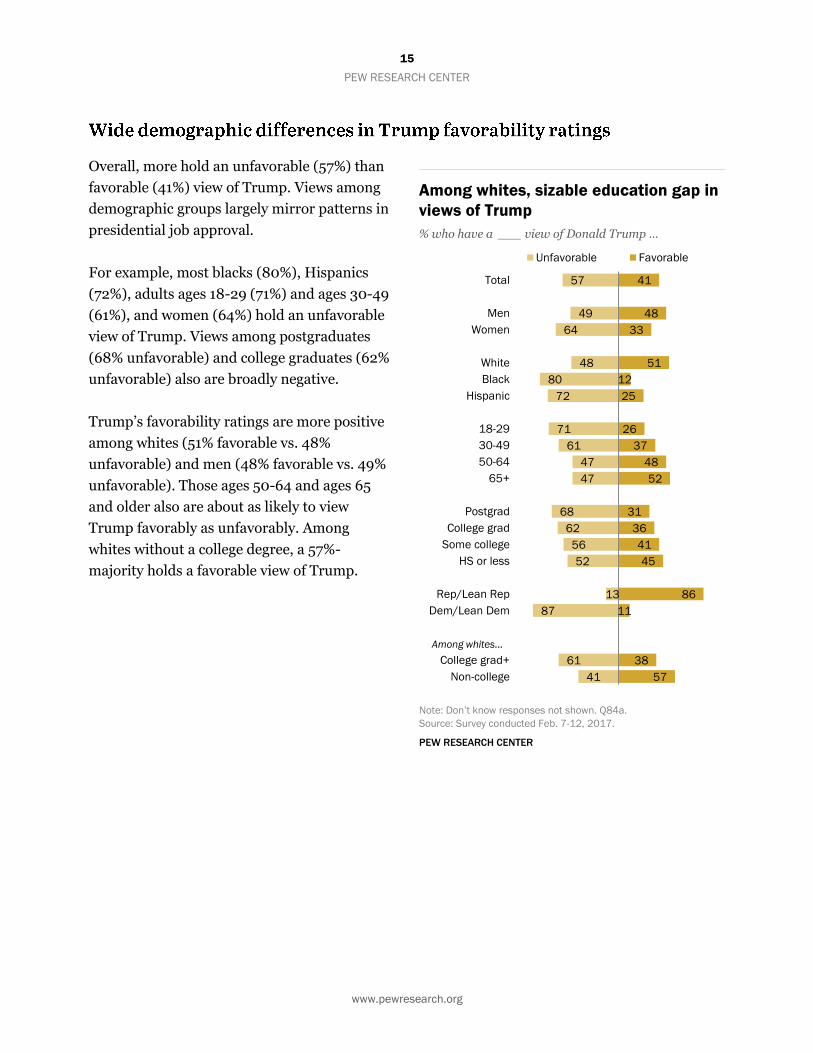
Overall, more hold an unfavorable (57%) than
favorable (41%) view of Trump. Views among
demographic groups largely mirror patterns in
presidential job approval.
For example, most blacks (80%), Hispanics
(72%), adults ages 18-29 (71%) and ages 30-49
(61%), and women (64%) hold an unfavorable
view of Trump. Views among postgraduates
(68% unfavorable) and college graduates (62%
unfavorable) also are broadly negative.
Trump’s favorability ratings are more positive
among whites (51% favorable vs. 48%
unfavorable) and men (48% favorable vs. 49%
unfavorable). Those ages 50-64 and ages 65
and older also are about as likely to view
Trump favorably as unfavorably. Among
whites without a college degree, a 57%-
majority holds a favorable view of Trump.
Among whites, sizable education gap in
views of Trump
% who have a ___ view of Donald Trump …
Note: Don’t know responses not shown. Q84a.
Source: Survey conducted Feb. 7-12, 2017.
PEW RESEARCH CENTER

16
PEW RESEARCH CENTER
www.pewresearch.org
26
42 45
39
28
18
08 09 10 11 12 13 14 15 16 17
Excellent/Good Only fair Poor
20
29
38
26
13
32
48
54
28
08 09 10 11 12 13 14 15 16 17
Same
Better
Worse
Views of the national economy are the most
positive they have been since prior to the Great
Recession. The more positive assessments of
the economy are the result of improved views
among Republicans in the wake of the 2016
election, and steady economic ratings among
Democrats.
Overall, 42% rate economic conditions as
excellent or good, while 39% say they are only
fair and just 18% describe them as poor. This
marks the first time in a decade that about as
many say the economy is excellent or good as
say it is only fair. The share rating the
economy as excellent or good is up 11 points
since December.
Looking ahead, 38% expect economic
conditions to be better in a year, while nearly
as many (32%) think they will be worse; 28%
expect them to be about the same as they are
now. Far more now expect economic
conditions to change over the next year (either
for better or worse) than said this prior to the
election, as views among Republicans have
grown more optimistic and views among
Democrats have become more pessimistic.
Views of current economic conditions
grow more positive
Economic conditions in the country today are … (%)
A year from now, economic conditions will be … (%)
Note: Don’t know responses not shown. Q62F1 & Q63F1.
Source: Survey conducted Feb 7-12, 2017.
PEW RESEARCH CENTER
17
PEW RESEARCH CENTER
www.pewresearch.org
Republican/Lean Rep Democrat/Lean Dem
36
75
34
14
08 09 10 11 12 13 14 15 16 17
45 40
14
46
08 09 10 11 12 13 14 15 16 17
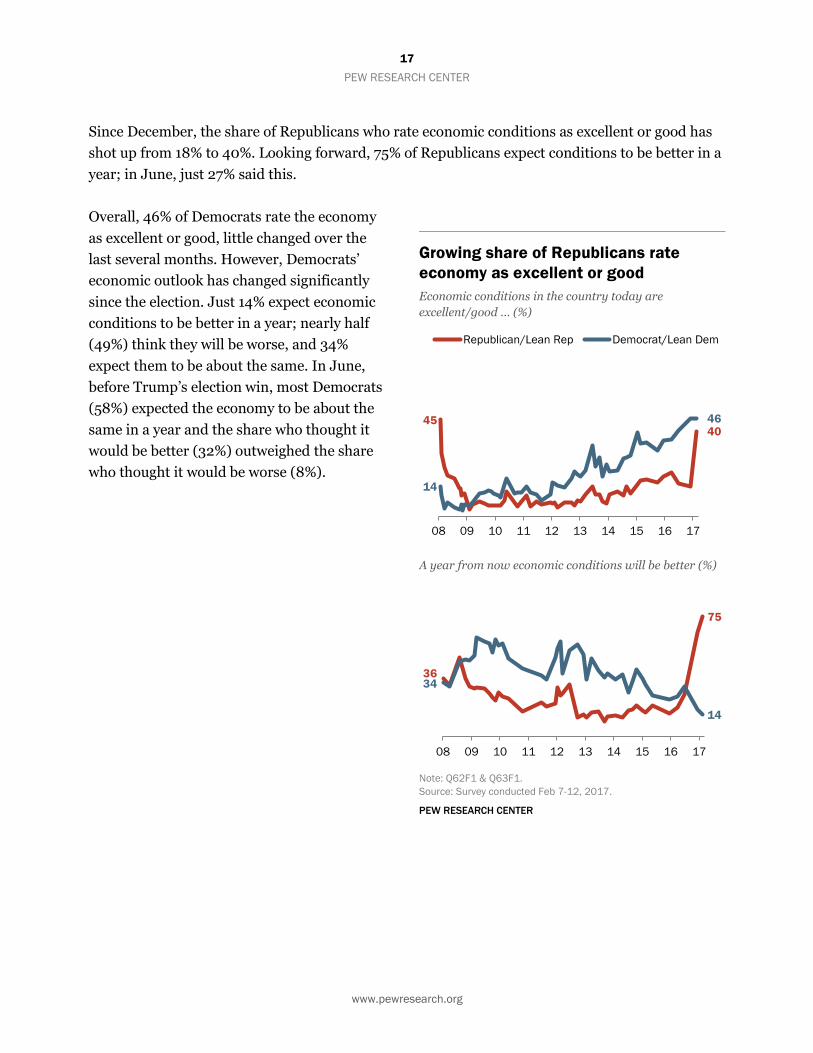
Since December, the share of Republicans who rate economic conditions as excellent or good has
shot up from 18% to 40%. Looking forward, 75% of Republicans expect conditions to be better in a
year; in June, just 27% said this.
Overall, 46% of Democrats rate the economy
as excellent or good, little changed over the
last several months. However, Democrats’
economic outlook has changed significantly
since the election. Just 14% expect economic
conditions to be better in a year; nearly half
(49%) think they will be worse, and 34%
expect them to be about the same. In June,
before Trump’s election win, most Democrats
(58%) expected the economy to be about the
same in a year and the share who thought it
would be better (32%) outweighed the share
who thought it would be worse (8%).
Growing share of Republicans rate
economy as excellent or good
Economic conditions in the country today are
excellent/good … (%)
A year from now economic conditions will be better (%)
Note: Q62F1 & Q63F1.
Source: Survey conducted Feb 7-12, 2017.
PEW RESEARCH CENTER

18
PEW RESEARCH CENTER
www.pewresearch.org
59
53
64
50
84
79
76
62
50
47
69
62
59
54
16
89
22
47
62
74
38
44
32
49
11
17
22
36
46
49
29
36
39
42
81
9
76
50
36
24
Total
Men
Women
White
Black
Hispanic
18-29
30-49
50-64
65+
Postgrad
College grad
Some college
HS or less
Rep/Lean Rep
Dem/Lean Dem
White evang Prot
White mainline Prot
Catholic
Unaffiliated
Disapprove Approve
2. Views of Trump’s executive order on travel restrictions
Most Americans disapprove of the policy outlined in Trump’s executive order to stop refugees
from entering the U.S. for 120 days and to prevent people from seven majority-Muslim countries
from entering the U.S. on a visa for 90 days:
59% say they disapprove, compared with fewer
(38%) who say they approve of this policy.
Nearly all Americans (95%) have heard at least
a little about Trump’s executive order,
including 78% who say they have heard “a lot”
about it – a notably high level of public
awareness.
There are wide demographic differences in
views about the policy outlined in Trump’s
highly-visible executive order.
Whites are divided over the policy: 49%
approve, while about as many (50%)
disapprove. By comparison, wide majorities of
blacks (84%) and Hispanics (79%) say they
disapprove of the policy.
Majorities of those ages 18-29 (76%) and 30-
49 (62%) disapprove of the policy to restrict
entry into the U.S. Older adults hold mixed
views: 47% of those ages 50 and older approve,
while 49% disapprove.
Among white evangelical Protestants, there is
widespread support for the policy outlined in
the executive order. Roughly three-quarters
(76%) of white evangelicals approve,
compared with just 22% who disapprove.
White mainline Protestants express less
support: 50% approve, while about as many
Approval of executive order policy varies
by race, age, education and religion
% who ____ of policy to stop refugees and to prevent
people from seven majority-Muslim countries from
entering the U.S.
Note: Whites and black include only those who are not Hispanic;
Hispanics are of any race. Don’t know responses not shown.
See topline for full question wording. Q36.
Source: Survey conducted Feb. 7-12, 2017.
PEW RESEARCH CENTER

19
PEW RESEARCH CENTER
www.pewresearch.org
8
19
2
20
35
9
17
24
12
53
20
76
Total
Rep/Lean Rep
Dem/Lean Dem
Excellent Good Only fair Poor
(47%) disapprove. Most Catholics (62%) and those unaffiliated with a religion (74%) say they
disapprove of the policy.
Across levels of educational attainment, more say they disapprove than approve of the policy in
Trump’s executive order, though disapproval is greater among those with more education. For
example, 69% of postgraduates disapprove of the policy, compared with 54% of those with no
college experience.
In reflecting on the execution of the order
separate from the policy itself, most rate the
Trump administration negatively. About half
of Americans (53%) say the Trump
administration did a poor job communicating
the executive order and putting it into effect.
Another 17% think the Trump administration
did only a fair job, while 20% say it did a good
job and just 8% say the administration did an
excellent job communicating the order and
putting it into effect.
More Republicans and Republican leaners
think the administration did at least a good job
executing the order than say they did an only fair or a poor job (54% vs. 44%). Still, about as many
Republicans say the Trump administration did a poor job communicating the order and putting it
into effect (20%) as say they did an excellent job (19%).
Democrats and Democratic leaners overwhelmingly rate the Trump administration negatively on
the execution of the order. Roughly three-quarters (76%) say the administration did a poor job,
while 12% say they did an only fair job; just 11% think the administration did an excellent or good
job.
Nearly nine-in-ten (88%) of those who disapprove of the policy outlined in the executive order also
disapprove of the order’s implementation. But even among those who approve of the policy, 40%
say the execution was only fair (26%) or poor (14%); 39% say it was good, while just 19% say it was
excellent.
Trump administration gets low marks
for implementation of executive order
% who say the Trump administration did an ___ job
communicating and putting into effect the exec order
Note: Don’t know responses not shown. Q37.
Source: Survey conducted Feb. 7-12, 2017.
PEW RESEARCH CENTER

20
PEW RESEARCH CENTER
www.pewresearch.org
38
12
58
36
35
36
22
50
4
Total
Rep/Lean Rep
Dem/Lean Dem
Decreases
chance
Increases
chance
Doesn't
make diff
While most disapprove of the executive order’s
policy, there is no consensus view on how it
will impact the country’s security. Overall,
38% think the executive order increases the
chance of a terrorist attack on the U.S., while
about as many (36%) think it doesn’t make
much difference; just 22% say the order
decreases the chance of an attack.
Views on the impact of the executive order
vary significantly by party. Half of Republicans
and Republican leaners think the order
decreases the chance of a terrorist attack;
fewer (35%) think it doesn’t make much
difference, and 12% think it increases the chance of an attack.
By contrast, a 58%-majority of Democrats and Democratic leaners say the order increases the
chance of an attack. Just 4% of Democrats think the order decreases the chance of an attack; about
a third (36%) thinks it doesn’t make much difference either way.
Half of Republicans say executive order
decreases chance of terrorist attack
% who think the executive order _____ of a terrorist
attack on the U.S.
Note: Don’t know responses not shown. Q39.
Source: Survey conducted Feb. 7-12, 2017.
PEW RESEARCH CENTER
21
PEW RESEARCH CENTER
www.pewresearch.org
56
35
33
39
71
59
83
47
21
18
29
66
55
78
Total
Rep/Lean Rep
Dem/Lean Dem
Conserv
Mod/Liberal
Cons/Mod
Liberal
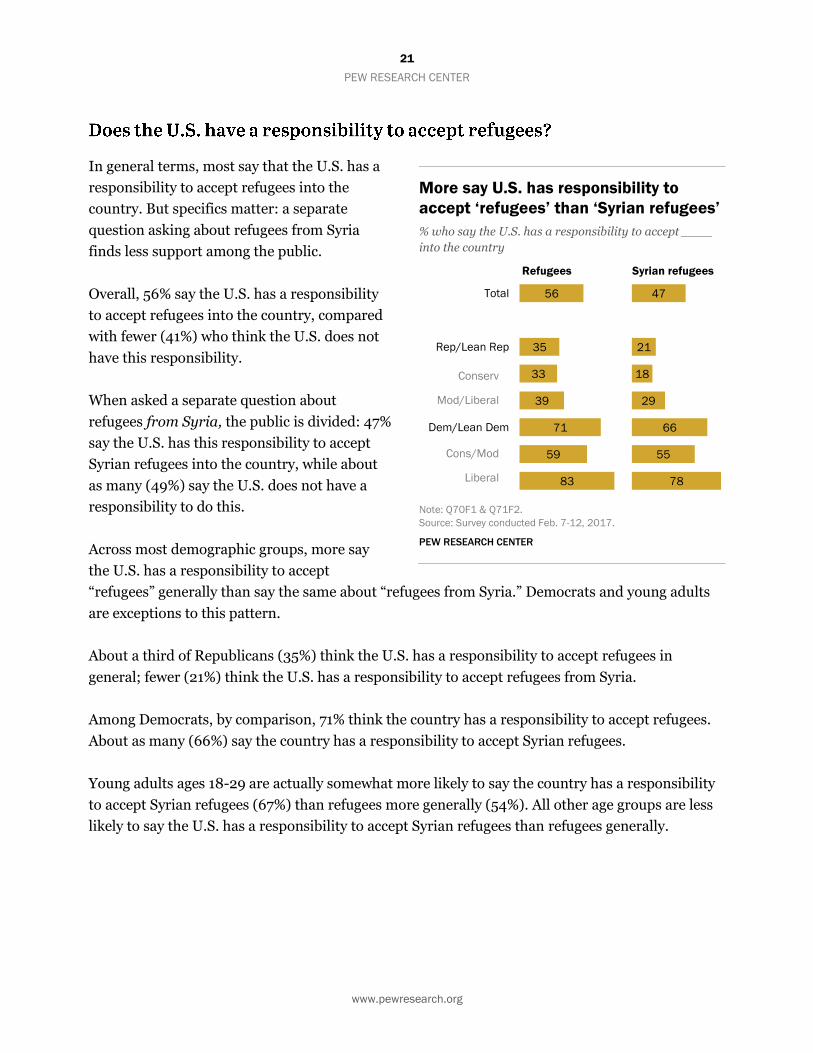
In general terms, most say that the U.S. has a
responsibility to accept refugees into the
country. But specifics matter: a separate
question asking about refugees from Syria
finds less support among the public.
Overall, 56% say the U.S. has a responsibility
to accept refugees into the country, compared
with fewer (41%) who think the U.S. does not
have this responsibility.
When asked a separate question about
refugees from Syria, the public is divided: 47%
say the U.S. has this responsibility to accept
Syrian refugees into the country, while about
as many (49%) say the U.S. does not have a
responsibility to do this.
Across most demographic groups, more say
the U.S. has a responsibility to accept
“refugees” generally than say the same about “refugees from Syria.” Democrats and young adults
are exceptions to this pattern.
About a third of Republicans (35%) think the U.S. has a responsibility to accept refugees in
general; fewer (21%) think the U.S. has a responsibility to accept refugees from Syria.
Among Democrats, by comparison, 71% think the country has a responsibility to accept refugees.
About as many (66%) say the country has a responsibility to accept Syrian refugees.
Young adults ages 18-29 are actually somewhat more likely to say the country has a responsibility
to accept Syrian refugees (67%) than refugees more generally (54%). All other age groups are less
likely to say the U.S. has a responsibility to accept Syrian refugees than refugees generally.
More say U.S. has responsibility to
accept ‘refugees’ than ‘Syrian refugees’
% who say the U.S. has a responsibility to accept ____
into the country
Refugees Syrian refugees
Note: Q70F1 & Q71F2.
Source: Survey conducted Feb. 7-12, 2017.
PEW RESEARCH CENTER
22
PEW RESEARCH CENTER
www.pewresearch.org
49
54
47
40
Feb 2017
Oct 2016
Does not have responsibility Has responsibility
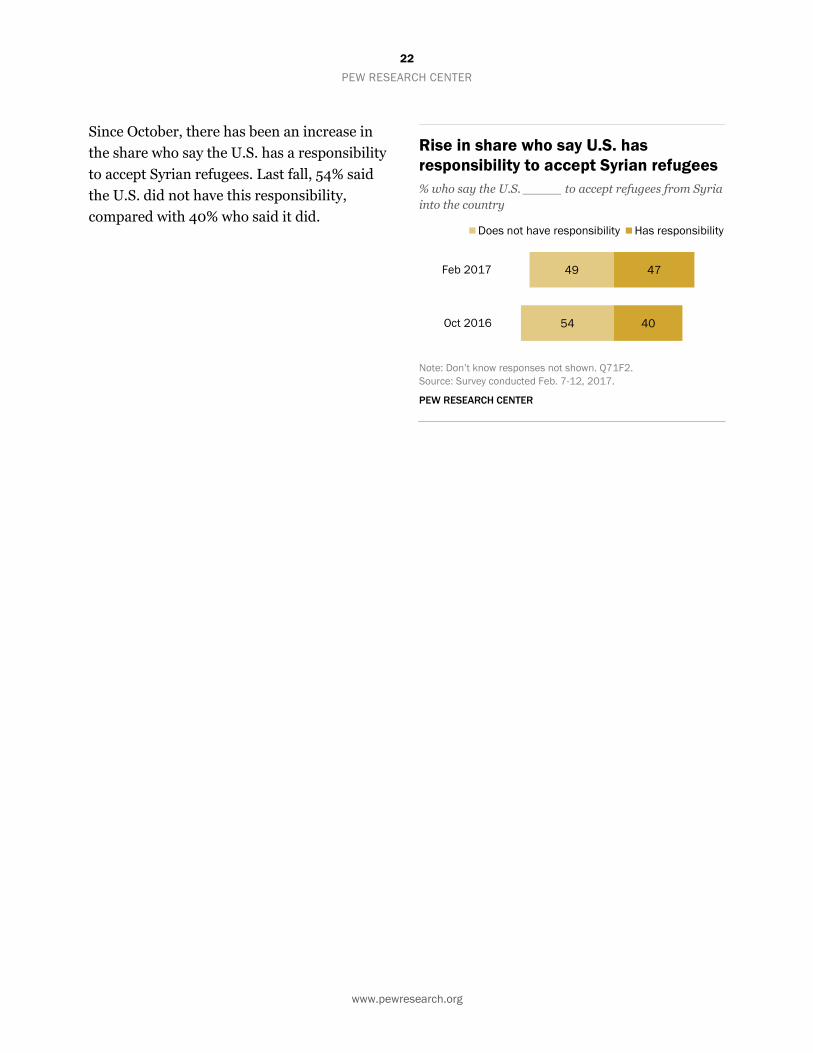
Since October, there has been an increase in
the share who say the U.S. has a responsibility
to accept Syrian refugees. Last fall, 54% said
the U.S. did not have this responsibility,
compared with 40% who said it did.
Rise in share who say U.S. has
responsibility to accept Syrian refugees
% who say the U.S. _____ to accept refugees from Syria
into the country
Note: Don’t know responses not shown. Q71F2.
Source: Survey conducted Feb. 7-12, 2017.
PEW RESEARCH CENTER

23
PEW RESEARCH CENTER
www.pewresearch.org
11
10
9
13
13
6
6
10
15
16
18
10
7
7
6
24
20
24
24
30
16
19
27
28
40
41
39
15
19
11
40
37
46
40
32
53
49
38
33
29
25
37
49
47
51
15
25
14
11
11
16
18
13
14
6
4
11
20
13
26
Total
18-29
30-49
50-64
65+
Postgrad
College grad
Some college
HS or less
Rep/Lean Rep
Dem/Lean Dem
A great deal A fair amount Not much None at all
Conserv
Mod/Liberal
Cons/Mod
Liberal
3. Views of Islam and extremism in the U.S. and abroad
Most Americans do not see widespread support for extremism among Muslims living in the U.S.
Overall, 40% say there is not much support for extremism among U.S. Muslims, while an
additional 15% say there is none at all. About a quarter say there is a fair amount of support (24%)
for extremism among U.S.
Muslims; 11% say there is a
great deal of support.
The share of adults saying
there is not much or no
support for extremism among
U.S. Muslims is 9 percentage
points higher than in 2011
(54% today, 45% in July
2011).
Views on this question vary
widely by age, level of
education and partisan
affiliation.
Younger adults are less likely
to say there is support for
extremism among Muslims in
the U.S. than older adults.
About six-in-ten (62%) of
those 18-29 say there is not
much or no support for
extremism among U.S.
Muslims, while 20% say there
is a fair amount and 10% say
there is a great deal. By comparison, fewer than half (43%) of those ages 65 and older say there is
not much or no support for extremism among U.S. Muslims; 30% say there is a fair amount and
13% say there is a great deal.
A 68%-majority of college-educated adults thinks there is not much or no support for extremism
among U.S. Muslims; those without a college degree offer more mixed views. About half (49%)
Most Americans think there is little support for
extremism among Muslims living in the U.S.
% who say there is _____ support for extremism among Muslims living
in the U.S.
Note: Don’t know responses not shown. Q55.
Source: Survey conducted Feb. 7-12, 2017.
PEW RESEARCH CENTER

24
PEW RESEARCH CENTER
www.pewresearch.org
think there is not much or no support for extremism among U.S. Muslims, while 27% think there
is a fair amount and 13% say there is a great deal.
Among those who say they personally know someone who is Muslim, 60% say there is either not
much (44%) or no (16%) support for extremism among U.S. Muslims. By contrast, those who do
not personally know someone who is Muslim are more divided: 48% say there is not much or no
support for extremism among U.S. Muslims, while 27% say there is a fair amount and 13% say
there is a great deal.
Partisans also are divided on the level of support for extremism among Muslims in the U.S.
Relatively few Republicans (16%) or Democrats (7%) think there is a great deal of support for
extremism among U.S. Muslims, but 40% of Republicans say there is a fair amount of support,
compared with just 15% of Democrats who say this.
Most conservative Republicans think there is a great deal (18%) or a fair amount (41%) of support
for extremism among U.S. Muslims. By contrast, roughly three-quarters of liberal Democrats think
there is not much (51%) or no support at all (26%) among Muslims living in the U.S.
25
PEW RESEARCH CENTER
www.pewresearch.org
49
67
77
48
40
48
32
83
90
91
87
82
84
80
43
64
71
51
30
42
20
70
88
90
84
61
74
48
Total
Rep/Lean Rep
Dem/Lean Dem
Very Somewhat Very Somewhat
Conserv
Mod/Liberal
Cons/Mod
Liberal
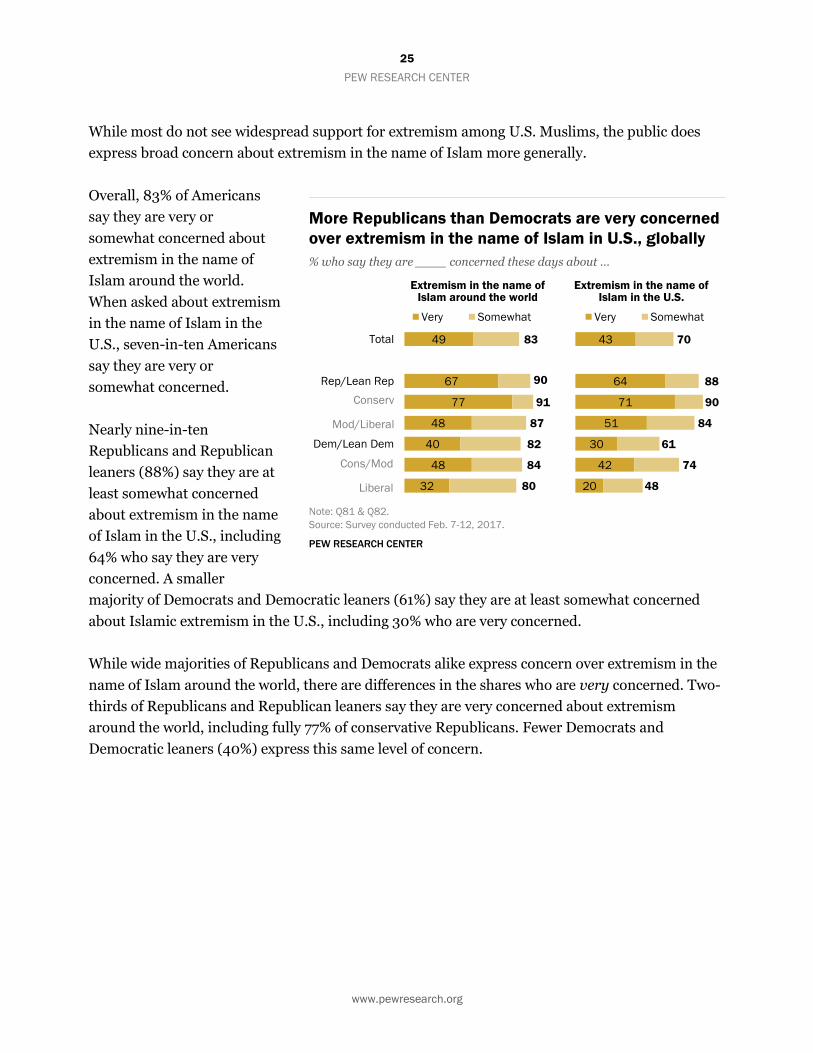
While most do not see widespread support for extremism among U.S. Muslims, the public does
express broad concern about extremism in the name of Islam more generally.
Overall, 83% of Americans
say they are very or
somewhat concerned about
extremism in the name of
Islam around the world.
When asked about extremism
in the name of Islam in the
U.S., seven-in-ten Americans
say they are very or
somewhat concerned.
Nearly nine-in-ten
Republicans and Republican
leaners (88%) say they are at
least somewhat concerned
about extremism in the name
of Islam in the U.S., including
64% who say they are very
concerned. A smaller
majority of Democrats and Democratic leaners (61%) say they are at least somewhat concerned
about Islamic extremism in the U.S., including 30% who are very concerned.
While wide majorities of Republicans and Democrats alike express concern over extremism in the
name of Islam around the world, there are differences in the shares who are very concerned. Two-
thirds of Republicans and Republican leaners say they are very concerned about extremism
around the world, including fully 77% of conservative Republicans. Fewer Democrats and
Democratic leaners (40%) express this same level of concern.
More Republicans than Democrats are very concerned
over extremism in the name of Islam in U.S., globally
% who say they are ____ concerned these days about …
Extremism in the name of
Islam around the world Extremism in the name of
Islam in the U.S.
Note: Q81 & Q82.
Source: Survey conducted Feb. 7-12, 2017.
PEW RESEARCH CENTER
26
PEW RESEARCH CENTER
www.pewresearch.org
48
37
62
49
33 27
33
17 24
10
15
07 09 11 13 15 17
Very Somewhat Not too/Not at all
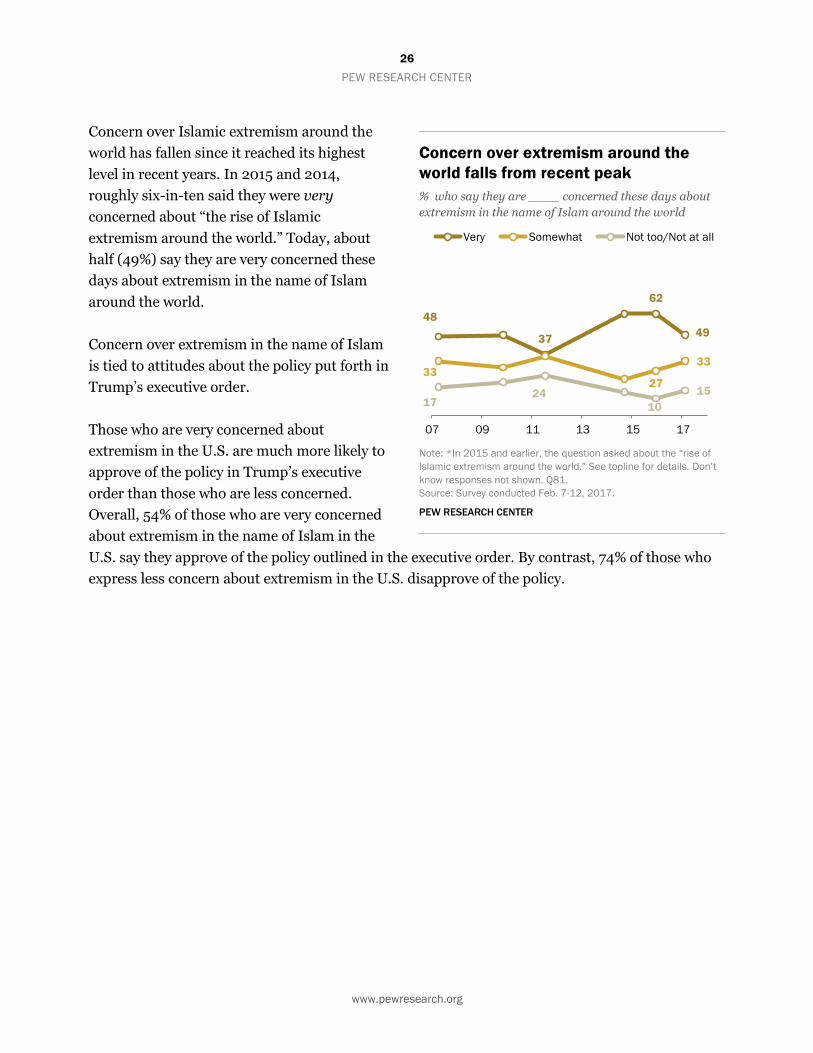
Concern over Islamic extremism around the
world has fallen since it reached its highest
level in recent years. In 2015 and 2014,
roughly six-in-ten said they were very
concerned about “the rise of Islamic
extremism around the world.” Today, about
half (49%) say they are very concerned these
days about extremism in the name of Islam
around the world.
Concern over extremism in the name of Islam
is tied to attitudes about the policy put forth in
Trump’s executive order.
Those who are very concerned about
extremism in the U.S. are much more likely to
approve of the policy in Trump’s executive
order than those who are less concerned.
Overall, 54% of those who are very concerned
about extremism in the name of Islam in the
U.S. say they approve of the policy outlined in the executive order. By contrast, 74% of those who
express less concern about extremism in the U.S. disapprove of the policy.
Concern over extremism around the
world falls from recent peak
% who say they are ____ concerned these days about
extremism in the name of Islam around the world
Note: *In 2015 and earlier, the question asked about the “rise of
Islamic extremism around the world.” See topline for details. Don’t
know responses not shown. Q81.
Source: Survey conducted Feb. 7-12, 2017.
PEW RESEARCH CENTER

27
PEW RESEARCH CENTER
www.pewresearch.org
64
70
66
61
59
79
71
70
53
51
45
62
76
71
81
29
27
27
32
30
17
25
25
36
38
42
31
20
25
15
5
2
5
6
5
3
2
3
8
8
10
4
3
4
3
Total
18-29
30-49
50-64
65+
Postgrad
College grad
Some college
HS or less
Rep/Lean Rep
Dem/Lean Dem
Conserv
Mod/Liberal
Cons/Mod
Liberal
Better place No difference Worse place
4. Attitudes toward increasing diversity in the U.S.
Nearly two-thirds of Americans (64%) say an increasing number of people from different races,
ethnic groups and nationalities in the U.S. makes the country a better place to live; fewer (29%)
think growing diversity in the country does not make much difference, and just 5% think it makes
the country a worse place to
live.
The share that thinks growing
diversity makes the country a
better place to live has
increased eight points from
last August, when a smaller
majority (56%) held this view.
An overwhelming share of
adults with a postgraduate
degree (79%) say that growing
diversity makes the U.S. a
better place to live, as do
about seven-in-ten of those
with a college degree or some
college experience. About half
of those with a high school
diploma or less education
(53%) think more people of
different races and ethnicities
in the U.S. makes the country
a better place; 36% think it
makes no difference either
way.
Majorities across all age groups think increasing diversity makes the U.S. a better place, though
younger adults are somewhat more likely to say this than adults ages 50 and older.
Today, 76% of Democrats and Democratic leaners think growing diversity in the U.S. makes the
country better. The share of Democrats who say this is up 10 points since August.
Most think growing racial and ethnic diversity in the
U.S. makes the country a better place to live
% who say an increasing number of people of different races and ethnicities
makes the U.S. _____ to live
Note: Don’t know responses not shown. Q65.
Source: Survey conducted Feb. 7-12, 2017.
PEW RESEARCH CENTER
28
PEW RESEARCH CENTER
www.pewresearch.org
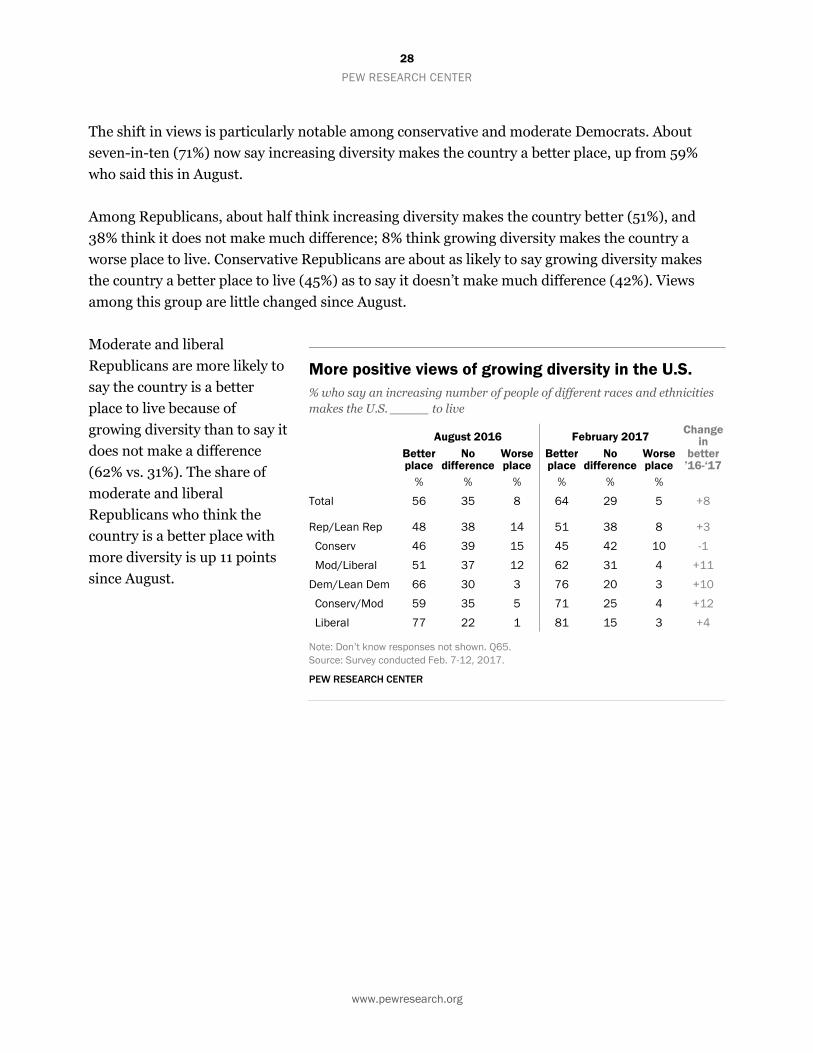
The shift in views is particularly notable among conservative and moderate Democrats. About
seven-in-ten (71%) now say increasing diversity makes the country a better place, up from 59%
who said this in August.
Among Republicans, about half think increasing diversity makes the country better (51%), and
38% think it does not make much difference; 8% think growing diversity makes the country a
worse place to live. Conservative Republicans are about as likely to say growing diversity makes
the country a better place to live (45%) as to say it doesn’t make much difference (42%). Views
among this group are little changed since August.
Moderate and liberal
Republicans are more likely to
say the country is a better
place to live because of
growing diversity than to say it
does not make a difference
(62% vs. 31%). The share of
moderate and liberal
Republicans who think the
country is a better place with
more diversity is up 11 points
since August.
More positive views of growing diversity in the U.S.
% who say an increasing number of people of different races and ethnicities
makes the U.S. _____ to live
August 2016 February 2017 Change
in better ’16-‘17
Better place
No difference
Worse place
Better place
No difference
Worse place
% % % % % %
Total 56 35 8 64 29 5 +8
Rep/Lean Rep 48 38 14 51 38 8 +3
Conserv 46 39 15 45 42 10 -1
Mod/Liberal 51 37 12 62 31 4 +11
Dem/Lean Dem 66 30 3 76 20 3 +10
Conserv/Mod 59 35 5 71 25 4 +12
Liberal 77 22 1 81 15 3 +4
Note: Don’t know responses not shown. Q65.
Source: Survey conducted Feb. 7-12, 2017.
PEW RESEARCH CENTER

29
PEW RESEARCH CENTER
www.pewresearch.org
Acknowledgements
This report is a collaborative effort based on the input and analysis of the following individuals:
Research team
Carroll Doherty, Director, Political Research
Jocelyn Kiley, Associate Director, Political Research
Alec Tyson, Senior Researcher
Bradley Jones, Research Associate
Baxter Oliphant, Research Associate
Rob Suls, Research Associate
Hannah Fingerhut, Research Assistant
Shiva Maniam, Research Assistant
Samantha Smith, Research Assistant
Communications and editorial
Bridget Johnson, Communications Associate
Graphic design and web publishing
Peter Bell, Information Graphics Designer

30
PEW RESEARCH CENTER
www.pewresearch.org
Methodology
The analysis in this report is based on telephone interviews conducted February 7-12, 2017 among
a national sample of 1,503 adults, 18 years of age or older, living in all 50 U.S. states and the
District of Columbia (377 respondents were interviewed on a landline telephone, and 1,126 were
interviewed on a cell phone, including 680 who had no landline telephone). The survey was
conducted by interviewers at Princeton Data Source under the direction of Princeton Survey
Research Associates International. A combination of landline and cell phone random digit dial
samples were used; both samples were provided by Survey Sampling International. Interviews
were conducted in English and Spanish. Respondents in the landline sample were selected by
randomly asking for the youngest adult male or female who is now at home. Interviews in the cell
sample were conducted with the person who answered the phone, if that person was an adult 18
years of age or older. For detailed information about our survey methodology, see
http://www.pewresearch.org/methodology/u-s-survey-research/
The combined landline and cell phone sample are weighted using an iterative technique that
matches gender, age, education, race, Hispanic origin and nativity and region to parameters from
the 2015 Census Bureau's American Community Survey and population density to parameters
from the Decennial Census. The sample also is weighted to match current patterns of telephone
status (landline only, cell phone only, or both landline and cell phone), based on extrapolations
from the 2016 National Health Interview Survey. The weighting procedure also accounts for the
fact that respondents with both landline and cell phones have a greater probability of being
included in the combined sample and adjusts for household size among respondents with a
landline phone. The margins of error reported and statistical tests of significance are adjusted to
account for the survey’s design effect, a measure of how much efficiency is lost from the weighting
procedures.

31
PEW RESEARCH CENTER
www.pewresearch.org
The following table shows the unweighted sample sizes and the error attributable to sampling that
would be expected at the 95% level of confidence for different groups in the survey:
Sample sizes and sampling errors for other subgroups are available upon request.
In addition to sampling error, one should bear in mind that question wording and practical
difficulties in conducting surveys can introduce error or bias into the findings of opinion polls.
Pew Research Center undertakes all polling activity, including calls to mobile telephone numbers,
in compliance with the Telephone Consumer Protection Act and other applicable laws.
Pew Research Center is a nonprofit, tax-exempt 501(c)(3) organization and a subsidiary of The
Pew Charitable Trusts, its primary funder.
© Pew Research Center, 2017
Survey conducted Feb. 7-12, 2017
Group Unweighted sample size Plus or minus …
Total sample 1,503 2.9 percentage points
Republican/Lean Rep 581 4.7 percentage points
Democrat/Lean Dem 797 4.0 percentage points
Registered voters 1,246 3.2 percentage points
32
PEW RESEARCH CENTER
Appendix: Topline Questionnaire
PEW RESEARCH CENTER
FEBRUARY 2017 POLITICAL SURVEY FINAL TOPLINE
FEBRUARY 7-12, 2017 N=1,503
RANDOMIZE Q.1/Q.1a BLOCK AND Q.2 ASK ALL: Q.1 Do you approve or disapprove of the way Donald Trump is handling his job as President? [IF DK
ENTER AS DK. IF DEPENDS PROBE ONCE WITH: Overall do you approve or disapprove of the way Donald Trump is handling his job as President? IF STILL DEPENDS ENTER AS DK]
(VOL.) Approve Disapprove DK/Ref Trump Feb 7-12, 2017 39 56 6 Obama Feb 4-8, 2009 64 17 19 Bush February, 2001 53 21 26 Clinton February, 1993 56 25 19 Bush Gallup: February, 1989 63 13 24
Reagan Gallup: February, 1981 55 18 27 Carter Gallup: February, 1977 71 9 20 RANDOMIZE Q.1/Q.1a BLOCK AND Q.2 ASK IF APPROVE OR DISAPPROVE (Q.1=1,2) [N=1,433]: ASK ALL: Q.1 Do you approve or disapprove of the way Donald Trump is handling his job as President? [IF DK
ENTER AS DK. IF DEPENDS PROBE ONCE WITH: Overall do you approve or disapprove of the way Donald Trump is handling his job as President? IF STILL DEPENDS ENTER AS DK]
Q.1a Do you [approve/disapprove] very strongly, or not so strongly?
---------------Approve---------------- -------------Disapprove------------- Very Not so (VOL.) Very Not so (VOL.) (VOL.) Total strongly strongly DK/Ref Total strongly strongly DK/Ref DK/Ref Trump Feb 7-12, 2017 39 29 8 1 56 46 9 1 6 Obama Apr 14-21, 2009 63 45 13 5 26 18 8 * 11 Bush April, 2001 56 34 20 2 27 9 18 * 17 Clinton
Gallup: April, 1993 55 18 37 -- 37 16 21 -- 8 Reagan Gallup: March, 1981 60 35 25 -- 24 9 15 -- 16

33
PEW RESEARCH CENTER
RANDOMIZE Q.1/Q.1a BLOCK AND Q.2
ASK ALL: Q.2 All in all, are you satisfied or dissatisfied with the way things are going in this country today? Satis- Dis- (VOL.) fied satisfied DK/Ref Feb 7-12, 2017 30 65 5 Jan 4-9, 2017 28 68 4 Nov 30-Dec 5, 2016 30 65 5 Oct 20-25, 2016 33 63 4 Aug 9-16, 2016 31 66 3 Jun 15-26, 2016 24 71 5
Apr 12-19, 2016 26 70 3 Mar 17-26, 2016 31 65 4 Jan 7-14, 2016 25 70 5 Dec 8-13, 2015 25 72 3 Aug 27-Oct 4, 2015 27 67 5 Sep 22-27, 2015 27 69 4 Jul 14-20, 2015 31 64 4 May 12-18, 2015 29 67 4 Mar 25-29, 2015 31 64 5 Feb 18-22, 2015 33 62 5 Jan 7-11, 2015 31 66 4 Dec 3-7, 2014 (U) 26 71 3
Nov 6-9, 2014 27 68 4 Oct 15-20, 2014 29 65 6 Sep 2-9, 2014 25 71 4 Aug 20-24, 2014 24 72 4 Jul 8-14, 2014 29 68 4 Apr 23-27, 2014 29 65 6 Feb 12-26, 2014 28 66 6 Jan 15-19, 2014 26 69 5 Oct 30-Nov 6, 2013 21 75 3 Oct 9-13, 2013 14 81 5 Jul 17-21, 2013 27 67 6 May 1-5, 2013 30 65 5
Feb 13-18, 2013 (U) 31 64 5 Jan 9-13, 2013 30 66 4 Dec 17-19, 2012 25 68 7 Dec 5-9, 2012 33 62 5 Oct 18-21, 2012 32 61 8 Jun 28-Jul 9, 2012 31 64 5 Jun 7-17, 2012 28 68 5 May 9-Jun 3, 2012 29 64 7 Apr 4-15, 2012 24 69 6 Feb 8-12, 2012 28 66 6 Jan 11-16, 2012 21 75 4
Sep 22-Oct 4, 2011 17 78 5 Aug 17-21, 2011 17 79 4 Jul 20-24, 2011 17 79 4 Jun 15-19, 2011 23 73 4 May 5-8, 2011 30 62 8 May 2, 2011 32 60 8 Mar 8-14, 2011 22 73 5 Feb 2-7, 2011 26 68 5 Jan 5-9, 2011 23 71 6 Dec 1-5, 2010 21 72 7 Nov 4-7, 2010 23 69 8 Sep 23-26, 2010 30 63 7
Aug 25-Sep 6, 2010 25 71 5 Jun 24-27, 2010 27 64 9 May 13-16, 2010 28 64 7
Satis- Dis- (VOL.) fied satisfied DK/Ref Apr 21-26, 2010 29 66 5 Apr 1-5, 2010 31 63 6 Mar 11-21, 2010 25 69 5 Mar 10-14, 2010 23 71 7 Feb 3-9, 2010 23 71 6 Jan 6-10, 2010 27 69 4
Oct 28-Nov 8, 2009 25 67 7 Sep 30-Oct 4, 2009 25 67 7 Sep 10-15, 20091 30 64 7 Aug 20-27, 2009 28 65 7 Aug 11-17, 2009 28 65 7 Jul 22-26, 2009 28 66 6 Jun 10-14, 2009 30 64 5 Apr 28-May 12, 2009 34 58 8 Apr 14-21, 2009 23 70 7 Jan 7-11, 2009 20 73 7 December, 2008 13 83 4 Early October, 2008 11 86 3
Mid-September, 2008 25 69 6 August, 2008 21 74 5 July, 2008 19 74 7 June, 2008 19 76 5 Late May, 2008 18 76 6 March, 2008 22 72 6 Early February, 2008 24 70 6 Late December, 2007 27 66 7 October, 2007 28 66 6 February, 2007 30 61 9 Mid-January, 2007 32 61 7 Early January, 2007 30 63 7
December, 2006 28 65 7 Mid-November, 2006 28 64 8 Early October, 2006 30 63 7 July, 2006 30 65 5 May, 2006* 29 65 6 March, 2006 32 63 5 January, 2006 34 61 5 Late November, 2005 34 59 7 Early October, 2005 29 65 6 July, 2005 35 58 7 Late May, 2005* 39 57 4
February, 2005 38 56 6 January, 2005 40 54 6 December, 2004 39 54 7 Mid-October, 2004 36 58 6 July, 2004 38 55 7 May, 2004 33 61 6 Late February, 2004* 39 55 6 Early January, 2004 45 48 7 December, 2003 44 47 9 October, 2003 38 56 6
1 In September 10-15, 2009 and other surveys
noted with an asterisk, the question was worded
“Overall, are you satisfied or dissatisfied with the
way things are going in our country today?”
34
PEW RESEARCH CENTER
www.pewresearch.org
Q.2 CONTINUED… Satis- Dis- (VOL.) fied satisfied DK/Ref August, 2003 40 53 7 April, 2003 50 41 9 January, 2003 44 50 6 November, 2002 41 48 11 September, 2002 41 55 4 Late August, 2002 47 44 9 May, 2002 44 44 12
March, 2002 50 40 10 Late September, 2001 57 34 9 Early September, 2001 41 53 6 June, 2001 43 52 5 March, 2001 47 45 8 February, 2001 46 43 11 January, 2001 55 41 4 October, 2000 (RVs) 54 39 7 September, 2000 51 41 8 June, 2000 47 45 8 April, 2000 48 43 9 August, 1999 56 39 5
January, 1999 53 41 6 November, 1998 46 44 10 Early September, 1998 54 42 4 Late August, 1998 55 41 4 Early August, 1998 50 44 6
Satis- Dis- (VOL.) fied satisfied DK/Ref February, 1998 59 37 4 January, 1998 46 50 4 September, 1997 45 49 6 August, 1997 49 46 5 January, 1997 38 58 4 July, 1996 29 67 4 March, 1996 28 70 2
October, 1995 23 73 4 June, 1995 25 73 2 April, 1995 23 74 3 July, 1994 24 73 3 March, 1994 24 71 5 October, 1993 22 73 5 September, 1993 20 75 5 May, 1993 22 71 7 January, 1993 39 50 11 January, 1992 28 68 4 November, 1991 34 61 5 Gallup: Late Feb, 1991 66 31 3
August, 1990 47 48 5 May, 1990 41 54 5 January, 1989 45 50 5 September, 1988 (RVs) 50 45 5
NO QUESTIONS 3-4 ASK FORM 1 ONLY [N=743]: Thinking about some issues… Q.5F1 Do you approve or disapprove of the way Donald Trump is handling [INSERT ITEM, RANDOMIZE]
How about his handling of [NEXT ITEM]? [REPEAT INTRODUCTION AS NECESSARY] (VOL.) Approve Disapprove DK/Ref a.F1 The economy Feb 7-12, 2017 43 47 10 TRENDS FOR COMPARISON: Obama Feb 4-8, 2009 56 24 20 Bush February, 2001 50 22 28
b.F1 The threat of terrorism Feb 7-12, 2017 42 53 6 TREND FOR COMPARISON: Obama Feb 4-8, 2009 50 21 29 c.F1 The nation’s foreign policy Feb 7-12, 2017 35 59 6 TREND FOR COMPARISON: Obama Feb 4-8, 2009 52 17 31
d.F1 The nation’s immigration policy Feb 7-12, 2017 36 62 2

35
PEW RESEARCH CENTER
www.pewresearch.org
ASK FORM 2 ONLY [N=760]: Q.6F2 Does Donald Trump make you feel [INSERT FIRST ITEM; RANDOMIZE] or not? Does Trump
make you feel [NEXT ITEM] or not? (VOL.) Yes No DK/Ref a.F2 Hopeful Feb 7-12, 2017 40 59 1 TRENDS FOR COMPARISON: Trump
Nov 10-14, 20162 51 49 * Obama Nov 8-11, 20123 54 45 1 Sep 12-16, 2012 (RVs) 50 48 2 Sep 22-Oct 4, 2011 (RVs) 43 55 2 Mar 10-14, 2010 (RVs) 52 46 2 November, 2008 69 29 2 March, 20084 (RVs) 54 43 3 b.F2 Proud Feb 7-12, 2017 33 65 2 TRENDS FOR COMPARISON:
Trump Nov 10-14, 2016 36 63 1 Obama Nov 8-11, 2012 53 45 2 Sep 12-16, 2012 (RVs) 51 45 3 Sep 22-Oct 4, 2011 (RVs) 45 52 3 Mar 10-14, 2010 (RVs) 48 48 4 November, 2008 65 32 3 March, 2008 (RVs) 42 53 5 c.F2 Angry
Feb 7-12, 2017 39 59 1 TRENDS FOR COMPARISON: Trump Nov 10-14, 2016 31 68 * Obama Nov 8-11, 2012 21 78 1 Sep 12-16, 2012 (RVs) 31 68 1 Sep 22-Oct 4, 2011 (RVs) 31 68 1 Mar 10-14, 2010 (RVs) 31 67 2 November, 2008 9 91 * March, 2008 (RVs) 26 71 3
d.F2 Uneasy Feb 7-12, 2017 52 46 2 TRENDS FOR COMPARISON: Trump Nov 10-14, 2016 53 47 * Obama Nov 8-11, 2012 41 58 1 Sep 22-Oct 4, 2011 (RVs) 42 56 1 November, 2008 35 64 1 March, 2008 (RVs) 38 60 2
2 In November 2016, question was worded “Does the election of Donald Trump make you feel [INSERT FIRST ITEM; RANDOMIZE] or not? Does Trump’s election make you feel [NEXT ITEM] or not?” 3 For all November 2008-November 2012 trends, the question was worded “Does Barack Obama make you feel [INSERT
FIRST ITEM; RANDOMIZE] or not? Does Obama make you feel [NEXT ITEM] or not?” 4 For all March 2008 trends, the question was worded “Has Barack Obama ever made you feel [INSERT ITEM] or not?”

36
PEW RESEARCH CENTER
www.pewresearch.org
NO QUESTIONS 7-9, 11-14 QUESTION 10 HELD FOR FUTURE RELEASE ASK ALL: Q.15 As I read some pairs of opposite phrases, tell me which one best reflects your impression of Donald
Trump so far. (First,) does Donald Trump impress you as... ...[INSERT ITEM; RANDOMIZE; OBSERVE FORM SPLITS] Next, [NEXT ITEM]? [IF NECESSARY: “Does Donald Trump impress you as …”]
ASK FORM 1 ONLY [N=743]: a.F1 Trustworthy or NOT trustworthy? Obama Bush Clinton Feb 7-12 Feb 4-8 February January 2017 2009 2001 1993 37 Trustworthy 76 60 63 59 Not trustworthy 15 28 29 1 Neither particularly (VOL.) 1 4 3 3 Don’t know/Refused (VOL.) 8 8 5
ASK ALL: b. Someone who cares about people like me or someone who DOESN’T care about people like me
[INTERVIEWER INSTRUCTION: IF NECESSARY, CLARIFY THAT THIS IS ABOUT PEOPLE LIKE THE RESPONDENT]
Obama Feb 7-12 Feb 4-8 2017 2009 40 Cares about people like me 81 56 Doesn’t care about people like me 14 1 Neither particularly (VOL.) 1 3 Don’t know/Refused (VOL.) 4 ASK FORM 2 ONLY [N=760]:
c.F2 A strong leader or NOT a strong leader Obama Feb 7-12 Feb 4-8 2017 2009 49 A strong leader 77 49 Not a strong leader 13 1 Neither particularly (VOL.) 1 1 Don’t know/Refused (VOL.) 9
ASK FORM 1 ONLY [N=743]: d.F1 A good communicator or NOT a good communicator? Obama Clinton
Feb 7-12 Feb 4-8 January 2017 2009 1993 34 A good communicator 92 84 63 Not a good communicator 6 11 1 Neither particularly (VOL.) * 1 2 Don’t know/Refused (VOL.) 2 4
37
PEW RESEARCH CENTER
www.pewresearch.org
Q.15 CONTINUED… ASK FORM 1 ONLY [N=743]: e.F1 Able to get things done or NOT able to get things done Obama Bush Feb 7-12 Feb 4-8 February 2017 2009 2001 54 Able to get things done 70 60 40 Not able to get things done 15 18
1 Neither particularly (VOL.) 2 7 4 Don’t know/Refused (VOL.) 13 15 ASK FORM 1 ONLY [N=743]: f.F1 Even tempered or NOT even tempered Feb 7-12 2017 28 Even tempered 68 Not even tempered 1 Neither particularly (VOL.) 4 Don’t know/Refused (VOL.)
ASK FORM 2 ONLY [N=760]: g.F2 Well informed or NOT well informed Obama Bush Clinton Feb 7-12 Feb 4-8 February January 2017 2009 2001 1993 39 Well informed 79 62 79 57 Not well informed 15 27 14 1 Neither particularly (VOL.) 1 4 2 2 Don’t know/Refused (VOL.) 5 7 5
ASK FORM 2 ONLY [N=760]: h.F2 Keeps his promises or DOESN’T keep his promises Feb 7-12 2017 60 Keeps his promises 31 Doesn’t keep his promises 3 Neither particularly (VOL.) 6 Don’t know/Refused (VOL.)
ASK FORM 2 ONLY [N=760]:
i.F2 A good manager or NOT a good manager Feb 7-12
2017 45 A good manager 52 Not a good manager 1 Neither particularly (VOL.) 2 Don’t know/Refused (VOL.)
38
PEW RESEARCH CENTER
www.pewresearch.org
ASK ALL: Q.16 How much respect do you think Donald Trump has for this country’s democratic institutions and
traditions?
Feb 7-12 Oct 20-25 2017 2016 18 A great deal 16 22 A fair amount 24 25 Not too much 28 34 None at all 31
1 Don’t know/Refused (VOL.) 1 NO QUESTIONS 17-18 ASK ALL: Q.19 How confident are you that Donald Trump keeps his own business interests separate from the
decisions he makes as president? [READ]?
Feb 7-12 2017 24 Very confident 16 Somewhat confident
15 Not too confident 43 Not at all confident 1 Don’t know/Refused (VOL.) NO QUESTIONS 20-34 ASK ALL: Q.35 How much, if anything, have you heard or read about the executive order signed by Donald Trump
to stop refugees from entering the U.S. for 120 days and prevent people from seven majority-Muslim countries from entering the U.S. on a visa for 90 days? Have you heard … [READ]
Feb 7-12 2017 78 A lot 18 A little 4 Nothing at all 1 Don’t know/Refused (VOL.) ASK ALL: Q.36 Overall, would you say you approve or disapprove of this policy? Feb 7-12 2017
38 Approve 59 Disapprove 3 Don’t know/Refused (VOL.) ASK ALL: Q.37 Regardless of whether you approve or disapprove of this policy, do you think the Trump
administration did an excellent, good, only fair, or poor job communicating the executive order and putting it into effect?
Feb 7-12 2017 8 Excellent job
20 Good job 17 Only a fair job 53 Poor job 2 Don’t know/Refused (VOL.)
39
PEW RESEARCH CENTER
www.pewresearch.org
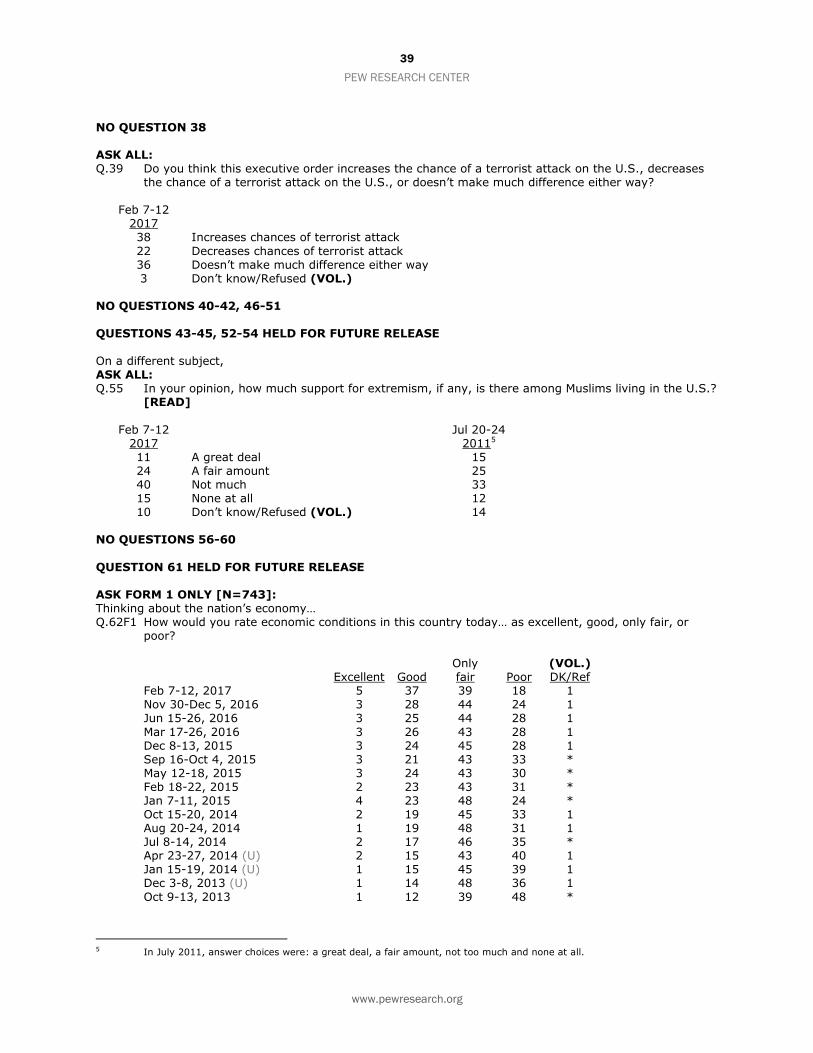
NO QUESTION 38 ASK ALL: Q.39 Do you think this executive order increases the chance of a terrorist attack on the U.S., decreases
the chance of a terrorist attack on the U.S., or doesn’t make much difference either way? Feb 7-12 2017 38 Increases chances of terrorist attack
22 Decreases chances of terrorist attack 36 Doesn’t make much difference either way 3 Don’t know/Refused (VOL.) NO QUESTIONS 40-42, 46-51 QUESTIONS 43-45, 52-54 HELD FOR FUTURE RELEASE On a different subject, ASK ALL: Q.55 In your opinion, how much support for extremism, if any, is there among Muslims living in the U.S.?
[READ]
Feb 7-12 Jul 20-24 2017 20115 11 A great deal 15 24 A fair amount 25 40 Not much 33 15 None at all 12 10 Don’t know/Refused (VOL.) 14 NO QUESTIONS 56-60
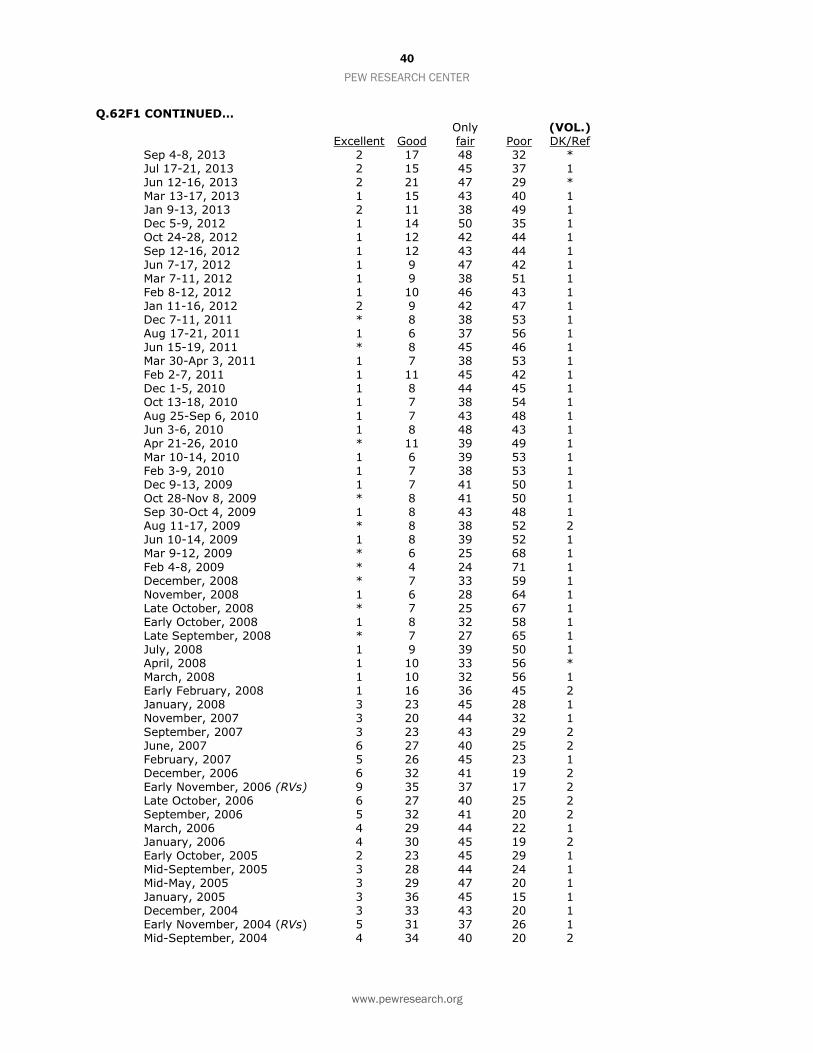
QUESTION 61 HELD FOR FUTURE RELEASE ASK FORM 1 ONLY [N=743]: Thinking about the nation’s economy… Q.62F1 How would you rate economic conditions in this country today… as excellent, good, only fair, or
poor? Only (VOL.) Excellent Good fair Poor DK/Ref Feb 7-12, 2017 5 37 39 18 1 Nov 30-Dec 5, 2016 3 28 44 24 1 Jun 15-26, 2016 3 25 44 28 1
Mar 17-26, 2016 3 26 43 28 1 Dec 8-13, 2015 3 24 45 28 1 Sep 16-Oct 4, 2015 3 21 43 33 * May 12-18, 2015 3 24 43 30 * Feb 18-22, 2015 2 23 43 31 * Jan 7-11, 2015 4 23 48 24 * Oct 15-20, 2014 2 19 45 33 1 Aug 20-24, 2014 1 19 48 31 1 Jul 8-14, 2014 2 17 46 35 * Apr 23-27, 2014 (U) 2 15 43 40 1 Jan 15-19, 2014 (U) 1 15 45 39 1 Dec 3-8, 2013 (U) 1 14 48 36 1
Oct 9-13, 2013 1 12 39 48 *
5 In July 2011, answer choices were: a great deal, a fair amount, not too much and none at all.
40
PEW RESEARCH CENTER
www.pewresearch.org
Q.62F1 CONTINUED… Only (VOL.) Excellent Good fair Poor DK/Ref Sep 4-8, 2013 2 17 48 32 * Jul 17-21, 2013 2 15 45 37 1 Jun 12-16, 2013 2 21 47 29 * Mar 13-17, 2013 1 15 43 40 1 Jan 9-13, 2013 2 11 38 49 1 Dec 5-9, 2012 1 14 50 35 1 Oct 24-28, 2012 1 12 42 44 1
Sep 12-16, 2012 1 12 43 44 1 Jun 7-17, 2012 1 9 47 42 1 Mar 7-11, 2012 1 9 38 51 1 Feb 8-12, 2012 1 10 46 43 1 Jan 11-16, 2012 2 9 42 47 1 Dec 7-11, 2011 * 8 38 53 1 Aug 17-21, 2011 1 6 37 56 1 Jun 15-19, 2011 * 8 45 46 1 Mar 30-Apr 3, 2011 1 7 38 53 1 Feb 2-7, 2011 1 11 45 42 1 Dec 1-5, 2010 1 8 44 45 1 Oct 13-18, 2010 1 7 38 54 1
Aug 25-Sep 6, 2010 1 7 43 48 1 Jun 3-6, 2010 1 8 48 43 1 Apr 21-26, 2010 * 11 39 49 1 Mar 10-14, 2010 1 6 39 53 1 Feb 3-9, 2010 1 7 38 53 1 Dec 9-13, 2009 1 7 41 50 1 Oct 28-Nov 8, 2009 * 8 41 50 1 Sep 30-Oct 4, 2009 1 8 43 48 1 Aug 11-17, 2009 * 8 38 52 2 Jun 10-14, 2009 1 8 39 52 1 Mar 9-12, 2009 * 6 25 68 1
Feb 4-8, 2009 * 4 24 71 1 December, 2008 * 7 33 59 1 November, 2008 1 6 28 64 1 Late October, 2008 * 7 25 67 1 Early October, 2008 1 8 32 58 1 Late September, 2008 * 7 27 65 1 July, 2008 1 9 39 50 1 April, 2008 1 10 33 56 * March, 2008 1 10 32 56 1 Early February, 2008 1 16 36 45 2 January, 2008 3 23 45 28 1 November, 2007 3 20 44 32 1
September, 2007 3 23 43 29 2 June, 2007 6 27 40 25 2 February, 2007 5 26 45 23 1 December, 2006 6 32 41 19 2 Early November, 2006 (RVs) 9 35 37 17 2 Late October, 2006 6 27 40 25 2 September, 2006 5 32 41 20 2 March, 2006 4 29 44 22 1 January, 2006 4 30 45 19 2 Early October, 2005 2 23 45 29 1 Mid-September, 2005 3 28 44 24 1 Mid-May, 2005 3 29 47 20 1
January, 2005 3 36 45 15 1 December, 2004 3 33 43 20 1 Early November, 2004 (RVs) 5 31 37 26 1 Mid-September, 2004 4 34 40 20 2
41
PEW RESEARCH CENTER
www.pewresearch.org
Q.62F1 CONTINUED…
Only (VOL.) Excellent Good fair Poor DK/Ref August, 2004 3 30 45 21 1 Late April, 2004 4 34 38 22 2 Late February, 20046 2 29 42 26 1
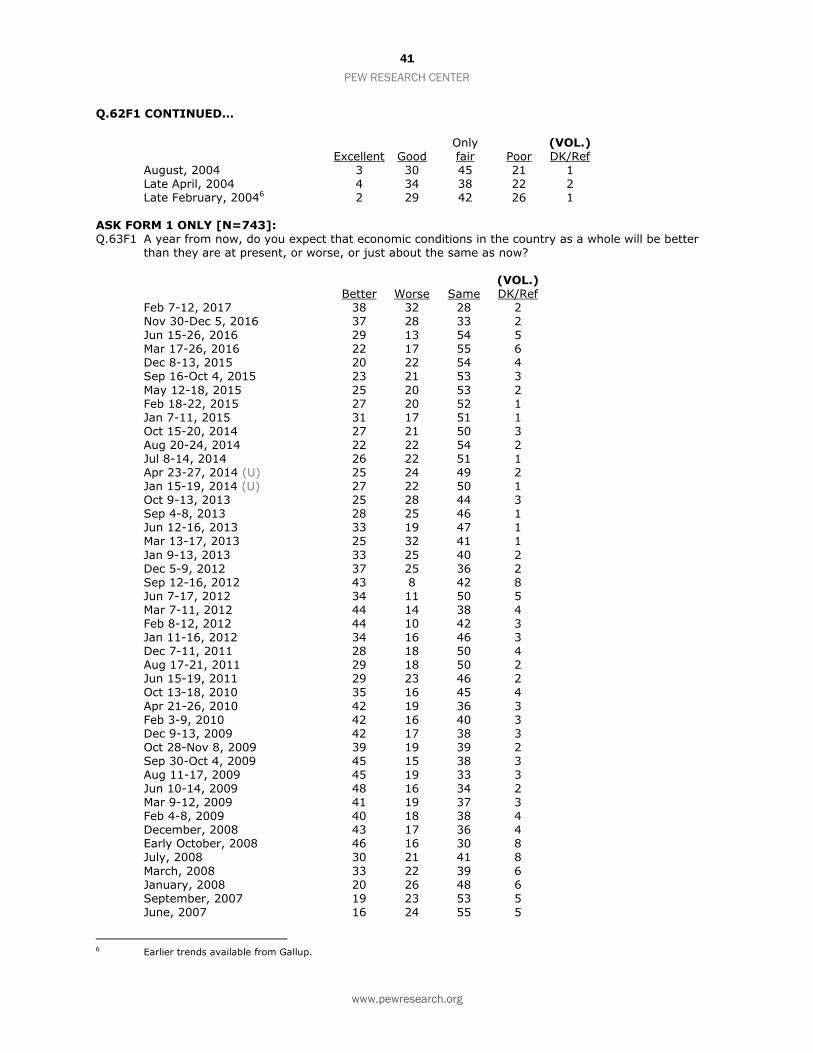
ASK FORM 1 ONLY [N=743]: Q.63F1 A year from now, do you expect that economic conditions in the country as a whole will be better
than they are at present, or worse, or just about the same as now?
(VOL.) Better Worse Same DK/Ref Feb 7-12, 2017 38 32 28 2 Nov 30-Dec 5, 2016 37 28 33 2 Jun 15-26, 2016 29 13 54 5 Mar 17-26, 2016 22 17 55 6 Dec 8-13, 2015 20 22 54 4 Sep 16-Oct 4, 2015 23 21 53 3
May 12-18, 2015 25 20 53 2 Feb 18-22, 2015 27 20 52 1 Jan 7-11, 2015 31 17 51 1 Oct 15-20, 2014 27 21 50 3 Aug 20-24, 2014 22 22 54 2 Jul 8-14, 2014 26 22 51 1 Apr 23-27, 2014 (U) 25 24 49 2 Jan 15-19, 2014 (U) 27 22 50 1 Oct 9-13, 2013 25 28 44 3 Sep 4-8, 2013 28 25 46 1 Jun 12-16, 2013 33 19 47 1 Mar 13-17, 2013 25 32 41 1
Jan 9-13, 2013 33 25 40 2 Dec 5-9, 2012 37 25 36 2 Sep 12-16, 2012 43 8 42 8 Jun 7-17, 2012 34 11 50 5 Mar 7-11, 2012 44 14 38 4 Feb 8-12, 2012 44 10 42 3 Jan 11-16, 2012 34 16 46 3 Dec 7-11, 2011 28 18 50 4 Aug 17-21, 2011 29 18 50 2 Jun 15-19, 2011 29 23 46 2 Oct 13-18, 2010 35 16 45 4
Apr 21-26, 2010 42 19 36 3 Feb 3-9, 2010 42 16 40 3 Dec 9-13, 2009 42 17 38 3 Oct 28-Nov 8, 2009 39 19 39 2 Sep 30-Oct 4, 2009 45 15 38 3 Aug 11-17, 2009 45 19 33 3 Jun 10-14, 2009 48 16 34 2 Mar 9-12, 2009 41 19 37 3 Feb 4-8, 2009 40 18 38 4 December, 2008 43 17 36 4 Early October, 2008 46 16 30 8 July, 2008 30 21 41 8
March, 2008 33 22 39 6 January, 2008 20 26 48 6 September, 2007 19 23 53 5 June, 2007 16 24 55 5
6 Earlier trends available from Gallup.

42
PEW RESEARCH CENTER
www.pewresearch.org
Q.63F1 CONTINUED… (VOL.) Better Worse Same DK/Ref February, 2007 17 20 58 5 December, 2006 22 18 56 4 September, 2006 16 25 55 4 January, 2006 20 22 55 3 Early October, 2005 20 32 45 3 Mid-September, 2005 18 37 43 2 Mid-May, 2005 18 24 55 3
January, 2005 27 18 52 3 August, 2004 36 9 47 8 Late February, 2004 39 12 41 8 September, 2003 37 17 43 3 May, 2003 43 19 35 3 Late March, 2003 33 23 37 7 January, 2003 30 20 44 6 January, 2002 44 17 36 3 Newsweek: January, 2001 18 33 44 5 June, 2000 15 24 55 6 Early October, 1998 (RVs) 16 22 57 5 Early September, 1998 18 17 61 4
May, 1990 18 31 45 6 February, 1989 25 22 49 4 September, 1988 (RVs) 24 16 51 9 May, 1988 24 20 46 10 January, 1988 22 26 45 7 Newsweek: January, 1984 (RVs) 35 13 49 3
QUESTION 64 HELD FOR FUTURE RELEASE ASK ALL: Q.65 On balance, do you think having an increasing number of people of many different races, ethnic
groups and nationalities in the United States makes this country a better place to live, a worse place to live, or doesn’t make much difference either way?
Knight-Ridder Aug 27- (RVs) Feb 7-12 Aug 9-16 Mar 17-26 Sep 13, January 2017 2016 2016 2015 1996 64 A better place to live 56 58 57 48 5 A worse place to live 8 7 8 11 29 Doesn’t make much difference either way 35 33 34 38 2 Don't know/Refused (VOL.) 1 2 2 3
QUESTION 66, 68-69 HELD FOR FUTURE RELEASE NO QUESTION 67 ASK FORM 1 ONLY [N=743]: Q.70F1 Do you think the U.S. has a responsibility to accept refugees into the country, or do you think the
U.S. does NOT have a responsibility to do this? Feb 7-12 2017 56 U.S. has a responsibility to accept refugees 41 U.S. does not have a responsibility to accept refugees
3 Don’t know/Refused (VOL.)
43
PEW RESEARCH CENTER
www.pewresearch.org
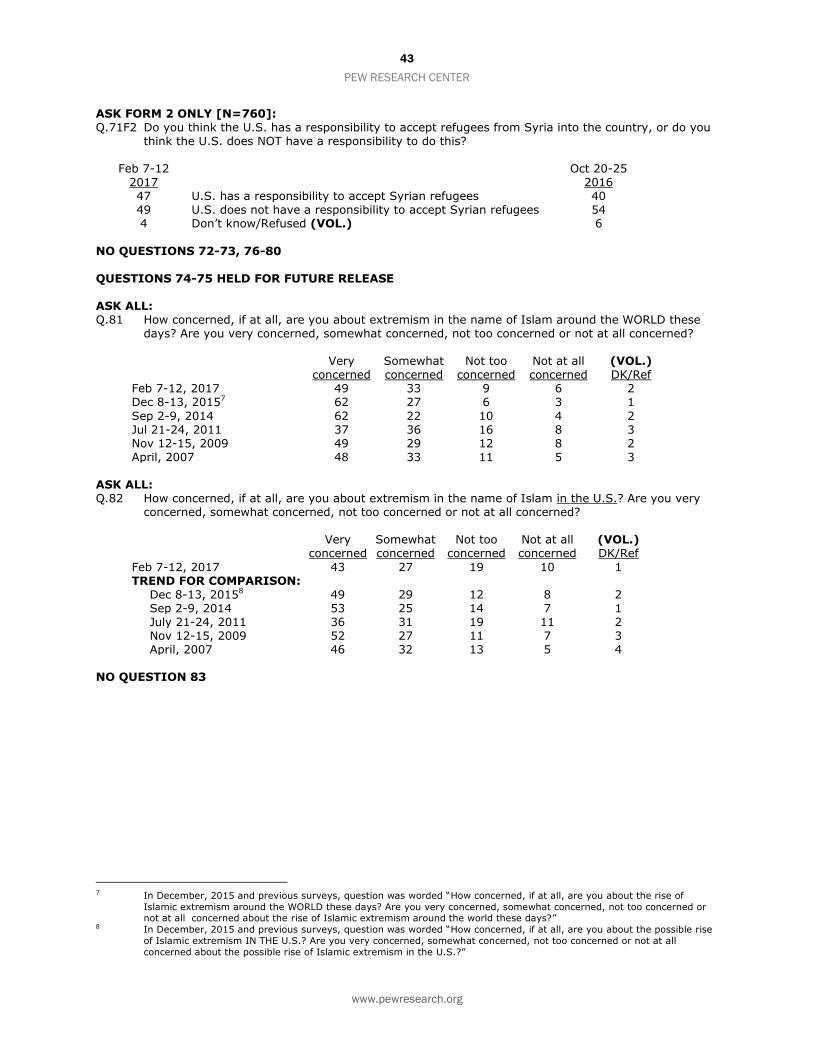
ASK FORM 2 ONLY [N=760]: Q.71F2 Do you think the U.S. has a responsibility to accept refugees from Syria into the country, or do you
think the U.S. does NOT have a responsibility to do this? Feb 7-12 Oct 20-25 2017 2016 47 U.S. has a responsibility to accept Syrian refugees 40 49 U.S. does not have a responsibility to accept Syrian refugees 54 4 Don’t know/Refused (VOL.) 6
NO QUESTIONS 72-73, 76-80 QUESTIONS 74-75 HELD FOR FUTURE RELEASE ASK ALL: Q.81 How concerned, if at all, are you about extremism in the name of Islam around the WORLD these
days? Are you very concerned, somewhat concerned, not too concerned or not at all concerned? Very
concerned Somewhat concerned
Not too concerned
Not at all concerned
(VOL.) DK/Ref
Feb 7-12, 2017 49 33 9 6 2 Dec 8-13, 20157 62 27 6 3 1
Sep 2-9, 2014 62 22 10 4 2 Jul 21-24, 2011 37 36 16 8 3 Nov 12-15, 2009 49 29 12 8 2 April, 2007 48 33 11 5 3
ASK ALL: Q.82 How concerned, if at all, are you about extremism in the name of Islam in the U.S.? Are you very
concerned, somewhat concerned, not too concerned or not at all concerned? Very
concerned Somewhat concerned
Not too concerned
Not at all concerned
(VOL.) DK/Ref
Feb 7-12, 2017 43 27 19 10 1 TREND FOR COMPARISON:
Dec 8-13, 20158 49 29 12 8 2 Sep 2-9, 2014 53 25 14 7 1 July 21-24, 2011 36 31 19 11 2 Nov 12-15, 2009 52 27 11 7 3 April, 2007 46 32 13 5 4
NO QUESTION 83
7 In December, 2015 and previous surveys, question was worded “How concerned, if at all, are you about the rise of
Islamic extremism around the WORLD these days? Are you very concerned, somewhat concerned, not too concerned or not at all concerned about the rise of Islamic extremism around the world these days?” 8 In December, 2015 and previous surveys, question was worded “How concerned, if at all, are you about the possible rise
of Islamic extremism IN THE U.S.? Are you very concerned, somewhat concerned, not too concerned or not at all
concerned about the possible rise of Islamic extremism in the U.S.?”

44
PEW RESEARCH CENTER
www.pewresearch.org
ASK ALL: Q.84 Is your overall opinion of [INSERT NAME; RANDOMIZE; OBSERVE FORM SPLITS] very
favorable, mostly favorable, mostly UNfavorable, or very unfavorable? How about [NEXT NAME]? [IF NECESSARY: Just in general, is your overall opinion of [NAME] very favorable, mostly favorable, mostly UNfavorable, or very unfavorable?] [INTERVIEWERS: PROBE TO DISTINGUISH BETWEEN “NEVER HEARD OF” AND “CAN’T RATE.”]
(VOL.) (VOL.) -------Favorable------- ------Unfavorable------ Never Can’t rate/ Total Very Mostly Total Very Mostly heard of Ref
a. Donald Trump Feb 7-12, 2017 41 21 20 57 41 15 0 3 Nov 30-Dec 5, 2016 37 14 23 58 38 20 * 5 Sep 16-Oct 4, 2015 32 11 21 64 42 22 1 4 ITEMS b-i HELD FOR FUTURE RELEASE NO QUESTIONS 85-87, 89 QUESTIONS 88, 90-91 HELD FOR FUTURE RELEASE ASK RESPONDENTS WHO ARE NOT MUSLIM (RELIG≠6) [N=1,488]:
Thinking about the Islamic religion for a moment… Q.92 Do you personally know anyone who is Muslim, or not? ASK IF KNOW ANYONE (Q.92=1) [N=881]: Q.92a And about how many people who are Muslim would you say you personally know [READ OPTIONS
IN ORDER; REVERSE ORDER FOR HALF SAMPLE]? Feb 7-12 Jan 7-14 2017 2016 55 Yes 52 10 A lot 10 27 Some 26
17 Only one or two 16 * Don’t know/Refused (VOL.) 1 44 No 47 1 Don’t know/Refused (VOL.) 1
TREND FOR COMPARISON: Do you, yourself happen to know anyone who is Muslim? ------Based on Non-Muslims9------ Aug 19-22 Aug 11-17 August Mid-Nov 2010 2009 2007 2001 41 Yes 45 45 38 58 No 54 54 61
0 Respondent is Muslim (VOL.) -- -- -- 1 Don’t know/Refused (VOL.) 1 1 1
QUESTIONS 93-94 HELD FOR FUTURE RELEASE
9 In each of these surveys, less than 1% of respondents identified as Muslim.
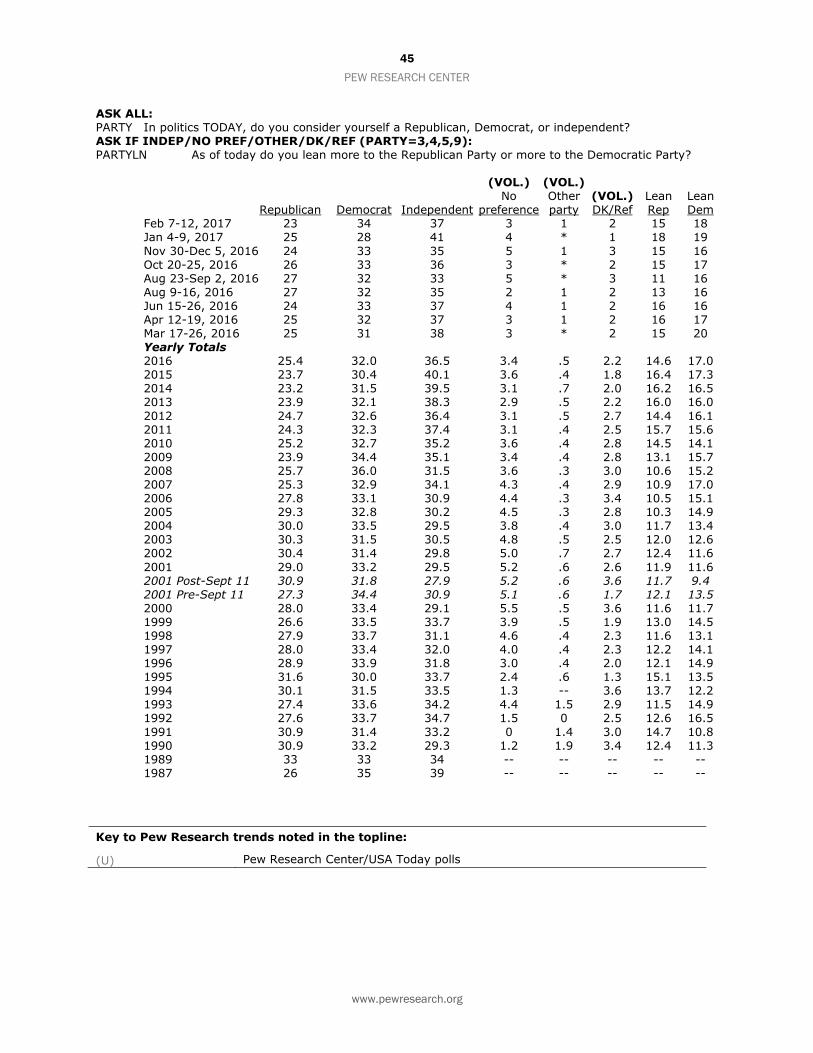
45
PEW RESEARCH CENTER
www.pewresearch.org
ASK ALL: PARTY In politics TODAY, do you consider yourself a Republican, Democrat, or independent? ASK IF INDEP/NO PREF/OTHER/DK/REF (PARTY=3,4,5,9): PARTYLN As of today do you lean more to the Republican Party or more to the Democratic Party? (VOL.) (VOL.) No Other (VOL.) Lean Lean Republican Democrat Independent preference party DK/Ref Rep Dem Feb 7-12, 2017 23 34 37 3 1 2 15 18 Jan 4-9, 2017 25 28 41 4 * 1 18 19
Nov 30-Dec 5, 2016 24 33 35 5 1 3 15 16 Oct 20-25, 2016 26 33 36 3 * 2 15 17 Aug 23-Sep 2, 2016 27 32 33 5 * 3 11 16 Aug 9-16, 2016 27 32 35 2 1 2 13 16 Jun 15-26, 2016 24 33 37 4 1 2 16 16 Apr 12-19, 2016 25 32 37 3 1 2 16 17 Mar 17-26, 2016 25 31 38 3 * 2 15 20 Yearly Totals 2016 25.4 32.0 36.5 3.4 .5 2.2 14.6 17.0 2015 23.7 30.4 40.1 3.6 .4 1.8 16.4 17.3 2014 23.2 31.5 39.5 3.1 .7 2.0 16.2 16.5 2013 23.9 32.1 38.3 2.9 .5 2.2 16.0 16.0
2012 24.7 32.6 36.4 3.1 .5 2.7 14.4 16.1 2011 24.3 32.3 37.4 3.1 .4 2.5 15.7 15.6 2010 25.2 32.7 35.2 3.6 .4 2.8 14.5 14.1 2009 23.9 34.4 35.1 3.4 .4 2.8 13.1 15.7 2008 25.7 36.0 31.5 3.6 .3 3.0 10.6 15.2 2007 25.3 32.9 34.1 4.3 .4 2.9 10.9 17.0 2006 27.8 33.1 30.9 4.4 .3 3.4 10.5 15.1 2005 29.3 32.8 30.2 4.5 .3 2.8 10.3 14.9 2004 30.0 33.5 29.5 3.8 .4 3.0 11.7 13.4 2003 30.3 31.5 30.5 4.8 .5 2.5 12.0 12.6 2002 30.4 31.4 29.8 5.0 .7 2.7 12.4 11.6
2001 29.0 33.2 29.5 5.2 .6 2.6 11.9 11.6 2001 Post-Sept 11 30.9 31.8 27.9 5.2 .6 3.6 11.7 9.4 2001 Pre-Sept 11 27.3 34.4 30.9 5.1 .6 1.7 12.1 13.5 2000 28.0 33.4 29.1 5.5 .5 3.6 11.6 11.7 1999 26.6 33.5 33.7 3.9 .5 1.9 13.0 14.5 1998 27.9 33.7 31.1 4.6 .4 2.3 11.6 13.1 1997 28.0 33.4 32.0 4.0 .4 2.3 12.2 14.1 1996 28.9 33.9 31.8 3.0 .4 2.0 12.1 14.9 1995 31.6 30.0 33.7 2.4 .6 1.3 15.1 13.5 1994 30.1 31.5 33.5 1.3 -- 3.6 13.7 12.2 1993 27.4 33.6 34.2 4.4 1.5 2.9 11.5 14.9 1992 27.6 33.7 34.7 1.5 0 2.5 12.6 16.5
1991 30.9 31.4 33.2 0 1.4 3.0 14.7 10.8 1990 30.9 33.2 29.3 1.2 1.9 3.4 12.4 11.3 1989 33 33 34 -- -- -- -- -- 1987 26 35 39 -- -- -- -- --
Key to Pew Research trends noted in the topline:
(U) Pew Research Center/USA Today polls