numbers, facts and trends shaping the world · and trends shaping america and the world. it does...
TRANSCRIPT
FOR RELEASE OCTOBER 18, 2016
BY Phillip Connor
FOR MEDIA OR OTHER INQUIRIES:
Phillip Connor, Research Associate
Mark Hugo Lopez, Director of Hispanic Research
Stefan Cornibert, Communications Associate
202.419.4517
www.pewresearch.org
RECOMMENDED CITATION: Connor, Phillip. 2016. “Middle East’s Migrant Population More Than Doubles Since 2005.” Pew Research
Center, October.
NUMBERS, FACTS AND TRENDS SHAPING THE WORLD
1
PEW RESEARCH CENTER
www.pewresearch.org
EMBARGOED COPY – NOT FOR PUBLICATION OR DISTRIBUTION UNTIL 00:00 a.m./p.m. EDT, MONTH DATE, YEAR
About Pew Research Center
Pew Research Center is a nonpartisan fact tank that informs the public about the issues, attitudes
and trends shaping America and the world. It does not take policy positions. The Center conducts
public opinion polling, demographic research, content analysis and other data-driven social
science research. It studies U.S. politics and policy; journalism and media; internet, science and
technology; religion and public life; Hispanic trends; global attitudes and trends; and U.S. social
and demographic trends. All of the Center’s reports are available at www.pewresearch.org. Pew
Research Center is a subsidiary of The Pew Charitable Trusts, its primary funder.
© Pew Research Center 2016

2
PEW RESEARCH CENTER
www.pewresearch.org
Terminology
The “Middle East” in this report includes 16 countries and territories: Bahrain, Egypt, Iran, Iraq,
Israel, Jordan, Kuwait, Lebanon, Oman, the Palestinian territories, Qatar, Saudi Arabia, Syria,
Turkey, United Arab Emirates and Yemen.
“Migrants” includes people moving across international borders for whatever reason (including
refugees and asylum seekers and other international migrants), as well as people forcibly displaced
from their homes but remaining inside their country of birth (internally displaced persons). This
definition of migrants differs from previous Pew Research Center reports, in which “migrants”
refers to international migrants and not include people internally displaced within their countries
due to conflict.
“Displaced migrants” are those who have been forcibly displaced from their homes mainly due to
conflict or natural disaster. Most displaced migrants in this report have moved due to conflict.
Displaced persons can remain in their birth countries (see “internally displaced persons” below) or
cross international borders (see “refugees and asylum seekers” below).
“Internally displaced persons” (IDPs), as defined by the United Nations High Commissioner for
Refugees (UNHCR), are people who have been “forced to leave their homes or places of habitual
residence, in particular as a result of, or in order to avoid the effects of armed conflict, situations of
generalized violence, violations of human rights, or natural or man-made disasters,” yet remain
inside their countries of birth, not crossing any international borders.
“Refugees” and “asylum seekers” are people who have crossed international borders to receive
protection from persecution, war or violence. These populations remain refugees or asylum
seekers until they are permanently resettled outside of their birth countries or return to their
homelands. This report also includes Palestinian refugees living outside of the Palestinian
territories (in Jordan, Lebanon and Syria), but not Palestinian refugees living within the
Palestinian territories (see “Palestinian refugees” text box for more information).
“Non-displaced, international migrants” are those who have not crossed international borders due
to conflict. Non-displaced, international migrants are the remaining population after displaced
migrants are removed from the total foreign-born population provides by the United Nations.
Most non-displaced, international migrants entered the Middle East for economic opportunity,
but some may have moved for other reasons including to join family or to study.

3
PEW RESEARCH CENTER
www.pewresearch.org
EMBARGOED COPY – NOT FOR PUBLICATION OR DISTRIBUTION UNTIL 00:00 a.m./p.m. EDT, MONTH DATE, YEAR
Table of Contents
About Pew Research Center 1
Terminology 2
Overview 4
1. Conflicts in Syria, Iraq and Yemen lead to millions of displaced migrants in the Middle
East since 2005 11
2. Economic growth attracts migrants to Persian Gulf 18
Acknowledgments 20
Methodology 21
Appendix A: References 23
Appendix B: Additional tables 24
Appendix C: Countries by regional classification 26

4
PEW RESEARCH CENTER
www.pewresearch.org
Middle East’s Migrant Population More Than Doubles Since
2005
Between 2005 and 2015, the number of migrants
living in the Middle East more than doubled, from
about 25 million to around 54 million, according to
a Pew Research Center analysis of data from United
Nations agencies. Some of this growth was due to
individuals and families seeking economic
opportunities. But the majority of the migration
surge, especially after 2011, was a consequence of
armed conflict and the forced displacement of
millions of people from their homes, many of whom
have left their countries of birth.
The rapid rise in the number of people looking for
safe havens and new livelihoods has over the past
decade transformed the Middle East into the world
region with the fastest growing international
migrant and forcibly displaced population,
according to a Pew Research Center analysis of data
from United Nations agencies.
All told, the Middle East’s migrant population
increased by about 120% between 2005 and 2015.
This far exceeds increases in the combined
international migrant and forcibly displaced
populations over the same period in continental
Africa (91% growth), Latin America and the Caribbean (77%) and the Asia-Pacific region (26%).
Europe’s and North America’s migrant populations also grew more slowly over the 2005-2015
period (about 20% in each region), even though Europe received a record 1.3 million asylum
seekers in 2015 – many from the Middle East.
5
PEW RESEARCH CENTER
www.pewresearch.org
EMBARGOED COPY – NOT FOR PUBLICATION OR DISTRIBUTION UNTIL 00:00 a.m./p.m. EDT, MONTH DATE, YEAR
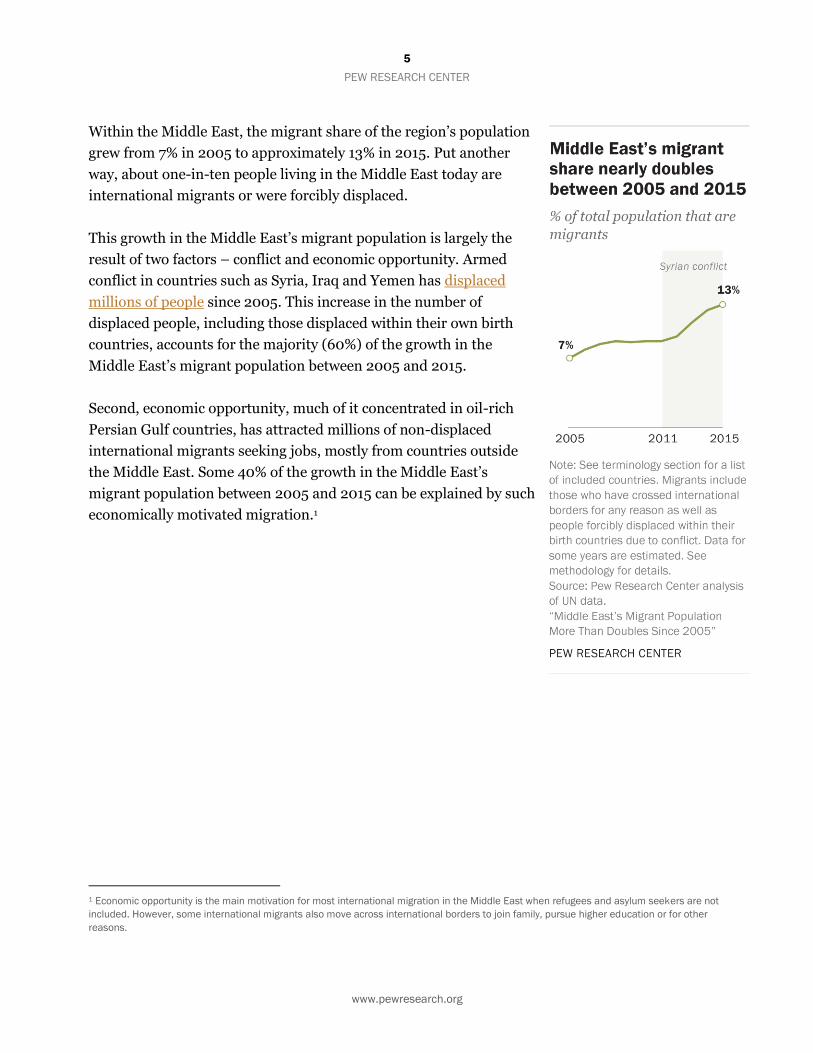
Within the Middle East, the migrant share of the region’s population
grew from 7% in 2005 to approximately 13% in 2015. Put another
way, about one-in-ten people living in the Middle East today are
international migrants or were forcibly displaced.
This growth in the Middle East’s migrant population is largely the
result of two factors – conflict and economic opportunity. Armed
conflict in countries such as Syria, Iraq and Yemen has displaced
millions of people since 2005. This increase in the number of
displaced people, including those displaced within their own birth
countries, accounts for the majority (60%) of the growth in the
Middle East’s migrant population between 2005 and 2015.
Second, economic opportunity, much of it concentrated in oil-rich
Persian Gulf countries, has attracted millions of non-displaced
international migrants seeking jobs, mostly from countries outside
the Middle East. Some 40% of the growth in the Middle East’s
migrant population between 2005 and 2015 can be explained by such
economically motivated migration.1
1 Economic opportunity is the main motivation for most international migration in the Middle East when refugees and asylum seekers are not
included. However, some international migrants also move across international borders to join family, pursue higher education or for other
reasons.

6
PEW RESEARCH CENTER
www.pewresearch.org
Migrants in the Middle East defined
What is a migrant? The simplest definition is a person who moves, either to another country or within their
own. This report combines international migrants and people forcibly displaced from their homes but
remaining in their country of birth to estimate the size of the total migrant population in the Middle East.
(Internal migrants moving within their countries for reasons other than conflict – jobs, family and education
– are not included in this report’s estimates because reliable data for this group in the region do not exist.)
This approach provides a comprehensive view of the intensity of movement occurring in the region.
Often, people cross international borders when migrating. Many of these international migrants move for
job opportunities, to join family or to study. They are not forcibly displaced from their homelands, but
voluntarily leave one country to live in another.
But some international migrants move to another country to escape violence or persecution. These forcibly
displaced persons (refugees and asylum seekers) also cross international borders. They are considered
both displaced and international migrants.
People also move inside their country’s borders when fleeing conflict. This report relies on data from the
United Nations High Commissioner for Refugees that estimate the number of people who are internally
displaced within their countries due to armed conflict, persecution, violations of human rights or natural
disasters. This is an important group to include in the analysis of Middle East migrant populations since
conflicts in Syria, Iraq and Yemen have displaced millions of people within their countries in recent years.
7
PEW RESEARCH CENTER
www.pewresearch.org
EMBARGOED COPY – NOT FOR PUBLICATION OR DISTRIBUTION UNTIL 00:00 a.m./p.m. EDT, MONTH DATE, YEAR
Palestinian refugees
Ever since the movement of Palestinians following the Arab-Israeli War of 1948 and establishment of the
state of Israel, Palestinian refugees have lived in neighboring countries such as Jordan, Lebanon and Syria as
well as within the Palestinian territories themselves. The total Palestinian refugee population, including
descendants born outside of the Palestinian territories, was estimated to be around 5.2 million in 2015.
Palestinian refugees are registered with the United Nations Relief and Works Agency (UNRWA), which assists
with education, health care and other services for Palestinian refugees. As of Jan. 1, 2015, nearly 3 million
Palestinian refugees were registered with UNRWA outside of the Palestinian territories. The figures in this
report include these 3 million Palestinian refugees as displaced outside of their countries of birth, even
though several generations of Palestinian refugees living in these countries were not born in the Palestinian
territories.
Palestinian refugees living within the Palestinian territories are not included in the estimates of this report.
These refugees have not crossed international boundaries. For example, neither the United Nations High
Commissioner for Refugees (UNHCR) nor UN migration statistics classify them as refugees or migrants.
UNHCR also does not consider Palestinian refugees living within the Palestinian territories to be internally
displaced persons.
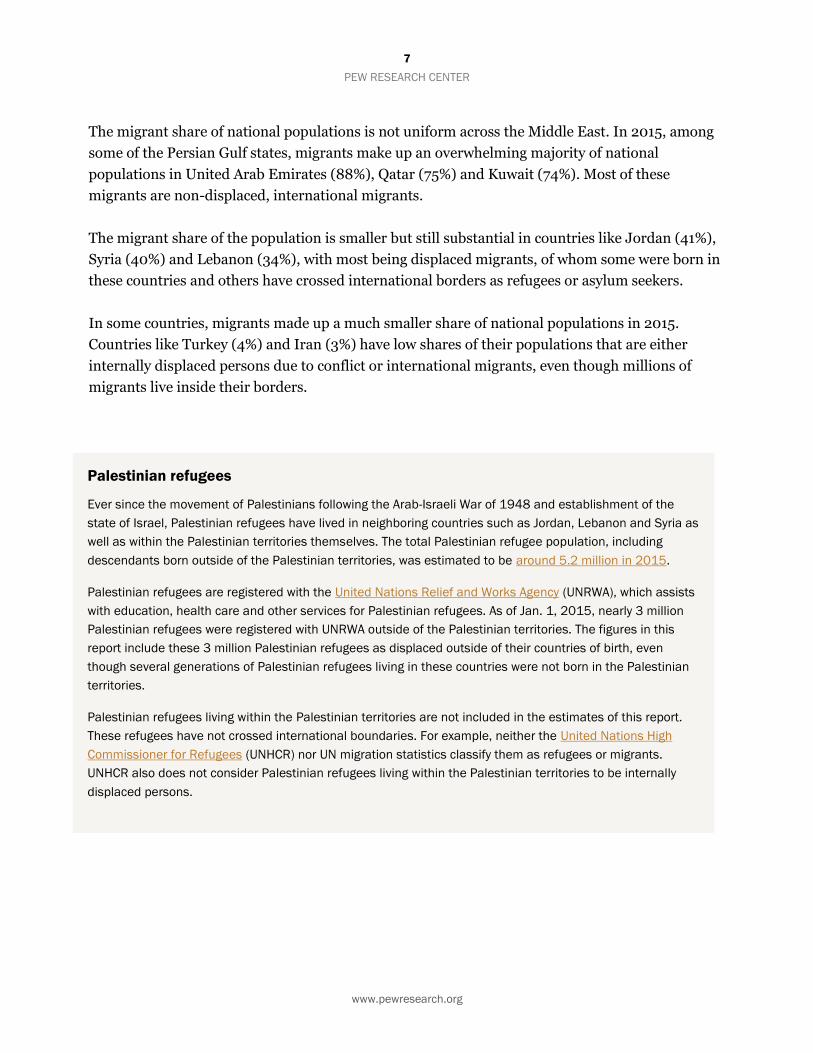
The migrant share of national populations is not uniform across the Middle East. In 2015, among
some of the Persian Gulf states, migrants make up an overwhelming majority of national
populations in United Arab Emirates (88%), Qatar (75%) and Kuwait (74%). Most of these
migrants are non-displaced, international migrants.
The migrant share of the population is smaller but still substantial in countries like Jordan (41%),
Syria (40%) and Lebanon (34%), with most being displaced migrants, of whom some were born in
these countries and others have crossed international borders as refugees or asylum seekers.
In some countries, migrants made up a much smaller share of national populations in 2015.
Countries like Turkey (4%) and Iran (3%) have low shares of their populations that are either
internally displaced persons due to conflict or international migrants, even though millions of
migrants live inside their borders.

8
PEW RESEARCH CENTER
www.pewresearch.org
7.1
4.7
2.9
2.8
2.8
1.5
1.3
Syria
Iraq
Jordan
Yemen
Turkey
Lebanon
Other
By the end of 2015, the Middle East was home to about 23 million displaced migrants – or about
four-in-ten of all displaced people worldwide.
Many of those displaced have fled armed
conflict and are living either within their birth
countries or in neighboring countries.
In 2015, Syria (7.1 million) and Iraq (4.7
million) were home to the largest displaced
migrant populations in the Middle East. Large
numbers of displaced migrants were also
living in Jordan (2.9 million), Yemen (2.8
million) and Turkey (2.8 million) in 2015.
A majority (59%) of the Middle East’s growing
population of displaced migrants never
crossed international borders. In 2015, more
than 6 million of the total 7.1 million displaced
migrants in Syria were Syrian born. Similarly,
more than 4 million of Iraq’s 4.7 million
displaced migrants were Iraqi citizens who
were forcibly relocated within their home
country.
In 2015, about four-in-ten (41%) displaced
migrants in the Middle East lived in a foreign
country,2 amounting to nearly 9.6 million
people. Fully 85% of this group in 2015 was
located in just four countries: Turkey, Jordan, Lebanon and Iran. About half (47%) of these
international migrants were Syrian citizens (4.6 million) and about a third (34%) were Palestinian
refugees as of 2015. But more than a million refugees from Afghanistan also live in the Middle
East, mostly in neighboring Iran.
2 This includes Palestinian refugees registered with UNRWA living in Jordan, Lebanon and Syria who may not have actually crossed
international boundaries. See the “Palestinian refugees” box for more details.
About half of Middle East’s 23 million
displaced migrants lived in Syria or Iraq
in 2015
Displaced migrants, in millions
Note: Displaced migrants include internally displaced persons within
their birth countries, refugees and asylum seekers who have
crossed an international border and Palestinian refugees registered
with UNRWA in Jordan, Lebanon and Syria. Palestinian refugee
figures for 2015 were extrapolated from 2013 and 2014 estimates
and may not reflect final estimates. See methodology for details.
See terminology section for a list of included countries.
Source: Pew Research Center analysis of UN data.
“Middle East’s Migrant Population More Than Doubles Since 2005”
PEW RESEARCH CENTER

9
PEW RESEARCH CENTER
www.pewresearch.org
EMBARGOED COPY – NOT FOR PUBLICATION OR DISTRIBUTION UNTIL 00:00 a.m./p.m. EDT, MONTH DATE, YEAR
10.2
8.0
2.9
2.0
1.8
1.7
1.7
2.6
Saudi Arabia
UAE
Kuwait
Israel
Oman
Iran
Qatar
Other countries
In addition to displaced persons, a substantial
portion of the Middle East’s surging migrant
population is made up of manual laborers and
professionals relocating to the oil-rich
countries of the Persian Gulf from other
countries, many in pursuit of economic
opportunity.
Between 2005 and 2015, the number of non-
displaced, international migrants in the
Middle East increased from roughly 20 million
to about 31 million.
Even as the absolute number of non-displaced,
international migrants in the Middle East
climbed between 2005 and 2015, their share of
all migrants in the region declined due to the
surge of displaced persons. Over the 10-year
span, the portion of all migrants living in the
Middle East who were non-displaced,
international migrants fell from 78% to 57%.
As of 2015, the countries with the largest
number of non-displaced, international migrants in the Middle East were Saudi Arabia (10.2
million), United Arab Emirates (8.0 million), Kuwait (2.9 million) and Oman (1.8 million).
Notably, there are indications that job growth is slowing in Persian Gulf countries as oil prices
remain below recent highs. Thousands of migrant workers in the region are unemployed, leading to
a decline in migrant remittances from the Gulf. Indeed, the situation in the Gulf helps to explain
why the total value of remittances across the globe fell in 2015 for the first time since the end of
the Great Recession.
Israel is another top destination for non-displaced, international migrants in the Middle East. It
has a long history of international migrants entering its borders, not only because of job
opportunities there but also to repatriate Jews to the world’s only Jewish state. The growth of its
foreign-born population between 2005 and 2015, however, is far behind the region as a whole, up
About six-in-ten of the Middle East’s
non-displaced, international migrants
lived in Saudi Arabia and UAE in 2015
Non-displaced, international migrants, in millions
Note: Non-displaced, international migrants are those who have not
crossed international borders due to conflict. See methodology for
details. See terminology section for a list of included countries.
Source: Pew Research Center analysis of UN data.
“Middle East’s Migrant Population More Than Doubles Since 2005”
PEW RESEARCH CENTER

10
PEW RESEARCH CENTER
www.pewresearch.org
just 4% over the period. About 2.0 million migrants live in Israel, making up about a quarter
(24%) of the country’s overall population.

11
PEW RESEARCH CENTER
www.pewresearch.org
EMBARGOED COPY – NOT FOR PUBLICATION OR DISTRIBUTION UNTIL 00:00 a.m./p.m. EDT, MONTH DATE, YEAR
1. Conflicts in Syria, Iraq and Yemen lead to millions of
displaced migrants in the Middle East since 2005
Between 2005 and 2015, the number of displaced migrants3 in the Middle East grew fourfold,
from about 5 million to about 23 million. Much of this rise was the result of recent conflict in three
countries – Syria, Iraq and Yemen.
3 Displaced migrants are persons who have been forcibly displaced from their homes due to conflict or natural disaster. Displaced migrants
can include internal migrants (internally displaced persons) or international migrants (refugees and asylum seekers).
Nearly all of the Middle East’s displaced migrants lived in six countries in 2015:
Syria, Iraq, Jordan, Yemen, Turkey or Lebanon
Displaced migrants, in thousands
2005 2006 2007 2008 2009 2010 2011 2012 2013 2014 2015
Syria 460 1,150 1,961 1,570 1,530 1,504 1,244 2,994 7,190 8,313 7,130
Iraq 1,252 1,881 2,431 2,689 1,591 1,381 1,372 1,236 1,206 3,876 4,688
Jordan 1,845 2,378 2,404 2,453 2,435 2,453 2,436 2,340 2,717 2,790 2,854
Yemen 83 97 195 241 422 414 568 629 556 600 2,809
Turkey 7 9 12 18 16 17 25 291 662 1,694 2,754
Lebanon 407 631 535 473 477 465 447 577 1,306 1,614 1,541
Iran 974 969 965 982 1,072 1,075 887 868 857 982 979
Egypt 100 104 112 113 108 109 114 127 253 262 251
Israel 2 2 7 14 22 31 48 54 53 45 45
Kuwait 2 <1 39 41 3 3 1 2 2 2 2
UAE <1 <1 <1 <1 <1 <1 <1 <1 <1 <1 1
Bahrain <1 <1 <1 <1 <1 <1 <1 <1 <1 <1 <1
Oman <1 <1 <1 <1 <1 <1 <1 <1 <1 <1 <1
Palest. ter. <1 <1 <1 <1 <1 <1 <1 <1 <1 <1 <1
Qatar <1 <1 <1 <1 <1 <1 <1 <1 <1 <1 <1
Saudi Arabia 241 241 241 241 <1 <1 <1 <1 <1 <1 <1
Total 5,373 7,463 8,902 8,834 7,678 7,454 7,144 9,120 14,806 20,180 23,055
Note: Rounded to nearest thousands, except for estimates below 1,000 which are shown as <1. Rank ordered by the number of displaced
migrants as of 2015. Displaced migrants include internally displaced persons within their birth countries, refugees and asylum seekers who
have crossed an international border and Palestinian refugees registered with UNRWA in Jordan, Lebanon and Syria. Palestinian refugee
figures for 2015 were extrapolated from 2013 and 2014 estimates and may not reflect final estimates. See methodology for details.
Source: Pew Research Center analysis of UN data.
“Middle East’s Migrant Population More Than Doubles Since 2005”
PEW RESEARCH CENTER
12
PEW RESEARCH CENTER
www.pewresearch.org
In 2015, Syria had by far the largest number (7.1 million) of displaced migrants living within its
borders. Nearly all of them (92%) have been internally displaced by the country’s ongoing civil
war. Iraq had the second largest displaced population in the Middle East, at 4.7 million. Like
Syria’s situation, most (94%) are internally displaced Iraqis.
Meanwhile, Jordan’s displaced migrant population, at 2.9 million people, is a combination of
Syrian refugees (628,000, or 22% of all displaced people in Jordan as of 2015) and a long-
established population of Palestinian refugees (about 2.2 million, or 76% of all displaced people in
Jordan as of 2015). Similarly, Lebanon’s 1.5 million displaced migrants are a combination of about
1 million Syrian and almost 500,000 Palestinian refugees.4
Turkey and Yemen had about 2.8 million displaced migrants as of the end of 2015. The origins of
their respective displaced populations are quite different, however. Turkey’s displaced migrants
are largely Syrian refugees, of which the number has grown significantly since the beginning of the
civil war in Syria. In Yemen, nine-in-ten displaced migrants are internally displaced persons.
Absolute numbers tell only part of the story of the Middle East’s displaced population. As a share
of the total population, displaced persons constitute a substantial minority in Jordan (38%), Syria
(39%) and Lebanon (26%).
In 2015, Syria’s displaced population was almost entirely made up of internally displaced Syrians.
Between 2006 and 2011, by contrast, Iraqi refugees were the largest displaced group within Syria.
Yet even at the height of sectarian violence in Iraq in 2007, displaced migrants made up only 10%
of Syria’s population. (Since the Syrian conflict began in 2011, fewer Iraqi refugees now live in
Syria.)
Today, about one-in-ten people living in Iraq (13%) as well as Yemen (10%) are displaced
migrants. Most displaced migrants in Iraq are Iraqi nationals who have been forced from their
homes but are still living in that country. In Yemen, most displaced migrants are internally
displaced persons as well, but a substantial number (about a quarter million or about 10%) are
refugees from other countries, mostly from Somalia.
4 Estimates for Palestinian refugees in Jordan as of 2015 are extrapolated from the growth rate between 2013 and 2014. These figures may
not reflect final data.

13
PEW RESEARCH CENTER
www.pewresearch.org
EMBARGOED COPY – NOT FOR PUBLICATION OR DISTRIBUTION UNTIL 00:00 a.m./p.m. EDT, MONTH DATE, YEAR
Syria, Jordan, Lebanon and Iraq have had the highest share of displaced migrants
among their national populations for many years
% of national resident populations that are displaced migrants
2005 2006 2007 2008 2009 2010 2011 2012 2013 2014 2015
Syria 3 6 10 8 7 7 6 15 37 44 39
Jordan 35 43 42 41 39 38 36 33 38 38 38
Lebanon 10 16 13 12 11 11 10 12 25 29 26
Iraq 5 7 9 9 5 4 4 4 4 11 13
Yemen <1 <1 1 1 2 2 2 3 2 2 10
Turkey <1 <1 <1 <1 <1 <1 <1 <1 1 2 4
Iran 1 1 1 1 1 1 1 1 1 1 1
Israel <1 <1 <1 <1 <1 <1 <1 <1 <1 <1 <1
Egypt <1 <1 <1 <1 <1 <1 <1 <1 <1 <1 <1
Kuwait <1 <1 2 2 <1 <1 <1 <1 <1 <1 <1
Bahrain <1 <1 <1 <1 <1 <1 <1 <1 <1 <1 <1
UAE <1 <1 <1 <1 <1 <1 <1 <1 <1 <1 <1
Qatar <1 <1 <1 <1 <1 <1 <1 <1 <1 <1 <1
Oman <1 <1 <1 <1 <1 <1 <1 <1 <1 <1 <1
Saudi Arabia <1 <1 <1 <1 <1 <1 <1 <1 <1 <1 <1
Palest. ter. <1 <1 <1 <1 <1 <1 <1 <1 <1 <1 <1
Total 2 2 3 2 2 2 2 2 4 5 6
Note: Rank ordered by the percentage displaced migrants among national resident populations as of 2015. Displaced migrants include
internally displaced persons within their birth countries, refugees and asylum seekers who have crossed an international border and
Palestinian refugees registered with UNRWA in Jordan, Lebanon and Syria. Palestinian refugee figures for 2015 were extrapolated from 2013
and 2014 estimates and may not reflect final estimates. See methodology for details.
Source: Pew Research Center analysis of UN data.
“Middle East’s Migrant Population More Than Doubles Since 2005”
PEW RESEARCH CENTER

14
PEW RESEARCH CENTER
www.pewresearch.org
2.0
6.5
7.6
6.6
1.2
2.6
1.0
3.6
4.4
2.5
0
2
4
6
8
2005 2007 2009 2011 2013 2015
Syria
Iraq
Yemen
The number of internally displaced persons in the Middle East has grown rapidly over the past
decade. In 2005, slightly more than a million people living in the Middle East had been displaced
from their homes and were living in their countries of birth. By 2015, the number had climbed to
about 13 million. As of 2015, nearly all internally displaced migrants in the Middle East lived in
just three countries: Syria,
Iraq and Yemen.
The conflict in Syria that
followed 2011’s Arab Spring
protests left about 2 million
Syrians internally displaced
by the end of 2012. As the
insurgency opposed to
President Bashar al-Assad’s
regime intensified and the
caliphate declared by the
militant group ISIS
continued to expand across
Syria, this number of
internally displaced persons
grew to 6.6 million by the end
of 2015.
Sectarian violence in Iraq led
to a total of 2.6 million
internally displaced people
within Iraq by the end of
2008. The number of Iraqis
displaced within their country then declined, as the intensity of civil strife subsided. However,
armed campaigns by ISIS soon drove more people from their homes. The number of internally
displaced Iraqis rose from slightly less than a million in 2013 to more than 4.4 million by 2015.
In Yemen, conflict also grew the number of internally displaced people. While this population
numbered in the hundreds of thousands through 2014, a subsequent surge in violence increased
the number of internally displaced Yemenis to more than 2.5 million by the end of that year.
Syria, Iraq and Yemen see rapid rise in displaced
populations within their countries in recent years
Internally displaced persons, in millions
Source: Pew Research Center analysis of UN data. See methodology for details.
“Middle East’s Migrant Population More Than Doubles Since 2005”
PEW RESEARCH CENTER

15
PEW RESEARCH CENTER
www.pewresearch.org
EMBARGOED COPY – NOT FOR PUBLICATION OR DISTRIBUTION UNTIL 00:00 a.m./p.m. EDT, MONTH DATE, YEAR
Millions of people, while remaining in the Middle East region, have crossed international borders
as refugees or asylum seekers. A total of 9.6 million refugees or asylum seekers lived in the Middle
East as of the end of 2015, up from 4.2 million in 2005 – a nearly 130% increase.5
The number of refugees in a given country is based on the number who are registered for assistance
from the United Nations High Commissioner for Refugees (for non-Palestinian refugees), the
United Nations Relief and Works Agency (for Palestinian refugees) and other aid groups. Not all
refugees register with such groups, however, and estimates of refugee populations in Middle
Eastern countries based on these sources should be interpreted as minimum population estimates.
5 Most Palestinian refugees living in Jordan, Lebanon and Syria have not crossed international borders as they are descendants of Palestinian
refugees who left Palestine following the establishment of Israel in 1948.
Jordan, Turkey, Lebanon and Iran have hosted most of Middle East’s refugees for
several years
Refugees and asylum seekers, by destination country, in thousands
2005 2006 2007 2008 2009 2010 2011 2012 2013 2014 2015
Jordan 1,845 2,378 2,404 2,453 2,435 2,453 2,436 2,340 2,717 2,790 2,854*
Turkey 7 9 12 18 16 17 25 291 662 1,694 2,754
Lebanon 407 431 465 473 477 465 447 577 1,306 1,614 1,541*
Iran 974 969 965 982 1,072 1,075 887 868 857 982 979
Iraq 52 47 45 42 39 38 39 104 252 280 285
Yemen 83 97 118 141 172 193 221 244 249 266 277
Syria 460 1,150 1,961 1,570 1,530 1,504 1,244 978 669 680 567*
Egypt 100 104 112 113 108 109 114 127 253 262 251
Israel 2 2 7 14 22 31 48 54 53 45 45
Kuwait 2 1 39 41 3 3 1 2 2 2 2
Saudi Arabia 241 241 241 241 <1 <1 <1 <1 <1 <1 <1
Other countries <1 <1 <1 <1 <1 1 1 1 1 1 2
Total 4,173 5,428 6,370 6,087 5,876 5,889 5,464 5,587 7,024 8,617 9,556
* Palestinian refugee figures for 2015 were extrapolated from 2013 and 2014 estimates and my not reflect final estimates. See methodology
for details.
Note: Rounded to nearest thousands except for estimates below 1,000, which are listed as <1. Countries with less than 1,000 refugees and
asylum seekers each year included as part of the “other countries” category. Rank ordered by number of refugees and asylum seekers in
2015.Includes Palestinian refugees registered with UNRWA in Jordan, Lebanon and Syria. See terminology section for a list of included
countries.
Source: Pew Research Center analysis of UN data.
“Middle East’s Migrant Population More Than Doubles Since 2005”
PEW RESEARCH CENTER

16
PEW RESEARCH CENTER
www.pewresearch.org
In 2015, fully 85% of refugees and asylum seekers in the Middle East lived in just four countries:
Jordan (nearly 2.9 million), Turkey (about 2.8 million), Lebanon (about 1.5 million) and Iran
(about 1 million). The number of refugees living in Turkey, Jordan and Lebanon grew rapidly after
the onset of the Syrian conflict. Meanwhile, the number of refugees in Iran has been somewhat
stable at roughly 1 million for the entire decade, with most of this refugee population displaced
from neighboring Afghanistan.
Iraq (285,000 refugees and asylum seekers in 2015) has seen a rapid rise in persons displaced
from neighboring countries after 2011 as well, mainly Syria. Yemen (277,000 refugees in 2015)
and Egypt (251,000 refugees in 2015) have also seen their refugee populations swell, due in large
part to conflicts in Somalia, Ethiopia and other countries in sub-Saharan Africa.
The majority of refugees and asylum seekers in the Middle East in 2015 can be traced to three
points of origin: Syria (4.6 million), the Palestinian territories (3.2 million) and Afghanistan (1.0
million).
Nearly all of the Middle East’s refugees have come from Syria, the Palestinian
territories and Afghanistan the past several years
Refugees and asylum seekers, by origin country, in thousands
2005 2006 2007 2008 2009 2010 2011 2012 2013 2014 2015
Syria 2 2 2 2 2 2 6 693 2,370 3,706 4,561
Palest. ter. 2,664 2,709 2,769 2,836 2,881 2,951 2,903 2,975 3,035 3,099 3,163*
Afghanistan 921 916 909 943 1,030 1,037 848 844 842 989 1,047
Somalia 85 101 125 146 173 191 217 240 244 257 267
Iraq 103 1,304 2,158 1,749 1,617 1,525 1,282 614 299 320 252
Sudan 25 27 28 29 29 33 36 36 43 40 45
Eritrea <1 1 4 7 15 20 35 42 40 38 39
Iran 18 18 17 16 19 15 16 18 21 31 37
Ethiopia 3 3 3 4 6 8 12 13 15 18 22
Turkey 14 17 16 16 12 16 16 16 17 18 18
Other countries 3 4 6 7 7 8 11 12 15 20 24
Total 4,173 5,428 6,370 6,087 5,876 5,889 5,464 5,587 7,024 8,617 9,556
* Palestinian refugee figures for 2015 were extrapolated from 2013 and 2014 estimates and my not reflect final estimates. See methodology
for details.
Note: Rounded to nearest thousands except for estimates below 1,000, which are listed as <1. Rank ordered by number of refugees and
asylum seekers in 2015. Estimates include Palestinian refugees registered with UNRWA living in Jordan, Lebanon and Syria. See terminology
section for a list of included countries.
Source: Pew Research Center analysis of UN data.
“Middle East’s Migrant Population More Than Doubles Since 2005”
PEW RESEARCH CENTER

17
PEW RESEARCH CENTER
www.pewresearch.org
EMBARGOED COPY – NOT FOR PUBLICATION OR DISTRIBUTION UNTIL 00:00 a.m./p.m. EDT, MONTH DATE, YEAR
As of the end of 2015, nearly all of Syrian refugees in the Middle East lived in just three countries:
Turkey (2.5 million), Lebanon (1.1 million) and Jordan (628,000). Outside of the Palestinian
territories, Jordan, Lebanon and Syria host Palestinian refugees. Meanwhile, Afghan refugees
living in the Middle East are mainly located in Iran.

18
PEW RESEARCH CENTER
www.pewresearch.org
2. Economic growth attracts migrants to Persian Gulf
Despite a recent drop in oil prices and the financial crisis of 2008 and 2009, the economies of
Persian Gulf countries expanded between 2005 and 2015. This economic expansion in countries
like Saudi Arabia, United Arab Emirates (UAE), Kuwait, Oman, Qatar and Bahrain has encouraged
millions of migrants to move to the Middle East
in search of economic opportunity.
Overall, the number of non-displaced,
international migrants living in the Middle East
grew by 61% between 2005 and 2015, from 19.2
to 31.0 million. (Non-displaced, international
migrants are the remaining migrant population
after displaced migrants are removed from the
total foreign-born population provided by the
United Nations. Most non-displaced,
international migrants have moved for
economic opportunity, but some may have also
moved for other reasons including to join
family or to study.)
At the country level, UAE saw the largest
absolute increase in the number of non-
displaced, international migrants – up by an
estimated 4.8 million over the decade, as the
population of this group increased from 3.3
million in 2005 to 8.1 million in 2015. Saudi
Arabia had the second largest increase in its
non-displaced, international migrant
population, up an estimated 3.9 million over
the same period, rising from 6.3 million in
2005 to 10.2 million in 2015.
By contrast, Qatar and Oman saw the largest
percentage increase in their non-displaced, international migrant populations, each rising more
than 150% during the decade.
Number of economic migrants in the
Middle East grows by about 50%
between 2005 and 2015
Non-displaced, international migrants, in thousands
2005 2010 2015
Saudi Arabia 6,261 8,429 10,186
UAE 3,281 7,316 8,094
Kuwait 1,332 1,868 2,865
Israel 1,888 1,920 1,967
Oman 666 816 1,845
Iran 1,594 1,686 1,747
Qatar 646 1,456 1,687
Bahrain 404 658 704
Lebanon 350 356 457
Syria 416 158 309
Jordan 480 270 258
Palest. ter. 267 258 256
Egypt 174 186 241
Turkey 1,312 1,350 211
Iraq 81 80 69
Yemen 88 93 67
Total 19,240 26,901 30,961
Note: Rounded to nearest thousands. Non-displaced, international
migrants are the remaining migrant population after displaced
migrants are removed from the total foreign-born population. See
methodology for details.
Source: Pew Research Center analysis of UN data.
“Middle East’s Migrant Population More Than Doubles Since 2005”
PEW RESEARCH CENTER

19
PEW RESEARCH CENTER
www.pewresearch.org
EMBARGOED COPY – NOT FOR PUBLICATION OR DISTRIBUTION UNTIL 00:00 a.m./p.m. EDT, MONTH DATE, YEAR
Many migrants come to Persian Gulf countries
as manual laborers on one- to two-year work
visas. Most come from South Asia (India,
Bangladesh and Pakistan) and elsewhere in
East Asia (Indonesia and Philippines). Some
renew their work visas and live in the Middle
East for years. The Gulf nations also attract a
sizable number of business, educational and
medical professionals from Europe, North
America and elsewhere. And increasingly,
international students from around the world
are studying at newly established and expanded
universities and colleges in the Persian Gulf
region.
A less pronounced increase in non-displaced,
international migrants occurred in Israel.
There, the total number of international
migrants increased by 79,000 between 2005
and 2015. Some people moved to Israel for
economic opportunity, while others have moved
for religious or family reasons.
Today, several Persian Gulf states have majority
foreign-born populations, mostly due to their
high number of economic migrants. In fact, all
Gulf Cooperation Council countries saw an
increase in their share of foreign born between
2005 and 2015. About three-quarters or more
of UAE (88%), Qatar (75%) and Kuwait (74%)
populations in 2015 are non-displaced, international migrants. Meanwhile, about half (51%) of
Bahrain’s population were foreign-born workers in 2015. Oman (41%) and Saudi Arabia (32%)
have relatively smaller shares that are foreign born, but that are still significantly higher than the
share found in many European countries or the United States.
UAE, Qatar and Kuwait have had
majority foreign-born populations for
several years
% of national resident populations that are
non-displaced, international migrants
2005 2010 2015 UAE 73 88 88
Qatar 77 82 75
Kuwait 59 61 74
Bahrain 47 52 51
Oman 27 28 41
Saudi Arabia 25 30 32
Israel 29 26 24
Lebanon 9 8 8
Palest. ter. 7 6 5
Jordan 9 4 3
Iran 2 2 2
Syria 2 1 2
Turkey 2 2 <1
Egypt <1 <1 <1
Yemen <1 <1 <1
Iraq <1 <1 <1
Total 6 7 8
Note: Rank ordered by share in 2015. Non-displaced, international
migrants are those who have not crossed international borders due
to conflict. Most non-displaced migrants enter the Middle East for
economic opportunity but some may have moved for other reasons
including to join family or to study. See methodology for details. See
terminology section for a list of included countries.
Source: Pew Research Center analysis of UN data.
“Middle East’s Migrant Population More Than Doubles Since 2005”
PEW RESEARCH CENTER

20
PEW RESEARCH CENTER
www.pewresearch.org
Acknowledgments
The report was written by Phillip Connor, research associate. Mark Hugo Lopez, director of
Hispanic research and James Bell, vice-president of global strategy, reviewed the report and
provided editorial comments. The report was primarily number checked by Gustavo López,
research assistant. Jynnah Radford and Antonio Flores, research assistants, provided number-
checking assistance. Michael Keegan, information graphics designer, provided graphics support.
David Kent was the copy editor. Travis Mitchell, associate web producer, provided web support.
Find related reports online at pewresearch.org/global
21
PEW RESEARCH CENTER
www.pewresearch.org
EMBARGOED COPY – NOT FOR PUBLICATION OR DISTRIBUTION UNTIL 00:00 a.m./p.m. EDT, MONTH DATE, YEAR
Methodology
The data used in this report are based on four primary data sources from United Nations agencies:
1) estimates for the number of displaced persons (international migrants such as refugees and
asylum seekers as well as internal migrants such as internally displaced persons) from the United
Nations High Commissioner for Refugees (UNHCR), 2) estimates for the number of international
migrants from the United Nations Population Division (UNPD), 3) estimates of Palestinian
refugees living in Jordan, Lebanon and Syria registered with the United Nations Relief and Works
Agency (UNRWA) and 4) total country population estimates from the World Population Prospects,
2015 revision from UNPD.
Defining displaced migrants
Displaced migrants in this report are a combination of internally displaced people, refugees and
asylum seekers from the UNHCR database. Additionally, Palestinian refugees living in Jordan,
Lebanon and Syria who are registered with UNRWA are also included. Data on displaced migrants
are available for every year between 2005 and 2015, except for Palestinian refugees in 2015.
Estimates for Palestinian refugees rely on data from UNRWA for years 2005 through 2014. The
2015 estimate for Palestinian refugees living in Jordan, Lebanon and Syria is an extrapolation of
Palestinian refugee population growth between 2013 and 2014 and may not reflect final estimates.
Additionally, the number of Palestinian refugees living in Syria is constantly changing given the
events occurring in that country. Palestinian refugees living in the Palestinian territories are not
included in the estimates of this report. These refugees have not crossed international boundaries.
For example, neither the United Nations High Commissioner for Refugees (UNHCR) nor United
Nations migration statistics classify them as refugees or migrants. Neither does UNHCR consider
Palestinian refugees living within the Palestinian territories to be internally displaced persons.
Defining non-displaced migrants
The number of non-displaced, international migrants in each Middle Eastern country was
estimated by removing refugees and asylum seekers (including Palestinian refugees registered
with UNRWA) from country totals of all international migrants found in the UNPD data. This
remainder group of non-displaced migrants is assumed to be mostly economic migrants. This is a
safe assumption given that the bulk of international migrants, once refugees and asylum seekers
are removed, live in the six Gulf Cooperation Council countries (Bahrain, Kuwait, Oman, Qatar,
Saudi Arabia and United Arab Emirates) known for employing millions of international migrants
for various jobs. Figures for non-displaced international migrants in years 2006-2009 and 2011-
2014 are estimates interpolated from UN estimates for 2005, 2010 and 2015.

22
PEW RESEARCH CENTER
www.pewresearch.org
All data sources are “stock” data. This means the data references total population at a certain point
in time and does not measure flows. The UNHCR displaced migrant data includes the total stock
of internally displaced persons, refugees and asylum seekers and those in refugee like situations as
of the end of 2015. The UNPD data, both of international migrants and total populations, are mid-
year estimates. Because of the different time frames, it is possible that estimates of the total
number of migrants (displaced and non-displaced) and shares of total populations may not reflect
actual population sizes in 2015.

23
PEW RESEARCH CENTER
www.pewresearch.org
EMBARGOED COPY – NOT FOR PUBLICATION OR DISTRIBUTION UNTIL 00:00 a.m./p.m. EDT, MONTH DATE, YEAR
Appendix A: References
Connor, Phillip. 2016. “Number of refugees to Europe surges to record 1.3 million in 2015.” Washington, D.C.: Pew Research Center, August. http://www.pewglobal.org/2016/08/02/number-of-refugees-to-europe-surges-to-record-1-3-million-in-2015/ Connor, Phillip. 2016. “Nearly 1 in 100 worldwide are now displaced from their homes.” Washington, D.C.: Pew Research Center, August. http://www.pewresearch.org/fact-tank/2016/08/03/nearly-1-in-100-worldwide-are-now-displaced-from-their-homes/ Connor, Phillip. 2016. “Migrant remittances worldwide drop in 2015 for the first time since the Great Recession.” Washington, D.C.: Pew Research Center, August. http://www.pewresearch.org/fact-tank/2016/08/31/migrant-remittances-worldwide-drop-in-2015-for-first-time-since-great-recession/ Connor, Phillip and Jens Manuel Krogstad. 2016. “About six-in-ten Syrians are now displaced from their homes.” Washington, D.C.: Pew Research Center, June. http://www.pewresearch.org/fact-tank/2016/06/13/about-six-in-ten-syrians-are-now-displaced-from-their-homes/ Kumar, Hari. 2016. “Thousands of Indian workers are stuck in Saudi Arabia as Kingdom’s economy sags.” New York City, New York: New York Times, August. http://www.nytimes.com/2016/08/02/world/asia/saudi-arabia-indian-workers.html?_r=0 Sedhai, Roshan. 2016. “The long way home.” Katmandu, Nepal: Kathmandupost, August. http://kathmandupost.ekantipur.com/news/2016-08-20/the-long-way-home.html Sophia, Mary. 2014. “IMF retains GCC growth forecast but warns of weak fiscal balance.” Dubai, United Arab Emirates: Gulf Business, October. http://gulfbusiness.com/imf-retains-gcc-growth-forecast-but-warns-of-weak-fiscal-balance/ United Nations High Commissioner for Refugees. 2016. “Global trends: Forced displacement in 2015.” Geneva, Switzerland: United Nations High Commissioner for Refugees, June. https://s3.amazonaws.com/unhcrsharedmedia/2016/2016-06-20-global-trends/2016-06-14-Global-Trends-2015.pdf

24
PEW RESEARCH CENTER
www.pewresearch.org
Appendix B: Additional tables
Total number of migrants living in Middle Eastern countries, 2005-2015
In thousands
2005 2006 2007 2008 2009 2010 2011 2012 2013 2014 2015
Bahrain 404 455 505 556 607 658 667 676 686 695 704
Egypt 274 281 291 294 292 296 311 335 472 492 492
Iran 2,569 2,582 2,596 2,631 2,740 2,762 2,585 2,579 2,580 2,717 2,726
Iraq 1,333 1,962 2,511 2,769 1,671 1,461 1,449 1,311 1,280 3,947 4,757
Israel 1,890 1,896 1,908 1,921 1,935 1,951 1,977 1,993 2,001 2,003 2,012
Jordan 2,325 2,816 2,800 2,807 2,747 2,723 2,704 2,606 2,980 3,051 3,112
Kuwait 1,333 1,439 1,585 1,694 1,764 1,872 2,069 2,268 2,468 2,667 2,866
Lebanon 757 982 887 827 831 821 823 974 1,723 2,051 1,998
Oman 666 696 726 756 786 816 1,022 1,228 1,433 1,639 1,845
Palest. ter. 267 265 263 261 260 258 258 257 257 256 256
Qatar 646 808 970 1,132 1,294 1,456 1,503 1,549 1,595 1,641 1,688
Saudi Arabia 6,502 6,936 7,369 7,803 7,996 8,430 8,781 9,133 9,484 9,835 10,186
Syria 876 1,514 2,274 1,831 1,739 1,662 1,432 3,213 7,438 8,591 7,439
Turkey 1,319 1,328 1,339 1,353 1,359 1,367 1,148 1,186 1,329 2,133 2,965
UAE 3,281 4,088 4,895 5,702 6,509 7,317 7,472 7,628 7,784 7,939 8,095
Yemen 171 186 285 332 514 507 656 712 634 673 2,876
Total 24,613 28,235 31,207 32,671 33,047 34,355 34,857 37,646 44,143 50,329 54,016
Note: Figures include displaced (internally displaced persons within their birth countries, refugees and asylum seekers who have crossed an
international border and Palestinian refugees registered with UNRWA in Jordan, Lebanon and Syria) and non-displaced, international
migrants. Figures for Palestinian refugees living in Jordan, Lebanon and Syria for 2015 were extrapolated from 2013 and 2014 estimates and
may not reflect final estimates. See methodology for details. Rounded to thousands. Interpolation based on trends was used for some years
(2006, 2007, 2008, 2009, 2011, 2012, 2013, 2014). See terminology section for a list of included countries.
Source: Pew Research Center analysis of United Nations data.
“Middle East’s Migrant Population More Than Doubles Since 2005”
PEW RESEARCH CENTER

25
PEW RESEARCH CENTER
www.pewresearch.org
EMBARGOED COPY – NOT FOR PUBLICATION OR DISTRIBUTION UNTIL 00:00 a.m./p.m. EDT, MONTH DATE, YEAR
Migrant share of total population in Middle East, by country, 2005-2015
% of national resident population that is a migrant
2005 2006 2007 2008 2009 2010 2011 2012 2013 2014 2015
Bahrain 47 48 49 50 51 52 51 51 51 51 51
Egypt <1 <1 <1 <1 <1 <1 <1 <1 1 1 1
Iran 4 4 4 4 4 4 3 3 3 3 3
Iraq 5 7 9 9 6 5 5 4 4 11 13
Israel 29 28 28 27 27 26 26 26 26 25 25
Jordan 44 51 49 47 44 42 40 37 41 41 41
Kuwait 59 60 62 63 61 61 64 66 69 71 74
Lebanon 19 24 22 20 20 19 18 20 33 37 34
Oman 27 27 28 29 28 28 32 35 37 39 41
Palest. ter. 7 7 7 7 7 6 6 6 6 6 5
Qatar 77 82 82 82 81 82 79 77 76 76 75
Saudi Arabia 26 27 28 29 29 30 31 31 31 32 32
Syria 5 8 12 9 8 8 7 16 39 46 40
Turkey 2 2 2 2 2 2 2 2 2 3 4
UAE 73 79 81 83 84 88 86 85 86 87 88
Yemen 1 1 1 1 2 2 3 3 2 3 11
Total 7 8 9 9 9 9 9 10 11 13 13
Note: See terminology section for a list of included countries. Migrants include those who have crossed international borders for any reason
as well as people forcibly displaced within their birth countries due to conflict. Data for some years estimated, see methodology for details.
Source: Pew Research Center analysis of United Nations data.
“Middle East’s Migrant Population More than Doubles Since 2005”
PEW RESEARCH CENTER

26
PEW RESEARCH CENTER
www.pewresearch.org
Appendix C: Countries by regional classification
Africa
Algeria Angola Benin Botswana Burkina Faso Burundi Cameroon Cape Verde Central African Republic Chad Comoros Democratic Republic of the Congo Djibouti Equatorial Guinea Eritrea Ethiopia Gabon Gambia Ghana Guinea Guinea Bissau Ivory Coast Kenya Lesotho Liberia Libya Madagascar Malawi Mali Mauritania Mauritius Mayotte Morocco Mozambique Namibia Niger Nigeria Republic of the Congo Reunion Rwanda Sao Tome and Principe Senegal Seychelles Sierra Leone

27
PEW RESEARCH CENTER
www.pewresearch.org
EMBARGOED COPY – NOT FOR PUBLICATION OR DISTRIBUTION UNTIL 00:00 a.m./p.m. EDT, MONTH DATE, YEAR
Somalia South Africa South Sudan St. Helena Sudan Swaziland Tanzania Togo Tunisia Uganda Western Sahara Zambia Zimbabwe Asia-Pacific
Afghanistan American Samoa Australia Azerbaijan Bangladesh Bhutan Brunei Burma (Myanmar) Cambodia China Cook Islands Federated States of Micronesia Fiji French Polynesia Guam Hong Kong India Indonesia Japan Kazakhstan Kiribati Kyrgyzstan Laos Macau Malaysia Maldives Marshall Islands Mongolia Nauru Nepal New Caledonia New Zealand Niue

28
PEW RESEARCH CENTER
www.pewresearch.org
North Korea Northern Mariana Islands Pakistan Palau Papua New Guinea Philippines Samoa Singapore Solomon Islands South Korea Sri Lanka Tajikistan Thailand Timor-Leste Tokelau Tonga Turkmenistan Tuvalu Uzbekistan Vanuatu Vietnam Wallis and Futun
Europe
Albania Andorra Armenia Austria Belarus Belgium Bosnia-Herzegovina Bulgaria Channel Islands Croatia Cyprus Czech Republic Denmark Estonia Faeroe Islands Finland France Georgia Germany Gibraltar Greece Hungary Iceland

29
PEW RESEARCH CENTER
www.pewresearch.org
EMBARGOED COPY – NOT FOR PUBLICATION OR DISTRIBUTION UNTIL 00:00 a.m./p.m. EDT, MONTH DATE, YEAR
Ireland Isle of Man Italy Latvia Liechtenstein Lithuania Luxembourg Malta Moldova Monaco Montenegro Netherlands Norway Poland Portugal Republic of Macedonia Romania Russia San Marino Serbia Slovakia Slovenia Spain Sweden Switzerland Ukraine United Kingdom Vatican City Latin America-Caribbean
Anguilla Antigua and Barbuda Argentina Aruba Bahamas Barbados Belize Bolivia Brazil British Virgin Islands Caribbean Netherlands Cayman Islands Chile Colombia Costa Rica Cuba Curaco Dominica

30
PEW RESEARCH CENTER
www.pewresearch.org
Dominican Republic Ecuador El Salvador Falkland Islands (Malvinas) French Guiana Grenada Guadeloupe Guatemala Guyana Haiti Honduras Jamaica Martinique Mexico Montserrat Nicaragua Panama Paraguay Peru Puerto Rico Sint Maarten St. Kitts and Nevis St. Lucia St. Vincent and the Grenadines Suriname Trinidad and Tobago Turks and Caicos Islands U.S. Virgin Islands Uruguay Venezuela
Middle East
Bahrain Egypt Iran Iraq Israel Jordan Kuwait Lebanon Oman Palestinian territories Qatar Saudi Arabia Syria Turkey United Arab Emirates Yemen

31
PEW RESEARCH CENTER
www.pewresearch.org
EMBARGOED COPY – NOT FOR PUBLICATION OR DISTRIBUTION UNTIL 00:00 a.m./p.m. EDT, MONTH DATE, YEAR
North America
Bermuda Canada Greenland St. Pierre and Miquelon United States