numerical and experimental study for … · numerical and experimental study for damage ....
TRANSCRIPT

NUMERICAL AND EXPERIMENTAL STUDY FOR DAMAGE
CHARACTERIZATION OF COMPOSITE LAMINATES SUBJECTED
TO LOW-VELOCITY IMPACT
Jiangtao Du, Ying Tie*, Cheng Li, Xihui Zhou
Department of Mechanical Engineering, Zhengzhou University, Zhengzhou 450001, China
*e-mail: [email protected]
Abstract. In this paper, the damage evolution and the relationship between damage
characterization and impact energy of Carbon/Epoxy composite laminates are discussed. To
achieve this purpose, low-velocity impact tests according to ASTM standard are conducted
and the data, like impact force, are obtained. Based on ABAQUS / Explicit, a finite element
model is established. In the model, the laminate is created by the solid element to better
descript the intra-laminar stress and the inter-laminar damage and the cohesive element are
introduced to model the interface. By comparing the experiment and simulation, the validity
of the simulation is verified. After simulating the impacts with a series of energy values, this
paper studies surface pit depth, delamination area and matrix damage area and provides
theoretical support for damage research and non-destructive testing.
1. Introduction
Composite materials have been widely used in engineering, particularly in the aerospace and
automotive industries. Fiber-reinforced composite material is most used in aircraft structure
with its unique material properties. This type of composite materials is composed by many
single plate layers with different ply angles and the plate layer is made of fibers and matrix [1].
The matrix is mainly responsible for transfer loads and has low strength and toughness, so
composite material structure is prone to occur matrix cracking. At the same time, the
inter-laminar interface, between the sub-layers which have different ply angles, has low
performance, so the structure is also easily to appear delamination damage subject to external
loads, especially under impact load.
It’s very likely to occur foreign object impact in the process of manufacturing, assembly,
use and maintenance of aircraft composite structures, such as collision during transport, drop
of maintenance tools and foreign object impact during ups and downs processes. These
shocks are mostly low-velocity impact, tend to form smaller pits on the surface, but the inside
the material, it has appeared in a large number of delamination and matrix damage [2]. Due to
impact damage severely affect the mechanical properties and residual strength of the
composite structure, as well as the damage is difficult to find, which increases the
harmfulness, it is necessary to study the impact damage’s evolution and performance
characteristics.
Materials Physics and Mechanics 27 (2016) 195-204 Received: January 6, 2016
© 2016, Institute of Problems of Mechanical Engineering

Chio et al. [3] studied composites damage mechanism and influencing factors due to
linear impact loads by experiments. They found that matrix cracking firstly appears during the
low-velocity impact, and delamination, fiber breakage and other damage are induced by
matrix cracking to produce. Haibing Jiang et al. [4] conducted low-velocity impact tests and
found that the form of the impact damage and the energy absorption process have the
relationship with the impact energy threshold of the material. Morua et al. [5] carried out the
low-velocity impact test to carbon/epoxy laminates. It found that the main damage forms
subjected to low-velocity impact are delamination and transverse cracks and those forms
mutually induce. Zhen et al. [6] found that the damages of composite laminates under two
different loads, low-velocity impact and quasi-static indentation (QSI) force, have
equivalence and the damage characterization parameters have been compared. F. Caputo et al.
[7] established a finite element model of low-velocity impact and analyzed the evolution of
injury. H. Yazdani Nezhad et al. [8] carried out tests and simulation analysis, studied the
relationship between the damage threshold and the damage area, and presented an accurate
modeling approach by comparing the experimental and simulation results. Paul W. Harper et
al. [9] studied the influence of the size of the cohesive element to the simulation of
delamination and instructed the application of the cohesive element.
In this paper, drop impact tests are conducted to carbon/epoxy composite laminates by
ASTM standard [10] and it studies the pit depth, force vs. time curve during the impact and
the damage forms. An accurate three-dimensional finite element model is established and its
accuracy and reasonableness are verified by comparing with the experimental data. By
analyzing the calculations with different impact energies, this paper studies the evolution of
the impact damage and uses the pit depths and damage areas can effectively characterize the
degree of damage, which can provide theoretical support for non-destructive testing
technology.
2. Experimental approach
The experimental approach is using the drop impact test, which is conducted by ASTM
standard D7136/D7136M-05, shown in Fig. 1.
Fig. 1. The drop impact test system.
In Figure 1, the left part is a schematic diagram of the test apparatus, which includes the
impactor system, the specimen clamp and the data acquisition device. The right part is the
196 Jiangtao Du, Ying Tie, Cheng Li, Xihui Zho

enlarged drawings of the unit preventing secondary impact and the specimen clamp. During
the test, the secondary impact may happen, so a photoelectric sensor is placed upon the
specimen, which can detect the impactor. When the first impact is done, the unit preventing
secondary impact will clamp or catch the impactor.
There is a load cell (PCB 208C05) in the impactor unit, which can measure the pressure
up to 34kN, like Figure 2. When the pressure data are achieved, the velocity of the impactor
can be calculated by the formulas in the Fig. 2. And the elastic energy and the absorbed
energy can also be achieved easily.
Fig. 2. Approach to achieve the energy vs. time curve.
Fig. 3. Shape of the laminates.
Table 1. Material properties of the composite laminate.
Laminate properties Interfacial properties
E11 (GPa) 160 GIC (N/mm) 0.3
E22 = E33 (GPa) 9.2 GIIC (N/mm) 0.7
G12 = G13 (GPa) 6.2 σI,max (MPa) 30
G23 (GPa) 3.7 σII,max (MPa) 60
v12 =v13 0.35 KI (N/mm3) 105
v23 0.4 KII (N/mm3) 105
XT (MPa) 1890
XC (MPa) 1615
YT =ZT (MPa) 50
YC =ZC (MPa) 250
S (MPa) 105
The shape of the composite laminates used in the tests is 100 mm in width and 150 mm
in length. Each laminate has 24 sub-plies and each ply’s thickness is appropriately 0.15 mm,
197Numerical and experimental study for damage characterization of composite laminates...

so the laminate is 3.6 mm in thickness. The stacking sequence of the laminate is
(45/-45/90/0)3S and the material properties are in Table 1.
In the tests, the impactor has a ball head whose radius is 12.5 mm and the weight of the
drop weight is 1.28 kg. Two smooth rails are used to ensure the direction of the impact and it
can be considered no energy loss during the fall. So, when the impactor is placed in the height
of 1 m, its velocity at the impact time is 4.42 m/s and the impact energy is 12.5 J.
3. FE model description
In order to accurately study the stress-strain status and damage conditions during the impact, a
three-dimensional finite element model (Fig. 4), consisting of composite laminates, impactor
and base, is established. With respect to the laminate, the impactor and the base have greater
stiffness, so when the impact is simulated, the impactor and the base can be simplified as rigid
bodies. In the laminate model, the approach of refining the central zone is used to ensure the
accuracy of the impact simulation and control the size of the model, which can significantly
reduce the computation time. The central area has the elements with the size of 1 mm, and the
others have the elements with the size of 2.5 mm.
Fig. 4. Mesh of the finite element model.
The finite element model of laminates has 24 plies, and each ply, which has one element
in the thickness direction, is 0.14 mm. The element type is C3D8R. Among the plies, the
cohesive elements with the element type of COH3D8 are created to simulate delamination
damage. The cohesive layer also has one element in the thickness direction and its thickness is
0.01 mm. Since delamination occurs only between the plies whose ply angles are different
and the difference accelerates the possibility of delamination, so 12 cohesive layers are
created only between the plies whose angle difference is 90°.
The finite element model in this paper can be more realistically and accurately simulate
the stress and strain conditions of the laminate, but the existing failure criteria and material
constitutive model cannot be used in this condition. So basing the ABAQUS/Explicit solver, a
user material subroutine (VUMAT) is compiled to solve the problem.
3.1. VUMAT. In the process of low-velocity impact to composite laminates, the
inter-laminar stress and the shear stress in the thickness direction is very complex and the
elements are no longer in the plane stress state, so the solid element is more consistent with
the real situation. The subroutine in this paper is based on the there-dimensional Hashin
198 Jiangtao Du, Ying Tie, Cheng Li, Xihui Zho

criterion and its flow chart is in Fig. 5. In the subroutine, four common failure modes are
considered, including matrix cracking, matrix compressive failure, fiber tensile failure and
fiber compressive failure. And delamination failure is analyzed by the cohesive element
which will be described in the section 3.2.
No
R<Setting value
Start
End
Yes
New increment
New iterative step
Calculate the stress/strain in integral points
Failure criterion
Material failure?
Stiffness reduction
Stiffness matrix
Update stress tensors
Residual RYes
Convergence?
No
Yes
No
VUMAT
Fig. 5. The flow chart of the simulation.
The three-dimensional Hashin criterion applied in the VUMAT is as follows.
Fiber tensile failure ( 11 0 ):
Dft= 2
2 21112 132
t
11
X S
or 11 tX (1)
Fiber compressive failure ( 11 0 ):
Dfc=2
11 1cX
or 11 cX (2)
Matrix cracking ( 22 33 0 ):
Dmt= 2 2 2 2
22 33 23 22 33 12 132 2 2
1 1 11
t tY S S (3)
Matrix compressive failure ( 22 33 0 ):
Dmc= 2
2 2 2 2
22 33 22 33 23 22 33 12 132 2 2
1 1 1 11 1
2 4
c
c t t t
Y
Y S S S S
. (4)
Wherein Dft, Dfc, Dmt and Dmc are damage coefficients; when their values are 1, it means
the element comes to complete failure and when the values are 0, it means there is no damage.
199Numerical and experimental study for damage characterization of composite laminates...

In the after-treatment, it can be used to depict the element state by the output state variables,
such as SVD1, SVD2, etc.
During the impact, if the element fails to meet the criteria, the corresponding material
stiffness degrades to 0, which means the element loses its carrying capacity. The specific
program of the degradation is in Table 2.
Table 2. The degradation program.
Damage modes Degradation criteria
Fiber tensile failure E1=E2=G12=0
Fiber compressive failure E1=0
Matrix cracking E2=0; G12=0
Matrix compressive failure E2=0; G12=0
3.2 Cohesive element. Delamination is the main damage mode of the composite
laminates subjected to low-velocity impact and it can be used as an important criterion to
evaluate the performance of the laminates. In order to be able to accurately predict the size
and position of the delamination, cohesive elements are established between the sub-plies.
The adhesive layer can be seen as a resin-rich region between the fiber plies and contains the
pure elastic stage and the softening stage after the yield point.
Fig. 6. A typical traction-separation model.
In this paper, the constitutive model of cohesive elements is based on a bilinear traction
separation law (Figure 6), relating the inter-laminar stress to the separation dis placement,
between the nodes at the inter-laminar interface. When the displacement increases, the stress
is in a linear increase with slope Kp, which is the stiffness of the cohesive element. After the
stress comes to the maximum, it linearly decreases to zero and at that point, it can be
considered that the cohesive element has failed completely and can be deleted. The area
surrounded by the stress vs. displacement curve and the horizontal axis is the critical strain
energy release rate.
The damage evolution based on fracture energy is used in the modeling approach.
Because B-K criterion matches the test data well, so it has been chosen to describe the failure
of the cohesive element.
B-K criterion:
(G G )( )IIIC IIC IC T
T
GG G
G
(5)
Wherein GT is the critical strain energy release rate of the cohesive element and
GT=GI+GII; η is the material parameter.
200 Jiangtao Du, Ying Tie, Cheng Li, Xihui Zho

4. Result and discussion
4.1. The test results compared with simulation. In the drop weight impact test, four
duplicate experiments with the impact energy 12.5 J are carried out and the front and rear
surfaces of the specimens are shown in Fig. 7.
Fig. 7. The front and rear surfaces of the specimens.
From the figure, it can be seen that the damage modes of the specimens are consistent and the
rear surfaces appear more obvious damage subject to the impact, including matrix cracking,
fiber breakage and delamination. The 3rd plate may have internal defects, so more serious
matrix cracking and delamination happen. In this case, no fiber breakage occurs. In the front
of the plates, a circular dimple-like damage appears with some slight fiber breakage, less
obvious. The phenomenon exhibits that the low-velocity impact is hidden and high hazard.
In Figure 8, they are the damage conditions of the front and rear surfaces in the finite
element model. The damage modes meet the experiments well: the front of the plate has a
circular depression and the rear surface has matrix cracking, fiber breakage and delamination.
The adhesive layer, nearest to the lower surface, is chosen to analyze at three different times
(Fig. 9). The damage shows double-lobed shape, whose major axis along the fiber direction of
the sub-ply away from the impact position [11], namely 45°. By comparison, the finite
element model established in this paper analyzes the low-velocity impact well and the
simulation matches the test data well. It illustrates the rationality of the subroutine and the
correctness of the applications of the cohesive element.
Fig. 8. The damage conditions of the simulation.
Fig. 9. The damage evolution of the adhesive layer.
201Numerical and experimental study for damage characterization of composite laminates...

During the impact, the load force is obtained by the load cell. Using the formulas in
Figure 2, the velocity, displacement and energy vs. time curves can also display, shown with
the experiment curves in Figure 10, 11, 12, 13. In Figure 10, the force grows stably in the
early impact period and can reach 3000 N with the drop weight which is just 1.28 kg. The
force vs. time curve is not a smooth one; at 0.5 ms, the force appears the first fluctuation.
Compared to the simulation results, it found that matrix cracking occurs at that point. In the
later period, the force fluctuates some times and all of them are related to fiber failure and
matrix damage.
Fig. 10. Force vs. time.
Fig. 11. Velocity vs. time.
Fig. 12. Displacement vs. time.
Fig. 13. Energy vs. time.
4.2. Relations between the damage characterization and the impact energy. By
contrasting the drop weight test and the simulation analysis, the model using the subroutine
and cohesive element has been verified the accuracy. On this basis, the section analyzes the
damage characterizations with different impact energies and discusses relationship between
the energy and the damage parameters.
Based on the three-dimensional finite element model mentioned above, ten groups of
energy values, from 2.5 J to 25 J, are calculated to study impact damage. Figure 14 is the
curve between the pit depth of the laminate and the impact energy. In the case of low-energy
impact (less than 7.5 J), the pit depth on the front surface increases slowly with the energy
grows; when the impact energy reaches 10 J, the pit depth has a great increase; then, the
curve enters a new stable growth stage. Analyzing the simulation result, it can be found that
under the energy of 10 J, fiber breakage appears for the first time on the back of the laminate.
When the energy comes to 15 J, there are some slight penetration and the pit depth can be
considered as the thickness of the laminate and don’t increase.
Figure 15 is the delamination area vs. impact energy curve; and Figure 16 is the plate
damage area vs. impact energy. The plate damage comprises the matrix damage and the fiber
damage. The curves in Figs. 14 and 15 have same growth trend: firstly, it grows slowly; after
the point of 7.5 J, fiber breakage occurs and the slope of the curves increases significantly; at
the point of 10 J, the delamination area is twice of the area of the 7.5 J. Generally considered
202 Jiangtao Du, Ying Tie, Cheng Li, Xihui Zho
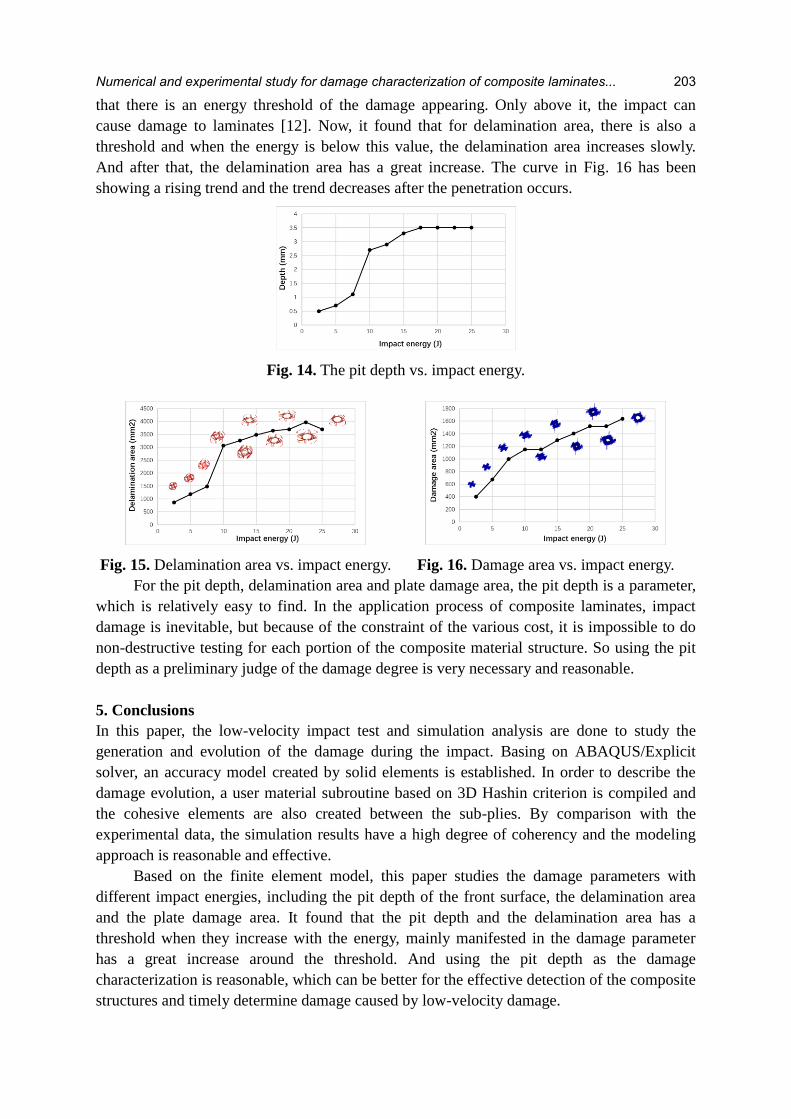
that there is an energy threshold of the damage appearing. Only above it, the impact can
cause damage to laminates [12]. Now, it found that for delamination area, there is also a
threshold and when the energy is below this value, the delamination area increases slowly.
And after that, the delamination area has a great increase. The curve in Fig. 16 has been
showing a rising trend and the trend decreases after the penetration occurs.
Fig. 14. The pit depth vs. impact energy.
Fig. 15. Delamination area vs. impact energy.
Fig. 16. Damage area vs. impact energy.
For the pit depth, delamination area and plate damage area, the pit depth is a parameter,
which is relatively easy to find. In the application process of composite laminates, impact
damage is inevitable, but because of the constraint of the various cost, it is impossible to do
non-destructive testing for each portion of the composite material structure. So using the pit
depth as a preliminary judge of the damage degree is very necessary and reasonable.
5. Conclusions
In this paper, the low-velocity impact test and simulation analysis are done to study the
generation and evolution of the damage during the impact. Basing on ABAQUS/Explicit
solver, an accuracy model created by solid elements is established. In order to describe the
damage evolution, a user material subroutine based on 3D Hashin criterion is compiled and
the cohesive elements are also created between the sub-plies. By comparison with the
experimental data, the simulation results have a high degree of coherency and the modeling
approach is reasonable and effective.
Based on the finite element model, this paper studies the damage parameters with
different impact energies, including the pit depth of the front surface, the delamination area
and the plate damage area. It found that the pit depth and the delamination area has a
threshold when they increase with the energy, mainly manifested in the damage parameter
has a great increase around the threshold. And using the pit depth as the damage
characterization is reasonable, which can be better for the effective detection of the composite
structures and timely determine damage caused by low-velocity damage.
203Numerical and experimental study for damage characterization of composite laminates...

Acknowledgement
The authors appreciate their supports from the National Natural Science Foundation of
China (U1333201 and 51205370).
References
[1] G.L. Shen, G.K. Hu, Composite Mechanics (Tsinghua University Press, 2006).
[2] C. Kassapoglou, Design and Analysis of Composite Structures: With Applications to
Aerospace Structures (John Wiley & Sons Ltd, 2013).
[3] H.Y. Choi, H.Y.T. Wu, F.K. Chang // Journal of Composite Materials 25 (1991) 1012.
[4] H.B. Jiang, B.R. Wei, Q. Chen, M.Q. Li // Journal of Aeronautical Materials 25(3) (2005)
45.
[5] M.F.S.F. Moura, A.T. Marques // Composites Part A: Applied Science and Manufacturing
33(3) (2002) 361.
[6] X.X. Zheng, X.T. Zheng, Z. Shen, S.C. Yang // Acta Aeronautica Et Astronautica Sinica
31(5) (2010) 928.
[7] F. Caputo, A. De Luca, G. Lamanna, R. Borrelli, U. Mercurio // Composites Part B:
Engineering 67 (2014) 296.
[8] H. Yazdani Nezhad, F. Merwick, R.M. Frizzell, C.T. McCarthy // International Journal of
Crashworthiness 20(1) (2015) 27.
[9] P.W. Harper, S.R. Hallett // Engineering Fracture Mechanics 75(16) (2008) 4774.
[10] ASTM D7136/D7136M-07 standard test method for measuring the damage resistance of
a fiber-reinforced polymer matrix composite to a drop-weight impact event, 2003.
[11] F. Collombet, X. Lalbin, J.L. Lataillade // Composites Science and Technology 58 (1998)
463.
[12] O. Peter, J.T. Hartness, T.M. Cordell // Computers and Structures 22 (1988) 30.
204 Jiangtao Du, Ying Tie, Cheng Li, Xihui Zho