numerical simulation and experimental validation of the
TRANSCRIPT

Research ArticleNumerical Simulation and Experimental Validation of theVibration Modes for a Processing Reciprocating Compressor
Ying Zhao Jiahao Chen Qiang Zhou Xiaohan Jia and Xueyuan Peng
Xirsquoan Jiaotong University No 28 Xianning West Road Xirsquoan Shaanxi 710049 China
Correspondence should be addressed to Xueyuan Peng xypengmailxjtueducn
Received 14 March 2017 Revised 29 June 2017 Accepted 6 July 2017 Published 22 August 2017
Academic Editor Marc Thomas
Copyright copy 2017 Ying Zhao et al This is an open access article distributed under the Creative Commons Attribution Licensewhich permits unrestricted use distribution and reproduction in any medium provided the original work is properly cited
The low-order vibration modes of a reciprocating compressor were studied by means of numerical simulation and experimentalvalidation A shell element model a beam element model and two solid element models were established to investigate theeffects of bolted joints and element types on low-order vibration modes of the compressor Three typical cases were comparedto check the effect of locations of moving parts on the vibration modes of the compressor A forced modal test with the MRIT(Multiple References Impact Test) technique was conducted to validate the simulation results Among four numerical models thesolid element model with the bolt-pretension method showed the best accuracy compared with experimental data but the worstcomputational efficiency The shell element model is recommended to predict the low-order vibration modes of the compressorwith regard to effectiveness and usefulnessThe sparsely distributed bolted joints with a small bonded region on the contact surfacewere key bolted joints that had greater impacts on the low-order vibration modes of the compressor than the densely distributedbolted joints The positions of the moving parts had little effect on the low-order vibration modes of the compressor
1 Introduction
Reciprocating compressors are widely used in mechanicaland petrochemical industries Dynamic forces on reciprocat-ing compressors such as unbalanced inertial forces gas forcesinside the cylinder cross-head forces and acoustic shakingforces can induce severe vibrations on compressor pipesvessels small-bore appendages and the skid [1] Excessivevibration may lead to fatigue failure capacity loss andincreasing maintenance costs To ensure the safe and reliableoperation of the compressor system the vibration modes ofthe compressor mainly includingMNFs (mechanical naturalfrequencies) and mode shapes should be studied during thedesign stage FEA (finite element analysis) and experimentalmodal test were applied to identify the vibration modes ofstructures
The first step of the numerical simulation is to buildthe FEA model of the structure A key point of numer-ical modelling is to choose the proper element type forthe structure Many studies have been conducted on theselection of element types for reciprocating compressors
in order to simulate the dynamic characteristics of thecompressor accurately and efficiently The solid elementmodel can simulate the actual geometric shape and physicalmorphology of the compressor but its disadvantages includelargememory cost and time-consuming operation Benjamin[2] compared the vibration velocity responses and dynamicstress distributions of the cylinder nozzle and pulsationfilter bottle using the shell element model and the beamelement model and found that the more detailed shell modelshowed better agreement with the field measurement thanthe simpler beam element model Harper et al [3] notedthat beam elements were suitable for static loads such aslifting loads but dynamic analyses often required shell orsolid elements for certain parts of the model to accuratelysimulate local flexibility Passeri et al [4] generated a super-element of the compressor frame by the solid elementmodel based on the substructuring technique to achieve abalance between calculation accuracy and computation timeHowever little attention has been focused on the influenceof element types on MNFs and mode shapes of reciprocatingcompressors
HindawiShock and VibrationVolume 2017 Article ID 5327326 12 pageshttpsdoiorg10115520175327326
2 Shock and Vibration
(1)
(2)(3) (4) (5) (6) (7) (8)
(10)(9) (12)(11)
The second throw
Cylinder Connection drum Crankcase Distant piece
PedestalCylinder support A small fraction of the skid
The first throw
Figure 1 The balanced-opposed reciprocating compressor
Proper modelling of bolted joints is critical to esti-mating the dynamic characteristics of reciprocating com-pressors The characteristics of bolted joints have drawnmuch attention in recent years [5ndash12] Pratt and Pardoen[5] proposed nonlinear finite element models to predictthe load-elongation behaviour of conical-head bolted lapjoints and verified simulation results by the comparison totest data Ahmadian and Jalali [6] established a detailedparameter model of a bolted joint interface and extractedmodal parameters by the force-state mapping method Kimet al [7] established four kinds of numerical models toinvestigate the pretension effect and contact behaviour ofbolted joints Compared with experimental results the solidbolt model which was modelled using three-dimensionalsolid elements and surface-to-surface contact elements pro-vided the best accuracy the coupled bolt model whichcoupled the degrees of freedom between the headnut andthe flange showed the best effectiveness with respect tocomputational time Nevertheless the numerical modellingmethods of complex assemblies with many bolted jointssuch as reciprocating compressors were discussed by a smallnumber of researchers
During the operation the compressor crankshaft wasdriven by the motor The rotation of the crankshaft will beconverted to the reciprocating motion of the piston throughthe crank-connecting rod mechanism which consists ofthe crankshaft connecting rod cross-head piston rod andpiston The locations of the reciprocating moving parts varybetween the TDC (top dead centre) and BDC (bottom deadcentre) periodically as the crankshaft is rotated The distancebetween TDC and BDC is defined as the stroke of thecompressor No research has been conducted on the influenceof the locations of moving parts on the vibration modes ofreciprocating compressors
Modal analysis is widely used inmany fields such as archi-tecture bridges and vehicles to extract the vibrationmodes ofstructures [13ndash20] Experimental modal testing is an impor-tant type of modal analysis and has rapidly developed inrecent years Aras et al [15] conducted an ambient vibrationsurvey to identify the dynamic characteristics of a historicalmasonry palace and modified the finite element model byadjusting the elasticity modulus based on the experimentalresults Ribeiro et al [16] identified MNFs mode shapes anddamping coefficients of a bowstring-arch railway bridge by
an ambient vibration test Minette et al [18] conducted aSIMO (single-input and multiple-output) modal test for anelectrical submersible pump and extracted its MNFs by theleast square complex exponential method However there islittle research on the experimental identification of vibrationmodes of reciprocating compressors
In this paper the low-order vibration modes of a pro-cessing reciprocating compressor were studied through finiteelement analysis and modal testing Two solid elementmodels using the bolt-pretension method and the surface-bonded method a shell element model and a beam elementmodel were established to investigate the influence of elementtypes and bolted joints on the low-order vibration modes ofthe compressorThe key bolted joints of the compressor wereidentified based on the analyses of contact statuses on theinterfaces between bolted flanges Three typical cases werecompared to study the effect of the locations of moving partson the low-order vibrationmodes of the compressor A forcedmodal test with the MRIT (Multiple References Impact Test)technique was conducted to validate the numerical results
2 Numerical Simulation
21 Geometric Model The processing reciprocating com-pressor investigated in this paper is a balanced-opposedhydrogen compressor with a rated speed of 980 rsdotminminus1rated shaft power of 73 kW and total mass of 12500 kgThe compressor has two throws and four stages as shownin Figure 1 Hereinafter the first throw refers to the firstand second stages while the second throw corresponds tothe third and fourth stages The compressor body mainlyconsists of the crankcase distant pieces connection drumscylinders cylinder supports and pedestal These parts areconnected through bolted joints To study the influence ofbolted joints on the vibration modes of the compressortwelve groups of bolted joints (a total of 74 bolted joints)were included in subsequent numerical analyses as shownin Figure 1 Other bolted joints small features such as filletsand small holes and some unimportant parts such as gasvalves and lubricating pipes were removed to improve thecalculation efficiency Since the high-order harmonics of theperiodic excitation forces such as the gas forces cross-headguide forces and acoustic shaking forces are very tiny and
Shock and Vibration 3
1265 mm380 mm
m1 m2
(a) The first throw of piston and piston rod
584 mm1025 mm
m4m3
(b) The second throw of piston and piston rod
130mm 320mm
m5m6
(c) The connection rod
117 mm300mm
m8m7
(d) The crankshaft
m1 = 395 kg
m4 = 245 kg
m2 + m6 + m9 = 973 kg
m5 + m7 = 51 kg m5 + m8 = 431 kg
m3 + m6 + m9 = 431 kg
(e) The crank-connecting rod mechanism
Figure 2 The equivalence masses of moving parts
high-order resonances have little effect on the reciprocatingcompressor only the low-order vibration modes of thereciprocating compressor were discussed in this paper Thefrequency range for the modal analysis of the reciprocatingcompressor was set as 0ndash100Hz according to the literature[21]
The moving parts inside the compressor body weresimplified as point masses by the equivalent principle ofmass as shown in Figure 2 A total of 6 point masses wereapplied on the FEA model Four of them were equivalentreciprocatingmasses and applied on cylinder walls and cross-head guide walls while the others were equivalent rotating
masses and applied on bearing seats of the crankcase Tostudy the influence of locations of moving parts on thevibration modes of the compressor three typical cases werecompared in which the equivalent reciprocating masses wereapplied on the location of TDC BDC and their midpoint
22 Numerical Models To assess the effect of element typesand bolt joints on the accuracy and efficiency of the numericalsimulation of vibration modes for the reciprocating com-pressor two solid element models using the bolt-pretensionmethod and the surface-bonded method a shell elementmodel and a beam element model were established
4 Shock and Vibration
(mm)100000
7500050000000
25000
Pretension forces
Y
XZZZZZZZZZZZZZZZZZZZZZZZZZZZ
Figure 3 The solid element method with the bolt-pretension method
(mm)100000
7500050000000
25000
Y
XXXXZZZZZZZZZZZZZZZZZZZZZ
C modalModalFrequency NA
A
BC
D
EF
Point massPoint mass 2Point mass 3
Point mass 4Point mass 6Point mass 5
GHI
Fixed supportFixed support 2Fixed support 3
Figure 4 The solid element method with the surface-bonded method
221 Two Kinds of Solid Element Models The solid elementmodels were modelled using 3D (three-dimensional) solidelements known as SOLID187 in ANSYS This type ofelement is defined by 20 nodes and each node has threetranslational DOFs (degrees of freedom) Two methodsnamely the bolt-pretension method and the surface-bondedmethod were adopted to investigate the influence of boltedjoints to the low-order vibration modes of the compressor
(1)The Bolt-PretensionMethodThe solid elementmodel withthe bolt-pretension method as shown in Figure 3 was themost realistic model among the four FEAmodels introducedin this paper In this method both the pretension forceand contact behaviour of bolted joints were considered Thepretension force was generated in the mid-plane of the boltshaft using the bolt-pretension element known as PRETS179inANSYSThepretension forcewas calculated by the formularecommended in the mechanical design handbook [22]
119865119886 = (06 minus 07) 119860 119904120590119904 (1)
where 119865119886 is the pretension force 119860 119904 is the nominal cross-sectional area of the bolt and 120590119904 is the yield strength of thematerial In addition the surface-to-surface contact pairswhich consisted of target elements and contact elements wereapplied on the interfaces between the bolted flanges and setto frictional types with a friction coefficient of 02
(2)The Surface-Bonded Method The surface-bonded methodwas much simpler than the bolt-pretension method due tothe ignorance of bolted joints In thismethod all bolted jointswere removed except the connecting long bolts of the third-and fourth-stage cylinders as shown in Figure 4 All of thesurface-to-surface contact pairs on the interfaces betweenbolted flanges were set to the bonded type which means thewhole region of the contact area was assumed to be tightlyattached
222 The Shell Element Model Some researchers [9] notedthat not all regions of the interfaces between bolted flangeswere well attached under the pretension force The region
Shock and Vibration 5
H
Do
Figure 5 Stress distribution region between bolted flanges
DOF coupling
Figure 6 The shell element model
near the screw hole was tightly attached while the regionfar away from the screw hole was not closely contacted Thetheoretical stress distribution region between bolted flangeswas approximated to a truncated cone [9] as shown inFigure 5
In the shell element model the compressor body wasmeshed with 3D shell elements known as SHELL181 inANSYS This type of element is defined by 4 nodes and eachnode has three translationalDOFs and three rotationalDOFsThere was no bolted joint included in this model except theconnecting long bolts of the third- and fourth-stage cylindersThe pretension effect of the bolted joints was considered bythe DOF coupling of nodes in the theoretical bonded regionwhich was an annular region around the screw hole as shownin Figure 6 The outer diameter of the theoretical bondedregion119863119900 was calculated by
119863119900 = 119863119908 + 2119867 tan 120579 (2)
where 119863119908 is the outer diameter of the washer 119867 is thethickness of the flange and 120579 is the half-apex angle of thetruncated cone which was suggested to be less than 45∘ in theliterature [11] and taken as 40∘ in this model
223 The Beam Element Model The beam element model asshown in Figure 7 was the simplest model among these fournumerical models The cylinders cylinder supports connec-tion drums distant pieces and crankcase were simplified as3D beam elements known as BEAM188 in ANSYSThis typeof element is defined by 2 nodes and each node has threetranslational DOFs and three rotational DOFs Howeverthe pedestal was meshed by 3D shell elements (SHELL181)
Figure 7 The beam element model
Moreover there was no bolt except the connecting longbolts of the third- and fourth-stage cylinders included in thismodel and all of the connections between different partswere considered as rigid connections
After building the FEA models the bottom surfaces ofthe pedestal and the small fractions of the skid under thecylinder supports were fixed as constrained elements Forthe solid element model with the bolt-pretension methoda nonlinear static analysis was first performed to evaluatethe contact status of the interfaces between bolted flangesand a pretensionmodal analysis was subsequently conductedto obtain the low-order MNFs and mode shapes of thecompressor For the other three FEA models the modalanalysis was conducted directly to extract the low-ordervibration modes of the compressor
3 Experimental Validation
31 Forced Modal Test A forced modal test with the MRIT(Multiple References Impact Test) technique was performedto identify the vibration modes of the compressor andvalidate the numerical results The selection of the referencepoints is an important step in the modal test The referencepoints should avoid the modal nodes of vibration modes ofinterest and the modal shapes should be significant at thereference points to ensure that the FRF curves have significantpeaks As for this reciprocating compressor with two throwsof cylinders the excitations on one end of the compressorare difficult to arouse obvious vibrations on the other end sowe selected two reference points on each throw of cylinderbased on pretests and numerical results The four referencepoints that is the excitation points are shown in Figure 8The response points should be able to identify all the modeshapes of interest and avoid the modal confusion Based onthe mode shapes obtained by the FEA analyses the responsepoints were mainly arranged at geometrical vertexes andappropriately increased at positions of weak stiffness A totalof 136 response points were selected as shown in Figure 8
The experimental system is shown in Figure 9 Theexcitations were applied by a PCB 086D50 type impacthammerwith the sensitivity of 023mVsdotNminus1 measuring rangeof 22240N and hammer weight of 25 kg The responseswere acquired by a PCB 356B18 type three-axis accelerationsensor with a measuring range of plusmn5 g and frequency span of05ndash3000HzThe sensitivities of the acceleration sensor in the
6 Shock and Vibration
31Z
82Y
91Z
2XY
XZ
Figure 8 Excitation and response points
Compressor
Accelerationsensor
Hammer
Data acquisition hardware
Data analysis software
Figure 9 The forced modal test process
119883 119884 and 119885 directions were 1030mVsdotNminus1 1048mVsdotNminus1 and992mVsdotNminus1 respectively AnNI 9234 data acquisition systemwith four channels was used to simultaneously record theforce signal and accelerator signals in three directions Signalsobtained from the modal test were recorded and processedby the data analysis software Coinv DASP V10 developed byChina Orient Institute of Noise and Vibration During themodal test process each point was gathered three times andthemeasured data were linearly processed to reduce the errorof the experiment
32 Experimental Results The modal parameters of thereciprocating compressor in the frequency range of 0ndash100Hzwere estimated by the ERA (Eigen Realization Algorithm)method which is one of the advanced time-domain modalidentification methods Figure 10 shows the stabilizationdiagram four CMIFs (Complex Modal Indicator Func-tions) were presented and seven vibration modes wereidentified within the frequency range of interest Themode vectors were normalized by the mass normalizationmethod
TheMAC (modal assurance criterion) is a scalar constantused to denote the similarity between one mode vector andanother and lies in the range from0 to 1Thehigher theMACthe better the orthogonality between the mode vectors The
50
60
70
80
90
100
Ord
er n
umbe
r
20 40 60 80 1000Frequency (Hz)
Figure 10 Stabilization diagram of the ERA method
MAC between the 119894th and 119895th mode vectors 120601119894 and 120601119895 canbe expressed as follows
MAC (120601119894 120601119895) =100381610038161003816100381610038161003816120601119894119879 1206011198951003816100381610038161003816100381610038162
(120601119894119879 120601119894) (120601119895119879 120601119895)
(3)
The MAC matrix of the extracted seven-order vibrationmodes is shown in Figure 11 It can be seen that the off-diagonal values of the MAC matrix were less than 05which indicated that the seven-order mode vectors had goodorthogonality
Figure 12 shows the extracted seven orders of modeshapes of the compressor It can been seen that the first-and second-order mode shapes were horizontal bendingvibrations (in the119885 direction) of the second and first throw ofthe cylinders respectively the third- and fourth-order modeshapes were vertical bending vibrations (in the 119884 direction)of the second and first throw of cylinders respectivelythe fifth- and seventh-order mode shapes were torsionalvibrations around the 119883 direction of the second and firstthrow of cylinders respectively the sixth-order mode shapewas overall horizontal vibration along the119883 direction
4 Results and Discussion
41 Effects of Element Types on Vibration Modes of the Com-pressor Figure 13 shows the comparison of the low-orderMNFs between numerical results of three different elementtypes and experimental results Figures 14ndash16 show the low-order mode shapes obtained by three different element typesTable 1 shows the comparison of computational efficiencyamong different numerical models It can be seen that thedeviation of the low-order MNFs between the solid elementmodel with the bolt-pretension method and experimentaldata ranged from minus14 to 79 the deviation between theshell element model and experimental data ranged fromminus153 to minus61 however the low-order MNFs obtainedfrom the beam elementmodel were obviously higher than theexperimental results with relative errors ranging from 330to 1124 In addition the low-ordermode shapes of the solidelementmodel with the bolt-pretensionmethod and the shell
Shock and Vibration 7
Table 1 Comparison of computation time and storage space
Solid element modelsShell element model Beam element modelBolt-pretension method Surface-bonded method
74 bolted joints 8 bolted jointsComputation timeh 68 37 23 003 001Storage spaceGB 895 324 276 174 040
004 002
011
002
019
019
002
004
004 004
007
007 007004
100
100
100
100
100
100
010
010
010
011
012
012
010
040
040
005
005
003
003
003
006
006
003
032
032
007
028
2320 5126 7262 8325 9129 96450
1
010203040506070809
1743
004
003
003
002
002 002028
100
9645
9129
8325
7262
5126
2320
1743
Figure 11 MAC matrix of the extracted seven mode vectors in the frequency range of 0ndash100Hz
1743Hz 2320 Hz 5126 Hz 7662 Hz
8325 Hz 9129 Hz 9645 Hz
Figure 12 Experimental results of mode shapes in the frequency range of 0ndash100Hz
element model fitted well with experimental results but thefourth- to seventh-order mode shapes of the beam elementmodel were completely different from experimental results
The significant errors of the beam element model maybe caused by two reasons Firstly the Beam188 elementsin ANSYS are based on Timoshenko beam theory whichassumes that the cross section of the element remains planewithout distortion after deforming of the structure so theignorance of deformation on cross-sections of compressorcylinders will reduce simulation accuracy Secondly differentcomponents such as cylinders and cylinder supports wereconnected by rigid beam elements in the beam elementmodel which may lead to the increase of the overall stiffnessand the overestimation of MNFs
It was concluded that the solid element model with thebolt-pretension method showed the best accuracy compared
with experimental results among the three numerical modelsdiscussed here The deviations of the shell element modelwere within the engineering allowable range and the shellelement model saved 996 of computation time and 806of storage space compared to the bolt-pretension method Inview of effectiveness and usefulness the shell element modelwas recommended to predict the low-order vibration modesof the reciprocating compressor
42 Effects of Bolted Joints on Vibration Modes ofthe Compressor
421 Comparison between Two Solid Element Models andExperimental Data Figures 17 and 18 show the comparisonsof the low-order MNFs and mode shapes between two
8 Shock and Vibration
1 2 3 4 5 6 7Order number
Modal testThe bolt-pretension method
The shell element modelThe beam element model
0
20
40
60
80
100
120
140
Freq
uenc
y (H
z)
Figure 13 Comparison of MNFs between numerical results of different element types and experimental results
000
(mm)
50000
100000
Y
XZ
000
(mm)
50000
100000
Y
XZ 000
(mm)
50000
100000
Y
XZ000
(mm)
50000
100000
Y
XZ
000
(mm)
50000
100000000
(mm)
50000
100000000
(mm)
50000
100000
YY
XX
ZZ
Y
XZ
152 Max135118101084506760507033801690 Min
B ModalTotal DeformationType Total DeformationFrequency Hz1818Unit mm
154 Max13712103085606850514034201710 Min
Total Deformation 2Type Total DeformationFrequency Hz22769Unit mm
193 Max1711512810708560642042802140 Min
Total Deformation 3Type Total DeformationFrequency Hz4995Unit mm
184 Max16314312210208170612040802040 Min
Total Deformation 4Type Total DeformationFrequency Hz74508Unit mm
253 Max2251971691411130844056302810 Min
Total Deformation 5Type Total DeformationFrequency Hz8724Unit mm
133 Max118103088507380590443029501480 Min
Total Deformation 6Type Total DeformationFrequency Hz92424Unit mm
16 Max142124107088907110534035601780 Min
Total Deformation 7Type Total DeformationFrequency Hz10407Unit mm
2277Hz
10407 Hz9242Hz8724 Hz
7451Hz4995Hz1818 Hz B Modal B Modal B Modal
B ModalB ModalB Modal
Figure 14 Low-order mode shapes of the solid element model with the bolt-pretension method
NODAL SOLUTIONSTEP = 1SUB = 1FREQ = 1591USUM (AVG)RSYS = 0DMX = 1446SMX = 1446
NODAL SOLUTIONSTEP = 1SUB = 2FREQ = 1957USUM (AVG)RSYS = 0DMX = 1394SMX = 1394
NODAL SOLUTIONSTEP = 1SUB = 3FREQ = 4356USUM (AVG)RSYS = 0DMX = 1663SMX = 1663
NODAL SOLUTIONSTEP = 1SUB = 4FREQ = 6683USUM (AVG)RSYS = 0DMX = 1466SMX = 1466
NODAL SOLUTIONSTEP = 1SUB = 5FREQ = 7618USUM (AVG)RSYS = 0DMX = 2222SMX = 2222
NODAL SOLUTIONSTEP = 1SUB = 6FREQ = 8570USUM (AVG)RSYS = 0DMX = 1333SMX = 1333
NODAL SOLUTIONSTEP = 1SUB = 7FREQ = 8905USUM (AVG)RSYS = 0DMX = 1387SMX = 1387
8905Hz8570Hz7618Hz
6683Hz4356Hz1957Hz1591Hz1
1 1 1
1 1 1
0 144612861125096408040643048203210161 0 139412391084092907740619046503100155 0 166314791294110909240739055503700185 0 146613031140097708140651048903260163
0 1387123310790925077106160462030801540 1333118510370889074005920444029601480 222219751729148212350988074104940247
Figure 15 Low-order mode shapes of the shell element model
Shock and Vibration 9
NODAL SOLUTION1
0 0 0 0
001627144612661085090407230542036201810 0181 0362 0543 0725 0906 1087 1268 1449 1630
0101 0203 0304 0405 0506 0608 0709 0810 0912
0141 0145 0168 0335 0503 0670 0838 1005 1173 1340 15080290 0436 0581 0726 0871 1016 1161 130703650182 0547 0729 0912 1094 1277 1459 16410281 0422 0563 0703 0844 0985 1125 1266
STEP = 1SUB = 1FREQ = 2903USUM (AVG)RSYS = 0DMX = 1266SMX = 1266
NODAL SOLUTION1
STEP = 1
MXSUB = 2FREQ = 4907USUM (AVG)RSYS = 0DMX = 1641SMX = 1641
NODAL SOLUTION1
STEP = 1SUB = 3FREQ = 8267USUM (AVG)RSYS = 0DMX = 1307SMX = 1307
NODAL SOLUTION1
STEP = 1SUB = 4FREQ = 10272USUM (AVG)RSYS = 0DMX = 1508SMX = 1508
NODAL SOLUTION1
STEP = 1SUB = 7FREQ = 12885USUM (AVG)RSYS = 0DMX = 0912SMX = 0912
NODAL SOLUTION1
STEP = 1SUB = 6FREQ = 12140USUM (AVG)RSYS = 0DMX = 1630SMX = 1630
NODAL SOLUTION1
STEP = 1SUB = 5FREQ = 11954USUM (AVG)RSYS = 0DMX = 1627SMX = 1627
12885 Hz12140Hz11954Hz
10272Hz8267Hz4907 Hz2903 Hz
Figure 16 Low-order mode shapes of the beam element model
1 2 3 4 5 6 7Order number
Modal testThe bolt-pretension methodThe surface-bonded method
0
20
40
60
80
100
120
140
160
Freq
uenc
y (H
z)
Figure 17 Comparison of MNFs between two kinds of solid element models and experimental results
kinds of solid element models and the experimental dataIt can be seen that the deviation of the low-order MNFsbetween the surface-bonded method and experimental dataranged from 523 to 798 and was obviously higherthan that of the bolt-pretension method The overestima-tion of MNFs may be caused by the ignorance of pre-tension effects of bolted joints which will create compres-sion stress between the interfaces and decrease the naturalfrequencies Moreover the first seven mode shapes of thebolt-pretension method were consistent with experimentalresults but the fourth- to sixth-order mode shapes of thesurface-bonded method were different from experimentalresults It was indicated that the bolt-pretension methodwas effective for identifying low-order vibration modes ofcomplex assemblies with bolted joints such as a reciprocating
compressor while the surface-bonded method could notaccurately evaluate the low-order vibrationmodes of complexassemblies
422 Contact Status on the Interfaces between Bolted FlangesThecontact statuses of frictional contact pairs in the solid ele-ment model with the bolt-pretension method were extractedfrom the static analysis results There are five kinds ofcontact statuses in ANSYS and among them the sticking andsliding statuses can be equivalent to the bonded contact [23]There were two main types of contact status between boltedflanges of the compressor as shown in Figure 19The bondedregions on the interfaces between cylinders and cylindersupports and the interfaces between cylinder supports and
10 Shock and Vibration
3133Hz 4033Hz 8663Hz 12309 Hz
12676Hz 13983 Hz 15482 Hz
A ModalTotal DeformationType Total DeformationFrequency 3133HzUnit mm
157 Max14122105087206980523034901740 Min
A ModalTotal Deformation 2Type Total DeformationFrequency 4033 HzUnit mm
155 Max1381210308606880516034401720 Min 0 Min
A ModalTotal Deformation 3Type Total DeformationFrequency 86633HzUnit mm
22 Max196171147122098
0490735
0245
25231 Max2242819624168211401711214
056069084104
028035
0853 Max07580663056904740379
0190284
00948
155 Max13812110308610689
03440516
0172
165 Max1461281109140731
03660548
0183
A ModalTotal Deformation 4Type Total DeformationFrequencyUnit mm
12309 Hz
A ModalTotal Deformation 5Type Total DeformationFrequencyUnit mm
12676 Hz
A ModalTotal Deformation 6Type Total DeformationFrequencyUnit mm
13983 Hz
A ModalTotal Deformation 7Type Total DeformationFrequencyUnit mm
15482 Hz
0 Min
0 Min0 Min
000
(mm)
50000
100000 000
(mm)
50000
100000 000
(mm)
50000
100000 000
(mm)
50000
100000
000
(mm)
50000
100000000
(mm)
50000
100000000
(mm)
50000
100000
Y
XZ
Y
XZ
Y
XZ
Y
XZ
Y
XZ
Y
XZ
Y
XZ
0 Min
Figure 18 Low-order mode shapes of the solid element model with the surface-bonded method
StatusType statusTime 1
OverconstrainedFarNear
SlidingSticking
10000
5000
000(mm)
Y X
Z
(a) The sparsely distributed bolted joints
StatusType statusTime 1
OverconstrainedFarNear
SlidingSticking
30000
15000
000(mm)
30000000(mm)
Y
XZ
(b) The densely distributed bolted joints
Figure 19 Different contact statuses of different distribution densities of the bolted jointsThe purple key represents that the contact surfacesare overconstrained and some contact constraints need to be removed The yellow key indicates that there is a very small gap between thecontact surfaces
the small fraction of skid under them were concentrated inapproximate annular regions around screw holes as shownin Figure 19(a) The area ratio of the bonded region and thewhole contact region on these bolted interfaces was less than50 However the bonded regions around the screw holeson the interfaces between other parts such as the interfacesbetween cylinders and connection drums overlapped witheach other as shown in Figure 19(b) The area ratio of thebonded region and the whole contact region on these bolt
connected interfaces was more than 80 It was indicatedthat the interfaces between bolted flangeswere not completelybonded and the surface-bonded method will overestimatetheMNFs because the whole interface between bolted flangeswas assumed to be bonded in this method The differenceon contact statuses was mainly caused by the difference onthe distribution density of the bolted joints The area ofthe bonded region increased as the number of bolted jointsbetween bolted flanges increased
Shock and Vibration 11
1 2 3 4 5 6 7Order number
Modal test74 bolted joints8 bolted joints
0
20
40
60
80
100
120
Freq
uenc
y (H
z)
Figure 20 Comparison of MNFs between solid element modelswith different number of bolted joints and experimental results
423 The Key Bolted Joints of the Compressor To study theinfluence of the distribution of bolted joints on the low-ordervibration modes of the compressor and identify key boltedjoints among these 74 bolted joints we removed the boltedjoints between interfaces whose contact status was similarto that shown in Figure 19(b) and set the type of surface-to-surface contact pairs between these interfaces as bondedinstead of frictional This means the pretension forces andcontact behaviours of only 8 bolted joints connected withtwo cylinder supports (groups of (1) (2) (9) and (10) inFigure 1) were included in this model The comparison ofthe low-order MNFs between the solid element model withdifferent numbers of bolted joints and experimental results isshown in Figure 20 It can be seen that the deviation of thelow-order MNFs between the solid element model including8 bolted joints and the modal test ranged from minus52 to57 Compared with the solid element model including 74bolted joints the model including 8 bolted joints kept goodsimulation accuracy but saved 544 of computation time (asshown inTable 1) Consequently these 8 bolted joints sparselydistributed on cylinder supports were key bolted joints of thecompressor
Using the above analyses we can see that the charac-teristics of bolted joints will affect the low-order vibrationmodes of the compressor The sparsely distributed boltedjoints with a small bonded region on the contact surfacewere key bolted joints which had significant impacts on thelow-order vibration modes of the compressor Neverthelessthe characteristics of the densely distributed bolted jointscan be ignored to improve the calculation efficiency Duringnumerical modelling for the assembly containing multiplebolted joints such as the compressor the outer diametersof theoretical bonded regions on the interfaces betweenbolted flanges can be predicted using (2) Then areas ofthe theoretical bonded region and the entire contact surfacecan be calculated Thus the area ratio between them can be
TDCMidpointBDC
1 2 3 4 5 6 7Order number
0
20
40
60
80
100
120
Freq
uenc
y (H
z)
Figure 21 Comparison of MNFs between different positions ofmoving parts
estimated The bolted joints between flanges with an arearatio of less than 80 especially less than 50 might be keybolted joints of the assembly and their characteristics shouldbe considered in the numerical model However the boltedjoints between flanges with an area ratio of more than 80can be ignored and the bolted interfaces between them canbe simplified as bonded contacts Thus computation timecan be saved under the premise of ensuring the calculationaccuracy
43 Effects of Positions of Moving Parts on Vibration Modesof the Compressor Figure 21 shows a comparison of the low-order MNFs between three cases with different positionsof moving parts in the solid element model with the bolt-pretension method It can be seen that the MNFs slightlyincreased in order of TDC midpoint and BDC becausethe overall stiffness of the compressor decreased with theincrease of distance between reciprocating moving parts andthe crankcase However the deviations of the first sevenMNFs among these three cases were less than 10There aretwo main reasons for this First the total reciprocating massof this compressor is 1481 kg which is only 12 of the totalweight of the compressor Second the distance between TDCand BDC is 01m which is only 20 of the total length of thecompressor along the axis of the cylinder It was indicated thatthe positions of moving parts had little impact on vibrationmodes of the compressor
5 Conclusions
The effects of element types bolted joints and positions ofmoving parts on the low-order vibration modes of a recip-rocating compressor were studied by numerical simulationand experimental validation The following conclusions canbe drawn from this study
12 Shock and Vibration
(1) The shell element model was recommended for pre-dicting the low-order vibration modes of assembliessuch as the reciprocating compressor with regard toeffectiveness and usefulness
(2) The sparsely distributed bolted joints with smallbonded regions on the contact surface were the keybolted joints which had greater impacts on the low-order vibration modes of the assembly than thedensely distributed bolted joints
(3) The positions of moving parts had little effect on low-order vibration modes of the reciprocating compres-sor
Conflicts of Interest
The authors declare that there are no conflicts of interestregarding the publication of this paper
Acknowledgments
This work was supported by CNOOC (China NationalOffshore Oil Corporation) under Contract Z5TZENT089
References
[1] X Q Dang and S W Chen Gas Pulsation and Vibration inReciprocating Compressor Piping System Xirsquoan Jiaotong Univer-sity Press Xirsquoan China 1984
[2] AWBenjamin ldquoMechanicalmodeling of compressormanifoldsystemsrdquo httpwwwdocincomp-608370324html 2006
[3] C Harper P Eng and H Wu ldquoOptimized skid design forcompressor packagesrdquo httpwwwbetamachinerycomassetspdfsTechnical ArticlesOptimized Skid Design for Compres-sor Packagespdf 2013
[4] M Passeri R Bagagli and C Maggi ldquoCompressor GeneralArrangement Dynamic Design Guided by Preliminary Cylin-derManifold ForcedResponserdquo inProceedings of theASME2015Pressure Vessels and Piping Conference 10 pages Boston MassUSA 2015
[5] J D Pratt and G Pardoen ldquoNumerical modeling of bolted lapjoint behaviorrdquo Journal of Aerospace Engineering vol 15 no 1pp 20ndash31 2002
[6] H Ahmadian and H Jalali ldquoIdentification of bolted lap jointsparameters in assembled structuresrdquo Mechanical Systems andSignal Processing vol 21 no 2 pp 1041ndash1050 2007
[7] J Kim J-C Yoon and B-S Kang ldquoFinite element analysis andmodeling of structure with bolted jointsrdquoAppliedMathematicalModelling vol 31 no 5 pp 895ndash911 2007
[8] E Guzas K Behan and J Davis ldquo3D finite element modelingof single bolt connections under static and dynamic tensionloadingrdquo Shock and Vibration vol 2015 Article ID 205018 12pages 2015
[9] J G Williams R E Anley D H Nash and T G F GrayldquoAnalysis of externally loaded bolted joints Analytical com-putational and experimental studyrdquo International Journal ofPressure Vessels and Piping vol 86 no 7 pp 420ndash427 2009
[10] A Abidelah A Bouchaır and D E Kerdal ldquoInfluence of theflexural rigidity of the bolt on the behavior of the T-stub steelconnectionrdquo Engineering Structures vol 81 pp 181ndash194 2014
[11] L Gaul and J Becker ldquoDamping prediction of structures withbolted jointsrdquo Shock and Vibration vol 17 pp 359ndash371 2010
[12] K E Behan E L Guzas J R Milburn and S M Moss ldquoFiniteelement modeling of K-Monel bolts under static loading anddynamic shock loadingrdquo Shock and Vibration vol 20 no 3 pp575ndash589 2013
[13] C Hammami E Balmes and M Guskov ldquoNumerical designand test on an assembled structure of a bolted joint with vis-coelastic dampingrdquo Mechanical Systems and Signal Processingvol 70-71 pp 714ndash724 2016
[14] S Qin J Kang and Q Wang ldquoOperational Modal AnalysisBased on Subspace Algorithm with an Improved StabilizationDiagram Methodrdquo Shock and Vibration vol 2016 Article ID7598965 10 pages 2016
[15] F Aras L Krstevska G Altay and L Tashkov ldquoExperimentaland numerical modal analyses of a historical masonry palacerdquoConstruction and Building Materials vol 25 no 1 pp 81ndash912011
[16] D Ribeiro R Calcada R Delgado M Brehm and V ZabelldquoFinite element model updating of a bowstring-arch railwaybridge based on experimental modal parametersrdquo EngineeringStructures vol 40 pp 413ndash435 2012
[17] E Denimal L Nechak J-J Sinou and S Nacivet ldquoKrigingSurrogate Models for Predicting the Complex Eigenvalues ofMechanical Systems Subjected to Friction-Induced VibrationrdquoShock and Vibration vol 2016 22 pages 2016
[18] R S Minette S F SilvaNeto L A Vaz and U A MonteiroldquoExperimental modal analysis of electrical submersible pumpsrdquoOcean Engineering vol 124 pp 168ndash179 2016
[19] M A Shah F Iqbal I A Shah and B Lee ldquoModal Analysisof a Single-Structure Multiaxis MEMS Gyroscoperdquo Journal ofSensors vol 2016 8 pages 2016
[20] Y Ni X Lu and W Lu ldquoOperational modal analysis of ahigh-rise multi-function building with dampers by a BayesianapproachrdquoMechanical Systems and Signal Processing vol 86 pp286ndash307 2017
[21] Gas Machinery Research Council GMRC Guideline for High-Speed Reciprocating Compressor Packages for Natural Gas Trans-mission and Storage Applications ACI Services Inc Ohio USA2013
[22] D X ChenMechanical Design Handbook Chemistry IndustryPublisher Beijing China 2004
[23] X M Wang Y Q Li and H W Xu ANSYS Structural AnalysisElement and Application China Communication Press BeijingChina 2011
RoboticsJournal of
Hindawi Publishing Corporationhttpwwwhindawicom Volume 2014
Hindawi Publishing Corporationhttpwwwhindawicom Volume 2014
Active and Passive Electronic Components
Control Scienceand Engineering
Journal of
Hindawi Publishing Corporationhttpwwwhindawicom Volume 2014
International Journal of
RotatingMachinery
Hindawi Publishing Corporationhttpwwwhindawicom Volume 2014
Hindawi Publishing Corporation httpwwwhindawicom
Journal of
Volume 201
Submit your manuscripts athttpswwwhindawicom
VLSI Design
Hindawi Publishing Corporationhttpwwwhindawicom Volume 201
Hindawi Publishing Corporationhttpwwwhindawicom Volume 2014
Shock and Vibration
Hindawi Publishing Corporationhttpwwwhindawicom Volume 2014
Civil EngineeringAdvances in
Acoustics and VibrationAdvances in
Hindawi Publishing Corporationhttpwwwhindawicom Volume 2014
Hindawi Publishing Corporationhttpwwwhindawicom Volume 2014
Electrical and Computer Engineering
Journal of
Advances inOptoElectronics
Hindawi Publishing Corporation httpwwwhindawicom
Volume 2014
The Scientific World JournalHindawi Publishing Corporation httpwwwhindawicom Volume 2014
SensorsJournal of
Hindawi Publishing Corporationhttpwwwhindawicom Volume 2014
Modelling amp Simulation in EngineeringHindawi Publishing Corporation httpwwwhindawicom Volume 2014
Hindawi Publishing Corporationhttpwwwhindawicom Volume 2014
Chemical EngineeringInternational Journal of Antennas and
Propagation
International Journal of
Hindawi Publishing Corporationhttpwwwhindawicom Volume 2014
Hindawi Publishing Corporationhttpwwwhindawicom Volume 2014
Navigation and Observation
International Journal of
Hindawi Publishing Corporationhttpwwwhindawicom Volume 2014
DistributedSensor Networks
International Journal of
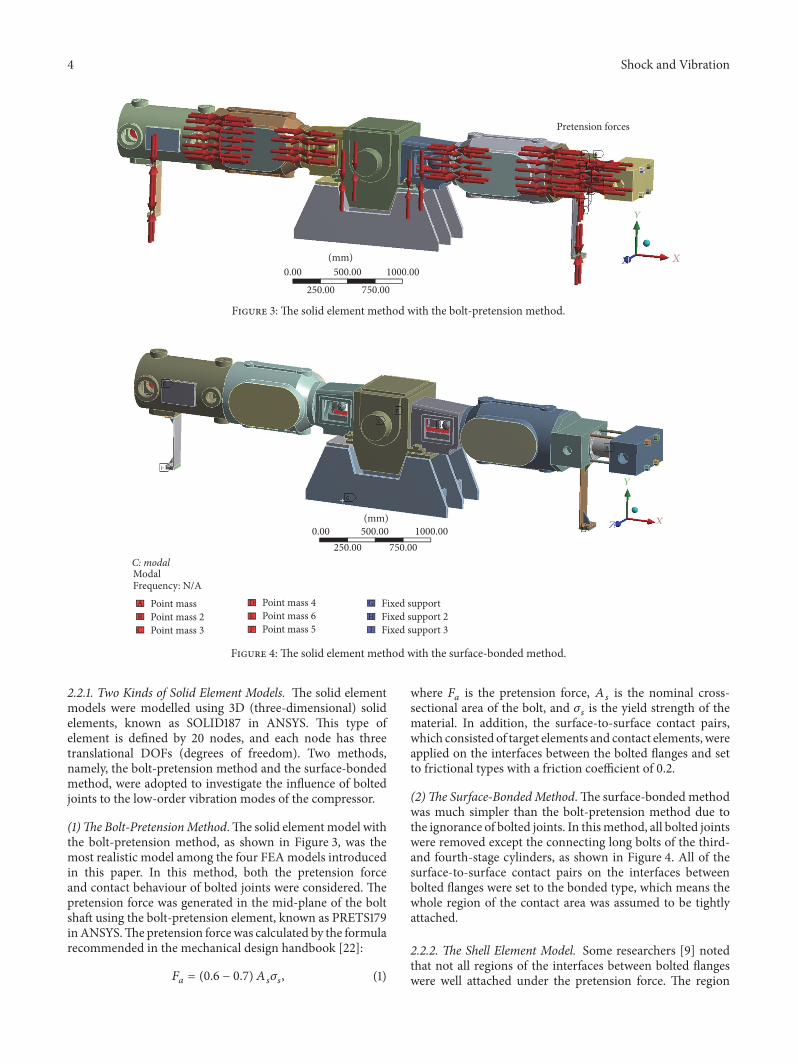