experimental validation of microgrids
TRANSCRIPT

EXPERIMENTAL VALIDATION OF MICROGRIDS: EXPLOITING THE ROLE OF PLUG-IN ELECTRIC
VEHICLES, ACTIVE LOAD CONTROL AND MICRO-GENERATION UNITS
Clara Sofia Teixeira Gouveia (MSc)
Dissertation submitted to the Faculty of Engineering of University of Porto
in partial fulfilment of the requirements for the degree of
Doctor of Philosophy
Supervisor: Prof. Carlos Coelho Leal Monteiro Moreira Assistant Professor at the Department of Electrical and Computer Engineering
Faculty of Engineering, University of Porto
Co-Supervisor: Prof. João Abel Peças Lopes Full Professor at the Department of Electrical and Computer Engineering
Faculty of Engineering, University of Porto
May 2015


3
This work was developed within the framework of the project “Microgrids+EV: Identification of Control and Management Strategies for Microgrids with Plugged-in Electric Vehicles,” PTDC/EEA-EEL/103546/2008-(FCOMP-01-0124-FEDER-009866) funded by the ERDF – European Regional Development Fund through the COMPETE Program (operational program for competitiveness) and by National Funds through the FCT – Fundação para a Ciência e a Tecnologia (Portuguese Foundation for Science and Technology), by the project Red Iberoamericana de Generación distribuida y Microrredes Eléctricas Inteligentes (RIGMEI) funded by the Ibero-American programme for science, technology and development (CYTED) and in the framework of BEST CASE project (“NORTE-07-0124-FEDER-000056”) financed by the North Portugal Regional Operational Programme (ON.2 – O Novo Norte), under the National Strategic Reference Framework (NSRF), through the European Regional Development Fund (ERDF), and by national funds, through the Foundation for Science and Technology (FCT).


Acknowledgments
5
Acknowledgments This thesis is the result of the work that I have been developing at the Centre for Power and Energy Systems at INESC TEC and could not have succeeded without the support of several people. Working at INESC TEC allowed me to evolve professionally and scientifically allowing me to work with highly skilled researchers internationally recognized and have access to unique testing facilities.
First I would like to express my gratitude to my supervisor Prof. Carlos Moreira and co-supervisor Prof. João Peças Lopes for the opportunity of working with them and for challenging me to implement and test the work developed at the Smart Grid and Electric Vehicle Laboratory. The extreme dedication and valuable contributions of Prof. Carlos Moreira were fundamental allowing me to stay focused and have the confidence to overcome the challenges found throughout the work. I would also like to thank Prof. Peças Lopes for his skilled guidance and encouragement bringing alternative points of view to the discussions.
The success of this work was also possible due to the support of the Centre for Power and Energy Systems, headed by Prof. Manuel Matos and Eng. Luís Seca, who allowed me to conciliate my research work with the Centre’s objectives. To my colleagues I would like to thank them for their cooperation in the development of the research work and for their friendship. The support provided by David Rua, Justino Rodrigues and Miguel Miranda was essential for the success of the experimental work developed in the laboratory. I would also like to thank André Madureira, Bernardo Silva, Joel Soares, Luís Seca, Paula Castro and Rute Ferreira for their friendship.
Finally I am grateful for the support of my family and of my fiancé Quim, because without their unconditional love and support I would not be able to come this far.


Abstract
7
Abstract This thesis provides an extended overview on MicroGrid self-healing capabilities and presents the development of innovative control functionalities for MicroGrids, exploiting flexible resources such as electric vehicles, active demand response, microgeneration units, and storage devices. The main objective is to improve the system robustness and resilience following major system disturbances, by taking advantage of the flexibility of MicroGrid resources and smart grid concepts. The proposed control functionalities were validated through numerical simulation and experimentally in a laboratory scale MicroGrid system.
Within the smart grid paradigm, the MicroGrid can be regarded as a highly flexible and controllable low voltage cell, which is able to decentralize the distribution management and control system while providing additional controllability and observability. A network of controllers interconnected by a communication system ensures the management and control of the low voltage MicroGrid, enabling both interconnected and autonomous operation modes. This new distribution operation philosophy is in line with the smart grid paradigm, since it improves the security and reliability of the system, being able to tackle the technical challenges resulting from the large scale integration of microgeneration and provide the adequate framework to fully integrate smart grid new players.
In this thesis, the MicroGrid hierarchical management and control structure is revisited and adapted in order to include advanced metering infrastructures and exploit the flexibility of the electric vehicles and flexible loads. These new actors of the system are regarded as active resources of the MicroGrid, incorporating grid supporting functionalities in order to improve the stability of the MicroGrid when operating autonomously or when restoring service locally. At the same time, new strategies are also presented to mitigate the voltage unbalance problem affecting three-phase four-wire low voltage systems, which can be aggravated by the connection of single-phase microgeneration and electric vehicles. The effectiveness of the new MicroGrid emergency control functionalities was assessed through simulation, using a dynamic simulation tool representing the MicroGrid as a three-phase four-wire system and incorporating the dynamic models of all MicroGrid resources.
The industrial development of smart grid related products and technologies are growing, enhancing the importance of experimental demonstrations which take into consideration real world conditions. Following the European Union commission recommendations, the Smart Grid and Electric Vehicle Laboratory facilities at INESC TEC was exploited for the development and proof of concept of the proposed control solutions. The implementation of the MicroGrid control architecture including the proposed control strategies and the tests performed for validating the MicroGrid self-healing capabilities in a laboratory scale MicroGrid are presented.


Resumo
9
Resumo Nesta tese são apresentadas um conjunto de funcionalidades avançadas de controlo e gestão de Micro-redes, destinadas à operação em modo de emergência, nomeadamente durante a operação em ilha e na sequência da implementação do procedimento local de reposição de serviço. As estratégias de controlo apresentadas exploram a flexibilidade das cargas e dos veículos elétricos que se encontram ligados à rede de distribuição de baixa tensão, integrando--os como elementos ativos na operação da Micro-rede, particularmente quando isolada da rede a montante. O principal objetivo reside no aumento da robustez da Micro-rede após a ocorrência de perturbações na rede de distribuição que conduzem à operação em modo de emergência.
A Micro-rede é um sistema de baixa tensão controlável e flexível, que quando integrado no paradigma das redes inteligentes descentraliza o sistema de gestão da rede de distribuição, estendendo a sua capacidade de controlo e monitorização até às instalações dos clientes de baixa tensão. Uma rede de controladores inteligentes, suportada por um sistema de comunicação avançado, constitui o sistema de controlo e gestão da Micro-rede. Este coordena os recursos locais para que a Micro-rede possa operar em ilha, ou repor o serviço localmente em caso de falha generalizada do sistema. A arquitetura descentralizada da Micro-rede é a mais adequada para acomodar os novos recursos ligados à rede de baixa tensão, nomeadamente os veículos elétricos. A sua estrutura de controlo promove uma gestão ativa dos recursos disponíveis, com o objetivo de evitar ou corrigir situações de violação técnica e simultaneamente explorar a flexibilidade dos mesmos para aumentar a estabilidade de operação da Micro-rede em modo de emergência. A integração dos veículos elétricos nas redes de distribuição surge assim como parte da solução. Quando ligados à rede, estes podem funcionar como pequenas unidades de armazenamento ou como cargas flexíveis. Em conjunto com estratégias de gestão de cargas, os veículos elétricos poderão proporcionar funcionalidades de suporte à regulação de frequência durante a operação em modo isolado.
Adicionalmente são apresentadas novas estratégias para reduzir o problema de desequilíbrio de tensão, característico das redes de baixa tensão. Este problema pode ser agravado pela integração em larga escala de elementos monofásicos, como as unidades de microgeração e os veículos elétricos. As estratégias propostas foram desenvolvidas, testadas e validades em ambiente de simulação dinâmica. A plataforma de simulação desenvolvida representa a natureza desequilibrada do sistema e inclui os modelos dinâmicos do veículo elétrico e dos mecanismos de balanceamento de tensão propostos.
Os conceitos relativos às condições de operação de Micro-redes, no que diz respeito ao controlo de frequência, foram implementados no laboratório de Redes Inteligentes e Veículos Elétricos do INESC TEC. A arquitetura de controlo e de gestão da Micro-rede, incluindo as funcionalidades propostas foram implementadas através de módulos de software. A especificação e implementação dos controladores são apresentadas nesta tese, assim como os resultados mais relevantes dos testes experimentais realizados para a validação da operação da Micro-rede em modo de emergência.


Table of Contents
11
Table of Contents Acknowledgments .............................................................................................................. 5
Abstract .............................................................................................................................. 7
Resumo .............................................................................................................................. 9
List of Figures .................................................................................................................... 17
List of Tables ..................................................................................................................... 23
List of Acronyms and Abbreviations................................................................................... 25
– Introduction ................................................................................................... 29 Chapter 1
1.1 Motivation for the Thesis ................................................................................................. 29
1.2 Objectives of the Thesis .................................................................................................... 37
1.3 Contribution of the Thesis ................................................................................................ 38
1.3.1 Publications ............................................................................................................... 39
1.4 Outline of the Thesis ......................................................................................................... 40
– State-of-the-Art .............................................................................................. 43 Chapter 2
2.1 Introduction ...................................................................................................................... 43
2.2 MicroGrid Concept: A Review ........................................................................................... 45
2.2.1 MicroGrid Distributed Energy Resources .................................................................. 49
2.2.2 Power Electronic Interfaces....................................................................................... 51
2.2.3 MicroGrid Management and Control Architecture ................................................... 52
2.2.4 MicroGrid Power Quality ........................................................................................... 59
2.3 Integrating Electric Vehicles in Power System Operation ................................................ 67
2.3.1 Plug-in Electric Vehicles Technology ......................................................................... 70
2.3.2 Electric Vehicles Charging Infrastructures ................................................................. 71
2.3.3 Electric Vehicles Grid Interactions ............................................................................. 73
2.3.4 Electric Vehicles Charging Strategies and Grid Supporting Functionalities .............. 76
2.3.5 MicroGrid Operation with Electric Vehicles .............................................................. 80

Table of Contents
12
2.4 Development of Active Demand Response Strategies ..................................................... 81
2.4.1 Integrating Low Voltage Consumers in the Operation of the System ....................... 83
2.4.2 Active Demand Response Strategies for MicroGrid operation ................................. 86
2.5 MicroGrid Demonstration Projects and Pilot Sites ........................................................... 90
2.5.1 CERTS/AEP MG Test Site ............................................................................................ 90
2.5.2 MICROGRIDS and MORE MICROGRIDS ...................................................................... 92
2.5.3 Asia MicroGrid Laboratories and Pilot sites .............................................................. 96
2.5.4 Smart Grid Laboratories and Pilot sites ..................................................................... 96
2.5.5 Smart Grid and Electric Vehicle Laboratory ............................................................. 100
2.6 Summary and Main Conclusions ..................................................................................... 106
– MicroGrid Control Solutions for Emergency Operation ................................... 109 Chapter 3
3.1 Introduction .................................................................................................................... 109
3.2 MicroGrid Hierarchical Control for Emergency Operation ............................................. 112
3.3 Primary Voltage and Frequency Regulation ................................................................... 114
3.3.1 Example 1 - MicroGrid Frequency Regulation with Single-master and Multi-master Operation Modes .............................................................................................................. 115
3.4 Electric Vehicles Contribution to Primary Frequency Support ....................................... 117
3.4.1 Example 2 – Electric Vehicles Frequency Supporting Strategies ............................. 118
3.5 Secondary Load-Frequency Control ................................................................................ 119
3.5.1 Local Secondary Frequency Control ........................................................................ 119
3.5.2 Centralized Secondary Frequency Control .............................................................. 120
3.5.3 Example 3 – MicroGrid Secondary Frequency Control ............................................ 122
3.6 Load Control Strategies for MicroGrid Emergency Operation ........................................ 123
3.6.1 Example 4 – MicroGrid Emergency Load Control Strategy ..................................... 126
3.7 Managing the MicroGrid Energy Balance Following Islanding ....................................... 127
3.7.1 Load and Electric Vehicles Emergency Scheduling Algorithm ................................. 128
3.7.2 MicroGrid Online Balancing Tool ............................................................................. 135
3.8 MicroGrid Restoration Procedure Integrating Electric Vehicles ..................................... 137

Table of Contents
13
3.8.1 Participation of Electric Vehicles in the MicroGrid Restoration Procedure ............ 138
3.8.2 MicroGrid Service Restoration Procedure............................................................... 138
3.9 MicroGrid Unbalanced Operation .................................................................................. 140
3.10 Summary and Main Conclusions .................................................................................. 141
– Dynamic Models for Three-phase Four-Wire Unbalanced MicroGrids .............. 143 Chapter 4
4.1 Introduction .................................................................................................................... 143
4.2 Power Measurements under Unbalanced Conditions ................................................... 147
4.2.1 Power in Single-phase and Three-phase Balanced Systems ................................... 147
4.2.2 Single-phase and Three-phase Power in Unbalanced System ................................ 148
4.3 Medium Voltage Network Model ................................................................................... 153
4.4 Low Voltage Feeders Model ........................................................................................... 153
4.5 MicroGrid Loads Dynamic Model ................................................................................... 154
4.6 Controllable MicroSources ............................................................................................. 155
4.6.1 Single-shaft Microturbine Dynamic Model ............................................................. 155
4.6.2 Fuel Cell Dynamic Model ......................................................................................... 158
4.7 Non-controllable MicroSources ...................................................................................... 163
4.8 Energy Storage Devices ................................................................................................... 164
4.8.1 MicroGrid Stationary Storage .................................................................................. 165
4.8.2 Controllable MicroSources with DC Storage ........................................................... 166
4.8.3 Energy Storage for Electric Vehicles ........................................................................ 167
4.9 DC-Link Model ................................................................................................................. 168
4.10 PQ Inverters .................................................................................................................. 168
4.10.1 Single-phase PQ Inverter ....................................................................................... 169
4.10.2 Three-phase PQ inverter ....................................................................................... 170
4.11 Voltage Source Inverter ................................................................................................ 171
4.11.1 Voltage Source Inverter with Voltage Balancing Control Mechanism .................. 172
4.12 Simulation platform ...................................................................................................... 176

Table of Contents
14
4.13 Summary and Main Conclusions ................................................................................... 179
– MicroGrid Emergency Control Solutions: Simulation Results .......................... 181 Chapter 5
5.1 Introduction .................................................................................................................... 181
5.2 MicroGrid Test Systems .................................................................................................. 182
5.2.1 MicroGrid Urban Network ....................................................................................... 183
5.2.2 MicroGrid Rural Network ........................................................................................ 186
5.3 Islanding Operation ......................................................................................................... 188
5.3.1 MicroGrid Islanded Operation with Electric Vehicles .............................................. 189
5.3.2 Active Coordination of Electric Vehicles and Active loads ...................................... 195
5.4 MicroGrid Service Restoration Procedure with Electric Vehicles ................................... 206
5.4.1 Synchronization of the Single-shaft Microturbine to the MicroGrid ....................... 207
5.5 Analysing MicroGrid Voltage Unbalance Problem .......................................................... 212
5.5.1 Voltage Balancing in Single-Master Operation Mode ............................................. 213
5.5.2 Voltage Balancing in Multi-Master Operation Mode .............................................. 222
5.5.3 Voltage Unbalance Analysis in Multi-Master Operation Mode with a High Share of Single-phase MicroSources ............................................................................................... 228
5.6 Summary and Main Conclusions ..................................................................................... 232
– Experimental Validation of MicroGrid Emergency Operation .......................... 235 Chapter 6
6.1 Introduction .................................................................................................................... 235
6.2 Implementation of the MicroGrid Hierarchical Control ................................................. 236
6.2.1 Local Controllers ...................................................................................................... 236
6.2.2 Centralized Control .................................................................................................. 248
6.3 Experimental Tests .......................................................................................................... 252
6.3.1 Experiment 1 – MicroGrid Islanding Operation ....................................................... 253
6.3.2 MicroGrid Energy Balance Management................................................................. 262
6.3.3 MicroGrid Service Restoration with Electric Vehicles ............................................. 269
6.4 Summary and Main Conclusions ..................................................................................... 273
– Conclusions ................................................................................................... 277 Chapter 7

Table of Contents
15
7.1 Main Contributions of the Thesis ................................................................................... 277
7.2 Future Perspectives ........................................................................................................ 280
References ....................................................................................................................... 283
Appendix A – Characterization of MicroGrid Urban Network Test System .......................... 295
Appendix B – Characterization of MicroGrid Rural Network Test System ........................... 301
Appendix C – Characterization of MicroGrid Model Parameters ........................................ 305


List of Figures
17
List of Figures Figure 1.1. Driving factors for Smart Grid development (adapted from [2]). ............................. 30 Figure 1.2. EU conceptual model for the SG (adapted from [18]). ............................................. 31 Figure 2.1. CERTS MG architecture [32]. ..................................................................................... 46 Figure 2.2. MG architecture based on European project MICROGRIDS [35]. ............................. 48 Figure 2.3. Interaction model between the MG controllers, DMS and market operators. ........ 53 Figure 2.4. ENTSO-E control scheme and actions starting with the system frequency [75]. ..... 56 Figure 2.5. Simplified circuit of LV feeder. .................................................................................. 60 Figure 2.6. Converter configurations for power quality enhancement of MG: a) series-shunt b) shunt and c) series-shunt for interfacing MG with the upstream grid (adapted from [105]). ... 66 Figure 2.7. Three-phase four-wire MG power quality compensator (adapted from [106]). ...... 66 Figure 2.8. Simplified diagram of a EV battery charging system. ............................................... 71 Figure 2.9. EV charging infrastructure components (adapted from [119]). ............................... 71 Figure 2.10. Interaction of EV with distinct stakeholders (adapted from [128]). ....................... 74 Figure 2.11. MERGE technical and market operation framework for the integration of EV in power systems [15], [26]. ........................................................................................................... 75 Figure 2.12. Frequency deviation and activation of reserves according to ENTSO-E [75]. ......... 78 Figure 2.13. MG architecture integrating EV [134]. .................................................................... 80 Figure 2.14. DR categories (adapted from [138]). ...................................................................... 82 Figure 2.15. ADDRESS conceptual architecture [23]. .................................................................. 84 Figure 2.16. Energy Box interaction with household and external actors (adapted from [141]). ..................................................................................................................................................... 85 Figure 2.17. Dynamic control of refrigerator [150]. .................................................................... 87 Figure 2.18. Implementation scheme of the smart metering load control (adapted from [153]). ..................................................................................................................................................... 88 Figure 2.19. CERTS/AEP MG test facility: a) test site and b) schematic of facility. ..................... 91 Figure 2.20. DeMoTec SCADA and MG control system architecture [53]. ................................. 92 Figure 2.21. DeMoTec MG test system used in MICROGRIDS project [53]. ............................... 93 Figure 2.22. NTUA laboratory scale MG: a) schematic and b) laboratory overview [53]. .......... 94 Figure 2.23. University of Manchester MG schematic [55]. ....................................................... 94 Figure 2.24. ARMINES MG system [53]. ...................................................................................... 95 Figure 2.25. InovGrid reference architecture. ............................................................................ 98 Figure 2.26. Architecture of NiceGrid MG pilot [163]. .............................................................. 100 Figure 2.27. Laboratory RES and commercial inverters: a) four quadrant inverter, b) 2kW SMA solar inverter, c) micro-WT emulator and d) PV panels............................................................ 102 Figure 2.28. Laboratory storage and grid forming units: a) SMA Sunny Island 5048® battery inverter and b) FLA battery bank. ............................................................................................. 102 Figure 2.29. Commercial EVs: a) Renault Twizzy® and b) Renault Fluenze®. ............................ 102 Figure 2.30. Single line diagram of the SGEVL. ......................................................................... 103 Figure 2.31. SG laboratorial architecture. ................................................................................. 104 Figure 2.32. EV bidirectional charger prototype [170]. ............................................................ 105 Figure 3.1. Smart distribution network architecture based on MG concept. ........................... 110 Figure 3.2. MG hierarchical control for emergency operation (adapted from [42]). ............... 112

List of Figures
18
Figure 3.3. VSI droop characteristics: a) active power – frequency and b) reactive power – voltage droop. ........................................................................................................................... 114 Figure 3.4. SMO strategy: MG frequency and active power injected by storage unit. ............. 116 Figure 3.5. MMO strategy: MG frequency and active power injected by the two storage units (VSI 1 and VSI 2). ....................................................................................................................... 116 Figure 3.6. EV f-P droop characteristic. ..................................................................................... 117 Figure 3.7. MG islanding with EV control: MG frequency (left vertical axis) and VSI active power response (right vertical axis). .................................................................................................... 118 Figure 3.8. MG frequency (left vertical axis) and EV active power response (right vertical axis). ................................................................................................................................................... 118 Figure 3.9. Local secondary frequency control for: a) PQ control and VSI control. .................. 120 Figure 3.10. Centralized secondary control algorithm. ............................................................. 121 Figure 3.11. MG frequency response considering: only primary regulation (Base Case), primary and secondary control and the EV f-P droop. ........................................................................... 122 Figure 3.12. VSI active power response considering: only primary regulation (Base Case), primary and secondary control and the EV f-P droop. .............................................................. 122 Figure 3.13. Active power injected by controllable MS. ........................................................... 123 Figure 3.14. Emergency load control architecture. ................................................................... 125 Figure 3.15. MG frequency response with EV and emergency load control. ........................... 126 Figure 3.16. VSI active power output with EV and emergency load control. ........................... 127 Figure 3.17. MG load and EV emergency scheduling algorithm. .............................................. 129 Figure 3.18. Aggregated load availability for the next time period. ......................................... 131 Figure 3.19. MG simplified dynamic model to run at the MGCC. ............................................. 134 Figure 3.20. MG islanded operation algorithm. ........................................................................ 136 Figure 3.21. EV control and interaction with the MGCC for the MG service restoration. ........ 138 Figure 4.1. LV three-phase four-wire feeder representation. ................................................... 144 Figure 4.2. General block diagram of MG resources’ dynamic model (adapted from [63]). .... 145 Figure 4.3. Overview of time domain reference frame transformations [177]. ....................... 146 Figure 4.4. Physical meaning of instantaneous powers according to p-q theory [179]. ........... 150 Figure 4.5. Three-phase instantaneous power calculation: a) active power and b) reactive power. ....................................................................................................................................... 151 Figure 4.6. Block diagram of single-phase active and reactive power measurement [181]. .... 152 Figure 4.7. MV network equivalent model. ............................................................................... 153 Figure 4.8. Three-phase four-wire line model. .......................................................................... 154 Figure 4.9. Basic configuration of a SSMT. ................................................................................ 155 Figure 4.10. Dynamic Model of SSMT Engine [176], [183]. ....................................................... 156 Figure 4.11. Active Power Control of Controllable MS. ............................................................ 156 Figure 4.12. General structure of the input-side controller of the SSMT [176], [184].............. 157 Figure 4.13. SSMT active power step response. ....................................................................... 158 Figure 4.14. Basic configuration of a SOFC. ............................................................................... 159 Figure 4.15. Fuel Cell working principle diagram [187]. ............................................................ 159 Figure 4.16. Dynamic model of SOFC [176]. .............................................................................. 161 Figure 4.17. Active power step response of a SOFC. ................................................................. 162 Figure 4.18. Basic configuration of the micro-WT system. ....................................................... 163 Figure 4.19. Basic configuration of the solar PV system. .......................................................... 163

List of Figures
19
Figure 4.20. General block diagram of non-controllable single-phase MS. .............................. 164 Figure 4.21. General configuration of MG storage technologies: a) flywheel and b) battery. . 165 Figure 4.22. Storage dynamic model. ....................................................................................... 166 Figure 4.23. SSMT system with DC storage. .............................................................................. 167 Figure 4.24. Block diagram of EV charger power set-point definition (adapted from [15], [133]). ................................................................................................................................................... 167 Figure 4.25. DC-link dynamic model. ........................................................................................ 168 Figure 4.26. Single-phase grid coupling inverter PQ control. ................................................... 169 Figure 4.27. Three-phase grid coupling inverter PQ control..................................................... 170 Figure 4.28. Equivalent circuit of the VSI. ................................................................................. 171 Figure 4.29.Three-phase balanced VSI control model [176]..................................................... 172 Figure 4.30. VSI voltage control scheme with voltage balancing mechanism. ......................... 172 Figure 4.31. Four-leg inverter model. ....................................................................................... 173 Figure 4.32. Voltage Balancing mechanism with compensation of positive, negative and zero sequence voltage components. ................................................................................................ 174 Figure 4.33. Equivalent representation of synchronous PI and PR controllers, for positive and negative sequence control [194]. ............................................................................................. 175 Figure 4.34. MG simulation platform in MATLAB®/Simulink® environment. ........................... 177 Figure 4.35. Storage and VSI model implemented in MATLAB®/Simulink® environment. ....... 177 Figure 4.36. User interface for editing the storage and VSI model parameters. ...................... 178 Figure 4.37. EV model implemented in MATLAB®/Simulink® environment. ............................ 178 Figure 5.1. Single-line diagram of the Urban Network 1. ......................................................... 183 Figure 5.2. MG topology for Urban Network 1. ........................................................................ 185 Figure 5.3. MG topology for Urban Network 2. ........................................................................ 186 Figure 5.4. MG topology of the Rural Network. ........................................................................ 188 Figure 5.5. MG frequency response after islanding. ................................................................. 190 Figure 5.6. Power absorbed/injected by EV. ............................................................................. 190 Figure 5.7. SSMT power response for Base case (without EV control through f-P droop) and Case 1. ....................................................................................................................................... 191 Figure 5.8. MG frequency response after the islanding (with the same amount of load disconnection). .......................................................................................................................... 192 Figure 5.9. Total power injected by the main storage unit (with the same amount of load disconnection). .......................................................................................................................... 192 Figure 5.10. SSMT power output with EV participation in MG frequency regulation (Case 1). 193 Figure 5.11. Voltage unbalance factors during MG islanded operation: a) negative sequence and b) zero sequence. ............................................................................................................... 194 Figure 5.12. VSI phase voltages during islanding. ..................................................................... 194 Figure 5.13. Active power injected by the main storage unit per phase. ................................. 195 Figure 5.14. Scenario I – MG frequency without load control. ................................................. 198 Figure 5.15. Scenario I – Storage SOC without load control. .................................................... 198 Figure 5.16. Scenario I – MG frequency with load control. ...................................................... 199 Figure 5.17. Scenario I – Active power response of storage unit with load control ................. 199 Figure 5.18. Scenario I – Storage SOC with load control........................................................... 200 Figure 5.19. MG frequency after the islanding for Case 1 with the simplified and full MG model. ................................................................................................................................................... 200

List of Figures
20
Figure 5.20. Storage unit active power for Case 1 with the simplified and full MG model. ..... 201 Figure 5.21. Scenario II – MG frequency for Base case and cases 1 and 2. .............................. 202 Figure 5.22. Scenario II – Storage SOC for Base case and cases 1 and 2. .................................. 202 Figure 5.23. Scenario II – MG frequency considering load control. .......................................... 203 Figure 5.24. Scenario II – Storage SOC considering load control. ............................................. 203 Figure 5.25. Scenario III – Non-controllable MS disturbance during islanded operation. ........ 204 Figure 5.26. Scenario III – Controllable loads response during islanded operation. ................. 205 Figure 5.27. Scenario III – Controllable generation response to secondary frequency control. ................................................................................................................................................... 205 Figure 5.28. Scenario III – MG frequency considering load control during islanded operation. ................................................................................................................................................... 205 Figure 5.29. Scenario III – Storage SOC considering load control during islanded operation. .. 206 Figure 5.30. Synchronization of the SSMTs with the MG: a) MG and SSMT frequency b) main storage unit and SSMT active power. ........................................................................................ 208 Figure 5.31. MG frequency response during system rebuilding. .............................................. 209 Figure 5.32. Active power injected by the MG main storage unit. ........................................... 209 Figure 5.33. EV individual and total power output during MG rebuilding. ............................... 210 Figure 5.34. SSMT active power response to the centralized secondary frequency control. ... 210 Figure 5.35. Phase voltages in Node 5 during restoration procedure. ..................................... 211 Figure 5.36. Phase voltages in Node 73 during restoration procedure. ................................... 211 Figure 5.37. Voltage unbalance factors in Node 73 during restoration procedure. ................. 212 Figure 5.38. Scenario I - Negative sequence VUF in the MG nodes without (Base case) and with (Case 1) the voltage balancing mechanism. .............................................................................. 215 Figure 5.39. Scenario I - Zero sequence VUF in the MG nodes without (Base case) and with (Case 1) the voltage balancing mechanisms. ............................................................................ 215 Figure 5.40. Scenario I - Negative and zero sequence VUF in Node 1: a) without voltage balancing mechanism and b) with voltage balancing mechanism. ........................................... 216 Figure 5.41. Scenario I - Time evolution of single-phase RMS voltages in Node 1: a) without voltage balancing mechanism and b) with voltage balancing mechanism. .............................. 217 Figure 5.42. Scenario I – Single-phase RMS voltages in the MG nodes during interconnected operation without (Base case) and with (Case 1) the voltage balancing mechanisms. ............ 217 Figure 5.43. Scenario I – Single-phase RMS voltages in the MG nodes during islanded operation without (Base case) and with (Case 1) the voltage balancing mechanisms. ............................. 218 Figure 5.44. Scenario II - Negative sequence VUF in the MG nodes with and without the voltage balancing mechanism. ............................................................................................................... 219 Figure 5.45. Scenario II - Zero sequence VUF in the MG nodes with and without the voltage balancing mechanism. ............................................................................................................... 219 Figure 5.46. Scenario II - Negative and zero sequence VUF in Node 1: a) without voltage balancing mechanism and b) with voltage balancing mechanism. ........................................... 220 Figure 5.47. Scenario II – Single-phase RMS voltages in the MG nodes during interconnected operation without (Base case) and with (Case 1) the voltage balancing mechanisms. ............ 221 Figure 5.48. Scenario II – Single-phase RMS voltages in the MG nodes during islanded operation without (Base case) and with (Case 1) the voltage balancing mechanisms. ............ 221 Figure 5.49. Scenario II - Time evolution of the single-phase RMS voltages at Node 36: a) without voltage balancing mechanisms and b) with voltage balancing mechanisms. ............. 222

List of Figures
21
Figure 5.50. Scenario II - Negative Sequence VUF in the rural MG nodes for cases 1 to 5. ..... 224 Figure 5.51. Scenario II - Negative Sequence VUF in the rural MG nodes for cases 1 to 5. ..... 225 Figure 5.52. Scenario II - Phase A RMS voltages in interconnected mode for cases 1 to 5. ..... 225 Figure 5.53. Scenario II - Phase B RMS voltages in islanded mode for cases 1 to 5. ................ 225 Figure 5.54. Scenario II - Phase C RMS voltages in islanded mode for cases 1 to 5. ................ 226 Figure 5.55. Scenario II in MMO operation - Negative sequence VUF in the rural MG nodes for cases 3 to 8. ............................................................................................................................... 227 Figure 5.56. Scenario II in MMO operation - Zero sequence VUF in the rural MG nodes for cases 3 to 8. ........................................................................................................................................ 227 Figure 5.57. Scenario II in MMO operation - Phase A RMS voltages in the MG nodes for cases 3 to 8. ........................................................................................................................................... 227 Figure 5.58. Scenario II in MMO operation - Phase B RMS voltages in the MG nodes for cases 3 to 8. ........................................................................................................................................... 228 Figure 5.59. Scenario II in MMO operation - Phase C RMS voltages in the MG nodes for cases 3 to 8. ........................................................................................................................................... 228 Figure 5.60. Scenario III – Negative sequence VUF in the MG nodes for cases 1, 5 and 8. ...... 230 Figure 5.61. Scenario III – Zero sequence VUF in the MG nodes for cases 1, 5 and 8. ............. 230 Figure 5.62. Scenario III – Phase A RMS voltages in the MG nodes during interconnected operation for cases 1, 5 and 8. .................................................................................................. 230 Figure 5.63. Scenario III – Phase B RMS voltages determined in the MG nodes during interconnected operation for cases 1, 5 and 8. ........................................................................ 231 Figure 5.64. Scenario III – Phase C RMS voltages determined for the MG nodes during interconnected operation. ........................................................................................................ 231 Figure 5.65. Scenario III – Phase B RMS voltages determined for the MG nodes during islanded operation for cases 1, 5 and 8. .................................................................................................. 231 Figure 6.1. SMA Sunny Island 5048® simplified connection scheme. ....................................... 237 Figure 6.2. General architecture of the single-phase inverter prototypes for: a) solar inverter [171] and b) micro-wind turbine inverter [172]. ...................................................................... 239 Figure 6.3. Micro-WT controller user interface. ....................................................................... 240 Figure 6.4. MS active power/voltage droop control strategy. ................................................. 241 Figure 6.5. 4PQ control architecture. ........................................................................................ 242 Figure 6.6. 4PQ user interface. ................................................................................................. 243 Figure 6.7. Comparison of the SSMT active power response for dynamic model (SSMT model) and the 4PQ. ............................................................................................................................. 243 Figure 6.8. Architecture of the EV bidirectional charger prototype [170]. ............................... 244 Figure 6.9. EV bidirectional controller graphic user interface. ................................................. 244 Figure 6.10. EV active power – voltage droop control. ............................................................. 245 Figure 6.11. Laboratory setup for CL1 and CL2 control. ........................................................... 246 Figure 6.12. SMA Smart Load 6000 –Active power output vs. reference DC voltage input. .... 246 Figure 6.13. SM user interface: a) Household real-time data, user preferences for b) household appliances and c) EV charging. .................................................................................................. 247 Figure 6.14. Architecture of MGCC prototype and interface with the laboratory control and supervision and MG lower control levels.................................................................................. 248 Figure 6.15. Laboratory implementation of secondary frequency control. ............................. 250 Figure 6.16. Architecture of the MG energy balance algorithms implemented at MGCC. ...... 251

List of Figures
22
Figure 6.17. Experiment 1‒MG test system for MG islanded operation. ................................. 254 Figure 6.18. Experiment 1‒MG frequency a) and EV active power response b) during islanding transient. ................................................................................................................................... 256 Figure 6.19. Experiment 1‒MG load following capability: a) MG frequency and b) EV active power response. ........................................................................................................................ 257 Figure 6.20. Experiment 1‒MG voltage during islanding test in: a) node 2 and b) node 4. ..... 258 Figure 6.21. Experiment 1 ‒ Active power response of the SMA Sunny Island 5048® and 4PQ to secondary frequency control. ................................................................................................... 259 Figure 6.22. Experiment 1 ‒ Active power injected by the SMA Sunny Island 5048® with and without secondary frequency control. ...................................................................................... 260 Figure 6.23. Experiment 1 ‒ MG frequency with secondary frequency control and SSMT emulation. ................................................................................................................................. 261 Figure 6.24. Experiment 1 ‒ Active power response of VSI and 4PQ emulating a SSMT. ......... 262 Figure 6.25. Experiment 2 ‒ Test system for MG islanding with emergency load control. ...... 262 Figure 6.26. Experiment 2 ‒ MG estimated frequency (simplified MG model) for scenario 1. 264 Figure 6.27. Experiment 2 ‒ MG frequency obtained from experimental test of scenario 1. .. 265 Figure 6.28. Experiment 2 ‒ VSI active power, SSMT power output and total load (including EV) after islanding in scenario 1. ..................................................................................................... 265 Figure 6.29. Experiment 2 ‒ Comparison between MG frequency for scenario 2 obtained experimentally and through simulation results. ....................................................................... 266 Figure 6.30. Experiment 2 ‒ MG power balancing in scenario 2: VSI active power, SSMT power output, renewable based generation and total load (including EV). ........................................ 267 Figure 6.31. Active power response of MG resources for scenario 3. ...................................... 268 Figure 6.32. MG test system for the MG restoration procedure. ............................................. 270 Figure 6.33. Experiment 3 ‒ Active power of MG resources during MG restoration procedure: a) in Node 3 and b) in Node 4. ................................................................................................... 271 Figure 6.34. Experiment 3 ‒ MG restoration procedure with and without f-P droop control: a) frequency response and b) EV active power. ............................................................................ 272 Figure 6.35. Experiment 3 ‒ MG voltages during the MG service restoration test in a) Node 3 and b) Node 4. ........................................................................................................................... 273

List of Tables
23
List of Tables Table 2.1. MG business and ownership models (adapted from [28], [38]). ............................... 49 Table 2.2. Storage technology comparison (adapted from [57], [62]). ...................................... 50 Table 2.3. Power electronic interfaces of MG DER. .................................................................... 51 Table 2.4. EV typical charging levels according to IEC61851-1 [126]. ......................................... 73 Table 2.5. Comparison of EV charging plug defined in IEC 62196-2 [126], [127]. ...................... 73 Table 2.6. EV interaction with different stakeholders (adapted from [120]). ............................ 74 Table 2.7. Load aggregation according to maximum off time (adapted from [153]). ................ 88 Table 3.1. Load group characterization. ................................................................................... 125 Table 3.2. Data collected at the MGCC for MG operating state characterization. ................... 130 Table 5.1. EV f-P droop parameters. ......................................................................................... 182 Table 5.2. Load shedding parameters for Urban Network 1. ................................................... 183 Table 5.3. Summary of MG scenario for Urban Network 1. ..................................................... 184 Table 5.4. Summary of MG scenario for Urban Network 2. ..................................................... 184 Table 5.5. MG scenario for Rural Network. .............................................................................. 187 Table 5.6. MG scenario for Urban Network 1 – Initial operating conditions. ........................... 189 Table 5.7. Aggregated load availability. .................................................................................... 196 Table 5.8. MG scenario for Urban Network 2 – Scenario I initial operating conditions. .......... 197 Table 5.9. Rural MG - Scenario I. ............................................................................................... 213 Table 5.10. Rural MG - Scenario II. ............................................................................................ 213 Table 5.11. Rural MG – Scenario III. .......................................................................................... 213 Table 5.12. MG rural scenario I - Power unbalance between phases prior and after islanding. ................................................................................................................................................... 214 Table 5.13. MG rural scenario II - Power unbalance between phases prior and after islanding. ................................................................................................................................................... 218 Table 5.14. Simulation cases considering a SMO and a MMO strategy. .................................. 223 Table 6.1. SMA Sunny Island 5048® technical data and parameters. ....................................... 238 Table 6.2. Active power consumption of CL1 and CL2. ............................................................. 245 Table 6.3. EV prototype f-P droop parameters. ........................................................................ 255 Table 6.4. MG scenario 1 – Initial operating conditions. .......................................................... 263 Table 6.5. MG scenario 2 – Initial operating conditions. .......................................................... 266 Table 6.6. MG scenario 3 – Initial operating conditions. .......................................................... 268 Table A.1. General network characteristics. ............................................................................. 295 Table A.2. Urban Network 1 LV feeder impedances. ................................................................ 296 Table A.3. MG Urban Network 1 Load per node. ................................................................... 297 Table A.4. MG Urban Network 1 MG Simulation Scenario. ................................................... 298 Table A.5. Parameters of local secondary frequency control. .................................................. 298 Table A.6. MG Urban Network 2 LV feeder impedances. ...................................................... 299 Table A.7. MG Urban Network 2 Load per node for the MG service restoration. ................. 299 Table A.8. MG Urban Network 2 Simulation Scenario for the MG service restoration. ........ 300 Table B.1. General network characteristics. ............................................................................. 301 Table B.2. Rural Network LV feeder characteristics. .............................................................. 301 Table B.3. Rural Network LV feeder impedances. .................................................................. 302

Acronyms and Abbreviations
24
Table B.4. Rural Network Scenario I peak load per node. ...................................................... 302 Table B.5. Rural Network Scenario I microgeneration and EV active power per node. ......... 303 Table B.6. Rural Network Scenario II load per node. ............................................................. 303 Table B.7. Rural Network Scenario II microgeneration and active power per node. ............. 304 Table C.1. Storage and VSI characteristics. ............................................................................... 305 Table C.2. SSMT model parameters .......................................................................................... 306 Table C.3. SSMT model – Input and grid side inverter model parameters. .............................. 306 Table C.4. EV and single-phase MS grid-side inverter model parameters. ............................... 307 Table C.5. SOFC model parameters ........................................................................................... 308

List of Acronyms and Abbreviations
25
List of Acronyms and Abbreviations AC – Alternate Current
AEP – American Electric Power
AGC – Automatic Generation Control
APF – Active Power Filter
BEV – Battery EV
BMS – Battery Management System
BS – Black Start
CAMC – Central Autonomous Management Controller
CENELEC – Comité Européen de Normalisation Électrotechnique (European Committee for Electrotechnical Standardization)
CERTS – Consortium for Electric Reliability Technology Solutions
CHP – Combined Heat and Power
CIGRE – Conseil International des Grands Réseaux Électriques (International Council on Large Electric Systems)
CO2 – Carbon Dioxide
DC – Direct Current
DDC – Dynamic Demand Control
DER – Distributed Energy Resources
DG – Distributed Generation
DMS – Distribution Management System
DoD – Depth of Discharge
DR – Demand Response
DSP – Digital Signal Processor
DSO – Distribution System Operator
DSTATCOM – Distribution Static Synchronous Compensator
EB – Energy Box

List of Acronyms and Abbreviations
26
EEGI – European Electricity Grid Initiative
ENTSO-E – European Network of Transmission System Operators for Electricity
EPRI – Electric Power Research institute
ETSI – European Telecommunications Standards Institute
EU – European Union
EV – Electric Vehicle
EVSE – Electric Vehicle Supply Equipment
FAPER – Frequency Adaptive Power Energy Reschedule
FLA – Flooded Lead-Acid
GhG – Green House Gases
HEM – Home Energy Manager
HV – High Voltage
ICE – Internal Combustion Engine
ICT – Information and Communication Technology
IEA – International Energy Agency
IEC – International Electrotechnical Commission
ISET – Institute for Solar Energy Supply Engineering
ISO – International Organization for Standardization
IWES – Institute for Wind Energy and Energy System (IWES)
LC – Load Controller
LV – Low Voltage
MAS – Multi-Agent Systems
MC – MicroSource Controller
MG – MicroGrid
MGCC – MicroGrid Central Controller
MMO – Multi-Master Operation
MPPT – Maximum Power Point Tracker

List of Acronyms and Abbreviations
27
MS – MicroSource
MV – Medium Voltage
NEDO – New Energy and Industrial Technology Development Organization
NERC – North American Electric Reliability Council
PCC – Point of Common Coupling
PHEV – Plug-in Hybrid Electric Vehicle
PLC – Power Line Carrier
PMSG – Permanent Magnet Synchronous Generator
PV – PhotoVoltaic
PWM – Pulse-Width Modulation
RES – Renewable Energy Sources
RTU – Remote Terminal Unit
SG – Smart Grid
SGEVL – Smart Grid and Electric Vehicle Laboratory
SML – Smart Load
SMO – Single Master Operation
SOC – State of Charge
SOFC – Solid Oxide Fuel Cells
SSMT – Single Shaft Microturbines
STATCOM – Static Synchronous Compensator
TSO – Transmission System Operator
USA – United States of America
var – volt-ampere reactive
VC – Vehicle Controller
VUF – Voltage Unbalance Factor
VSI – Voltage Source Inverter
V2G – Vehicle-to-Grid

List of Acronyms and Abbreviations
28
WT – Wind Turbine
ZEV – Zero Emission Vehicle
4PQ – Four Quadrant back-to-back inverter

Chapter 1 – Introduction
29
– Introduction Chapter 1
1.1 Motivation for the Thesis Today’s society and economy depend on the availability of primary energy. The reduced reserves of fossil fuels, the growing political instability in fossil fuels exporting countries and the need to reduce Greenhouse Gas (GhG) emissions require a change of paradigm in energy intensive sectors such as industry, transportation and electricity. Promoting energy efficiency through the use of endogenous resources, preferably based on Renewable Energy Sources (RES) and low carbon technologies as well as the electrification of transportation sector, are of extreme importance to reduce energy dependency from foreigner countries and meet decarbonizing objectives [1]-[5].
The European Union (EU) Energy and Climate Package, proposed on March 2010, set out ambitious targets for 2020: a 20% reduction of GhG emissions, 20% reduction in the primary energy used and a 20% increase of RES in the final energy consumption [1]. In 2012, a 16.7% reduction on GhG emissions and a 10.5% decrease in primary energy consumption were achieved, compared to 1990s registered values. The investment on RES increased the share of RES in EU-28 gross final energy consumption to 14.1%, representing a share of 21% in electricity consumption [6]. However, in order to achieve 2020 targets, the share of RES on electric energy consumption is expected to grow to 34.3%, being the biggest share dominated by wind, followed by photovoltaic (PV) generation [7].
Nonetheless, the EU decarbonisation objectives go beyond 2020. EU is committed to reduce GhG emissions to 80%-95% in 2050 (relatively to the 1990 values) [5]. Once more, in order to comply with the EU decarbonizing objectives, the electric energy sector will have to achieve a significant level of decarbonisation (57-65% in 2030 and 96-99% in 2050) by increasing the share of RES power generation, while dealing with the increasing electricity consumption, which is expected to double in part due to the electrification of the transportation sector [5].
Such profound changes being promoted for future energy mix are driving the electricity sector to the centre of governments’ energy policies. Electricity networks will have to evolve towards a more sustainable, competitive and secure energy sector [2]-[5], according to several driving factors illustrated in Figure 1.1. Within the EU, the goal is to tackle environmental and security of supply issues while promoting economic growth, by creating new opportunities for industry and services providers involved in electricity sector. At the same time, a new efficient regulatory framework will promote competitiveness, providing to European citizens a wider choice of services and ultimately lower electricity prices [2].

Chapter 1 – Introduction
30
Figure 1.1. Driving factors for Smart Grid development (adapted from [2]).
The electric power systems infrastructure plays a vital role in ensuring security of supply, reliability and quality of supply. However, renewing aging electricity infrastructures towards a more flexible and robust system is required in order to enable large scale integration of RES and improve global system efficiency. According to European Technology Platform (ETP) future electricity networks should evolve to be [2]-[4]:
• Accessible. Electricity networks have to be able to safely accommodate high shares of RES power generation, Electric Vehicles (EV) charging and enable active demand participation. A market driven approach is expected for the integration of such resources, including the development of new value added services rewarding capacity and flexibility.
• Flexible, being able to manage the high variability associated to RES and loads, while fulfilling customers’ needs.
• Reliable, assuring and improving the security of supply and the reliability of electricity networks.
• Economic, through the improvement of the electricity system efficiency (from generation to consumer’s premises) and development of innovative energy services, dedicated to the active participation of consumers.
However, meeting the above mentioned goals is a challenging task. While the benefits of RES, electrification of transportation sector and active demand integration have undeniable environmental and potential security of supply benefits, they also impose additional technical challenges in what concerns power quality, reliability and stability of the electric power system [8]-[16]. Future electric power systems will have to coordinate a large number of new resources, connected at different voltage levels, from transmission to consumers’ premises.
At the generation level, the large scale integration of bulk and Distributed Generation (DG) based in RES is expected to displace pollutant generation technologies. However, the variability of RES such as wind and solar requires adequate reserve management in order to maintain the system robustness of operation [8], [9]. In addition, the large-scale integration of Distributed Generation (DG) and microgeneration, EV charging and demand management services will increase the uncertainty regarding power flows, particularly in distribution systems [8]-[17]. At the same time, the increased competitiveness of electricity sector will lead utilities to maximize asset utilization, operating electricity networks close to their technical
Environment
Internal Market Security of Supply
Nature and wildlife preservation
Climate Change
Pollution
Primary Energy availability
Reliability and quality
Capacity
Liberalisation
Innovation and competitiveness
Low prices and efficiency

Chapter 1 – Introduction
31
limits [16]. Therefore, significant changes in the system operation paradigm are required in order to maintain the reliability of the system.
The most efficient strategy to deal with increased uncertainty is to better exploit and coordinate the flexibility of different players, towards an active and “smarter” system – the Smart Grid (SG) [2]-[5],[8]-[17]. The SG can be defined as an electricity grid supported by Information and Communication Technologies (ICT), promoting the active management and control of RES and flexible resources such as storage, EV and responsive loads [2]-[5], [8]-[17]. The ICT infrastructure is extended to the consumers’ premises through Advanced Metering Infrastructures (AMI), more commonly referred as smart metering [17].
The SG conceptual model developed by EU Smart Grid Task Force is represented in Figure 1.2 [18]. Four domains are involved in power system operation, namely: Electricity Market, Energy Services, Grid Users and Operations. Each domain groups different system actors and their roles. The Operation and Grid Users comprise the actors which are physically related to the electrical grid and to the ICT infrastructure [18]. The Operations, Transmission and Distribution domains are responsible for ensuring a secure and stable operation, while facilitating the participation of Grid Users in electricity markets. Grid Users includes all the actors responsible for the generation and consumption of electricity including bulk generation and storage as well as Distributed Energy Resources (DER) and EV. The Energy Services domain will ensure the interaction between Grid Users and the electricity markets, for purchasing/selling power in the energy market and for the provision of grid support services in capacity and flexibility markets [18].
Figure 1.2. EU conceptual model for the SG (adapted from [18]).

Chapter 1 – Introduction
32
What differentiates the SG model from the current system is the integration of new actors such as DER and EV, which are expected to actively participate in the operation of the system interacting with Operations and Energy Services domain [16]-[18]. DER include small storage, generation units either based on RES or low carbon technologies (fuel cells, microturbines) and flexible loads, which are connected to the distribution network at the Medium Voltage (MV) and Low Voltage (LV) levels [19], [20].
When connected to the system, the EV can be regarded as flexible loads or storage devices, being capable of providing power to the system the Vehicle-to-Grid (V2G) concept [15].The deployment of active management strategies for storage, EV and loads counterbalance the RES variability and provide grid support, namely: reserve and regulation capacity, congestion management and voltage regulation [9]-[15]. However, such level of coordination requires significant changes at the Distribution Operations domain [15]-[17].
Within the SG framework, the integration of DER and EV requires the development of new roles and functionalities at the Operations, Energy Services and Electricity Market domains. This has been the main objective of recent European research projects such as: the “Active Distribution networks with full integration of Demand and distributed energy RESourceS” (ADDRESS) project [21], the “Mobile Energy Resources in Grids of Electricity” (MERGE) project [22] and the ongoing project “Development of methodologies and tools for new and evolving DSO roles for efficient RES integration in distribution networks” (evolvDSO) [23]. One of the main contributions of the ADDRESS project was the definition of a reference architecture for the integration of LV consumers (residential and small commercial) in the operation of power systems and electricity markets [24]. Based on the defined reference architecture, a set of market mechanisms were also developed for the active integration of loads in the operation of the electricity system, by exploiting their flexibility [25]. Similarly, the MERGE project also defined a technical and market framework for the safe and competitive integration of EV in the power system operation and electricity markets, envisioning EV as a flexible element of the system and exploiting V2G concepts [26]. The defined architectures support current developments on SG deployment, namely in ongoing projects such as the evolvDSO project, which is focused on the definition of future roles of Distribution System Operators (DSO) [23].
In order to manage all the new players connected to the system, the distribution monitoring, control and data acquisition capabilities have to be extended downstream to the LV networks, where the majority of these new resources are connected. Considering the increase of the number of control variables and consequent communication and data processing capabilities, the centralized Distribution Management Systems (DMS) may become inadequate to manage such a large number of resources and process a large flow of information [17]. Therefore, distribution networks require the development of decentralized services which can actively integrate DER and EV in the operation of the system, taking advantage of new ICT and AMI [2]-[5], [9]-[15].
The future deployment of the MicroGrid (MG) concept as an extension of DMS, will contribute to decentralize distribution network management and control, by organizing the distribution system operation in small controllable clusters, which can operate in a coordinated way through the Multi-MicroGrid (MMG) concept [27]-[29]. The MG has been defined as an

Chapter 1 – Introduction
33
electricity distribution system integrating DER such as microgeneration, storage and loads, which operate in a controlled and coordinated way in both grid-connected and islanded mode [28].
Considering its characteristics, the MG concept was included in EU SG reference architecture as identified in Figure 1.2 [18]. The decentralized control architecture of MG enables the deployment of active management strategies to deal with increased uncertainty associated to local resources, in order to avoid potential problems in distribution networks [27]-[28]. Most importantly, the MG is capable of operating autonomously, when major disturbances occur in the upstream network [27]-[35]. In this case, the MG is said to operate in emergency mode, where the local resources are controlled in order to maintain the system stability and avoid its collapse [35]. If the islanding is unsuccessful or a general blackout occurs, the MG is also able to locally Black Start (BS), taking advantage of local generation resources in order to restore the service [36]-[37]. These new distribution network operation philosophy increases the system reliability and resilience against component failures and natural disasters, endowing distribution networks with self-healing capabilities.
The deployment of MG as a solution to increase grid resiliency has gained particular interest following the major blackouts which occurred recently due to extreme weather conditions and natural disasters. For example, on March 11 2011, the Great East Japan Earthquake hit the Tohoku district, inflicting catastrophic damage on the district’s energy supply system for a couple of days. However, Sendai MG at Tohoku Fukushi University with 1 MW capacity continued supplying power and heat to customers, including a hospital, during 2 days. Similarly, in 2012 during Sandy storm, over 9.5 million customers lost power in the United States. However, the research MG at Princeton University, New York University campus successfully continued in operation and was able to maintain service to local loads [38].
However, the deployment of MG concept particularly when operating autonomously still faces several challenges, namely economic, regulatory and technical [38]:
• Economical – In order to operate autonomously, the MG requires an adequate resources portfolio (storage, controllable generation and load), including specific ICT requirements. Establishing such portfolio can become quite expensive. Therefore, the deployment of MG islanding functionalities should be included in SG deployment programs, which already incorporates the ICT based infrastructure.
• Regulatory – Current regulatory framework does not allow islanded operation in distribution systems. There are safety and protection coordination concerns which have to be tackled. Also, ancillary services such as frequency and voltage regulation are usually provided by conventional power generation system. The provision of such services by distributed storage and microgeneration requires the development of a new regulation, market and operation framework.
• Technical – Ensuring successful islanding operation can become a challenging task. Contrary to conventional bulk generation system, the MG has low inertia, being most of the microgeneration units connected to the network through power electronic interfaces. This requires the development of new control strategies to ensure voltage and frequency regulation. Voltage regulation strategies have to consider the specific characteristics of LV feeders namely its low X/R ratio as well as the unbalanced nature

Chapter 1 – Introduction
34
of LV networks. Voltage unbalance in LV networks is caused by the uneven connection of single-phase loads, EV and microgeneration units in the three phases of the system. In order to comply with power quality standards, it is essential to analyse the behaviour of the MG operating under unbalanced conditions and study new voltage control strategies which can mitigate voltage unbalance problem [39].
Nevertheless, the deployment of SG concepts offers new opportunities to tackle MG technical challenges and improve its resilience during islanding operation, such as [38]:
• Improvement and cost reduction of DER. As consequence of energy policies and technological developments, new cost-effective DER technologies are being deployed and installed in LV networks. Photovoltaic panels have experienced a high growth worldwide, accompanied by a strong price decrease [7]. Regarding low carbon technologies, the use of small-scale Combined Heat and Power (CHP) solutions at commercial and residential buildings has increased due to technical improvements and cost-reductions [19]. From the MG operation point of view, CHP units are dispatchable resources, essential for enabling autonomous operation by supplying local loads [35]. The integration of storage in power system has also been recognized has an essential step to increase the flexibility of power system operation and deal with the large scale integration of RES. From the MG deployment perspective, the integration of storage both in distribution networks and customer premises potentially increases the MG reliability, if properly coordinated with microgeneration and flexible loads. Storage can provide valuable ancillary services such as frequency and voltage/var grid regulation functionalities [19], [20], [28],[29], [40].
• Improvement and cost reduction of power electronic grid-coupling devices. The majority of DER are connected to the system through power electronic interfaces. These devices are also becoming more interactive with the AC network, through bidirectional communication channels and additional grid supporting functionalities [19]. The MG is an inverter based system and its successful operation relies in the implementation of inverter control strategies to provide grid support and ensure the stability of the system [32]-[35], [41], [42]. In this sense, the development and commercialization of grid friendly power electronic devices might contribute to boost the deployment of MG.
• Deployment of AMI provides a bidirectional communication channel between utilities and customers, enabling the implementation of new grid supporting services which actively integrate consumers in the operation of the system. The real-time information provided by Smart Meters (SM) such as power consumption and other power quality data enables the implementation of intelligent grid monitoring and control functionalities which will optimize the operation of the system and improve its overall reliability [28].
• Development of smart charging and EV grid support services. The majority of EV will be connected at the LV networks for charging at the LV customer premises. This will represent a significant load to LV feeders potentially causing congestion problems and consequently increasing voltage drops [13]-[15]. However, if adequate charging strategies are adopted, the EV can be regarded as a flexible load or storage device capable of providing grid support. The MG presents the adequate framework to safely accommodate the load from EV charging and can potentially benefit from the additional

Chapter 1 – Introduction
35
EV load flexibility and distributed storage, particularly when operating autonomously [15].
• Development of active Demand Response (DR). The development of smart grid technologies such as SM and home energy management tools will enable the development of innovative DR strategies, dedicated to LV consumers [10], [11]. The active engagement of small scale consumers can benefit both consumers and network operators. From the system operator’s point of view, load flexibility could provide key ancillary services, help solve technical constraints at the transmission and distribution level and compensate the variability of RES such as wind and solar [10], [11]. The consumers will then benefit from better energy use profiles as well as from additional revenues from ancillary service provision [10]. Active load control could help improve MG efficiency and resilience when islanded. During MG islanded operation, load control can contribute to maintain power balance potentially reducing storage and microgeneration reserve requirements [11], [35].
The feasibility of the MG concept has been the focus of several research projects around the world. The concept was first proposed by the Consortium for Electric Reliability Technology Solutions (CERTS), aiming to exploit emerging small scale generators, energy storage and controllable loads in order to improve the reliability of LV systems [31]-[33]. In Europe, MG concept was developed under the MICROGRIDS and the MORE MICROGRIDS projects [43]. The main objective was to develop a distributed architecture for the distribution network management, incorporating active control strategies in order to enable the safe integration of large amounts of renewable based generation and improve the reliability of distribution networks by enabling its autonomous operation. Specific control strategies were developed under CERTS and the European MG projects enabling the MG emergency operation mode while exploiting the flexibility of the resources connected to the system (microgeneration, storage and flexible loads) [29]-[36].
More recently, the MG system was identified as one of the key pieces for the implementation of future smart distribution networks, providing the adequate framework for the integration of SG players such as the EV. Regarding the development of smart grid concepts, the InovGrid project has been distinguished in Europe as a reference case study for testing and validation of smart grid concepts [44]. The main objective of the project was the development and specification of a reference architecture based on MG and MMG concepts for the progressive deployment of AMI and active management strategies for distribution networks enabling the large scale deployment of microgeneration, EV and active DR services. The InovGrid project started in 2008 and was headed by the Portuguese DSO, EDP Distribuição, involving several industry partners and research institutions from the Portuguese electricity sector. The specifications associated with the InovGrid project were rolled-out in Évora in the InovCity pilot in order to test in a real-world scenario the control architecture, functionalities and controllers specified under InovGrid project and developed by the InovGrid industrial partners [44].
More focused in the deployment of EV, in the European MERGE project the MG architecture was included in the technical operation framework in order to promote EV charging management locally at the LV network and exploit its flexibility in order to improve MG

Chapter 1 – Introduction
36
stability during emergency operation. In the same context, two Portuguese projects were dedicated to the integration of EV in power system operation considering the MG and MMG concepts: the “Intelligent Grids with Electric Vehicles” (REIVE) project and “MicroGrids+EV – Identification of Control and Management Strategies for MicroGrids with Plugged-in Electric Vehicles” (MG+EV) project [45], [46].
The REIVE project was a two year project (2010-2012) involving relevant Portuguese research institutions, the Portuguese DSO and industrial partners from the Portuguese electricity sector. The main objective was to develop a technical platform which would allow the progressive integration of microgeneration and EV systems while further developing the SG concept through MG and MMG architectures. The technical impacts of the progressive integration of microgeneration and EV charging strategies were evaluated for the Portuguese electricity system, providing a relevant tool for DSO and industrial partners business planning. In addition, the project included a strong experimental component with the main objective of promoting SG technology transfer to the Portuguese industry. The Smart Grid and Electric Vehicle Laboratory (SGEVL) was built at INESC TEC facilities in the context of this project. The main experimental contributions from the project include the development of a set of hardware and software prototypes incorporating advanced grid supporting functionalities [45].
The project MG+EV was a two year project (2011-2013) more focused on the development of new functionalities for the MG emergency operation, taking advantage of the EV load flexibility and storage capacity [46]. One of the most distinct features of the project is the study and development of voltage balancing strategies which could help improve power quality in LV networks with high penetration of single-phase EV chargers and microgeneration units [46].
The majority of European projects related to the development of MG concept, particularly in what concerns the MG emergency operation have validated the concepts developed through numerical simulation and in less extent through experimental laboratorial and pilot field-tests [47]-[56]. Current Horizon 2020 Work Programme expects that future MG and SG research should promote the experimental validation of the concepts previously developed. In the context of this programme, the “Storage ENabled SustaInable Energy for BuiLdings and communitiEs” (SENSIBLE) project was recently approved and will start in early 2015. The main objective of this project is to demonstrate the coordinated use of different forms of energy (electricity and gas) through the deployment of MG concept at the LV network, coordinating the operation of heating, cooling and CHP devices and RES based microgeneration, together with the small-scale storage technologies. Such coordination will be enabled by the deployment of MG concept. INESC TEC and the Portuguese DSO will participate in the project, promoting extensive demonstration activities in the SGEVL and in the InovCity pilot site.
Being in line with the relevance and actuality of the MG concept, this thesis will focus on the technical challenges imposed to the MG emergency operation through the identification, development and experimental demonstration of new coordinated control solutions that exploit the flexibility of LV DER and EV in order to improve MG resilience. Following the recommendations of EU commission to promote the experimental validation of concepts and technologies developed, the SGEVL facilities were exploited for the development and proof of

Chapter 1 – Introduction
37
concept of control solutions, envisioning the development of prototypes for the MG central and local controllers.
The experimental setup allows the development of scaled LV MG aiming to better understand and address its control and operational issues with a particular emphasis in resilience, frequency regulation and local BS procedures. Therefore, this thesis incorporates both simulation and experimental approaches, the first consisting in a set of numerical simulation tools developed in order to conceptualize, develop and demonstrate the effectiveness of the new MG emergency control functionalities. It is well understood that numerical simulation provides useful information regarding the identification of possible solutions. Nevertheless, the laboratory setup support the validation of prototypes of control modules envisioned for MG islanded operation and allows demonstrating its feasibility considering near real world testing conditions.
The research questions that represent the challenges of this work are: • How to exploit the flexibility of EV to improve the robustness of the MG restoration
procedure? • How can active DR services contribute to improve the MG resilience during
autonomous operation? • How can the coordinated control of MG resources i.e. (microgeneration, storage, EV
and responsive loads) improve the MG emergency operation robustness? • Could the further development of management and local control strategies contribute
to minimize the MG voltage unbalance, particularly during autonomous operation? • How effective and robust are the developed strategies in near real world conditions?
1.2 Objectives of the Thesis The main goal of this thesis is to improve MG robustness and resilience following major system disturbances, through the development of innovative control functionalities to handle islanded operating conditions as well as local restoration procedures. The main contributions from the proposed functionalities rely on the coordination of local available resources such as EV responsive loads, microgeneration units and storage devices during MG autonomous operation. These features are expected to increase the MG security of operation and reduce its vulnerability to external attacks, resultant from natural disasters or deliberate actions. In order to achieve this major goal, a set of intermediate objectives can be established:
• Development of advanced management and control functionalities for the MG emergency operation considering the integration of V2G concepts. When connected to the system, EV can be regarded as a flexible load or as a storage device which can potentially provide grid support for improving frequency regulation during MG autonomous operation. However, EV will likely be connected to the system through a single-phase charger, which can contribute to increase voltage unbalance in the LV system. In order to study the impact of EV control strategies in the MG autonomous operation it is necessary to study the MG dynamic behaviour, considering the unbalanced nature of LV systems and the connection of both three-phase and single-phase microgeneration units, loads and EV.

Chapter 1 – Introduction
38
• Development of coordinated control strategies exploiting the role of EV, storage devices, microgeneration units and responsive loads. In order to ensure the MG stability in the moments subsequent to MG unplanned islanding, it is necessary to promote an adequate management of the MG storage capacity (conventional and EV storage) in coordination with MG responsive loads, EV and microgeneration units. The implementation of active management tools for monitoring and managing the MG prior and after islanding may improve the MG stability and reduce load curtailment requirements.
• Development of robust control strategies for the MG service restoration, exploiting the flexibility of EV and taking into account the MG unbalanced operation. The MG has the ability of restoring service locally, through the coordination of local resources. Flexibility of local resources becomes even more critical during the service restoration procedure. Therefore, it is necessary to identify the most adequate procedure to exploit EV connected to the LV grid, providing V2G services during the restoration phase in order to improve the stability of the system.
• Development of voltage balancing strategies for MG operation in both interconnected and emergency modes. Voltage unbalance is a power quality problem affecting LV networks. The uneven distribution of single-phase loads and generation by the three-phases of the system causes asymmetric currents and voltage drops. The additional load from EV charging and the connection of single-phase microgeneration can contribute to increase this problem. Therefore, it is necessary to identify innovative solutions in order to minimize the voltage unbalance problem in the LV feeders and avoid at the same time the unnecessary installation of power quality compensators.
• Laboratory implementation and test of the MG architecture and control strategies. Experimental validation and specification of grid controllers is of utmost importance for the deployment of MG and SG concepts. The SGEVL facilities were exploited for the development and proof of concept of control solutions envisioning the development of prototypes for the MG central and local controllers.
1.3 Contribution of the Thesis This thesis focus on the improvement of MG self-healing capabilities, considering the integration of MG within the SG framework and the deployment of EV, distributed storage, microgeneration and active demand response strategies. The main contributions of this thesis can be identified as:
• Integration and validation of V2G concepts for improving MG frequency regulation capacity during emergency operation mode.
• Integration and validation of emergency load control strategies for improving MG frequency regulation capacity during emergency operation mode, considering the deployment of AMI and Home Energy Management (HEM) systems.
• Development and validation of coordinated control strategies exploiting the role of EV, storage devices, microgeneration units and responsive loads, in order to ensure a
Chapter 1 – Introduction
39
seamless transition to islanding mode and avoid MG collapse due to reserve and storage capacity shortage.
• Improvement of MG voltage quality, through the adoption of voltage balancing strategies exploiting the advanced controllers of MG grid-coupling devices and its storage capacity.
• Development and validation of MG service restoration procedure including the V2G concepts.
• Development of a MG test bed at the SGEVL and implementation of the MG architecture, where software prototypes of the MG controllers were developed and tested in order to demonstrate the effectiveness of the proposed solutions.
The work presented in this thesis is a result from the participation on the research team responsible for the development of different projects, namely:
• MERGE project [22] conceptualization of SG architectures for the active integration of EV, considering the MG and MMG concepts and development of EV grid supporting services exploiting V2G concepts for enabling its participation in frequency regulation. The developments were validated through numerical simulation considering a set of case studies provided by the project partners.
• MG+EV project [46] development of innovative management and control solutions for the MG emergency operation, considering the active integration of EV and DER. A simulation platform was developed integrating the full dynamic model of the MG, including EV and DER models. The voltage unbalance problem was also addressed and voltage balancing strategies proposed and validated through numerical simulation. Regarding the experimental goals of the project, the work presented in this thesis also contributed towards the development of the MG controllers prototypes, required for the performance assessment tests of the defined control strategies under an experimental setup.
• REIVE project [45] contributions towards the quantification of the technical impacts of the progressive integration of microgeneration and EV charging strategies for the Portuguese electricity system, particularly for LV systems. A strong contribution was also provided towards the implementation of the SGEVL infrastructure, in the context of REIVE project as well as for achieving its experimental goals related to MG developments.
The work developed in this dissertation is expected to support the research in the context of future projects funded by the Horizon 2020 Work Programme, namely in the SENSIBLE project.
1.3.1 Publications The work presented in this dissertation resulted in three papers published in journals, three presented at conferences and two book chapters.
Journal: • C. Gouveia, D. Rua, F.J. Soares, C. Moreira, P.G. Matos, J.A. Peças Lopes, “Development
and implementation of Portuguese smart distribution system,” Electric Power Systems Research, vol. 120, pp. 150-162, March 2015.

Chapter 1 – Introduction
40
• C. Gouveia, C. L. Moreira, J. A. Peças Lopes, D. Varajão, R. Araújo, “Service Restoration in Low Voltage MicroGrids with Plugged-in Electric Vehicles,” IEEE Industrial Electronics Magazine, vol.7, no.4, pp.26-41, Dec. 2013.
• C. Gouveia, J. Moreira, C. L. Moreira, J. A. Peças Lopes, "Coordinating Storage and Demand Response for Microgrid Emergency Operation," IEEE Transactions on Smart Grids, vol.4, no.4, pp.1898-1908, Dec. 2013.
Books Chapters: • C. Gouveia, P. Ribeiro, C. L. Moreira, J. A. Peças Lopes, “Operational Characteristics of
MicroGrids with Electric Vehicles,” in Reliability Modeling and Analysis of Smart Power Systems, Karki, Rajesh, Billinton, Roy, Verma, Ajit Kuma (Editors), Springer India Pvt. Ltd, ISBN 978-81-322-1797-8, pp. 33-50, April 2014.
• C. Gouveia, D. Rua, C. Moreira, J. A. Peças Lopes, "Coordinating Distributed Energy Resources during Microgrid Emergency Operation," in Renewable Energy Integration, J. Hossain and A. Mahmud (Editors), Springer-Verlag, ISBN 978-981-4, pp.259-302, March 2014.
International Conferences: • C. Gouveia, D. Rua, F. Ribeiro, C. L. Moreira, J. A. Peças Lopes, “INESC Porto
Experimental SMART GRID: Enabling the Deployment of EV and DER,” PowerTech2013 - PowerTech 2013 - Towards carbon free society through smarter grids, Grenoble, France, June 2013.
• C. Gouveia, C. L. Moreira, J. A. Peças Lopes, “Microgrids Emergency Management Exploiting EV, Demand Response and Energy Storage Units,” PowerTech2013 - PowerTech 2013 - Towards carbon free society through smarter grids, Grenoble, France, June 2013.
• C. Gouveia, P. Ribeiro, C. L. Moreira, J. A. Peças Lopes, “Operational Characteristics of MicroGrids with Electric Vehicles,” 12th International Conference on Probabilistic Methods Applied to Power Systems, Istanbul, 10-14, June 2012.
1.4 Outline of the Thesis The work developed within the scope of this dissertation is organized into seven chapters. The first chapter contextualizes the problem under investigation, introduces the motivation behind this work and delineates the main objectives to achieve. The main drivers, challenges and opportunities are identified for the change in paradigm in power system operation towards a smarter distribution grid, considering the MG concept. The main contributions and outline of this dissertation are also presented.
Chapter 2 provides an overview of the most relevant research work and latest developments regarding the state-of-the-art on MG as well as its development as a building block of the SG. The evolution of the MG architecture considering new resources such as EV and flexible loads is discussed. Also, voltage unbalance problem is addressed and the solutions proposed to mitigate this power quality problem are identified. Following the need of demonstrating the theoretical concepts developed, a review of the most relevant laboratory and pilots facilities

Chapter 1 – Introduction
41
related to the development and test of MG and SG concepts is also presented. An overview of the SGEVL laboratorial infrastructure is also provided in this chapter.
Chapter 3 describes the MG management and control functionality required to enable MG autonomous operation and local restoration procedure. The MG voltage and frequency regulation strategies required to maintain the MG stability are reviewed and the grid supporting functionalities for the integration of active resources such as EV and loads are proposed. At the MG level, a new module is proposed in order to monitor and coordinate the controllable resources connected to the MG. The MG restoration procedure is also revisited and adapted in order to integrate EV as an active resource. The final section of this chapter presents the strategies selected to mitigate voltage unbalance within the MG system, in order to improve MG power quality and robustness during autonomous conditions.
Chapter 4 describes the MG simulation platform developed in order to evaluate the MG security and stability when adopting the new EV and load control strategies. The representation of the MG as a three-phase four-wire system constitutes a differentiating feature of the platform, enabling also the study of the voltage balancing strategies adopted. The individual models adopted for the MG components, namely microgeneration, storage, EV and loads are also described, including the voltage balancing mechanisms identified in the previous chapter.
Chapter 5 presents the analysis of the local and centralized strategies adopted for the MG emergency operation, considering the active participation of EV and loads. The main results of the extensive numerical simulation studies that were conducted are presented, in order to demonstrate the effectiveness of the proposed strategies for improving MG resilience and power quality following an islanding and during local service restoration.
The development of the control functionalities for the MG islanding operation and provision of restoration procedure was developed in close coordination with the implementation of the laboratorial infrastructures that support this work. MG demonstration activities at the SGEVL incorporating advanced control mechanisms are discussed in Chapter 6. Emphasis is given to the implementation of the software modules that will constitute MG controllers (the MG central controllers as well as local controllers), which will interact with the devices installed in the field (loads, EV, microgeneration and storage devices). The main experimental results resulting from the tests conducted are presented demonstrating the performance of the emergency operation functionalities previously developed and tested in the numerical simulation platform.
Chapter 7 presents the main contributions provided by this thesis, with emphasis on the conclusions to be drawn from the work that has been developed. Furthermore, prospects for future work to be developed are outlined.


Chapter 2 – State-of-the-Art
43
– State-of-the-Art Chapter 2The MicroGrid (MG) concept contributes to decentralize the distribution networks’ control and management while increasing the controllability and flexibility of the system. The occurrence of several natural disasters causing major blackouts have brought MG concept to the centre of the discussion on smart distribution network development. The capability of operating autonomously is seen has a key self-healing functionality capable of increasing the security and resilience of the system to severe network disturbances.
The integration of new actors such as Electric Vehicles (EV) and active loads together with the deployment of advanced metering systems enable the development of new grid supporting strategies implemented at the consumers’ level. This is a major opportunity to deploy MG concepts to Low Voltage (LV) distribution systems and increase the amount of controllable resources for the MG secure operation.
In this chapter a description is made of the most relevant research work and latest developments regarding the state-of-the-art on MG and Distributed Energy Resources (DER) technologies. The evolution of the MG architecture within the Smart Grid (SG) framework, considering new resources such as EV and flexible loads is discussed. Following the need of demonstrating the theoretical concepts under development, a review of laboratory infrastructures and pilot sites is also presented.
2.1 Introduction Today’s distribution networks were design to deliver energy from the transmission system to consumers. The reliability and quality of supply has been ensured mainly through planning and networks automation. The real-time information characterizing the operational state of the distribution network is concentrated at the Distribution Management Systems (DMS), which are responsible for monitoring and controlling the distribution networks within a centralized architecture.
However, this centralized architecture may become inadequate to meet the vision of future power systems, towards the SG concept, were the distribution system is expected to [2]:
• Accommodate distributed generation and Renewable Energy Sources (RES). The majority of DER technologies such as PhotoVoltaic (PV) units, micro-Wind Turbines (WT) and micro-Combined Heat and Power (CHP) applications will be connected to LV networks. The system will have to deal with the voltage rise effect caused by the inversion of power flow direction accentuated by the resistive nature of LV feeders. At the same time, since most of DER technologies are single-phase, voltage unbalance could be further accentuated degrading power quality [39].The deployment of distributed storage may help compensating for the variability of RES. However, such coordination requires extending monitoring and control capabilities to Medium Voltage (MV) and LV networks in order to enable the active management of these resources.

Chapter 2 – State-of-the-Art
44
• Accommodate additional load from EV charging. The electrification of the transportation sector is considered an important step in order to meet decarbonizing targets [5]. However, EV charging will represent a significant load for power systems, changing consumption patterns, influencing voltage profiles and possibly causing operational problems such as under voltages and congestions [13]-[15]. Envisioning EV as an active load or even as a distributed storage device can potentially avoid such problems and even provide key ancillary services to the operation of the system from generation to distribution networks [15]. However, the integration of EV in power system operation requires the specification of technical and market framework, regarding the interaction with the network operation and electricity markets and considering connection requirements and the provided services [15].
• Enable local energy demand management targeting end-users, to be implemented through future smart metering infrastructures. Consumers are expected to actively participate in the operation of the system, through the implementation of new market driven services [2]. The deployment of SG technologies such as smart meters (SM) and home energy management tools not only enables the implementation of demand side management but also increases real-time information and control capabilities that can be used by distribution network operators [10]-[12].
• Implement self-healing strategies in order to improve the reliability, power security and availability of the system. Such strategies should perform preventive actions to avoid potential emergency operation states, or to take adequate measure to restore normal operating conditions after the occurrence of disturbances [2], [5].
In order to meet such goals, active management of distribution network has to be implemented taking advantage of new Information and Communication Technologies (ICT) and Advanced Metering Infrastructures (AMI). However, in order to deal with such diversity and large number of resources it is necessary to extend the observability and controllability to LV networks, decentralizing control and management functionalities downstream.
At the LV level, the adoption of MG concept provides the adequate management and control structure to implement SG concepts [27]. The MG system is a flexible cell that can be operated connected to the main power network or autonomously, coordinating local generation resources, storage devices and responsive loads through a distributed control and management system [27]-[35]. Its architecture and management system provides the adequate framework to fully integrate new players, namely the EV and the consumers (that can also become electric power producer – prosumers – when installing microgeneration units) [15], [28]. However, as identified in Chapter 1, the deployment of MG concept still faces several technical challenges particularly related to islanded operation [38].
In this chapter the latest developments regarding the state-of-the-art on MG is provided. The evolution of the MG architecture considering new resources such as EV and responsive loads is also discussed. Section 2.2 reviews the MG concept regarding its operation, management and control architecture. Also, voltage unbalance problem is addressed and the solutions to mitigate this power quality problem proposed in the literature are identified. The integration of EV and responsive loads within the SG context are described in section 2.3 and 2.4, discussing how they can be integrated within the MG concept. Finally, in section 2.5, the most

Chapter 2 – State-of-the-Art
45
relevant laboratory and pilot sites dedicated to MG concept validation and proof of concept are reviewed, including the Smart Grid and Electric Vehicle Laboratory (SGEVL) facilities at INESC TEC.
2.2 MicroGrid Concept: A Review The development of the MG concept was initiated by the Consortium for Electric Reliability Technology Solutions (CERTS) with the objective of enhancing the reliability of the power system, considering the emergence of DER technologies, namely small scale generators, energy storage and controllable loads [31]-[33]. The main objectives of the CERTS MG concept were to minimize the technical impacts resulting from DER integration into distribution networks and to demonstrate that these units have the potential to improve reliability of supply [31]-[33].
The CERTS MG can be defined as a single self-controlled entity which provides power and heat to its customers and meets local reliability and security needs [32]-[33]. The concept was presented in [31]-[33] and patented in 2006 [34]. The small scale generators connected to the MG are usually referred to as MicroSources (MS) and are connected to the system through power electronic devices. The flexibility and controllability of the MG system is provided through advanced power electronic interfaces [32]-[33].
The MG control strategies proposed under the CERTS concept enable two modes of operation. During most of the time, the system will operate interconnected and can provide ancillary services to the upstream network, such as congestion relief, load following and local voltage support. However, if a disturbance occurs in the upstream network (e.g. fault or power quality disturbances) the system can operate islanded. In this case, the local MS supply high priority or sensitive loads [32]-[33].
The general architecture of the CERTS MG is depicted in Figure 2.1. The MG architecture includes three main components, namely:
• MS Controller or Power Flow Controller, which regulates the MS power and voltage based on pre-defined criteria. MS control can be implemented to maintain a constant power output, regulate the feeder power flow or ensure power sharing among all the MS connected to the MG. The controller is able to respond immediately to load changes, based on local voltage and current measurements [33].
• Energy Manager dispatches the MS to meet heat and electrical demand, minimize the system emission levels or energy losses. It is also responsible for satisfying the interconnection requirements with the main grid. According to [33], the energy manager may include intelligent algorithms or be managed by a grid operator.
• Protection system, constituted by a protection coordinator and by the MG separation device, which isolates the MG from the main grid in the event of a fault occurring upstream. A protection coordinator is installed in each feeder in order to minimize the disconnected section necessary to isolate a fault occurring within the MG system. Selective coordination is required between the MG separation device and the feeder’s protection, to correctly identify the faults occurring outside or within the MG [33].

Chapter 2 – State-of-the-Art
46
Figure 2.1. CERTS MG architecture [32].
The MG control architecture follows a plug-and-play approach, meaning that critical control functionalities such as frequency and voltage regulation is provided locally by each MS. This means that the installation of new MS does not require reengineering the MG control system and also increases the reliability of the system, minimizing the dependence of the communication infrastructure.
Regarding CERTS MG resources, initial developments only considered dispatchable MS, such as microturbines and later fuel cells. Energy storage was also identified as a key element for ensuring load following. Storage provides a fast power response, compensating the slower power response of microturbines and fuel cells. More recently the CERTS MG architecture has been updated in order to integrate RES [52].
Contrarily to CERTS MG, in Europe the MG concept was developed in order to enable the safe integration of large amounts of MS based on RES. Two major projects were promoted by European Commission: the MICROGRIDS and the MORE MICROGRIDS projects [53]. In the context of MICRIGRIDS project, the MG is envisioned as a LV system incorporating microgeneration based on RES and low carbon technologies (i.e. gas microturbines and fuel cells), storage and loads. The MG operates as a controllable LV cell coordinating the operation of its resources in order to minimize the technical impacts of a large scale integration of RES. In normal operating conditions, the system operates interconnected to the MV network. However, the system can also operate islanded due to planned or unplanned actions, such as faults occurring upstream.
The MICROGRIDS project was followed by the development of MORE MICROGRIDS project, whose main objective was the definition of a distributed architecture for distribution network management. The MG concept was transposed to the MV network through the development of the Multi-MG (MMG) concept, which is a high level structure interconnecting LV MG and DG units connected to the MV network. Active management strategies were developed and integrated in a centralized controller, which acts as an intermediate between the DMS and the LV MG. More details on the MMG operation can be found in [29].
Chapter 2 – State-of-the-Art
47
Both in the CERTS and in the European concepts, the MG system is an inverted dominated system, being is flexibility and control provided by the development of grid supporting strategies, implemented locally at the controllers of the grid-coupling inverters. However, in the European case different control strategies have to be considered, due to the integration of non-controllable MS based on RES.
In both concepts, the MG can be regarded as a controllable cell, being able to operate both interconnected to the upstream network and autonomously. Therefore, two modes of operation are derived [35]:
• Normal Interconnected mode, when operating interconnected to the MV network. In this mode the MG power can be partially or fully supplied by the MV network, or the exceeding generation power can be injected to the MV network. MG operation may have distinct operation objectives, namely: economical, technical and environmental. Economic objectives can include the minimization of LV network operation cost and/or maximization of MG consumer/prosumer revenue. Technical operation objectives are focused in maintaining voltage, branch current and losses within admissible limits, while environmental objectives focus on minimizing CO2 emission levels.
• Emergency operation mode. When a disturbance occurs in the upstream network or due to planned actions, the MG becomes isolated and is operated autonomously. If islanding fails or a general blackout occurs, a local service restoration can be launched [36]. In emergency mode of operation, the MG stability is ensured by the coordination between fast acting storage units, MG generation and loads [35], [36].
In order to be flexible and controllable, the MG power infrastructure is overlaid by a communication and information system. Figure 2.2 represents the MG architecture developed under the European project MICROGRIDS. Two local controllers were defined: the MS Controller (MC) and the Load Controller (LC). The MC is responsible for controlling the active and reactive power exported by the MS. The LC is responsible for locally controlling the associated loads, including the implementation of load shedding mechanisms during islanding operation [35]. The local controllers are headed by the MG Central Controller (MGCC), which is installed at the MV/LV substation and concentrates the high level decision making for the technical management of the MG.
MG research has been developed mainly for AC systems. However, alternative DC MG systems have also been proposed. The main objective is to take advantage of DC sources to supply DC loads and avoid the need of individual DC/AC grid-coupling devices. The DC resources can be connected to a DC bus and then interconnected to the AC system through a DC/AC inverter. The main advantages of this type of solution are related to a simpler control system and better power quality, since AC MG will have to deal with harmonic currents and voltage and current unbalance [42]. DC MG concept has been designed mainly for specific applications such as customer owned facilities. Their application to distribution networks would require reengineering the entire system.

Chapter 2 – State-of-the-Art
48
Figure 2.2. MG architecture based on European project MICROGRIDS [35].
The increased interest on MG systems due to its flexibility and controllability has diversified the MG definition in power capacity, ownership, business models and type of connection (AC and DC systems). The need of clarifying the concept and clearly distinguish it from other similar concepts has led CIGRE working group WG C6.22 to the following MG definition [30]:
“Microgrids are electricity distribution systems containing loads and distributed energy resources, (such as distributed generators, storage devices, or controllable loads) that can be operated in a controlled, coordinated way either while connected to the main power network
or while islanded.”
MG business and ownership models are summarized in Table 2.1 and can be divided in two main groups [28], [38]:
• Utility owned MG, divided according to utilities’ model. In case of vertically integrated utilities, the Distribution System Operator (DSO) owns the generation and storage assets and is responsible for supplying and billing customers for the energy delivered. Therefore, the MG can be operated in order to meet utilities technical and economic objectives. However, considering the liberalization of electricity sector the vertically integrated MG model is unlikely to be implemented. The majority of today’s utilities adopt an unbundled model, meaning that the utility is only responsible for the technical management of the distribution system. In this case, the MG main operational objective is to ensure the technical management and control of the LV network. However, the control of MG resources, such as MS and loads will be limited by commercial agreements between the consumers and the electricity providers [15].
• Non-utility MG are the most common models implemented today, which can have a single owner (single facility) or multiple owners (multi facility). In this model, the MG operates as a Medium Voltage (MV) customer, being the main operational objective
DMS
Microturbine
MV
LV
MGCCMC
LC
Fuel CellMC
PV
MC
MC
LCLC
LC
MC
LC
AC
AC
AC
DC
ACDC
Microturbine
Micro Wind Generator
MC
Storagedevice
AC
DC
PV
ACDC
MC
AC
AC
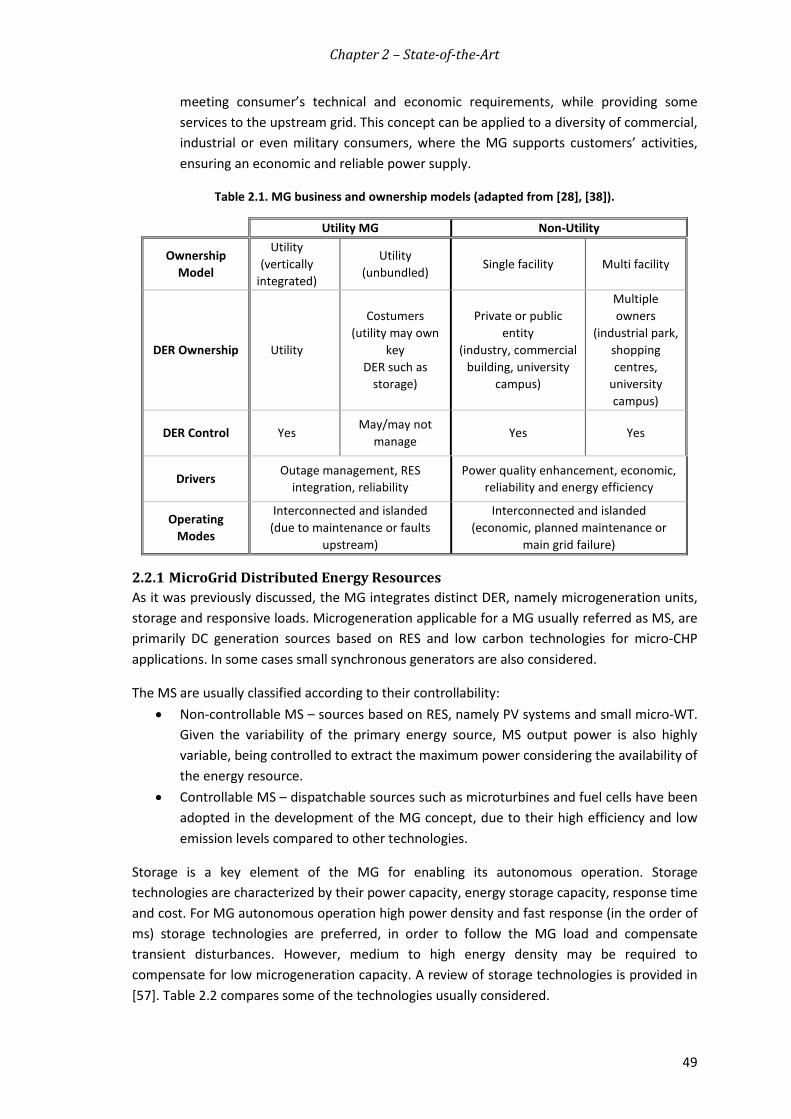
Chapter 2 – State-of-the-Art
49
meeting consumer’s technical and economic requirements, while providing some services to the upstream grid. This concept can be applied to a diversity of commercial, industrial or even military consumers, where the MG supports customers’ activities, ensuring an economic and reliable power supply.
Table 2.1. MG business and ownership models (adapted from [28], [38]).
Utility MG Non-Utility
Ownership Model
Utility (vertically
integrated)
Utility (unbundled)
Single facility Multi facility
DER Ownership Utility
Costumers (utility may own
key DER such as
storage)
Private or public entity
(industry, commercial building, university
campus)
Multiple owners
(industrial park, shopping centres,
university campus)
DER Control Yes May/may not
manage Yes Yes
Drivers Outage management, RES
integration, reliability Power quality enhancement, economic,
reliability and energy efficiency
Operating Modes
Interconnected and islanded (due to maintenance or faults
upstream)
Interconnected and islanded (economic, planned maintenance or
main grid failure)
2.2.1 MicroGrid Distributed Energy Resources As it was previously discussed, the MG integrates distinct DER, namely microgeneration units, storage and responsive loads. Microgeneration applicable for a MG usually referred as MS, are primarily DC generation sources based on RES and low carbon technologies for micro-CHP applications. In some cases small synchronous generators are also considered.
The MS are usually classified according to their controllability: • Non-controllable MS – sources based on RES, namely PV systems and small micro-WT.
Given the variability of the primary energy source, MS output power is also highly variable, being controlled to extract the maximum power considering the availability of the energy resource.
• Controllable MS – dispatchable sources such as microturbines and fuel cells have been adopted in the development of the MG concept, due to their high efficiency and low emission levels compared to other technologies.
Storage is a key element of the MG for enabling its autonomous operation. Storage technologies are characterized by their power capacity, energy storage capacity, response time and cost. For MG autonomous operation high power density and fast response (in the order of ms) storage technologies are preferred, in order to follow the MG load and compensate transient disturbances. However, medium to high energy density may be required to compensate for low microgeneration capacity. A review of storage technologies is provided in [57]. Table 2.2 compares some of the technologies usually considered.
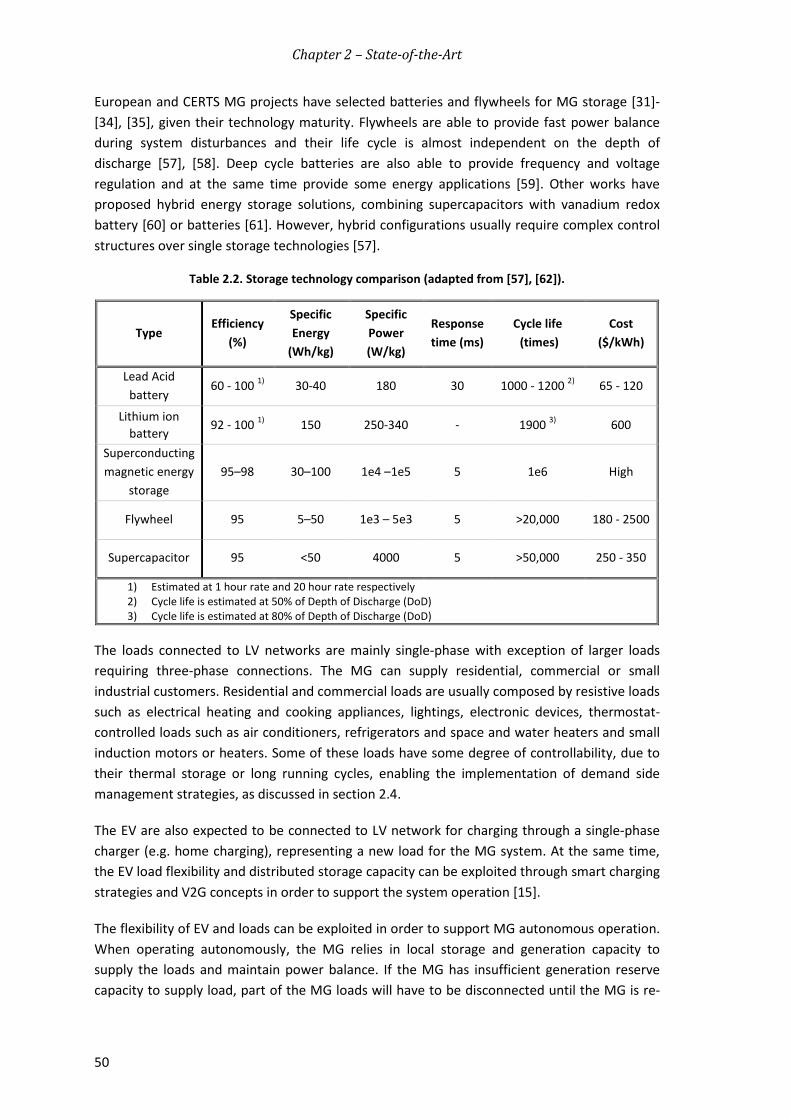
Chapter 2 – State-of-the-Art
50
European and CERTS MG projects have selected batteries and flywheels for MG storage [31]-[34], [35], given their technology maturity. Flywheels are able to provide fast power balance during system disturbances and their life cycle is almost independent on the depth of discharge [57], [58]. Deep cycle batteries are also able to provide frequency and voltage regulation and at the same time provide some energy applications [59]. Other works have proposed hybrid energy storage solutions, combining supercapacitors with vanadium redox battery [60] or batteries [61]. However, hybrid configurations usually require complex control structures over single storage technologies [57].
Table 2.2. Storage technology comparison (adapted from [57], [62]).
Type Efficiency
(%)
Specific Energy
(Wh/kg)
Specific Power (W/kg)
Response time (ms)
Cycle life (times)
Cost ($/kWh)
Lead Acid battery
60 - 100 1) 30-40 180 30 1000 - 1200 2) 65 - 120
Lithium ion battery
92 - 100 1) 150 250-340 - 1900 3) 600
Superconducting magnetic energy
storage 95–98 30–100 1e4 –1e5 5 1e6 High
Flywheel 95 5–50 1e3 – 5e3 5 >20,000 180 - 2500
Supercapacitor 95 <50 4000 5 >50,000 250 - 350
1) Estimated at 1 hour rate and 20 hour rate respectively 2) Cycle life is estimated at 50% of Depth of Discharge (DoD) 3) Cycle life is estimated at 80% of Depth of Discharge (DoD)
The loads connected to LV networks are mainly single-phase with exception of larger loads requiring three-phase connections. The MG can supply residential, commercial or small industrial customers. Residential and commercial loads are usually composed by resistive loads such as electrical heating and cooking appliances, lightings, electronic devices, thermostat-controlled loads such as air conditioners, refrigerators and space and water heaters and small induction motors or heaters. Some of these loads have some degree of controllability, due to their thermal storage or long running cycles, enabling the implementation of demand side management strategies, as discussed in section 2.4.
The EV are also expected to be connected to LV network for charging through a single-phase charger (e.g. home charging), representing a new load for the MG system. At the same time, the EV load flexibility and distributed storage capacity can be exploited through smart charging strategies and V2G concepts in order to support the system operation [15].
The flexibility of EV and loads can be exploited in order to support MG autonomous operation. When operating autonomously, the MG relies in local storage and generation capacity to supply the loads and maintain power balance. If the MG has insufficient generation reserve capacity to supply load, part of the MG loads will have to be disconnected until the MG is re-

Chapter 2 – State-of-the-Art
51
synchronized to the MV network [35]. The integration of EV and loads in the operation of the MG will be discussed in more detail in sections 2.3 and 2.4 respectively.
2.2.2 Power Electronic Interfaces The majority of the MG components, namely the MS, storage units and EV require a power electronic interface (DC/AC or AC/DC/AC), in order to convert their power output into grid-compatible AC power. Contrarily to the conventional power system, in a power electronic based MG, the system is inertialess due to the absence of synchronous machines.
Compared to electrical machines, the inverters impose additional power quality challenges, requiring the adoption of filters to reduce the emission of high frequency distortion produced by switching actions. This topic will not be covered in this thesis, since the main concern is regarding the MG behaviour for the fundamental frequency. However, a review of several harmonic filtering techniques is provided in [63], [64]. Additionally, fault detection in inverter dominated systems can become quite challenging specially when adopting current based fault detection, as in LV networks. In order to maintain the integrity of power electronic components, the short circuit current has to be limited to values lower than twice the inverter nominal current [65], [66].
However, as initially proposed in CERTS MG concept, the power electronic interfaces also provide a local layer of control, which enables the integration of these sources in the MG operation [31]-[35], [41], [42]. Table 2.3 summarizes the power electronic interfaces for the MG DER.
Table 2.3. Power electronic interfaces of MG DER.
DER unit Primary Source Power electronic interface
Non-controllable MS PV modules DC/DC/AC converter
Variable speed wind turbine AC/DC/AC Converter
Controllable MS Single-shaft microturbine AC/DC/AC Converter
Fuel Cell stack DC/DC/AC converter
Storage Flywheel AC/DC/AC converter
Battery DC/DC/AC converter
The power electronic interface can be divided in the input-side converter and grid-side converter [63]. The input-side converter (DC/DC or AC/DC) manages the power extracted from the primary source, being controlled to operate close to the Maximum Power Point (MPPT) [67]. Controllable MS can be dispatched by the MGCC or by the owner to meet the desired load.
The grid-side inverter core functionalities include the control of the active and reactive power flow with the grid, DC-link voltage and synchronization between the MS and the grid [63]. However, additional functionalities can be added to provide grid support, namely local voltage

Chapter 2 – State-of-the-Art
52
regulation, frequency regulation and voltage harmonic and unbalance compensation. The grid-side converter can be classified in two groups, depending on the approach that is used to control its operation [35], [66], [67]:
• Grid-feeding inverter, controlled through an active and reactive (PQ) control strategy. The inverter is a current-controlled voltage source, designed to deliver a controlled amount of power (active and reactive) to the grid (these inverters are usually referred as grid tied inverters). The PQ controlled inverter does not have the ability of imposing voltage and frequency. The grid-side inverters of MS (controllable and non-controllable) are usually controlled as grid-feeding inverters for both islanded and interconnected operation.
• Grid-forming inverters are controlled as voltage sources establishing the phase angle and magnitude of its output voltage. The inverter is usually fed by a DC power source with energy buffering capabilities, as it is the case of batteries. It is usually referred to as Voltage Source Inverter (VSI) and can also incorporate grid supporting functionalities for voltage and frequency regulation, as discussed in next subsection.
Following the two possible strategies for power electronic inverters control, two operational strategies have been proposed for MG islanding operation, which are dependent on the number of grid-forming inverters connected to the system [35]:
• Single Master Operation (SMO) where the MG operates with only one grid-forming inverter. The other inverters are controlled as grid-feeding inverters coupled to non-controllable or controllable MS.
• Multi-Master Operation (MMO) where the MG operates with more than one grid-forming inverter. This strategy can be applied when the MG integrates more than one fast acting storage unit.
The MG is composed by several inverters coupling distinct DER and following different control strategies. The coordination between them is achieved through the MG management and control architecture, which is described in next subsection.
2.2.3 MicroGrid Management and Control Architecture The MG main objective is to supply electrical and/or thermal loads and accommodate the power generation from MS. However, the controllability of MG resources will likely be limited by commercial contracts with energy service providers. In order to solve technical restrictions (e.g. voltage problems, congestions) and enable MG emergency operation, the MG resources can provide a set of ancillary services: local voltage and frequency support, minimization of energy losses and provision of congestion relief. In this case, these services can be negotiated in an electricity market [15], [25], [28].
The provision of ancillary services is only possible thanks to the MG management and control system, which enables real-time monitoring and control of the resources connected downstream and interacts with external entities namely the DMS, electricity markets and agents. The MG management and control system is assumed to be organized under a hierarchical structure, starting from the grid-coupling devices control level to the MV/LV substation. As shown in Figure 2.3 the system is organized in a network of local controllers headed by the MG Central Controller (MGCC). Considering the different MG actors, there are

Chapter 2 – State-of-the-Art
53
three types of local controllers: the Load Controller (LC), the MS Controller (MC) and more recently the EV Controller (VC) [35], [15]. The controllers act as interfaces to locally control loads, EV charging and MS active and reactive power [35].
The MGCC is installed at the MV/LV substation and concentrates the high level decision making for the technical and economic management of the MG, being responsible for coordinating all the MG resources. The MG local controllers will periodically send to the MGCC information related with power consumption, generation, voltage and other data. The MGCC will then filter and process the information in order to manage the MG operation and interact with the distribution higher control levels and possibly with electricity markets.
Figure 2.3. Interaction model between the MG controllers, DMS and market operators.
2.2.3.1 MicroGrid Interface with DMS The MGCC ensures the interface with the higher control layers of the distribution system, namely with the MMG or directly with the DMS. When the MMG concept is adopted, an intermediate control level is implemented at the MV level, which manages the MV resources and the MG connected downstream. The MMG is headed by the Central Autonomous Management Controller (CAMC) installed at the distribution substation. The CAMC can incorporate some of functionalities which are usually implemented at the DMS, namely state

Chapter 2 – State-of-the-Art
54
estimation, power flow algorithms and active management algorithms for coordinated voltage control [29], [69]. Similarly to the MG, the MMG can also operate in islanded mode through the control of the resources connected downstream. In case the islanding fails or a general blackout occurs, the CAMC will launch a restoration procedure in order to restore service at the MV network [36].
The MGCC is responsible for the monitoring and technical management of the LV distribution network and will send to the upper control layers information related to the MG operating state. The CAMC or the DMS may also request the MG the provision of some ancillary services, in order to solve technical restrictions occurring in the MV network (voltage limits, feeders’ congestions and reactive power support). During islanding, the MGCC will communicate with the upper control levels in order to enable the synchronization process with the main grid [35]. Also, MG local restoration procedure will be only activated if there isn’t any alternative to supply the LV system [36].
2.2.3.2 MicroGrid Interface with Electricity Markets The interaction of MG with electricity markets will depend on the MG business and ownership model. In utility owned MG, the implementation of optimal dispatch functionalities will be more complex, since the MS and loads control are limited by individual commercial agreements. Direct control of MS and loads may be implemented through grid code requirements or by purchasing the ancillary services in electricity markets [28]. During islanding, overriding market operation in order to control the MG resources is particularly important. In this case, the MG control system has to be able to dispatch the MS for secondary frequency control and implement load shedding [28], [35].
In non-utility business models the MG will operate as a MV consumer and the MGCC may act as an aggregator of individual loads and MS, being responsible for interacting with electricity markets or agents [70], [71], [72], [73]. The dispatch of MG loads and MS may then be implemented using centralized optimization algorithms housed at the MGCC, as in [72]. Alternatively, a distributed approach based on Multi-Agent Systems (MAS) concept can be adopted [70], [73], where the local controllers take the lead role of optimizing the MG operation from both technical and economic point of view. In the distributed architecture proposed in [70], [71], [73], the MC will compete/collaborate in order to optimize their production to supply loads and maximize the power export to the upstream network. The MGCC will then negotiate with the market operator in order to ensure the best energy prices and after the negotiation period registers the final power exchanges between the agents.
2.2.3.3 MicroGrid Control and Management As shown in Figure 2.3, the MG is divided in two main layers constituted by the MGCC and the local controllers. The intelligence/autonomy level attributed to each layer may vary according to the group of functionalities to perform. Considering the technical and economical operation requirements, the MG control functions can be divided in two groups: long-term energy management and short-term balancing. The functions were classified in [73] according to the objectives and time-frame of the control functions. The MG restoration procedure was also added as an additional tool, since it falls outside the two categories:

Chapter 2 – State-of-the-Art
55
• Long-term energy management tools which will be responsible for dispatching MS, loads and control the power flow between the MG and the main grid. These functionalities are mainly applicable for MG interconnected operation and may be performed based on a multi-objective problem considering technical, economic and environmental objectives. The dispatch can be performed based on a centralized or distributed strategy. In a centralized control, the optimal power dispatch is performed at the MGCC and the resulting set-points are sent to the MC and LC in order to change the MS power output and/or to connect/disconnect controllable loads [69], [73]. In a distributed approach the power dispatch results from a negotiation process between the MG local controllers, acting as intelligent agents [73]. In both approaches, the MGCC will be responsible for monitoring the MG, receiving periodically relevant information from the local controllers such as power consumption, node voltage and other relevant data. Based on that information, the MGCC may include load and microgeneration forecasting tools [73].
• Short-term balancing tools, responsible for the ensuring frequency and voltage stability of the system due to disturbances, including islanding. Control functionalities include frequency and voltage regulation, load following capability, power quality compensation and load shedding schemes [35], [41], [42].
• Security Assessment tools have also been referred as basic functionalities of the MGCC, in order to identify if the MG is operating in an insecure operating point, which in case of an unplanned islanding could lead to the system collapse. A dynamic security assessment algorithm was proposed in [74] which based on the MG operating conditions and in an artificial neural network estimates if the MG has sufficient storage capacity to ensure a secure islanding. In case the MG is considered insecure preventive load shedding is implemented to reduce the power disturbance during the islanding.
• MG restoration procedure will be triggered by the MGCC when the MG islanding fails or a general blackout occurs. The algorithm was first proposed in [36] and consists in a fully automatic procedure to restore service locally based on the coordination of local resources. During the procedure short-term balancing tools are required to ensure the stability of the system.
The different types of functionalities will be implemented in the MG control layers, depending on the time-frame of the control. Long-term tools require higher processing capabilities being usually implemented at the MGCC, while short-term balancing tools such as primary frequency and voltage regulation, harmonic compensation and load shedding schemes are expected to act in a very short time-frame, being mostly implemented at the MG grid-coupling inverters or at the local controllers.
In [42], authors have proposed a hierarchical multilevel control for the MG control system, considering the time-frame of control action, similarly to the load-frequency control defined by the European Network of Transmission System Operators (ENTSO-E) [75]. ENTSO-E architecture represented in Figure 2.4 is designed to ensure frequency regulation. However, within the MG concept voltage regulation is also included, since it will depend mainly on the control of the grid-coupling devices. The architecture was divided in four levels:

Chapter 2 – State-of-the-Art
56
• Level 0 – Inner control loops. Includes the voltage and current control loops of the MG grid-forming and grid-feeding inverters.
• Level 1 – Primary control. The main objective is to maintain the balance between generation and load. Harmonic and voltage unbalance compensation schemes could be included at this level.
• Level 2 – Secondary Control to restore frequency and voltage to nominal value. Within the MG context it can also include a synchronization loop to reconnect the MG to the main grid.
• Level 3 – Tertiary Control, which controls the power flow between the MG and the grid.
Figure 2.4. ENTSO-E control scheme and actions starting with the system frequency [75].
The architecture proposed in [42] envisions a MG operating exclusively with grid-forming inverters, as proposed by CERTS MG concept [32]. Grid-forming inverters require a stiff DC source being usually coupled to fast acting storage devices. However, the integration of storage may be limited, being the majority of the inverters connected to the MG controlled as grid-feeding inverters. In [35] authors propose a control framework coordinating the operation of both grid-feeding and grid-forming inverters:
• Primary frequency control (Level 1) is performed by the MG storage(s) unit(s) coupled to grid-forming inverter(s), responsible for primary frequency control.
• Secondary Control (Level 2) can be performed by grid-feeding inverters and/or by grid-forming inverters coupled to MS with DC storage. The main objective is to correct the frequency error resulting from primary control by changing the power output of controllable MS, independently of its mode of control.
Level 1 – Primary control As mentioned earlier, MG power electronic interfaces can be explored in order to provide grid support, ensuring frequency and voltage regulation as well as additional power quality enhancements. This is particularly important when the MG operates autonomously, thus requiring local frequency and voltage regulation mechanisms.
System Frequency
Primary Control
Secondary Control
Sched./ Direct Tertiary Control
Time Control
Activate
Activateif responsible
Correct
Activate on long-term
Free reserves
Free reservesafter outage
Take over
Free reserves
Restore mean value

Chapter 2 – State-of-the-Art
57
The adoption of droop control functionalities in grid forming inverters for primary frequency and voltage regulation has been proposed in CERTS MG and European MG concepts [32]-[35]. The main objective is to emulate the behaviour of synchronous generators by establishing the system frequency, according to the active power output (P-f droop) and the voltage magnitude according to the reactive power output (Q-V droop) [35], [41], [42], [76]-[78]. When a disturbance occurs, the MG frequency will reflect the power unbalance between the local generation and load and the grid-forming inverters will adjust its power output based on their droop characteristics. The main advantages of the droop strategy is that it ensures a good load sharing between the grid-forming inverters, without requiring fast communication infrastructures between the inverters [35], [77], [78]. However, some disadvantages have been identified regarding droop strategies [79], namely:
• Active power–frequency droop (P-f droop) imposes a permanent frequency error which has to be corrected through additional control functions.
• Droop control assumes that the coupling impedance between the inverter and the MG is mostly inductive. However, MG feeders usually have high R/X ratio which mean that the decoupling between active power and voltage no longer is verified. This means that the reactive power control will have a limited effect on voltage.
The first issue can be solved by adopting a secondary frequency control strategy taking advantage of the reserve capacity of MS. This is in fact a similar strategy to conventional power systems. For the second issue, alternative droop methods have been proposed in the literature for dealing with the coupling between active power and node voltage magnitude. A detailed review of those methods is provided in [79]. The three more relevant strategies are identified below:
• Reverse power droops: P-V and Q-f droops have been demonstrated through numerical simulation in [80]. However, the strategy was tested considering only a SMO mode. Consequently, load sharing using opposite droops was not demonstrated. This strategy enables direct voltage regulation. However, it doesn’t allow for power dispatch. Loads would be supplied by the nearest generator. Therefore, no proportional load sharing would be obtained [78].
• Compensation of line impedance effect. In [81] no decoupling between active and reactive power is considered. The MG frequency and voltage is determined based on the droop coefficients and considering the R/X ratio of the line impedance, which can be difficult to determine. Virtual impedance methods have been also proposed in [82] and [83]. In [82] a virtual inductance is introduced in order to decouple active and reactive power and enable the adoption of conventional droop, even for high R/X ratio. In order to enable a proportional share of reactive power, a compensating term is added to the Q-V droop, reflecting the effect of the line voltage drop and local load effect on voltage. The implementation of this method requires determining droop coefficients as a function of the voltage at the MG Point of Common Coupling (PCC). However, it is not clear that the introduction of additional MS and loads changing voltages in the MG feeder would produce such an equal sharing of reactive power. In [83] authors propose adjustable virtual impedance, which can operate either as a resistor or as inductance, according to the line X/R ratio. Adding inductive impedance allows the implementation of conventional droops and adds a reactive power term

Chapter 2 – State-of-the-Art
58
which is able to compensate the reactive power mismatch between the inverters and line impedance effects. As discussed in [84], a virtual resistor is implemented to control the output reference voltage of the VSI. Increasing the output voltage will increase the power output of the inverters. Similarly to [82], a simplified model and test system are adopted in [83], [84] in order to demonstrate the effectiveness of such strategies. However, the applicability of this approach and the effective determination of the controller parameters (particularly the virtual impedance) have not been demonstrated for MG systems composed by long feeders and integrating several PQ inverters in parallel.
• Power-angle droop control was proposed in [85], [87]. The VSI active power output is controlled through the voltage angle, without changing the frequency of the system as in conventional droop strategy. The implementation of this method requires a Global Positioning System (GPS) signal for angle referencing. This can be considered the main disadvantage of this strategy, since losing the GPS signal will compromise proper load sharing between the VSI and consequently the stability of the MG system during islanding.
Additional changes to conventional droop controllers have been proposed to deal with non-linear loads [81], [86], improve small signal stability [87] and increase inertia of the system [88].
Level 2 – Secondary control Secondary control can be performed locally by each controllable MS based on local frequency measurement or by a centralized algorithm housed at the MGCC. Local secondary control reduces the communication requirements between the inverters [89]. However, it may impose stability concerns requiring the coordination of the local controller’s parameters.
Centralized strategies such as the ones propose in [89] allow the dispatch of the MS based on Optimal Power Flow formulations and take advantage of the processing capabilities of the MGCC. In [91] authors propose an optimal power dispatch for droop controlled generators. The optimal power outputs are implemented by changing the droop parameters, ensuring that they are able to maintain the system stability and achieve the desired level of damping. The optimal power dispatch algorithm is complemented by two additional tools: the droop stability analysis which defines the stability region of the MG operation and the droop selection tool. The strategy was tested experimentally in a laboratory scale MG composed of three 10 kW DC/AC inverters coupled to DC voltage sources and controlled through droop functions.
Level 3 – Tertiary control The tertiary control in Level 3 proposed in [42] is limited to the control of the power flow with the upstream network, by changing the power output of the VSI connected to the MG. However, as discussed previously, advanced optimization tools can be included at this level in order to optimize the MG operation in interconnected mode, ensure adequate reserve capacity and the overall security of the MG. The output of such functionalities includes the dispatch of controllable MS and controllable loads.
The MG islanded operation may last for several hour or days. Storage, controllable generation and loads are essential resources to ensure the stability of the system and avoid its collapse

Chapter 2 – State-of-the-Art
59
due to local disturbances. High level supervisory management of the system may be required to manage the network in islanded mode, while ensuring adequate reserves. In [91] authors propose an algorithm to perform the optimal dispatch of MS and storage in islanded mode, after primary and secondary control stabilizes the MG voltage and frequency. The main objective of the algorithm is to minimize the MG operating cost and CO2 emissions. Storage will absorb the excess power from RES in periods of low demand and inject the additional power to allow non-renewable based generation to operate at optimal conditions. However, security constraints such as storage and controllable generation reserve requirements were not considered. These two variables are essential in order to maintain the stability of the islanded system.
Security assessment procedures may also be included at the tertiary level, such as the algorithm proposed in [74]. The algorithm estimates the MG security index and defines if necessary a load shedding strategy to reduce the energy provided by the MG storage during an unplanned islanding. However, MG security can be compromised due to a variety of disturbances occurring after the islanding transient, requiring preventive plans to coordinate the resources during the islanding operation.
2.2.4 MicroGrid Power Quality The MG as part of distribution network has to comply with current power quality standards independently of operating interconnected or islanded from the MV network. European standard EN50160 establishes the voltage supply steady-state characteristics in terms of magnitude and frequency and imposes limits on the magnitude and frequency of specific disturbances, such as harmonics, voltage unbalance and voltage sags, among others [92]. The standard does not apply under abnormal operating conditions such as faults or temporary power shortages, which considering MG operation would probably lead to the MG islanding. This means that the standard is not applicable during islanding transient or other disturbances occurring due to faults occurring in the LV network. Otherwise, in steady state conditions MG will have to comply with EN50160 standard.
As discussed previously, the low inertia of the system requires the adoption of specific strategies for ensuring frequency regulation, exploiting controllable resources such as storage and controllable microgeneration and their grid-coupling devices. However, other characteristic of MG system such as low short circuit power and LV feeders’ low X/R ratio will impose additional power quality challenges such as:
• Steady state voltage variations. Voltage regulation problems can arise from the large scale integration of microgeneration and EV. The low correlation between RES based generation and load may cause extreme operating scenarios, where the network is operated close to its technical limits. High penetration of microgeneration in LV feeders in off peak hours may cause voltage rise problems [93], [94]. On the other hand, EV charging at night may increase feeders loading and consequently leading to large voltage drops [14]-[13].
• Voltage unbalance is usually originated in LV networks due to the uneven distribution of single-phase loads and generation by the three-phases of the system, causing non-equal currents to flow in the phase and neutral conductors and consequently unsymmetrical voltage drops [95]-[96].

Chapter 2 – State-of-the-Art
60
• Harmonic distortion. Non-linear loads and the grid-coupling interfaces of microgeneration, storage and EV are the main source of harmonic emission. Adequate filters are usually employed to mitigate harmonic emission. This topic will not be covered in this thesis.
2.2.4.1 MicroGrid Voltage Regulation The large scale integration of microgeneration and EV requires the development of new strategies to be implemented at the LV network. Traditional methods to regulate voltage in distribution networks are implemented at the distribution substations, through automatic voltage regulation acting in transformer tap changers and reactive power compensation. However, voltage is a local problem, requiring the adoption of voltage control strategies at LV networks in order to ensure an adequate voltage profile when dealing with the large scale integration of EV and microgeneration [8], [9],[13]-[15], [69].
The voltage drop in a feeder, such as the one represented in Figure 2.5, can be determined as in (2.1).
Figure 2.5. Simplified circuit of LV feeder.
0, 211
21 ≈−+
≈−=∆ θθV
XQRPVVV
(2.1)
In order to ensure that voltage at the consumers’ node (V2) is within limits, three strategies have been proposed:
• Network reinforcement. Increasing the cross section of LV feeders increases its power capacity and decreases the conductors’ impedance, consequently decreasing voltage drop effect. However, grid reinforcement investments can become significant in scenarios with a large share of microgeneration or EV integration.
• Deployment of on-load tap changers at the MV/LV substation. The strategy is similar to the one used at distribution substations, changing the transformer ratio in order to maintain voltages in the LV bus within admissible values. This solution requires additional investments from utilities and may not be sufficient to ensure adequate voltage magnitudes at the end of the LV feeders.
• Regulating the output power of MS can contribute to maintain voltage within admissible limits [96]. Reactive power control strategies were proposed in [97]-[99]. These strategies can produce effective results in LV feeders with low R/X ratio as derived from (2.1). However, as the resistance of the feeders increase (for example in the end of the feeder), higher is the amount of reactive power required to regulate voltage, limiting the inverters capacity to inject active power [99]. In such cases controlling the MS active power would be more effective. However, it would limit the
11 θ∠V 22 θ∠V
R X
P,Q

Chapter 2 – State-of-the-Art
61
power that could be injected by the MS. When operating islanding, the control of MS active power in order to regulate voltage will have to be coordinated with frequency regulation strategies, since it would change the reserve requirements of controllable MS providing secondary frequency control.
2.2.4.2 MicroGrid Operation under Unbalanced Conditions As mentioned before, the main cause for voltage unbalance in distribution networks is the uneven distribution of single-phase loads by the three phases of the system. The uneven currents flowing in the three-phases of the system will cause uneven voltage drops along the LV feeders. A current will also flow in the neutral conductor. The problem may even be accentuated by the large scale integration of single-phase microgeneration and EV.
The analysis of power systems under unbalance conditions is usually conducted by considering Fortescue transformation, where the three-phase voltage phasors are decomposed in their symmetrical components (i.e. positive, negative and zero sequence), using the transformation matrix in (2.2) [100]. The same transformation can be used for currents.
32
2
2
0
,111
11
31 πj
c
b
a
eaVVV
aaaa
VVV
=
=
−
+
(2.2)
Where,
aV , bV , cV - Three-phase phasor voltages +V , −V , 0V - Positive, negative and zero sequence phasor voltages
a - Rotational operator of Fortescue transformation
In normal operating conditions, the large synchronous generators connected to the transmission system ensure a symmetrical voltage output, only producing positive sequence voltages. If the system impedances and currents drawn by the loads are balanced, only positive sequence currents will flow in the network. Otherwise, the positive sequence currents flowing in an unbalanced system will produce negative and zero sequence voltage drops.
LV networks usually have a three-phase four-wire configuration. When operating under unbalanced conditions, different line currents will flow in the phase lines and the neutral current will be different from zero, as in (2.3).
0.3 IIIIII
n
cban
=++=
(2.3)
Where,
aI , bI , cI - Three-phase phasor currents
nI - Neutral current
0I - Zero sequence current
The negative and zero sequence components in voltage and currents will adversely impact the operation of the LV system, regarding namely:

Chapter 2 – State-of-the-Art
62
• Induction motors – the negative voltage component produces a torque in opposition to the desired positive torque, reducing the resulting torque and speed. Also, negative voltage component in voltage supply will produce large unbalanced currents, which increase the motor temperature and losses due to a reduced negative sequence impedance of the machine [39]. Zero sequence voltages or currents from the supply will not affect induction motors, since they usually have three-phase three wire delta or wye connections.
• Three-phase power electronic loads – may experience increased harmonic distortion and excessive currents in some of the phases due to unbalanced voltage supply, which can trip overload-protection, cause excess heating of electronic components and decrease the life of the capacitors [39].
• Single-phase loads – the difference in phase voltage magnitudes due to voltage unbalance decreases the effectiveness of voltage control strategies. Depending on the network operation conditions, voltage problems may occur only in one phase, while the others remain within limits. Alternatively, if an extreme scenario is considered, overvoltage may occur in one of the phases while in others voltage is below admissible limits.
• Power system operation – the existence of a negative and zero sequence currents reduce feeder’s capacity and increases power losses and heating. Also, some stability problems may occur during some disturbances such as load changes or short-circuits [39].
According to the European Standard EN50160 [92], voltage unbalance due to the negative sequence voltage can be measured by the Voltage Unbalance Factor (VUF) determined by (2.4). Similarly, one can define zero sequence VUF as in (2.5).
%100⋅=+
−
VVVUFneg (2.4)
%1000
0 ⋅=+V
VVUF (2.5)
Where,
negVUF - Negative voltage unbalance factor (%) −V - Magnitude of negative sequence voltage (V) +V - Magnitude of positive sequence voltage (V)
0VUF - Negative voltage unbalance factor (%) 0V - Magnitude of zero sequence voltage (V)
The voltage should be measured at customers’ point of interconnection with the distribution network. According to European Standard EN50160 voltage unbalance is evaluated using a statistical approach. The magnitude of negative sequence voltage component is determined by the average value over a fixed 10 minute interval [92]. In order to comply with the standard, negative sequence VUF should be within 2%, during 95% of a one week observation period. No limits are imposed to the zero sequence voltage unbalance factor.

Chapter 2 – State-of-the-Art
63
2.2.4.3 Voltage Balancing Strategies The solutions for voltage balancing usually imply load balancing. The different solutions that can be adopted for voltage balancing are identified below.
Reconfiguring distribution network Voltage unbalance is dependent on the network operating conditions. Adequate planning of distribution network by promoting an even distribution of single-phase consumers by the three-phases of the system will contribute to reduce the voltage unbalance. However, promoting an adequate planning of the LV network when considering the penetration of microgeneration and EV becomes quite challenging, due to the variability and uncertainty associated to these units [16]. Manual and automatic reconfiguration of the network could also help balance the system [39]. However, this solution may be unfeasible from both economic and technical point of view, since it would require significant investment on network switching equipment.
Installation of specific voltage balancing equipment Specific voltage balancing equipment may also be installed in order to compensate the unbalance produced by a load or to compensate the unbalance of voltage supply [95]:
• Compensation of unbalanced load. Both static shunt compensators and shunt Active Power Filters (APF) have been reported for balancing large industrial loads such as AC rail traction or induction furnaces [39], [95], [101]-[103]. A Distribution Static Synchronous Compensators (DSTATCOM) was specifically developed for distribution networks, for load balancing, reactive power compensation and harmonic filtering [101]. DSTATCOM is a current controlled voltage source shunt inverter which produces three independent currents in order to produce sinusoidal current drawn from the network. The main difference between the STACOM and the DSTATCOM is related to its controls. A DSTATCOM includes voltage balancing and harmonic compensation signals, while such functionalities are not required in STATCOM applications [101], [103].
• Balancing voltage supply. Some sensitive loads may require compensating the voltage unbalance resulting from the grid supply. In order to balance voltage supply a series static compensator is usually considered. The inverter is connected between the source and the load by means of a transformer, operating mainly as a voltage regulator and harmonic isolator between the unbalanced voltage supply and the consumer. This type of filter is usually controlled in order to compensate the fundamental frequency positive, negative and also zero sequence voltage components, producing a set of balanced three-phase voltages [101].
The compensation principle of static and APF is to add a set of compensation currents in order eliminate negative and zero sequence components produced by the unbalance source, as in (2.6).
=+==+=
+=
acCcLc
abCbLb
aCaLa
IaIIIIaIII
III2 (2.6)

Chapter 2 – State-of-the-Art
64
Where,
aI , bI , cI - Compensated current (A)
aLI , bLI , cLI - Unbalance source current (A)
aCI , bCI , cCI - Compensation Current (A)
a - Rotational operator of Fortescue transformation
Consequently the compensator modifies the equivalent impedance of the unbalance source as in (2.7).
+=
+=
+=
cCcLc
bCbLb
aCaLa
YYZ
YYZ
YYZ
1
1
1
(2.7)
Where,
aZ , bZ , cZ - Load equivalent impedance at the PCC.
aLY , bLY , cLY - Unbalanced Load admittance
aCY , bCY , cCY - Compensation Load admittance
Contrary to static compensators, APF are controlled voltage sources or current sources, which emulate the characteristics of a variable reactance. This improves the performance of the compensator and enables the connection of storage devices, which can be used for voltage support or power damping under fault condition. APF can be classified according to the converter topology, namely as shunt, series or a combination of both, which is usually designated as Unified Power Quality Conditioner (UPQC) [64]. The series-shunt APF or UPQC combines the compensation objectives of both series and shunt devices [101]. It can eliminate voltage and current harmonics, while providing adequate power supply to sensitive loads by balancing voltages supply. The main disadvantages are its high cost and control complexity.
Voltage balancing mechanism provided by MG power electronic interfaces The MG as a LV system connecting mainly single-phase residential, commercial and small industrial customers requires alternative strategies to comply with power quality standards. Adopting the MS voltage regulation strategies previously discussed will help maintain voltage close to nominal value, consequently contributing to reduce voltage unbalance. However, such strategies imply either to curtail power or limit the dispatch capability of the grid-coupling inverters, in order to absorb a high amount of reactive power.
Static and APF solutions can be expensive and complex to implement being applicable mainly for industrial loads which are connected to the High Voltage (HV) or MV networks. More recent work implements active power filtering strategies at the MG grid-coupling inverters, avoiding further investments for the installation of conventional compensators or in reconfiguring the network. Two main APF topologies have been proposed in literature [104]:

Chapter 2 – State-of-the-Art
65
• Microgrid Power Quality Conditioner (MPQC) with a similar topology to conventional UPQC [104]-[107]. However, the capacitor in the DC bus is replaced by the DC MS and/ or energy storage. Contrarily to conventional UPQC, the shunt converter will be responsible for maintaining balanced voltages and for power dispatch during islanded operation, considering the storage unit. The series converter will operate as a controlled current source for regulating current harmonics, unbalance and the power flow between the MG and the MV network. During fault conditions or voltage sags, the series converter will also limit line current in order to avoid damaging power electronic components.
• Shunt VSI coupled to distributed generators with voltage balancing mechanisms. Voltage balancing can be ensured by compensating negative sequence currents [108] or by changing the voltage reference of the VSI [109], [110]. Voltage compensation control such as proposed in [109], [110] may be preferable than current balancing strategies, since under severe unbalance conditions a large amount of the inverter capacity is used for the injection of negative sequence current compensation, limiting the dispatchable capacity of the DG.
Figure 2.6 shows the different topologies proposed for MG power quality enhancement. The microgeneration source or/and storage are connected to the DC bus of the compensators. As proposed in Figure 2.6 c), the series converter can be installed at the MG point of interconnection with the upstream network, operating as a solid state switch coupling the two systems [105]. In case of islanding, the series converter disconnects from the main grid and the shunt inverter operates has a VSI, ensuring power balance and voltage regulation. The series and shunt converter can be either connected to the same source or to independent sources, as proposed in [105].
Comparing the two main solutions presented for voltage balancing within the MG, shunt VSI are less complex and inexpensive. Also, current balancing may not be required if voltage balancing is performed by the shunt VSI.
The shunt compensators proposed in [108]-[110] were designed to compensate for negative sequence components. In this case a three-phase three-leg inverter topology is adopted. However, in an unbalanced three-phase four-wire system, significant zero sequence currents will flow in the system. In this case, the three-leg inverter will not be capable of ensuring a three-phase balanced voltage if supplying unbalanced loads.
A three-phase four-wire structure has been proposed in [106] and is represented in Figure 2.7. The three-phase four-leg inverter provides three-phase balancing voltage independently of the loading. Similarly to what has been proposed in [107], the shunt inverter is controlled as a VSI. However, the voltage balancing mechanism compensates both negative and zero sequence voltages. Compared to MPQC topology proposed in [105] and shown in Figure 2.6 a), the series inverter is directly connected to the AC network, meaning that the inverter should be able to support high compensating voltage and currents.

Chapter 2 – State-of-the-Art
66
Figure 2.7. Three-phase four-wire MG power quality compensator (adapted from [106]).
Considering the results presented in literature, some additional research may be required in order to evaluate if such voltage balancing strategies will be able to improve the overall voltage quality of the LV network. Both series-shunt compensators discussed in [105]-[110] were tested for a single bus MG, providing interruptible power to a sensitive load and filtering harmonic and current unbalance resulting from the other loads connected outside the MG. However, the MG is composed of long LV feeders with high R/X ratio and connecting single-phase loads, microgeneration, storage and EV. Adopting a detailed model of MG system could help evaluate the effectiveness of such voltage balancing strategies.
a)
b)
c)
Figure 2.6. Converter configurations for power quality enhancement of MG: a) series-shunt b) shunt and c) series-shunt for interfacing MG with the upstream grid (adapted from [105]).
DER
Series Converter
ParallelConverter
ParallelConverter
DER
DER
Series Converter
ParallelConverter
ParallelConverter
Main GridMicrogrid
DER DER Loads

Chapter 2 – State-of-the-Art
67
2.3 Integrating Electric Vehicles in Power System Operation Plug-in EV market introduction was initiated in 2010, representing about 2% of total passenger cars in the end of 2012 [111]. The market continues to grow presenting robust rates of growth in major markets such as USA, Asia and Europe. However, in order to meet 2050 decarbonizing goals greater deployment rates will have to be achieved, requiring a stronger engagement from private and public entities in order to overcome both technological and market deployment barriers [111].
Positive signals such as the increase of new EV models available in the market and the decrease of cost of key components such as batteries, are expected to increase the level of sales. However, the solution is not exclusively at the manufacturer’s side. Developing sustainable incentive mechanisms and attractive financing mechanisms, promoting standard harmonization and development of non-residential charging infrastructures are some of the areas which can further promote EV deployment [111].
Considering the development of an adequate stimulus policy framework and a strong engagement of manufacturers, IEA BLUE map scenario estimates that in 2050 EV sales should attain a share of at least 50% of light duty vehicles sales worldwide. Consequently, the deployment of EV will increase the electricity consumption, representing in 2050 10% of the overall electricity consumption, according to IEA 2009 prospects [112].
The additional load from EV charging can impose severe challenges for the system operation, particularly for distribution networks, where they are expected to be connected. EV charging will change current load diagrams and potentially increase the system peak load, eventually requiring further investments in generation capacity and grid reinforcement. The following technical issues have to be addressed [13]-[15]:
• Congestion problems – the increase of load due to EV charging may lead to congestion problems at transmission and distribution networks, requiring further investments in grid reinforcement.
• Steady state voltages – the increase of feeders loading will result in increased voltage drops along LV feeders, potentially leading to the violation of voltage admissible limits and consequent degradation of power quality in distribution networks.
• Voltage unbalance – EV residential charging will most likely be single-phase, compatible with the majority of consumers’ facilities. An uneven distribution of EV charging load by the three phases of the system may cause or accentuate voltage unbalance problems, deteriorating power quality in LV networks.
• Power system stability – there is some uncertainty related to the load from EV charging, since it will depend on the moment of connection to the network. In a worst case scenario the system may not have sufficient generation capacity to deal with the sudden increase of the load from EV charging. Further investments for increasing reserve capacity may become necessary.
• Energy losses – the operation of the transmission and distribution network close to maximum feeders current may increase energy losses decreasing the system efficiency.

Chapter 2 – State-of-the-Art
68
• Increase of CO2 emissions – the increase of peak load and the uncertainty of EV load can increase the need for fast-response generation and the dispatch of high pollutant generation, leading to an increase of CO2 emissions. In order to avoid this, the electrification of the transportation sector as to be accompanied by the increased deployment of renewable based generation.
The development of active management strategies for EV charging can help mitigate the technical impacts identified above [13]-[15]. EV charging management usually focuses in load-shifting, promoting EV charging during off peak hours. By providing adequate incentive mechanisms, off-peak charging would avoid the increase of peak load and decrease the down regulation requirements [14]. However, EV can be regarded as a DER, having the potential to contribute to provide some degree of flexibility for optimizing network operation, while providing additional grid supporting services, which will benefit the system operator and also EV owners through additional revenues [113]-[116].
The potential of EV to operate as grid supporting units was proposed by Kempton et al. in [113], [114]. Authors have introduced the Vehicle-to-Grid (V2G) concept, where the EV is envisioned not only as flexible load but also as a distributed storage unit, capable of injecting power into the grid. Since the vehicles are likely to be parked during the majority of the day, if connected to the system they could provide peak power, improve regulation [113] or even support the integration of RES such as PV and wind [115].
MG and MMG concepts provide the adequate framework for the safe integration of EV in distribution networks, enabling the implementation of active management strategies designed for the EV. The active management of EV charging through the MG and MMG concept will enable solving possible technical challenges resulting from EV charging locally and also take advantage of EV load flexibility and V2G capabilities to develop key self-healing strategies at the LV and MV networks [15].
Recognizing the challenges and opportunities of EV deployment, three strategic R&D projects were launched in Europe dedicated to the integration of EV in the power system operation and electricity markets:
• Grid for Vehicles (G4V) project was an 18 month project which ended in 2011. Its consortium was mainly composed by European utilities [117]. The project focused in the technical impacts of EV charging strategies in order to assess the adequacy of European distribution networks. Based on load flow studies the impact of different EV charging schemes were tested in more than 200 real networks. The results have shown that the implementation of charging control strategies may postpone grid reinforcement, particularly if the DSO has the possibility of directly influence EV charging behaviour when grid constraints are detected. In order to reduce investments on ICT and promote interoperability, the implementation of such functionalities should be coordinated with EV and SG deployment [117].
• Mobile Energy Resources in Grids of Electricity (MERGE) project was a two year project launched in 2010, dedicated to the development of a framework envisioning the large scale integration of EV in power system operation and electricity markets [22]. The first phase of the project focused on the identification of technical requirements for

Chapter 2 – State-of-the-Art
69
interfacing EV with the electric power system, driving patterns and communication requirements. Based on an initial survey, the project identified potential smart control approaches for EV charging considering MG and MMG concepts and the integration of RES [26]. One of the most important contributions of the project was the definition of a management and control reference architecture, integrating EV in both technical operation and electricity markets [26]. In order to study the impact of EV charging in the technical and economic operation of power systems both steady-state and dynamic analysis tools were developed including the EV models and charging infrastructures derived in the project context [118].
• The Green eMotion project was launched on March 2011 within the context of the European Recovery Plan [119]. The main objective of the project was to define Europe-wide standards for electromobility, taking account smart grid developments, innovative ICT solutions, different types of EV and urban mobility concepts [120].
As mentioned earlier, following European research lines two Portuguese projects fully dedicated to the integration of EV in power system were also launched: 1) REIVE Project (Intelligent Grids with Electric Vehicles) [45] and 2) MicroGrids+EV – Identification of Control and Management Strategies for Microgrids with Plugged-in Electric Vehicles (MG+EV) [46]. Within the framework of REIVE project, innovative tools were developed to identify the impacts of the microgeneration and EV charging strategies in the Portuguese electricity system. The results presented proved that microgeneration and EV integration might bring important technical benefits to distribution grids, namely if the EV deployment is accompanied with the implementation of controlled EV charging schemes [45]. The SGEVL was built at INESC TEC facilities in the context of the project. The main experimental contributions were the development of a set of hardware and software prototypes, incorporating the advanced grid supporting functionalities developed [45].
The project MG+EV was a 36 month project initiated in 2011, dedicated to the development of new functionalities for the MG emergency operation considering the active integration of EV by exploiting V2G concepts [46]. The unbalanced nature of the LV system was taken into consideration in order to evaluate the effectiveness of emergency control solutions and at the same time develop voltage balancing strategies, which could help improve power quality in LV networks with high penetration of single-phase EV chargers and microgeneration units [46].
Based on the outcomes of the projects referred above, this section describes the latest developments on the integration of EV in power system operation. Sections 2.3.1 and 2.3.2 characterize plug-in EV technologies and charging infrastructures. Section 2.3.3 analyses the interaction of EV with the grid and presents the frameworks developed for the integration of EV in power system operation and electricity markets. Based on the developed frameworks several different types of charging strategies and ancillary services have been derived. This is discussed in section 2.3.4. Finally section 2.3.5 focuses on the MG operation with EV, discussing the benefits and challenges which need to be addressed.
Chapter 2 – State-of-the-Art
70
2.3.1 Plug-in Electric Vehicles Technology Plug-in EV family includes Battery EV (BEV) and Plug-in Hybrid EV (PHEV). BEV is powered exclusively by the battery pack, while PHEV has an Internal Combustion Engine (ICE), extending the EV autonomy [121]. Compared to the PHEV, the BEV has reduced autonomy due to the absence of the ICE. Depending on the model, electric range can vary from 20 to 426 km, as in the 85 kWh Tesla Model S first commercialized in US in 2012. However, the electric range will vary significantly with driving habits, terrain, and weather conditions and with the additional load from the number of passengers, heating and air conditioning [122]. As expected, as the range capacity increases so does the purchase price.
The EV battery charging system will interface the EV with power system. As represented in Figure 2.8, the main components of the EV charging system as well as their functionalities are:
• Battery, which provides the electricity to drive the electric motor. Lithium Ion (Li-Ion) battery technology dominates the market, due to its high energy density and storage efficiency provided with small size and low weight [121]. However, Li-Ion batteries must operate within a limited operation window, restricted by voltage and temperature conditions. Operating temperatures are usually maintained between 0 to 45ºC for charging and between -20ºC to 55ºC during discharging. Outside this range of temperatures, battery components start to degrade reducing the battery’s cycle life and potentially leading to hazardous conditions. Regarding voltage conditions, cell voltages are usually maintained between 1.5V to 4.2 V. Over discharge of battery cells will potentially result in short circuit and impose security problems. In order to maintain the ideal temperature and voltage operating range, Li-Ion batteries require individual control of battery cells [123], [124].
• Battery charger, consisting of an AC/DC power inverter, which regulates the power flow between the grid and the EV charger and a DC/DC converter to regulate the current flow to the battery. The majority of EV models have an on-board charger, for AC charging. However, it can also be off-board. Some vehicles models also include the possibility of DC charging, providing a faster charging than the AC charging, as discussed next. In this case, the DC charger is off-board and should ensure a DC voltage compatible with the EV batteries [122].
• Battery Management System (BMS), which monitors and controls the battery in order to maximize its lifetime and ensure its safe operation. BMS functionalities include charging control and other ancillary functionalities such as: monitoring of cells’ current, voltage and temperature, battery protection and thermal management and estimation of State Of Charge (SOC) and State Of Health (SOH) [125].
Commercial available EV do not allow the implementation of V2G concepts, since it only allow battery charging. In order to enable V2G concepts, the battery charger has to be updated in order to enable bidirectional power flow between the battery and grid [114].

Chapter 2 – State-of-the-Art
71
Figure 2.8. Simplified diagram of a EV battery charging system.
2.3.2 Electric Vehicles Charging Infrastructures EV charging can be performed in AC or DC mode. AC charging is available in all commercial EV and can be performed using a conventional AC outlet while DC charging is only available in some models and requires a special infrastructure with dedicated wiring and an off-board AC/DC inverter. The equipment involved in EV charging is usually referred to as EV Supply Equipment (EVSE) and includes the EV connectors, plugs and socket outlets, EV connectors, protection system, as shown in Figure 2.9.
Figure 2.9. EV charging infrastructure components (adapted from [119]).
Besides domestic charging, different business and ownership models for EV charging infrastructures have been proposed. Alternative charging infrastructures might be offered by public (e.g. municipalities) or private (e.g. businesses, employers, private parking lots) entities [121]. Four main type of EV charging infrastructures can be derived [26]:
• Domestic or public individual charging points. The EV charging is performed in AC and the individual points are connected to the LV network. Each charging point includes an associated meter, enabling individual billing for the EV charging.
• Dedicated to EV fleets, such as passenger cars, trucks or buses. In case of company owned EV fleets individual metering may not be required.
• Fast charging stations, are designed to provide a fast battery charging (i.e. time of full charging inferior to 40 min). This type of infrastructure can be deployed in conventional gas stations which are strategically located in auto ways and areas with high traffic density. These stations usually provide high capacity AC or DC charging, being connected to MV networks.
• Battery swapping stations have been proposed has an alternative to fast charging stations, to reduce the time needed to charge the EV batteries. The EV battery is exchanged by an automatic switching station in a matter of minutes, similarly to the
On-board charger (AC charging)
DC charging
Battery PackDC
AC
DC
DC
BMS
Power supply
Socket Outlet Plug Cable Connector Vehicle inlet

Chapter 2 – State-of-the-Art
72
time required to refuel a fuel tank of a passenger car. There are some standardization issues necessary for the large scale deployment of these stations. Standardization of battery size, shape and location would be required to avoid manufacturer dependent switching stations [26]. However, manufacturers probably want to avoid such standards, since this probably represents one of the most important features of EV design. Regarding power system operation, this type of charging infrastructures may represent a significant load if battery charging is performed at the station. However, considering the required power capacity these units are likely to be connected to MV networks.
The diversity of charging infrastructures and charging plugs developed by manufacturers impose several interoperability difficulties. In 2010, the European Commission mandate European Committee for Electrotechnical Standardization (CENELEC) and the European Telecommunications Standards Institute (ETSI) to develop a European common solution for the charging of EV. The standards from the International Electrotechnical Commission (IEC) IEC61851 and IEC62196 were adopted in Europe specifying the EV charging system and connection to the grid.
IEC 61851-1:2010 defines four charging modes as in Table 2.4, classified according to the type of charge, protection requirements and maximum charging current [126]. Mode 1 and Mode 2 will provide slow charging which can take from 2-12 hours depending on the charging current. The main difference between Modes 1 and 2 are the protection requirements. In Mode 1 the protection is ensured by the electric infrastructure of the household, while Mode 2 requires an in-cable protection device, which consists of a device sensitive to the residual current. Mode 3 is usually considered for public charging points. In this mode, the charging cable is permanently attached to the charging device and includes additional safety features such as overcurrent protection and pilot signal control. The pilot signal control monitors the system for verifying vehicle connection, checking for protective earth conductor integrity and establishing vehicle ventilation requirements. Mode 3 and Mode 4 can provide fast charging, providing a full charge in less than an hour.
Three types of plugs have been defined for Modes 1 to 2 according to IEC 62196-1 [127]. Table 2.5 compares the characteristics of each type of plug. Type 2 plugs have been adopted in Europe due to its increased current and voltage capacity, while type 1 is preferred in Japan and North America. The connectors and inlets for Mode 4 charging are defined by IEC 62196-3 and comprise three preferred systems and their associated plugs and connectors: CATARC, COMBO1 and 2 and CHAdeMO, which can provide currents up to 125 A at voltages up to 500 V DC.
In SG context, the EV is expected to interact with different stakeholders, requiring bidirectional communication with the power system and electricity market agents. In 2009, the International Organization for Standardization (ISO) and IEC joint working group 15118 was formed, in order to define a complementary standard to IEC 61851. The IEC 15118 specifies the communication between EV and the EVSE communication controllers during a charging session, regarding its functional specification, message protocols and physical and data link layers. However, further specification is required between the EVSE and other stakeholders

Chapter 2 – State-of-the-Art
73
such as grid operators and service providers, in order to enable the development of value added services such as the provision of ancillary services and demand side management.
Table 2.4. EV typical charging levels according to IEC61851-1 [126].
Charging Mode
Type of charge
Connection Requirement Maximum charging
current (A)
Typical charging power
Mode 1 AC slow charging
Standard domestic plug-outlets 16 3.7-11 kW
Mode 2 AC slow charging
Standard domestic plug-outlets with an in-cable protection
device 32 3.7-22 kW
Mode 3 AC slow and fast charging
Specific EV socket-outlet and plug with control and protection function permanently installed
63 ≤ 43.5kW
Mode 4 DC fast
charging External charger 125 62.5 kW
Table 2.5. Comparison of EV charging plug defined in IEC 62196-2 [126], [127].
Plug Type Connection
type Maximum Current Maximum Voltage Charging Mode
Type 1 Single-phase 32 250 1 ,2
Type 2 Single-phase 70 480 1 ,2
Three-phase 63 480 1,2,3
Type 3 Single-phase 32 250 1 ,2
Three-phase 63 480 1,2,3
2.3.3 Electric Vehicles Grid Interactions As discussed previously, the integration of EV in power system operation goes beyond the electrical connection between the EV and the EVSE. From power system point of view, the EV should be regarded as a flexible load or distributed storage unit, capable of improving the system efficiency and reliability and enabling the integration of RES. However, when connected for charging, the EV and EVSE will also interact with other actors and stakeholders, as shown in Figure 2.10. Table 2.6 summarizes the activity associated to each actor and indicates the possible stakeholders.
EV charging will have to meet primarily the EV owner charging requirements (target range, time of departure, among others). The basic level of interaction consists in the interface between the EV driver or owner with the vehicle on-board unit and then with the EVSE for charging. When charging in a public or private charging infrastructure, the interaction with an EVSE operator is required, in order to initiate the charging process and billing.

Chapter 2 – State-of-the-Art
74
Figure 2.10. Interaction of EV with distinct stakeholders (adapted from [128]).
Table 2.6. EV interaction with different stakeholders (adapted from [120]).
Roles / Actors Activity Stakeholder
EV supply equipment
(EVSE)
- Delivering energy from the premises to the EV. - May also include communication to secondary
actors (DSO, EVSE Operator, EV Service Provider)
EVSE Manufacturer
EVSE Operator
- Controlling and managing EVSE according to different business models.
- May have business relations with different, EV Service Provider (EVSP).
DSO, energy service company, municipality, other service providers
EV on-board unit - Provides access to the car data (e.g. routing,
remote diagnostics); EV Manufacturer
EV owner or fleet operator
- A person or legal entity operating one or more EV, which has a contract with EV service provider.
EV owner, car rental company, car-sharing organization, municipality
EV service provider (EVSP)
- Offers e-mobility services to the end-user.
Energy service company (utility, energy retailer), OEM, car rental company and other service provider
Distribution system operator
(DSO)
- Provides the grid connection point for the EVSE.
- Can influence charging operations to solve technical constraints (voltage, overloading).
DSO
Transmission system Operator
(TSO)
- Can influence charging operations to solve technical constraints or for the provision of ancillary services (frequency regulation).
TSO
Energy market aggregator
- Serves as the interface between the EV and electricity markets.
DSO, TSO, Energy service company

Chapter 2 – State-of-the-Art
75
Envisioning the active integration of EV in the operation of the system, different EV charging strategies and ancillary services can be outlined. In this case an additional interaction level is required involving EV service provider, energy market aggregator and the system operator (DSO and TSO). The EV service provider (EVSP) will interact with the Energy market aggregator, which will negotiate the best energy prices and ancillary service provision in electricity markets. System operators will then purchase the services in electricity markets.
However, as proposed in G4V project, a bidirectional communication and control channel between the EV and the distribution network operators may be required in order to solve technical problems [117]. The interaction between EV and grid operators has to be addressed in close coordination with SG specifications, in order to take advantage of advanced metering infrastructures. In Europe the CEN-CENELEC-ETSI Smart Grid Coordination Group is responsible for the specification of standards for the interaction between EVSE and the electricity network in collaboration with the CEN-CENELEC Electro-Mobility Coordination Group [18]. However, work is still under development.
As mentioned earlier, one of the main outcomes of MERGE project consisted in the definition of the technical and market operation architecture represented in Figure 2.11, which enables the development of new competitive services and at the same time the technical management of EV by system operators [15],[26].
Figure 2.11. MERGE technical and market operation framework for the integration of EV in power systems [15], [26].
The only entity common to market and technical operation is the EV interface, called the Vehicle Controller (VC). The VC has bidirectional communication capabilities, being able to receive control signals from the upper control levels in order to change the EV charging behaviour and send relevant information upstream for technical and market operation (e.g. battery’s SOC and owners charging preferences such as required autonomy, time of

Chapter 2 – State-of-the-Art
76
departure). For charging infrastructures dedicated to EV fleets directly fed from MV networks, a single controller was defined, the Cluster of Vehicles Controller (CVC) [15], [26].
The integration of EV in market operation is conducted by the Aggregator, which groups the charging electricity demand of individual EV and offers demand management services or other ancillary services to the electricity market. In order to reduce communication and data processing requirements, the Aggregator entity has been divided in a Regional Aggregation Unit (RAU) and the MG Aggregation Unit (MGAU). The MGAU will aggregate the information received from the VC connected at the LV networks and send the processed information to the RAU, which receives the information from all MGAU and CVC. Based on the EV owner availability to participate in demand management services and on EV load forecasting, the Aggregator will define the buying and selling bids for the day-ahead and ancillary services. Before submitting the bids to the electricity market, the DSO will have to validate them in order to avoid technical problems [15], [26].
The technical operation framework is based on MG and MMG concepts, combining a centralized hierarchical management and control structure with local control functionalities implemented at the EV grid-coupling devices. Three levels of control are defined: the DMS centralized services, the CAMC installed at the distribution substation and the MG control level constituted by the MGCC and the VC. At the MG level, the MGCC will have to include additional monitoring functionalities to track the energy consumption from EV charging as well as update the average number of EV connected to the system. This information is aggregated and sent to the CAMC, which will also include the power consumption from the CVC controllers. The data from EV charging is essential for EV load forecasting tools and for the implementation of active management strategies, for example to solve congestion or voltage problems in LV networks [15], [26].
In normal operating conditions, the technical operation framework will not interfere with EV charging control performed by the Aggregator. However, it will continuously monitor the system in order to detect possible abnormal or emergency operation conditions (i.e. congestion problems, voltage issues or even islanding). If a problem is detected the DSO will override market signals to control EV charging [15], [26].
MMG and MG islanded operation has been considered in case of severe disturbances occurring in the upstream network. In islanded mode the MMG and MG central controllers are responsible for managing the islanded system and control the EV charging directly [15], [26]. In this case, the EV is requested to participate in MG primary frequency control as explained next [15].
2.3.4 Electric Vehicles Charging Strategies and Grid Supporting Functionalities The MERGE architecture previously described enables the implementation of active control solutions for EV when connected to the system. According to [26], four different EV charging strategies can be adopted, considering the owners availability to participate in grid supporting services:
• Dumb Charging. The EV behaves as a conventional load, being the owner free to charge the vehicle in any time of the day independently of electricity prices. This

Chapter 2 – State-of-the-Art
77
charging strategy can be adopted due to the owner specific requirements or for example, when the EV battery SOC is close to the lower limit.
• Multiple Tariffs, where different electricity prices are defined considering the time of the day. Peak hours will have higher tariffs in order to incentive EV owners to charge during off-peak hours.
• Smart Charging, which consists of dedicated demand management strategies, taking advantage of the long periods the EV is expected to be connected to the system [11], in order to provide grid support while meeting the owners’ charging preferences. As proposed in [129], EV charging can be scheduled in order to flatten load diagram and shift the load of EV charging to off-peak hours, meet RES generation profiles [115] and provide additional ancillary services [15], [131]. The EV charging power can be controlled by an aggregating agent or by the DSO, in order to reduce or increase the EV charging power [15].
• Vehicle-to-Grid (V2G), introduced by Kempton at all in [113], [114], where the EV can be envisioned as small distributed storage device, being able to inject active power into the grid for providing peak power, spinning reserves, and regulation (up and down). In 2005, Kempton [130] also demonstrate the potential of EV in supporting RES such as wind and PV. In the case of PV, the EV would store the energy from the PV peak hours and then provide the power to the loads during peak load, matching the PV peak with the load peak. Regarding wind, the provision of spinning reserves and regulation could help mitigate the effects of the resources variability. Despite these possible conceptual approaches, there are some technical concerns regarding V2G related to battery degradation. Batteries have a finite number of charge/discharge cycles and its usage in a V2G mode might represent an aggressive operation regime due to frequent shifts from injecting to absorbing modes. Thus, the economic incentive to be provided to EV owners must be even higher than in smart charging approach, so that they cover the eventual battery damage [15], [113], [132].
From the DSO perspective dumb charging and multiple tariffs are uncontrollable charging modes, since the DSO has no direct control over the EV charging. The steady state analysis presented in [15] demonstrated that the adoption of uncontrolled charging strategies leads to a significant increase of the distribution networks peak power. It is expected that dumb charging makes EV load to coincide with the load diagram peak, while the multiple tariff charging scheme will originate a new peak in the load diagram which was even higher than in the dumb charging strategy. The increased load caused congestion problems in some of the MV and LV networks feeders and in some nodes voltages dropped below the minimum admissible limit. On the contrary, the adoption of the smart charging strategy increases the number of EV that could be safely integrated in the network, without imposing any technical problem. In [15] EV charging is scheduled to avoid voltage and congestion problems, respecting the owners charging requirements. In order to avoid technical problems, the charging period of 50% of the EV was shifted to off-peak hours.
Controllable EV charging strategies and V2G mode can be designed to increase the security and efficiency of the system, through the provision of ancillary services. The following set of ancillary services has been proposed in literature:

Chapter 2 – State-of-the-Art
78
Reserve Provision As previously discussed in section 2.2.3, power system frequency regulation is divided in three types: primary, secondary and tertiary control, which will act within different time frames as shown in Figure 2.12. The control is provided by mobilizing the corresponding reserves provided by the generation system and by controllable loads connected to the system [75]:
• Primary reserve is activated within seconds after the disturbance. Primary control is triggered before the frequency deviation reaches ±20mHz [75]. The control is implemented locally as part of the generator primary controller, in order to maintain balance between the system generation and load.
• Secondary and tertiary reserves are market driven services. Secondary reserve usually consists of a regulation band indicating the amount of power the generator can increase (regulation up) or decrease (regulation down). After the disturbance, they are activated automatically (after a maximum of 30s) and controlled in real-time by centralized Automatic Generation Control (AGC). Secondary frequency regulation should be completed within 15 minutes. Tertiary reserves are activated in order to support and compensate the secondary reserve, based on a contractual, market or regulatory basis.
Figure 2.12. Frequency deviation and activation of reserves according to ENTSO-E [75].
EV could potentially provide the three types of reserve. However, primary frequency control is essential for maintaining power balance between generation and load. Considering the importance of this control, in some countries such as Portugal and Spain this service is mandatory for the generators connected to the system. As the frequency variation in interconnected systems are typically very small, the provision of primary reserve by EV has been mainly considered for power systems with reduced inertia such as small islands systems or islanded MG and MMG [15], [131], [133]-[135]. In these cases, EV flexibility can provide important contributions for system stability when facing frequency disturbances caused by RES fluctuations or during the islanding transient of the MG and MMG.
In order to avoid the dependence on communication infrastructures, EV primary frequency control is implemented locally at the EV charger control system. An active power droop control strategy was adopted in order to improve MG frequency regulation capacity [15], [134], [135]. The EV grid-coupling interface will include an external control loop which will change the EV charging power based on the local measurement of frequency. If the system load is higher
Time
Secondary ControlPrimary Control Tertiary Control

Chapter 2 – State-of-the-Art
79
than the generation the frequency will decay. In this case the EV could decrease its charging power, stop charging or even activate V2G mode in order to help balance the system. On the other hand, if generation surpasses the total load the frequency will increase, the EV can start charging or increase its charging rate in order to increase the total load of the system. EV primary reserve provision through droop functions was evaluated through numerical simulation in [131]. The results show that EV improves transient stability of small island electric systems, smoothing the frequency transients caused by the variability of wind based generation. Regarding MG and MMG operation the EV participation in primary frequency regulation helps reduce the frequency excursion during the islanding transient and improve load following capability [15], [134], [135]. Details on EV frequency droop strategies will be provided in Chapter 3.
EV ancillary provision of secondary and tertiary reserves has both economic and environmental benefits, since the participation of EV might displace generation from high pollutant generation technologies, reducing CO2 emissions. In [15] the aggregated load of EV was included in AGC (via an aggregator agent) in order to participate in secondary frequency control. The TSO will negotiate in electricity markets the required secondary reserve, which includes the EV availability to reduce its power consumption. Then, based on the AGC outputs, the aggregator will send to the VC the required control signals in order to adapt the EV load charging. In [132], authors present a framework for the implementation of secondary control considering also the participation of EV fleets. However, in this case the EV are aggregated in clusters, including a large number of household appliances and CHP plants. In this case the required power response will be obtained by the coordination of the aggregated clusters.
Voltage Control EV charging will represent an additional load to the system and might contribute to increase voltage drops in LV and MV feeders. As discussed previously, due to the resistive nature of LV feeders, active power flow will have a greater influence on LV networks voltages. In [26] two strategies are proposed in order to mitigate the EV impacts on voltage profiles over LV distribution grids: one local, to be implemented at the EV charging interface and another centralized, to be implemented at the MG and MMG level. The EV local control is based on the droop characteristic proposed in [134], which controls the EV charging power based on the voltage measured at the EV charging terminals. When voltage is low, the EV charging power will decrease proportionally to the voltage, thus directly contributing for decreasing the feeders loading. On the other hand, high voltage might occur as a consequence of high power being injected from microgeneration installed along the LV feeder. In this case, based on local voltage measurement the EV charging power can be increased in order to increase feeders loading. Local voltage control will require a higher participation from the EV charging at the end of the feeders, similarly to what has been derived for microgeneration units [96]. In this case, a centralized approach might promote a more fair participation among the different resources connected to the MG and MMG systems. EV load and flexibility might be integrated in voltage control algorithms such as the one proposed in [69], [73].
Congestion Relief As mentioned earlier, when adopting smart charging strategies, EV charging can be scheduled in order to avoid technical constraints in transmission and distribution networks. However,

Chapter 2 – State-of-the-Art
80
depending on the network conditions, problems may occur due to the variability of loads or distributed generation. Therefore, the DSO has to continuously monitor the system in order to detect potential problems. In [136], a real-time procedure to help DSO to solve voltage and overloading problems by decreasing the EV charging rate was proposed. The heuristic adopted identifies the nodes and feeders with voltage and congestion problems and determines the amount of load which has to be curtailed to solve the problems. Then the algorithm selects the smart charging EV connected in that area and sends the control signal to reduce their charging rates. If this is not sufficient to solve the problems, the DSO will send a control signal to uncontrollable EV chargers to stop charging. The approach proposed in [136] have considered three-phase LV balanced systems and modelled EV aggregated load per node as three-phase. However, for unbalanced networks this approach may not lead to effective results, since the network is a three-phase four-wire system with an uneven connection of single-phase loads and EV chargers.
2.3.5 MicroGrid Operation with Electric Vehicles Within the MG system, EV charging management can be coordinated with other MG resources such as microgeneration and controllable loads in order to improve the MG efficiency and resilience [14], [15], [133]-[135]. Figure 2.13 complements the MG architecture with the EV controller, the VC, as specified in the MERGE technical framework previously discussed.
Figure 2.13. MG architecture integrating EV [134].
The provision of primary reserve and voltage control are pointed as key ancillary services for the MG operation, particularly in islanded mode. MG frequency and voltage regulation rely mainly in fast acting storage. Therefore, EV droop strategies can contribute to improve the global system dynamic behaviour and potentially reduce the need of storage capacity [133].

Chapter 2 – State-of-the-Art
81
In [134] and [137], a combined voltage / frequency control strategy is proposed based on droop control. While the frequency droop control will change the EV charging rate in order to help balance generation and load, the main objective of voltage droop is to control the EV charging rate in order to help maintain voltage within admissible limits. In [137] when the measured voltage is within the droop dead-band (±5% of the nominal voltage) only the frequency droop is active, otherwise only the voltage droop is active.
The strategy proposed in [134] is similar. However, the EV reference charging power results from both voltage and frequency droop characteristics, as in (2.8). The main objective is to give preference to frequency droop if the voltage is not high. For example, if load is higher than generation, the frequency will drop and the EV will decrease its charging rate, even if it is connected in a node where voltage is maintained in the nominal value. On the contrary, when generation exceeds load, frequency will rise and the voltages in the MG are also expected to rise. Therefore, the EV will increase its charging rate to increase the total load of the system.
( )( )
−=<−=
=otherwiseVVkP
PPffkPP
phaseVfEV
fEVfEVgridffEVEV ,
,
0_
__0_ (2.8)
The effectiveness of the strategies proposed in [134] and [137] may depend in the network characteristics and topology. For example, let’s consider a MG constituted by two feeders: one heavy loaded and other with high penetration of microgeneration. In this case, it is likely that the voltages in the second feeder rise in comparison to the voltages in the first feeder. Consequently, frequency regulation will be prone to fail, since EV charging power will be determined by the voltage droop characteristic. Additionally, the effectiveness of the control could be seriously affected under severe unbalanced operating conditions, since the voltage in one phase may not reflect the total unbalance between generation and load. In [134] an alternative centralized strategy has been proposed to control EV charging, in order to help balance load in the three-phases of the system. A real time control algorithm determines the amount of power which has to be compensated in each phase in order to balance the system and then distributes it proportionally to each EV connected to the system. However, this strategy is not compatible with frequency and voltage droops.
The provision of ancillary services has focused mainly in improving islanded operation. However, the EV primary reserve provision may help improve the MG stability during local restoration procedures. This will be discussed in Chapter 3.
2.4 Development of Active Demand Response Strategies Demand response (DR) consists of programs designed to change electricity demand in intervals from minutes to hours, in order to produce desired changes in the utility’s load shape. The DR concept was first introduced in the 70’s due to the sudden increase of the oil prices. The main objective was to minimize the systems operation costs, by reducing the fossil fuel consumption from generation units and also avoid further investments for adding generation capacity. Customers were regarded as a new utility planning option, being the utility capable of controlling directly or indirectly the consumption of electricity.

Chapter 2 – State-of-the-Art
82
The implementation of DR programs in today’s power system can have additional benefits, such as [10]:
• Improve competitiveness of electricity markets. Increasing the demand elasticity lowers the clearing market price.
• Reduce generation capacity and reserve requirements. DR strategies aiming at reducing peak load, decrease long-term reserve requirements. Additionally, the DR could provide spinning reserve, non-spinning reserve and regulation.
• Improve distribution and transmission efficiency. DR strategies can be designed to solve technical constraints (i.e. congestion problems, voltage limits violation) and simplify outage management.
• Promote the large scale integration of RES by providing the additional reserve capacity required to deal with the high variability of these resources.
DR programs can be classified according to its controllability as shown in Figure 2.14. DR resources can be dispatchable, if the changes in electricity demand are achieved directly by changing load control signals, or non-dispatchable if the load behaviour is influenced by transmitting changes in prices (e.g. time-sensitive pricing) [138]. Contrarily to dispatchable DR programs, time-sensitive pricing does not guarantee that the expected load reduction will occur, since even in high tariff periods the consumer may still choose to connect the appliance.
Figure 2.14. DR categories (adapted from [138]).
Dispatchable DR can be economic or controllable. Economic DR such as demand bidding/buyback programs encourage large customers to offer load reduction bids to an electricity market, at the price they are willing to be curtailed. If the demand-side bids are less expensive than the supply options the load will be curtailed. Controllable DR implies that the DSO or a market entity such as a load aggregator is capable of controlling individual equipment (i.e. air conditioners), being the consumer compensated by the time of disconnection. Capacity DR schemes are usually services which aim at reducing seasonal peak load, consequently displacing the need for further investment in generation reserve or regulation capacity.
The services identified in Figure 2.14 can be further characterized by the time horizon of the control and by the flexibility of the consumption which can be modified in that time range. Four time frames were identified in [139]:
• Long-term DR requires the identification of the load flexibility one year ahead, in order to provide long-term reserve to avoid further generation investments and network reinforcements.
Demand Response
Non-DispatchableDispatchable
Time-Sensitive Pricing
Capacity Ancillary
Controllable
Energy-Price
Economic
Area of interest for MG operation

Chapter 2 – State-of-the-Art
83
• Medium-term DR which is scheduled in a day-ahead basis. This usually includes services competing in electricity and reserve markets.
• Short-term DR where the load control activities are scheduled hourly in balancing markets.
• Real-time DR, where loads can be controlled in real-time for the provision of spinning reserves or other services to solve grid restrictions, such as congestion, fault or voltage problems.
Loads participation in current ancillary markets is limited to large industrial loads. However, similarly to what has been proposed for EV, residential loads could also participate in load frequency control, by providing spinning reserve, non-spinning reserves and regulation.
The deployment of ICT and SG technologies such as SM and home energy management tools is expected to enable the deployment of DR dedicated to LV consumers. The majority of thermostat controlled loads such as air conditioners, refrigerators and space and water heaters have thermal storage, while dish and clothes machine present long running cycles. Such characteristics make them good candidates for participating in DR schemes [11].
The development of real-time DR for LV consumers could help improve the MG resilience during emergency conditions, particularly to improve primary frequency regulation and reduce MG storage capacity requirements [140]. The next subsections present the framework developed for enabling the integration of household appliances in the operation of the system and for the provision of ancillary services.
2.4.1 Integrating Low Voltage Consumers in the Operation of the System Similarly to what has been proposed for the integration of EV in power system, the integration of LV consumers (residential and small commercial) in the operation of the system requires the development of an adequate technical and market framework based on the smart metering infrastructures. This was one of the main objectives of European project ADDRESS [24].
The ADDRESS conceptual architecture is represented in Figure 2.15 [24]. The central actor of this architecture is the Aggregator, which groups household appliances and acts as a mediator between the consumers and the electricity market. The aggregator is not regarded as an energy retailer selling a specific level of demand. Instead, it will sell the load flexibility (i.e. deviation to the forecasted demand) as a service to the electricity market. The aggregators will collect the availability from each consumer and control the loads based on the requests and signals coming from the different power system participants [24].
According to the project vision, the DSO will be responsible for monitoring the distribution network and ensure an efficient and secure operation of the system. Being the most probable owner of the smart metering equipment, the DSO will collect demand information and characterize the network operation state, based on state estimation algorithms. The metering information is sent to the aggregator in order to plan its market activities [24].
Direct control of the loads by the DSO was not considered as well as the provision of primary or secondary reserves or other services designed for emergency operation (islanding, MG operation), which require a fast response from loads [25]. Instead, the DSO will interact with the aggregator through the electricity market, in order to purchase active demand services,

Chapter 2 – State-of-the-Art
84
such as congestion management, voltage regulation and power flow control, tertiary active power control for tertiary reserve provision and smart load reduction, when load reduction is needed due to maintenance issues or following network failures [25].
Figure 2.15. ADDRESS conceptual architecture [24].
One of the main outcomes of the ADDRESS project relies in the specification of a new controller at the consumer premises, the Energy Box. The Energy Box can be considered an advanced Home Energy Manager (HEM) with advanced functionalities for enabling active DR schemes. As shown in Figure 2.16, the Energy Box ensures the interface with the consumer, the aggregator, DSO and household appliances. It requires a communication interface with the smart meter in order to collect periodically energy consumption information. Besides the communication interfaces, the core unit of the Energy Box includes a processing unit which runs an optimization algorithm to manage the loads and possibly coordinate them with other DER such as storage and microgeneration [25], [141].
A variety of HEM systems can be found in literature based on different communication technologies and load management algorithms. The communication technology between the HEM is likely to vary according to household appliances technology and manufacturer. Most common technologies include Ethernet, ZigBee and Power Line Carrier (PLC). Also, distinct optimization and multiple control objectives have been found in literature in order to manage loads, such as:
• Minimize energy consumption. Loads are scheduled in order to minimize the energy imported from the grid. Algorithms can schedule loads in day-ahead or in an hourly basis, based on price signals received from the DSO or aggregator, household microgeneration power forecasting and/or real-time data and storage [141]-[142].
• Maximization of owners scheduling preferences [141]. Active demand strategies have to ensure that the load control has minimum impact on consumers comfort. HEM

Chapter 2 – State-of-the-Art
85
includes a user interface which enables the integration of consumers’ comfort settings and preferred schedules for the participating appliances.
• Real-time load reduction, requested by DSO or TSO in order to solve congestion or voltage problems. This service was named smart load reduction according to the ADDRESS project [25]. A similar strategy was proposed in [143], where the HEM incorporates an algorithm which manages household power-intensive appliances in order to maintain the household total power consumption below a pre-defined demand level during an interval of time specified by DSO and considering consumers load priority and comfort preferences.
• Estimation of load availability or flexibility to provide ancillary services to the grid. As proposed in [144]-[146], the HEM may also integrate tools which estimate the availability of thermal appliances for curtailment, in order to provide ancillary services such as reserve, peak shaving, load-shifting and active distribution network management. In [144] the flexibility of loads is estimated in real-time, while in [145] loads availability is estimated for day-ahead market services such as tertiary reserves provision. The algorithm proposed in [146] estimates load availability in quasi-real time (i.e. for the next 5 minutes), considering the information collected by the HEM such as outdoor temperatures, consumption habits and comfort patterns related with the controllable loads. The algorithms proposed in [144]-[146] didn’t included the uncertainty related to the power consumption.
Figure 2.16. Energy Box interaction with household and external actors (adapted from [141]).
E Box
User Interface
Interface
Intelligent plug
Smart Device
Non-controllable
loads
SmartMetering
Household
Aggregator
DSO

Chapter 2 – State-of-the-Art
86
2.4.2 Active Demand Response Strategies for MicroGrid operation Maintaining stability and power quality in MG system, particularly when operating islanding, can be challenging when compared to large interconnected system. The small scale MG system has low inertia and reduced frequency regulation capacity to deal with the RES variability and uncertainty associated to loads and EV power consumption, relying in storage and controllable microgeneration capacity to provide primary and secondary reserves. If the MG has insufficient generation or storage capacity to supply load, part of the MG loads will have to be disconnected until the MG is re-synchronized to the MV network.
Underfrequency load shedding schemes are usually adopted to adjust the MG load to the available microgeneration capacity [35], [147]. In order to control loads, the LC can be equipped with an underfrequency relay, which will disconnect the loads when the MG frequency drops below a pre-defined value [35]. The frequency parameters can be defined based on load priority or based on a set of MG operating scenarios considering the MG peak load and probability of microgeneration failure [147].
The implementation of active demand services could improve the MG reserve management, increasing the resilience of the system during islanded operation. Extending load control to household appliances, through HEM systems would increase the flexibility of MG loads and enable the provision of key ancillary services such as primary and secondary reserves [140].
2.4.2.1 Load Participation in Primary Frequency Control The provision of primary reserves requires fast acting controllers to enable an immediate response to the system disturbances. Therefore, active demand strategies for the provision of primary reserve are usually based in accurate local frequency measurements, being usually referred to frequency responsive load control or dynamic demand [148]-[154].
In 1980, a load reduction method based on frequency measurements was proposed in [148]. The authors have proposed a Frequency Adaptive Power Energy Rescheduler (FAPER), which controls one or a group of equipment based on the local measurement of frequency in order to provide spinning reserve. The load is disconnected in case of a sudden load increase or generation loss and then reconnected when the frequency of the system recovers.
More recently, an autonomous controller called Grid Friendly™ appliance controller was developed in the context of Pacific Northwest GridWise™ Testbed Demonstration. The controller autonomously detects underfrequency events and disconnects the appliance connected to it [149]. It consists of a small electronic board, which sends a binary output signal to the relay switches of water-heater loads and washing machines communication processors, in order to connect or disconnect them according to the measured frequency. The controller was installed in 150 washing machines and 50 electric water heaters. Results have shown that the controller was reliable and effective in responding to frequency excursions with minimum impact on consumers comfort due to the small number and duration of the events (from seconds to minutes). Given the small number of participants its influence in the interconnected system response was very small.

Chapter 2 – State-of-the-Art
87
The Dynamic Demand Control (DDC) method proposed in [150] is also an integrated controller for refrigerator control. As shown in Figure 2.17, contrary to conventional refrigerator thermostats, the DDC connects or disconnects the refrigerator based in the frequency and freezer air temperature. The results presented in [150] have shown that the DDC method potentially improve power system stability when facing the sudden loss of generation, increase of load or dealing with a large penetration of variable generation.
Figure 2.17. Dynamic control of refrigerator [150].
In [151] authors propose an algorithm to control different loads considering the minimum and maximum time the load can be off, defined according to the equipment useful life and the consumers comfort. A random delay is attributed to each controller in order to avoid additional transients caused by the synchronous response of the devices. In case the maximum time off is exceeded and the frequency remains below the off trigger frequency, the algorithm will reconnect the load during its minimum on time. This period is defined according to the device function, namely maintain room or water temperature within the comfort levels.
The impact of adopting frequency responsive load control for power system primary frequency regulation was also studied in [152] for the Danish power system, which is characterized by a large penetration of wind based generation. Two strategies were considered: Type I strategy disconnects loads when frequency reaches a minimum (foff) value and then reconnects after a fixed delay when frequency recovers to a fixed value (fon); Type II strategy is designed for thermostatically controlled loads, which adjust the temperature set-point linearly to the frequency deviation. The results have shown that both control methods enable the successful participation of household appliances in the system primary frequency regulation. However, Type II led to a smother response of the system frequency when compared to Type I strategy, since the last will respond to frequency triggers, while the behaviour of Type II loads will vary linearly to the size of the disturbance.
In [153] a load reduction algorithm is proposed considering the local frequency measurement from smart meters. The load control method aggregates typical domestic appliances according to the level of discomfort caused to consumers due to its disconnection. As described in Table 2.7, for each group, two trigger frequencies are defined: a switching off (FOFF) and a switching on (FON) frequency. When the frequency drops below the switching off frequency the

Chapter 2 – State-of-the-Art
88
algorithm will disconnect the corresponding groups of loads. As the frequency recovers to the switching on frequency or the maximum time off is reached the loads will be reconnected.
Regarding load priority, thermostat controlled loads and appliances with long running cycles will disconnect for smaller frequency disturbances (>0.3 Hz) and during longer periods of time (5 min), while resistive loads and lighting will only be disconnected for frequency disturbances higher than 0.7 Hz. As shown in Figure 2.18, the main advantage of the DR strategy proposed in [153] is that it takes advantage of the metering capabilities of the smart meters, avoiding the need of installing advanced frequency relays. The algorithm that controls the loads is housed in the Smart Load Controller, which could be easily implemented in an advanced controller as the Energy Box considering the communication and data processing capabilities required.
Table 2.7. Load aggregation according to maximum off time (adapted from [153]).
Group Appliances F OFF (Hz) FON (Hz) Maximum time off
I Electric space and water heaters, refrigerators, freezers
49.7 49.8 5 min
II Dish and clothes washing machines, tumble dryers
49.5 49.7 3.5 min
III Cooking appliances 49.3 49.5 2 min
IV Electrical in-line heaters 49.0 NA 15 s
V Lighting loads 48.9 NA 4s
Figure 2.18. Implementation scheme of the smart metering load control (adapted from [153]).
The main advantage of the strategies proposed in [148]-[154] is that loads will respond autonomously to frequency disturbances, without depending in communication infrastructures. However, their implementation is dependent of manufacturer’s acceptance for changing the internal controllers of the appliances. In the smart metering load control proposed in [153] there is no need for changing the devices control. However, it requires the
SmartMetering
Intelligent plug
Intelligent plug
Intelligent plug
Intelligent plug
Intelligent plug
SmartLoad Controller
Group I loads
Group II loads
Group III loads
Group IV loads
Group V loads
Frequency Measurement
On/off signals

Chapter 2 – State-of-the-Art
89
installation of electric plugs with communication capabilities (intelligent plugs). In the future, probably both solutions may coexist. Also, the methods proposed in [148]-[153] were all tested for large power systems with sufficient generation reserve capacity to supply the loads. The large number of loads connected will produce an aggregated effect and may not require real-time monitoring for estimating the availability of loads.
However, for small systems such as the MG where the number of available appliances is much smaller, such methods might not produce such effective results. In the MG case, the contribution of frequency-based load control methods will depend on the amount of load available for control and does not avoid load curtailment due to generation reserve shortage. An Adaptive Hill Climbing (AHC) load control method was proposed in [154] for improving the MG voltage and frequency regulation during islanding operation. The AHC determines the minimum percentage of responsive loads which should be disconnected/ connected, based on the MG frequency deviation. The commands will then be sent to the electric water heaters controllers. The method was tested considering a small system with a diesel generator, which ensured secondary frequency control. In order to effectively contribute to the MG primary frequency control, the system would require a robust communication network, ensuring a maximum latency of 500ms.
2.4.2.2 Load Participation in MicroGrid Emergency Operation Besides frequency responsive load control strategies, direct load control strategies could also be useful during MG emergency operation, in order to provide a better coordination between the available generation and storage capacity, namely during the following conditions:
• Insufficient generation capacity to supply local loads. In this case storage units will compensate for power unbalance.
• Insufficient storage and reserve capacity. Storage capacity is required to ensure frequency and voltage regulation and load following during islanding. Also maintaining some reserve margin could be necessary to ensure secondary frequency regulation. Load curtailment of non-priority loads could help maintain balance until the MG reconnects or the operating conditions change.
• High penetration of RES based microgeneration. In this case if storage is fully charged the excess generation may lead to storage tripping. Increasing the MG load by connecting loads would help maintain the power balance and avoid the MG collapse.
• MG restoration procedure, where the HEM could help provide an accurate coordination between load and generation reconnection, limiting the admissible power consumption at each household to match the available microgeneration capacity [37].
The implementation of emergency DR based on direct control strategies could help solve some of the technical restrictions identified above. The MGCC could request to the aggregator a power increase/decrease as proposed in [141] or directly send to the HEM through the smart meter the adequate control action based on the estimated availability of load for control as in [143]-[146]. However, such strategies require the development of dedicated functionalities at the MGCC capable of processing the data sent from the HEM through the smart metering infrastructure and implement a load control plan in real-time. This will be discussed in Chapter 3.

Chapter 2 – State-of-the-Art
90
2.5 MicroGrid Demonstration Projects and Pilot Sites The feasibility of the MG concept has been the focus of several research projects around the world. However, developments were mainly demonstrated through numerical simulation. In order to enable the implementation of the smart grid functionalities developed, a strong experimental validation is required. A review of worldwide experimental MG projects and pilot sites can be found in [47]-[50].
This section reviews some of the laboratorial infrastructures dedicated to the MG and SG concepts validation, regarding their architecture, experimental objectives and main results. The INESC TEC laboratorial infrastructure which supports the experimental work presented and discussed in this thesis is also presented, regarding its main experimental objectives and testing capabilities.
2.5.1 CERTS/AEP MG Test Site The CERTS MG concept is focused on providing a reliable power supply to LV consumers, considering the integration of microgeneration and distributed storage [31]-[34]. Under this concept, the MG is operated with a plug-and-play philosophy based on a MMO strategy, where several microgeneration units equipped with energy storage devices in the DC side of the power electronic converter are controlled through droop functions.
The CERTS MG concept was demonstrated at a full-scale test facility operated by American Electric Power (AEP) in the context of CERTS MG Laboratory Test Bed project [51]. The pilot and its schematic are shown in Figure 2.19 a) and b), respectively. The pilot is composed of three natural gas engine for CHP applications interfaced through AC/DC/AC droop controlled inverters, four controllable load bank with power ranging from 0-90 kW and 0-45 kvar as well as protection relays, shunt breakers and digital system acquisition. The CERTS MG storage units are coupled to the DC link of the CHP units [51].
The full-scale test facility enabled the demonstration of the flexibility of the MG operation for both grid connected and autonomous mode. The main achievements identified were [51]:
• Successful development and test of the automatic transition between grid-connected and island modes, using a static switch controlled to disconnect the MG during faults and low power quality conditions provided by the upstream network.
• Development of adequate protection schemes without depending on high fault currents. The protection scheme coordinates the operation of the MG static switch with the conventional breakers installed downstream.
• Development of adequate local and centralized control methods to ensure voltage and frequency stability both for interconnected and islanded modes, without depending on high-speed communications. When interconnected, the microgeneration units control terminal voltage and the power injected, either to maximize power export or to compensate the load variability in the feeder where it is connected. When islanded, the units are controlled through P-f and Q-V droop functions [31]-[34].
• Test MG manual restoration procedures considering the Black Start (BS) capability of the CHP units.
• Test the operational limits of MG when islanded. Tests were performed in order to evaluate the MG islanded operation, considering the MG response with high transient

Chapter 2 – State-of-the-Art
91
currents resulting from induction motor starting. Additionally, the MG stability when considering the connection of unbalanced loads was also studied.
In 2011, the launch of the project third phase was announced, considering the Smart Grid R&D Program promoted by the American Department of Energy [52]. The project now focuses on the integration of RES based microgeneration in the MG system. The key elements of phase III of CERTS MG are the integration of a PV emulator with the implementation of developed control algorithms, installation of conventional storage and a synchronous generator. The concepts were implemented in 2012 at the Alameda County Santa Rita Jail in California, which initially included a 1 MW fuel cell, 1.2 MW of PV, and two 1.2 MW diesel generators. In order to operate autonomously, a 4 MWh storage system, a fast static switch and a power factor correcting capacitor bank were installed. When operating interconnected, a centralized control system optimizes the use of local generation and manages the storage SOC. When islanding, the static switch ensures a smooth transition during power failures of power quality events such as voltage sags, which previously affected the operation of the PV and fuel cells. The diesel group generators control system was upgraded to charge the battery storage unit and can also be controlled with droop functions compatible with the VSI [52].
a)
b)
Figure 2.19. CERTS/AEP MG test facility: a) test site and b) schematic of facility.
Gas microturbine
CHP unit
Main Grid
Gas microturbine
CHP unit
Gas microturbine
CHP unit
Feeder AFeeder BFeeder C
Load 3
Load 4
Load 5
Load 6
A-1
A-2
B-1
breakers
Static Switch

Chapter 2 – State-of-the-Art
92
2.5.2 MICROGRIDS and MORE MICROGRIDS As discussed previously, the main focus of MICROGRIDS and MORE-MICROGRIDS project was the development of active management strategies for distribution networks, integrating large amounts of RES based microgeneration, based on the MG and MMG concept [43]. Compared to the CERTS MG concept, the European MG concept envisions the deployment of the MG concept in the smart distribution network as a unitary cell of the system, exchanging power with the MV network when interconnected and being able to supply its local loads when operating autonomously.
Five laboratory facilities were involved in MICROGRIDS project, with the main objective of testing and demonstrating MG operation concepts [53]. Important experimental results were obtained in MG laboratorial models, such as described below.
DeMoTec laboratory DeMoTec laboratory is installed at the Institute for Solar Energy Supply Engineering (ISET) in Kassel, Germany, and is now part of Fraunhofer Institute for Wind Energy and Energy System (IWES) [54]. The infrastructure is focused on the development and testing of DER, considering the specificities of their power electronic interfaces and the decentralization of grid services. The laboratory facility has a total of 200 kW of generation installed capacity, combining synchronous generators with CHP units and RES based generation. It incorporates 70 kVA commercial SMA inverters, which enabled the validation of MG emergency strategies. Three independent test grids can be configured and can be coupled via a MV network simulator, in order to study the effect of interconnected MG.
One of the most interesting features of this laboratory is its SCADA system, enabling remote monitoring and control systems of the laboratory equipment. The architecture of the system is shown in Figure 2.20 [53]. An Ethernet network ensures the communication between the Remote Terminal Units (RTU) interfacing the equipment from different manufacturers with the laboratory infrastructure. MG control and management algorithms based on MAS were also tested considering this structure.
Figure 2.20. DeMoTec SCADA and MG control system architecture [53].

Chapter 2 – State-of-the-Art
93
The system adopted for the validation of MG concept is represented in Figure 2.21, being composed of four grid forming units (two battery banks and two diesel units), loads and microgeneration based on wind and solar. Five different tests have been conducted to validate MG concept particularly during emergency conditions [53]:
• MG islanding due to high impedance fault on the main grid. • MG overloaded by the main grid. • MG islanding due to low impedance faults on the main grid. • Reconnection to the main grid after a fault. • MG BS procedure.
Figure 2.21. DeMoTec MG test system used in MICROGRIDS project [53].
NTUA laboratory-scale MG system Installed at the National Technical University of Athens (NTUA), this laboratory scale MG is a single phase system integrating two PV generators, one wind turbine, battery energy storage, controllable loads and a controlled interconnection to the local LV grid, as in Figure 2.22. The storage unit coupling inverter is controlled through P-f and Q-V droop characteristics, enabling the operation of the experimental MG in islanded mode. The electrical infrastructure is complemented by a monitoring and control system, which provides measurements from the different devices and enables the remote configuration of the coupling inverters [55]. The MG management was also implemented using the Java Agent Development Framework (Jade) 3.0, based on the distributed functionalities proposed in [70], [71], [73].
Microgrid/ Flywheel energy storage laboratory prototype at the University of Manchester The main objective of this infrastructure was to enable the development and testing of MG control strategies implemented at the power electronic interfaces of generation, loads or energy storage. The electric infrastructure is represented in Figure 2.23 and its main component is the AC/DC inverter with configurable control through Simulink®/dSPACE® control software, in order to interface with a flywheel or emulate other units and loads. Both interconnected and islanded tests can be performed [53].
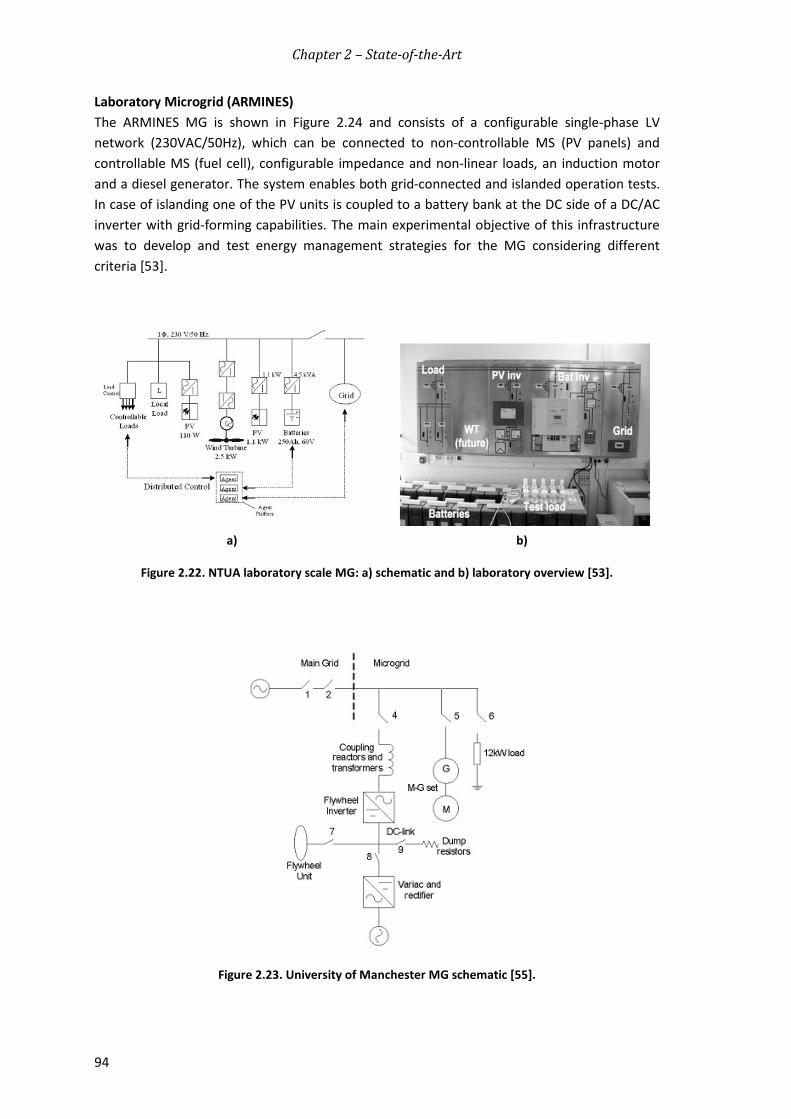
Chapter 2 – State-of-the-Art
94
Laboratory Microgrid (ARMINES) The ARMINES MG is shown in Figure 2.24 and consists of a configurable single-phase LV network (230VAC/50Hz), which can be connected to non-controllable MS (PV panels) and controllable MS (fuel cell), configurable impedance and non-linear loads, an induction motor and a diesel generator. The system enables both grid-connected and islanded operation tests. In case of islanding one of the PV units is coupled to a battery bank at the DC side of a DC/AC inverter with grid-forming capabilities. The main experimental objective of this infrastructure was to develop and test energy management strategies for the MG considering different criteria [53].
a) b)
Figure 2.22. NTUA laboratory scale MG: a) schematic and b) laboratory overview [53].
Figure 2.23. University of Manchester MG schematic [55].

Chapter 2 – State-of-the-Art
95
Figure 2.24. ARMINES MG system [53].
After the initial findings of MICROGRIDS project, the MORE-MICROGRIDS focused on the implementation of MG concept in real systems. The tests were conducted in 8 pilot test sites [43]. The most relevant results obtained in the validation of MG emergency operation are briefly described below:
• Kythnos Island – the pilot is installed in the Kythnos island in Greece and was initially funded by SMA Solar Technology AG® and NTUA. Being installed in an island, the system only operates in autonomous mode. Therefore, the main focus of this pilot was to test MG emergency strategies and develop load controllers in order to help maintain the balance between local generation and load. The system includes 10 kW of PV installed capacity, a 53 kWh battery bank, a 5 kW diesel generator and a three-phase group of Sunny Island 5048® inverters from SMA Solar Technology AG®, which ensure the autonomous operation of the system. When the load exceeds local generation capacity, the load controllers receive a signal to disconnect non-priority loads [47]-[50]. Additional battery management features integrated at SMA® grid forming battery inverters were also tested in this pilot, namely its coordination with PV units and loads [47].
• EDP Distribuição feeder, associated to a municipal swimming pool in the Ílhavo municipality, Portugal. The pilot site consists on a small 200 kVA 400 V three-phase four-wire feeder with 71 kVA of peak power consumption and equipped with a 80 kW microturbine for CHP application, associated to a municipal swimming pool. The field tests were focused on studying the microturbine response during the islanding transient, testing its load following capabilities to meet local load and its BS capability. During a grid failure the microturbine disconnects and will reconnect after some minutes in islanded mode. Power quality was also analysed during both operation modes [47].
• Bronsbergen holiday park of Alliander – The pilot consists of 200 holiday cottages with a peak load of 150 kW. The majority of the houses have PV installed in the roofs,

Chapter 2 – State-of-the-Art
96
totalizing 315 kW of installed capacity [47]. Two battery banks are connected at the LV bus of the distribution substation. The MG is connected to a 10 kV MV grid through a 400 kVA transformer. The main focus of the pilot was to demonstrate the stable operation of the MG in islanded mode with successful automatic isolation and reconnection to the MV network. The system is able to remain in autonomous mode during 24 hours, by coordinating storage with available generation from the PV. The MG BS was also demonstrated successfully [47], [50].
• CESI RICERCA DER Test Facility – is a LV test facility constituted by 350 kW capacity combining different generation technologies and storage. The system is connected to the main grid through an 800 kVA transformer. The electricity network can be configured into different topologies (i.e. radial or meshed configurations) and considering different feeders’ length. The MG management and control system and laboratory supervision system ensures the interface with the laboratory resources, including remote meter reading, testing data processing and control of MG resources during the tests. The communication infrastructure includes different technologies, namely Ethernet, Wireless and Power Line. The MG control in islanding mode is based on droops for frequency regulation [47], [50].
2.5.3 Asia MicroGrid Laboratories and Pilot sites Large scale MG demonstration projects can also be found in Japan [47], [48]. The New Energy and Industrial Technology Development Organization (NEDO) has promoted several research funding opportunities for the development of MG demonstrative projects, leading to the implementation of several pilots (e.g. Kyoto eco-energy project, Aichi MG project, Aomori Project in Hachinohe, the test network at Akagi of the Central Research Institute of Electric Power Industry-CRIEPI and the Sendai project) [47], [48], [56]. The pilots are focused on the development and testing of new management strategies enabling the integration of RES and low carbon technologies and its coordination with different storage technologies. The main objectives are to ensure the balance between demand and generation as locally as possible, maintain power quality and improve reliability by validating MG islanded operation.
The Sendai MG pilot gained particular interest after the Great East Japan Earthquake on March 11, 2011. The demonstrative MG continued supplying power and heat to customers, including a hospital, during 2 days [38]. The results have led Japan’s Ministry of Environment to launch a new funding program to improve power system resilience to extreme weather conditions and natural disaster, thinking locally through the MG concept. In addition to storage and RES, EV integration is also being considered.
More recently, the Zhejiang Electric Power Test and Research Institute in China, implemented a cluster of multiple distributed generation and energy storage technologies, capable of operating in different conditions and involving the testing of control strategies for grid connected and islanding mode, while dealing with protection and power quality issues [56].
2.5.4 Smart Grid Laboratories and Pilot sites The pilots and laboratory infrastructures described above were built mainly to develop and test new technologies and control strategies, related to the integration of DER based generation. More recently, under the SG research initiatives new pilots and laboratory

Chapter 2 – State-of-the-Art
97
infrastructures are being built [158]-[160]. The main experimental objectives are focused in the test of advanced metering infrastructures regarding the ICT infrastructure and communication requirements for the implementation of demand side management strategies and distribution network control.
2.5.4.1 InovGrid Project and SG Reference Architecture InovGrid has been selected as the single case study for testing and validation of the Electric Power Research institute (EPRI) Business Case assessment methodology and received the “Core Project” label from the European Electricity Grid Initiative (EEGI), among more than 200 Smart Grid projects under development in Europe [158]-[160]. Such distinction demonstrates the alignment between the identified European research lines and InovGrid project.
The InovGrid project started in 2008 and was headed by the Portuguese DSO, EDP Distribuição, involving several industry partners and research institutions from the Portuguese electricity sector. The main objectives of the project were [161]:
• Remote metering – the definition of a platform to collect and send metering data to a centralized information system, using a communications infrastructure to improve the commercial services of the utility while reducing costs associated with legacy metering strategies.
• Consumer services – the creation of conditions to allow the introduction of new services that allowed an enhanced interaction between the customer and the utility.
• Market expansion – the definition of a market liberalization process, allowing the participation of customers and new service providers and introducing new services to be explored in modern grids.
• Demand management – a strategy to provide a match between supply and demand while allowing a reduction in peak demand and a more efficient use of electric energy.
• Security of supply – the definition of functionalities that allow an enhanced integration of RES, ensuring a diversified set of solutions to improve the security of operation of distribution networks.
• Investment assessment – the identification and evaluation of the investments that lead to a more reliable and efficient grid operation, through the use of monitoring, automation and control schemes.
The project was divided in three phases. The first phase consisted in the specification of AMI reference architecture, enabling remote metering and energy consumption awareness. In the second and third phases, the basic architecture was progressively updated towards a fully decentralized architecture, promoting the active management of MV and LV networks and enabling the large scale deployment of microgeneration, EV and DR services.
One of the most relevant outputs of the project was the development of the InovGrid reference architecture, represented in Figure 2.25. The InovGrid architecture is based in the hierarchical control structure of MG and MMG concept, being divided in four levels: the existing centralized services of DMS, the Smart Substation Controller (SSC) at the HV/MV substation level, the Distribution Transformer Controller (DTC) at the MV/LV level and the Energy Box (EB) at customer premises. The reference architecture is supported by a communication infrastructure which enables the data exchange among entities. The preferred

Chapter 2 – State-of-the-Art
98
technology was narrowband PLC for distribution network communications and ZigBee for local control at customer premises [161].
The EB is the smart metering device with modules for control, management and bidirectional communications. It supports features like active and reactive energy metering, maximum power consumption setting in a configurable time period, voltage metering and remote tariff and contracted power change. The EB will send periodically the measurements to the DTC, which then process it and send it to the higher control layers. At the same time, it will also receive information from the central systems and distribute the information or the resulting control signals downstream to the EB. The DTC is installed at the MV/LV secondary substations and is responsible for supervision, management and control of LV distribution feeders, similarly to the MGCC. At the HV/MV substations, the SSC will then be responsible for managing and controlling the different devices within a MV network and coordinate the operation of the LV networks connected downstream. The SSC may include intelligent algorithms to optimize voltage profiles, energy flows and network topology, as well as self-healing algorithms, in close coordination with network operators via the SCADA/DMS [161].
Figure 2.25. InovGrid reference architecture.
The specifications associated with the InovGrid project were rolled-out in Évora. The pilot designated as InovCity was implemented in order to test in a real-world scenario the control architecture, functionalities and controllers specified under InovGrid project and developed by the InovGrid industrial partners [44].
Évora city has 54000 inhabitants and totals 1307 km2 of urban and rural area with the size, network diversity and context to support the evaluation of a SG solution. The electric
Customer Premises
MV/LV Sec.Substation
LAN LAN WA N
DTC DTC DTC
WA N
Internet
EB EB EB EBUser Inter face
HA NLoca l
Devices
HV/MV SubstationSSC SSC
WA N
Central Other Systems
(commercial, technical)
Network Operati on
and Control Systems
Remote Metereri ng
Management Systems
I nf ormati on Systems Mark et

Chapter 2 – State-of-the-Art
99
infrastructure spans over the entire municipality, reaching around 32000 electricity consumers, with an annual consumption of approximately 270 GWh. In order to engage consumers in the operation of the system, EDP Distribuição provided to a test group of customers a set of in-home displays providing real-time information of their power consumption. Home Area Network (HAN) was implemented based on ZigBee and Wi-Fi. Also, twenty public EV charging stations were also deployed in Évora as well as efficient public lighting systems based on LED luminaries with advanced control, namely automatic dimming and remote control performed by the DTC.
From an operational point of view, the InovCity implementation allowed more than 60% of remote metering related actions with more than 96% of invoices being based on real consumptions rather than estimates. A reduction of 5 to 10% of outage time was also reported. Regarding the integration of emerging technologies, microgeneration installation increased 66% in 2012 when compared to 2010. In terms of energy efficiency, the achieved results were encouraging. In the first year a reduction of consumption of nearly 4.0% was observed, when compared with the control group. In the second year, this difference was even higher. In addition, a 5.3% consumption efficiency gain was reported when compared to the results observed in 2010, due to the installation of the in-home customer energy monitoring systems [162].
2.5.4.2 Grid4EU Grid4EU is the largest SG project funded by EU, involving six DSO and other 27 partners such as utilities, energy suppliers, manufacturers and research institutes. The project consists in six demonstrators, which will be tested over a period of four years to demonstrate SG concepts, considering RES integration, EV deployment, distributed energy storage, grid automation, energy efficiency and load reduction [163].
The NiceGrid MG project is one of these demonstrators, located at Carros municipality in France and involving more than 1500 residential, commercial and industrial consumers. The pilot architecture is represented in Figure 2.26 and is focused in testing MG concepts considering the interaction of system operator with other SG actors such as DER owners, consumers, commercial aggregators and retailers. The pilot as a total of 2.5 MWp of PV generation capacity, 3.5 MW of load shedding capability and 1.5 MW of distributed storage capacity. The system is characterized by a large scale integration of PV at consumer premises, which are able to manage their own consumption by locally coordinating it with available generation and distributed storage [164]. Islanded operation tests will be performed in one of LV networks involved in the pilot in order to evaluate the costs and complexity of islanded operation mode [163].
2.5.4.3 Electric Mobility Laboratories and Pilot sites Demonstration efforts of the active integration of EV in power system operation were first initiated in California in 1990, in response to California Environmental Protection Agency Zero Emission Vehicle (ZEV) Program [113], [114], [165]. More recently, as a consequence of Europe’s decarbonizing objectives, several demonstration pilots dedicated to electric mobility are being developed, namely in the context of European projects Green eMotion [119] and Cotevos [167].

Chapter 2 – State-of-the-Art
100
Figure 2.26. Architecture of NiceGrid MG pilot [163].
Green eMotion project include twelve demonstration sites, where different aspects of the integration of EV are being tested [119]. Malaga SmartCity is one of these pilots, which is particularly focused on improving distribution network operation considering the integration of EV and V2G services. The pilot corresponds to two HV/MV substations supplying an area with 11000 domestic, 900 commercial and 300 industrial customers. More than 17000 SM have been installed, from which 50 have house energy management systems. The pilot has around 11 MW of renewable generation capacity, including residential PV installations, WT and a cogeneration facility. Two battery-based storage facilities were installed in order to help manage the system. Regarding electric mobility, a network of recharging points was included and adapted to enable V2G capacity [166].
COTEVOS project was launched in 2013 and aims to develop optimal structures and capacities to test the conformance, interoperability and performance of the different systems constituting or involved in EV smart charging infrastructure. European Distributed Energy Resources Laboratories (DERlab), a European network of major laboratories dedicated to test and development of DER integration, is one of the partners of the project, reflecting the importance of testing facilities to develop a unified and interoperable framework for EV integration [167].
2.5.5 Smart Grid and Electric Vehicle Laboratory Envisioning the development of advanced experimental infrastructures for feasibility demonstration of MG operation and other SG related concepts and solutions, INESC TEC – INESC Technology and Science – has been implementing a laboratorial infrastructure that exploits distinctive control and management solutions for key DER such as EV and microgeneration [45], [162].
The SGEVL was designed in the context of the REIVE [45] and MG+EV projects [46], in order to support the development and testing of solutions and prototypes both for hardware and

Chapter 2 – State-of-the-Art
101
software modules related to SG applications. The main objective is to promote an active and intelligent management of distribution networks in scenarios characterized by a progressive integration of microgeneration and EV. A distinct feature of this laboratory relies on the integration of both commercially available solutions and in-house developed prototypes. The laboratory constitutes the physical space that integrates both equipment and software modules that allows individual and fully integrated development and testing of concepts, algorithms and communication solutions that will allow the operation of a distribution network under normal and emergency conditions. The laboratory architecture was specified and developed according to the MG concept as described in [15], [27], [32], [35], [42], being simultaneously modular and flexible in order to make it a scalable infrastructure.
2.5.5.1 Equipment The main building block of the laboratory includes MG main resources such as:
• RES based microgeneration and grid coupling devices. The laboratory includes 15.5 kWp of PV installed capacity and a 3 kW micro-Wind Turbine (WT) emulator, represented in Figure 2.27 c) and d) respectively. The RES based MS can be connected to the electric network, either through single-phase state of the art commercial inverters (in Figure 2.27b) or through single-phase inverter prototypes developed in-house. A 20 kW four quadrant back-to-back inverter is also available in the laboratory as in Figure 2.27a). This inverter is remotely controlled in terms of injected or absorbed active power and can be used to emulate a controlled MS, a load or energy storage device.
• Storage units and grid-forming inverters, including two Flooded Lead-Acid (FLA) battery banks (50 V, 20 kWh @ 10 h) were integrated in the laboratorial infrastructure, being connected to two three-phase groups of SMA Sunny Island 5048® battery inverters (15 kW, 400 V each) represented in Figure 2.28 [168]. These inverters are mainly used for the electrification of remote areas, being able to operate autonomously in isolated systems, by managing storage and local generation (renewable based and/or small backup generators). However, these inverters can also operate in parallel with an existing grid, while providing a smooth transition to autonomous (islanded) operation.
• Electric mobility. Figure 2.29 shows the two commercial BEV which can be charged by a commercial single-phase home charger. Since the commercial available chargers do not allow controlling the EV charging power, a single-phase DC/AC bidirectional inverter prototype was developed and connected to a bank of Li-ion batteries (128 cells, 3V per cell, 40 Ah), thus emulating the operation of an EV when parked and connected to the LV grid [169].
• LV cables, namely two three-phase four-wire LV cables simulators (100A and 50A nominal current), enabling the implementation of different network testing scenarios while considering the resistive nature of LV feeders. Different unbalanced scenarios can also be implemented, distributing the laboratory electric devices by each phase of the system.
• Controllable loads, namely two controllable resistive load banks with 52 kW of maximum power.

Chapter 2 – State-of-the-Art
102
Figure 2.27. Laboratory RES and commercial inverters: a) four quadrant inverter, b) 2kW SMA solar inverter, c) micro-WT emulator and d) PV panels.
Figure 2.28. Laboratory storage and grid forming units: a) SMA Sunny Island 5048® battery inverter and b) FLA battery bank.
Figure 2.29. Commercial EVs: a) Renault Twizzy® and b) Renault Fluenze®.

Chapter 2 – State-of-the-Art
103
All available devices in the laboratory can be connected to an electric panel equipped with three 400 V busbars (see Figure 2.30), with the possibility of being sectionalized through the switches IB A, IB B and IB C, respectively. This solution allows the implementation of electrical configurations with up to six semi- busbars (A1, A2, B1, B2, C1 and C2). The electric panel is interconnected with the local distribution grid (through bus A0 and contactors KA0.1 and KA0.2). A set of output feeders were derived to allows the connection of the laboratory equipment (Di,j, i=1, 2, j=1,…, 15). The configuration of the electric panel allows the composition of different MG setups using a contactor based system (KAi,j, KBi,j, KCi,j) allowing the selection of the buses to which a feeder should be connected. Each output Di,j is also equipped with a residual current device (IDDi.j) with 100 mA sensitivity and with a switchgear (DDi.j) for system protection purposes.
Figure 2.30. Single line diagram of the SGEVL.
2.5.5.2 Communications and Control Architecture The laboratory supervision and automation is carried out by a SCADA system, which supports all the laboratorial operations and ensures the electrical network remote configuration and monitoring through the SCADA synoptic view represented in Figure 2.30. Each feeder and bus is equipped with a universal metering device, providing a large set of electrical measurements. The interface and field bus capabilities (Modbus) of the universal metering devices enables the communication of measurement data and its incorporation into the laboratory SCADA system and the software routines used to operate and control the MG system.
The distribution network operation architecture developed under REIVE project was implemented in the laboratory and integrated with the laboratory automation and data acquisition system, as shown in Figure 2.31. In terms of communications and control, as it is depicted Figure 2.31, the laboratory comprises two major building blocks: (1) the MG communication and control system and (2) the laboratory data acquisition and control system.

Chapter 2 – State-of-the-Art
104
Figure 2.31. SG laboratorial architecture.
Regarding the MG control architecture, three control levels were implemented, namely the MGCC, the SM installed at the consumers’ premises and the MG local controllers namely LC, the MC and the VC. At the lower control layer, the SM has bidirectional communication capabilities to ensure the exchange of control signals and other information between the upper and lower control layers. The information sent by the local controllers can be sent to the MGCC and used as inputs to the MG high level management and control functionalities. The MG controllers are emulated in conventional computers integrating the different software and hardware modules responsible for the acquisition and processing of data, which is then used as input to the MG high level management and control functionalities. At the lower control layer, the SM is able to receive set-points from the MGCC and forward them downstream to the respective local controllers. A detailed description of the MG controllers will be provided in Chapter 6.
The laboratory data acquisition and control system is a platform of data collection for detailed experiment analysis and to support MG software modules. It is intrinsically related to the SCADA and to the universal metering devices. The Modbus interface of each universal metering device enables the communication of measurement data and its incorporation into the laboratory SCADA system. Simultaneously, a Modbus to TCP-IP protocol conversion platform is used to exchange the measurement data with the MG control system and with a general database for storing experimental results. Additionally, laboratory load banks are controlled through Ethernet remote I/O devices that allow its control and operation.
An Ethernet communication network was deployed and is used to interlink the previously mentioned blocks. At the MG communication and control system, the Ethernet communication ensures bidirectional communications and provides a controllable communication medium interconnecting the different devices and entities

Chapter 2 – State-of-the-Art
105
Regarding the MG communication infrastructure, a Medium Behaviour Controller (MBC) was developed since it allows emulating different communication technologies. The communications network is used as a controllable medium, where distributed MBC are able to impose controlled bandwidth values to the different communication interfaces and define different communication profiles considering data packet delays and losses [169].
2.5.5.3 Microgeneration and EV Prototypes The MG management and control strategies have to consider the specificities of power electronic interfaces coupling the PV, the micro-WT and EV to the network [32], [35], [42]. In order to develop and test new control strategies, two single-phase microgeneration inverters and an EV charger prototype were developed.
The power electronic inverters are composed by half-bridge assemblies, including IGBT switches and hybrid gate drivers, as well as passive components, such as protection devices, voltage and current sensors and control hardware. Their control algorithms were first developed using MATLAB®/Simulink® and were than adapted to the dSPACE® DS1103 prototyping platform for preliminary testing. Once the development process was finished, the control system was transposed to a stand-alone digital signal processor, which allows the inverter to operate autonomously.
As an illustrative example, Figure 2.32 shows the EV bidirectional charger prototype [170]. The charger can be divided in two stages with independent control schemes: a grid tied full-bridge inverter that controls the power flow between the DC bus and the LV grid and a dual active bridge that regulates the current flowing from/to the batteries and assures the galvanic isolation (through the High Frequency – HF – transformer) between the grid and the battery pack. The full-bridge inverter regulates the DC bus voltage in order to ensure adequate supply to the dual active bridge input stage. The inverter is controlled with a PQ strategy within a limit of ±3680W, using a proportional-integral controller implemented in a synchronous reference frame. The control of the inverters is configurable allowing the implementation of advanced grid supporting strategies. The microgeneration and EV prototypes control will be discussed in more detail in Chapter 6.
Figure 2.32. EV bidirectional charger prototype [170].

Chapter 2 – State-of-the-Art
106
2.5.5.4 Testing Capabilities The laboratorial infrastructure will allow the individual development and test of microgeneration power electronic interfaces with new control strategies and integrated testing procedures for new concepts and control algorithms to be housed at the different SG hierarchical layers. Regarding ICT, small scale tests can be performed considering different communication architectures, technologies and protocols.
Regarding the experimental validation of the MG concept, the INESC TEC laboratorial infrastructure enables the following tests:
• Evaluation of the MG operation under unbalanced conditions. The laboratorial infrastructure implements a three-phase four-wire LV system, with both single-phase and three-phase microgeneration and loads as well as single-phase EV charging equipment. Different unbalanced scenarios can be developed distributing the laboratory electric equipment by the three-phases of the system.
• Evaluation of the MG operation with large scale integration of microgeneration and EV. The LV cables emulators as well as the microgeneration units and grid-coupling devices enable the development of different testing scenarios, considering the resistive nature of LV feeders. This is important for the development of new MG voltage control functionalities, for both interconnected and emergency operation mode.
• Testing two different islanded systems. In case there is a grid failure, the SMA Sunny Island 5048® DC/AC inverters imposes the frequency and voltage magnitude reference, supplying the loads through the battery banks. This will allow testing the MG emergency control strategies developed and the robustness of the developed prototypes. Synchronization with the upstream network under unbalanced conditions can also be tested.
• Experimental testing of MG restoration procedures. • Experimental testing of EV charging and V2G functionalities. • Evaluate the effectiveness of the MG normal and emergency operating strategies,
considering different communication architectures, communication delays and failures.
2.6 Summary and Main Conclusions The deployment of the SG concept implies major changes in the operation and planning of distribution systems, particularly in the LV networks. The majority of small scale DER – microgeneration units, energy storage devices and flexible loads – and EV are connected to LV networks, requiring local control solutions to mitigate technical problems resulting from its integration. Simultaneously, LV DER can be aggregated in small cells in order to globally provide new functionalities to system operators.
Within the SG paradigm, the MG concept has been pointed out as a possible solution to extend and decentralize the distribution network monitoring and control capability. A MG is a highly flexible, active and controllable LV cell, incorporating microgeneration units based on RES or low carbon technologies for CHP applications, energy storage devices and loads. The coordination of MG local resources, achieved through an appropriated network of controllers

Chapter 2 – State-of-the-Art
107
and communication system, endows the LV system with sufficient autonomy to operate interconnected to the upstream network or autonomously – emergency operation – including the possibility of performing local service restoration procedures.
Following the aforementioned reasoning line, this chapter provides a detailed overview of the MG concept, regarding its operation, management and control architecture. Additionally, a detailed discussion about MG resources such as microgeneration, energy storage units, EV and load is also provided, while emphasizing its flexibility in order to provide regulation services to the MG system. The adequacy of the MG management functionalities in the context of smart distribution networks was also discussed. Regarding the MG control strategies, special focus is given to the MG frequency and voltage regulation strategies, which are required to ensure the MG stability during emergency mode of operation, namely islanded operation and MG BS. The operation of the LV network under unbalanced conditions was analysed as well as the methods described in the literature to mitigate this power quality problem.
The industrial development of SG related products and technologies are growing, enhancing the importance of experimental demonstrations which take into consideration real world conditions. The development of laboratorial facilities, such as the one described in this chapter, plays an important role in the consolidation of innovative solutions that are the key for a successful development of the SG paradigm.
One of the main outcomes of this thesis relies in the experimental validation of MG concepts and on the development of software modules to be integrated in pre-prototypes of MG controllers. The strategies and prototypes developed in this dissertation were developed and tested in the SGEVL. This laboratorial infrastructure is dedicated to the development and demonstration activities as well as to support the technology transfer to the industry, by developing new prototypes of advanced interfaces for EV, microgeneration and for the distribution network management. The testing capabilities include the SG main areas of knowledge, namely: power systems, power electronics and ICT.


Chapter 3 – MicroGrid Control Solutions for Emergency Operation
109
– MicroGrid Control Solutions for Chapter 3Emergency Operation The development of the Smart Grid (SG) concept is the pathway for assuring flexible, reliable and efficient distribution networks while integrating high shares of Distributed Energy Resources (DER): renewable energy based generation, distributed storage and controllable loads and Electric Vehicles (EV). Within the SG paradigm, the MicroGrid (MG) can be regarded as a highly flexible and controllable Low Voltage (LV) cell, which is able to decentralize the distribution management and control system while providing additional controllability and observability. A network of controllers interconnected by a communication system ensures the management and control of the LV MG, enabling both interconnected and autonomous operation modes. This new distribution operation philosophy is in line with the SG paradigm, since it improves the security and reliability of the system, being able to tackle the technical challenges resulting from the large scale integration of DER and provide the adequate framework to fully integrate SG new players such as the EV.
By exploiting the MG operational flexibility and controllability, this chapter aims to provide an extended overview on MG self-healing capabilities, namely on its ability of operating autonomously from the main grid and perform local service restoration. The MG hierarchical management and control structure is revisited and adapted in order to exploit the flexibility of SG new players, like the EV and flexible loads and integrate smart metering infrastructures.
3.1 Introduction The MG is considered to be a LV distribution network incorporating MicroSources (MS), storage devices and responsive loads [27]-[35]. Through the future change of paradigm in the mobility sector, EV will become another resource to be integrated in the MG system, which can behave both as flexible loads or as mobile energy storage devices [15], [133]-[135]. In order to be flexible and controllable, the MG power infrastructure is supported by a communication and information system supporting the MG management and control functionalities [27]-[35], [41], [42]. The local intelligence is responsible for coordinating and controlling local resources and enabling innovative self-healing operating strategies [35]-[37], [41], [42] .
The basic architecture of a MG consists in a hierarchical structure composed by a network of local controllers connected to each MG element headed by a central management unit installed at the MV/LV substation – the MG Central Controller (MGCC). Given the different characteristics of the MG resources, three types of local controllers can be defined: the MS Controller (MC), EV Controller (VC) and the Load Controller (LC) [15], [35], [133]-[135]. As shown in Figure 3.1, based on the technical and market frameworks for the integration of EV and loads in the operation of power systems discussed in the previous chapter, the MG architecture can be easily adapted to integrate smart metering infrastructures as well as the associated processing capabilities to manage the data collected from the meters. At the consumer premises, the Smart Meter (SM) is expected to support bidirectional

Chapter 3 – MicroGrid Control Solutions for Emergency Operation
110
communications, acting as a local gateway between the local controllers and the MGCC. The SM aggregates the information related with power consumption, generation, service interruptions, voltage and other relevant data. Besides interacting with the MG control architecture, the SM should be able to interact with Home Energy Management (HEM) systems, which are able to locally manage energy profiles (production and consumption) at the household while providing the resulting flexibility to participate in grid services [141]-[146], [153].
Figure 3.1. Smart distribution network architecture based on MG concept.
Reliability is considered a major benefit of the MG system due to its ability to operate both interconnected to the main grid or autonomously as a physical island – emergency operation. In fact, if a disturbance occurs in the upstream Medium Voltage (MV) network or in case of planned actions, the MG can be transferred to islanded operating conditions, supplying local loads with the MG generation capacity supported by fast acting storage units [35], [42]. However, if the islanding fails or a general blackout occurs, the MG flexibility also allows performing local service restoration exploiting locally available generation and energy storage units [36], [37].
Ensuring a successful autonomous operation is quite challenging, since the sudden islanding of the MG may cause high unbalances between local load and generation, which have to be compensated by fast acting storage devices in coordination with the MS and load shedding mechanisms [35]. As discussed in Chapter 2, the MG is an inertialess system, due to the inexistence of rotating masses directly connected to the MG [35], requiring the implementation of specific frequency and voltage control strategies which exploit MG resources controllability and the control of its power electronic grid coupling devices [31]-[35], [41], [42].

Chapter 3 – MicroGrid Control Solutions for Emergency Operation
111
The fact that EV are expected to be connected to the LV network during long periods of time for charging purposes, along with the predictability of its power consumption, makes them good candidates for the development of dedicated load control strategies. When regarded as flexible loads or distributed storage devices, they can contribute to increase the global MG storage capacity [15], [133]-[135]. Nevertheless, the increase of regulation capacity will depend on the number of EV connected to the system and on the state of charge of their batteries.
Complementing EV control strategies with emergency Demand Response (DR) schemes for MG islanded operation will improve the security of operation during emergency conditions and minimize the consumers discomfort during outages [148]-[156]. The emergency DR schemes are related to selective load control actions applied to specific groups of loads and are intended to improve MG resilience in the moments subsequent to islanding and also during islanding operation.
Under such cases, innovative control functionalities need to be developed in order to promote an adequate coordination of the available resources. The roll out of SM with bidirectional communication capabilities will also provide a set of valuable measurements, which can be used to assess MG operating conditions in real-time. Such information can be used to perform an assessment of MG resilience to severe disturbances and define accordingly the most appropriate control actions to maintain the stability of the system and provide a better coordination among the available resources.
This chapter is focused on MG control for enabling emergency operation, namely during islanding and when performing local restoration procedures. Section 3.2 revisits the MG hierarchical control structure discussed in section 2.2.3 and proposed in [35], [42] and integrates the additional frequency, voltage and power quality functionalities proposed in this chapter. The MG voltage and frequency regulation strategies required to maintain power balance, including EV grid supporting strategies for providing primary frequency regulation are presented in sections 3.3 to 3.5. Based on the architecture and frequency responsive control of loads described in Chapter 2, an emergency load control strategy specifically designed for household appliances is also proposed in section 3.6 in order to improve MG resilience during autonomous operating conditions. Sections 3.7 and 3.8 describe centralized algorithms running at the MGCC, which will complement the action of the local control strategies described in sections 3.3 to 3.6. The algorithms running at the MGCC will be responsible for monitoring the MG operation state and provide an adequate coordination between the MG resources during emergency conditions, namely during islanded and while developing local restoration procedures. Finally, section 3.9 describes the voltage balancing strategy adopted in this thesis in order to improve MG voltage quality.
The MG hierarchical control for emergency operation, integrating the proposed control strategies was developed based on extensive numerical simulation studies. In a second phase, the same concepts were implemented in the Smart Grid and Electric Vehicle Laboratory (SGEVL) and validated using a MG experimental system, as described in Chapter 6. Both the simulation studies and the experimental tests focus on the following MG emergency functionalities:

Chapter 3 – MicroGrid Control Solutions for Emergency Operation
112
• Participation of EV in primary frequency control during MG islanding operation. • Effectiveness of secondary frequency control strategies considering the availability of a
smart metering infrastructure and the participation of MS connected to the network through grid-feeding and grid-forming inverters.
• Participation of flexible loads in MG emergency, through the development of DR strategies adapted to MG islanding operation conditions.
• Coordination of MG resources, namely generation, storage, EV and loads in order to improve the security of operation and avoid MG collapse due to insufficient generation and storage capacity.
• Validation of MG restoration procedure integrating EV as grid supporting units.
3.2 MicroGrid Hierarchical Control for Emergency Operation The MG emergency control will result in a combination of local and centralized control strategies, implemented at the local controllers and at the MGCC, respectively. Local control acts in short-term responding immediately to disturbances affecting the balance and voltage of the MG. Therefore, local control strategies do not depend on the MG communication infrastructure, relying in electric values (i.e. voltages, power, and frequency) collected from local measurements. On the contrary, centralized control strategies will act in a longer term interacting with the local control layer in order to produce the required changes in the resources behaviour [73]. The centralized control is designed to support the action of local control strategies, monitoring the MG operating state and providing an adequate coordination between the MG resources during emergency conditions.
A multilevel hierarchical control architecture has been adopted as proposed in [35], [42], which is based in ENTSO-E load frequency control [75]. The architecture is represented in Figure 3.2 and includes additional frequency, voltage and power quality functionalities at the different levels of control.
Figure 3.2. MG hierarchical control for emergency operation (adapted from [42]).

Chapter 3 – MicroGrid Control Solutions for Emergency Operation
113
Level 0 and Level 1 control are implemented at the local controllers and at the MG resources grid-coupling inverters. The provision of primary voltage and frequency regulation (i.e. Level 1 in Figure 3.2) is vital for the stability of the MG operating in emergency mode, requiring a robust and fast response from the controllers. Therefore, these functions will be implemented locally as external control loops of the Voltage Source Inverters (VSI) coupled to energy storage devices as it is discussed in section 3.3. Considering the capability of VSI for imposing voltage and frequency, specific voltage balancing strategies such as the ones described in section 3.9 can also be adopted in order to improve MG power quality.
Contrarily to what has been proposed in [42], the controllability of dispatchable MS can be explored to perform secondary frequency regulation (Level 2), reducing the power requirements from storage units providing primary frequency regulation [35]. This control can be implemented locally or centralized at the MGCC, as will be discussed in section 3.6. This functionality will also be demonstrated later through experimental demonstration, as discussed in Chapter 6.
Considering the limited resources of MG to maintain the stability of the system, specific strategies were adopted for EV complemented by active DR schemes, specifically designed for the MG emergency operation. The proposed strategies take advantage of the flexibility of EV and responsive loads in order to provide grid support during MG autonomous operation and ultimately increase MG resilience. Such functionalities are described in 3.4 and 3.6 and will be also extensively demonstrated in the laboratory scale MG as it is described in Chapter 6.
The main objective of tertiary control proposed in [42] was to manage the power flow between the MG and the upstream network when operating interconnected. However, by taking advantage of the smart metering infrastructure, new functionalities can be derived in order to ensure a safe islanding and manage the resources during autonomous operation. The algorithm proposed in section 3.7 will update the emergency operation strategies according to the actual operating state of the MG, allowing a better coordination of the available resources and consequently improving the MG resilience and success of the autonomous operation. As described in section 3.8, if islanding fails or a general blackout occurs, the MGCC will also be responsible for triggering and coordinating the MG restoration procedure, taking advantage of flexible resources such as the EV.
As discussed in Chapter 2, the two main control strategies for regulating the voltage and current of MS and storage grid coupling inverters are: active and reactive power (PQ) control and VSI. Such controls correspond to level 0 of MG control architecture. The choice between the two strategies will depend on the controllability of the resource connected to it. Regarding its controllability, the MG resources can be distinguished in three categories [35]:
• MG grid forming units are fast-responsive storage unit(s), such as flywheels, super-capacitors or batteries, coupled to a power electronic interface operated in VSI mode. Their capacity to provide fast power balance makes them the most adequate devices for fast frequency and voltage regulation [35], [42]. Also, given their ability of establishing voltage in magnitude and phase, they can be complemented with additional voltage balancing strategies to mitigate voltage unbalance, as it will be discussed in section 3.9.

Chapter 3 – MicroGrid Control Solutions for Emergency Operation
114
• Grid-supporting units correspond to dispatchable MS such as microturbines and fuel cells, being adequate for the provision of secondary frequency regulation or voltage control. The MG grid coupling devices of non-controllable and controllable units are controlled with a PQ control strategy, in order to provide a specific active and reactive power [35].
• Non controllable units correspond to non-dispatchable MS based on RES. These sources are usually interfaced with a PQ controlled inverter and are operated in order to maximize the power being extracted from the primary energy resource.
3.3 Primary Voltage and Frequency Regulation In conventional power systems, synchronous generators share load variations in accordance with their droop characteristics. The adoption of conventional droops to provide primary frequency regulation and maintain balance between local load and generation within the MG has been proposed in [32], [35], [41]-[42], [76]-[78]. The storage unit grid coupling inverter will be controlled as a VSI with external droop control loops, where the reference frequency and voltage magnitude will be determined as in (3.1).
QkVVPk
Q
P
×−=×−=
0
0ωω (3.1)
Where, ω, V - Reference angular frequency (rad/s) and voltage values (V) P, Q - Inverter active (W) and reactive power (var) outputs kP, kQ - Droop slopes (rad/s.W and V/var) ω0 , V0 - Idle values of the angular frequency (rad/s) and voltage (V) at no load conditions
In the moments subsequent to MG islanding, the local power imbalance is supported by VSI and will cause frequency and voltage variations in accordance to the active power-frequency (P-f) droop, similarly to the response of the conventional synchronous machines (see Figure 3.3). This control principle allows the VSI to react to system disturbances based only on information available at its terminals, not requiring fast communications among MC and the MGCC.
a)
b)
Figure 3.3. VSI droop characteristics: a) active power – frequency and b) reactive power – voltage droop.

Chapter 3 – MicroGrid Control Solutions for Emergency Operation
115
When operating with only one VSI the MG is said to follow a Single-Master Operation (SMO) strategy. However, the MG can operate with more than one VSI controlled through droop functions, thus following a Multi-Master Operation (MMO) strategy. In this case, if a disturbance occurs, the VSI controlled with droop functions will respond to the power unbalance and share the power variations according to their droop characteristics, as in (3.2) [32], [35]. The MG frequency deviation and the power sharing among the VSI can be determined by the system of equations represented in (3.3).
∑=
∆=∆n
iiPP
1 (3.2)
Where, ∆P - Unbalance between the MG generation and load ∆Pi - Active power injected by the i-th VSI
∆
=
∆
∆∆
×
PP
PP
k
kk
grid
grid
grid
n
Pn
P
P
ω
ωωω
2
12
1 '
1
00
10
10
01
0101
(3.3)
Where, ω’ - Post-disturbance MG angular frequency (rad/s) ωgrid - Pre-disturbance MG angular frequency (rad/s)
The power injected by a VSI will be made a function of their capacity, meaning that VSI with higher storage and power capacity will inject more power than the smaller units. This response can be achieved through a proper definition of the droop coefficients in proportion to the rating of the converter [35], [42], [78]. As demonstrated in (3.3) power sharing between the storage units connected to the MG only requires a local measurement of the frequency. This allows a fast response of the storage units to the disturbance and avoids the need of installing robust and fast communication channels between the VSI [41], [78]. Next subsection presents an illustrative example regarding the provision of MG primary frequency regulation through droop functions.
Conventional droop control was preferred over the alternative strategies discussed in Chapter 2, since this strategy provides a very effective active power sharing between more than one VSI connected to the system. Secondary frequency control will be implemented to correct the frequency deviation deriving from conventional droop strategy. Additional voltage control strategies can be adopted in order to regulate voltage in LV feeder, as discussed in section 3.9.
3.3.1 Example 1 - MicroGrid Frequency Regulation with Single-master and Multi-master Operation Modes A simplified MG system was considered to demonstrate the MG frequency regulation when adopting a P-f droop strategy, in both SMO and MMO modes. In this case the MG was importing about 66 kW prior to islanding, occurring at t = 20s of the simulation time. Figure 3.4
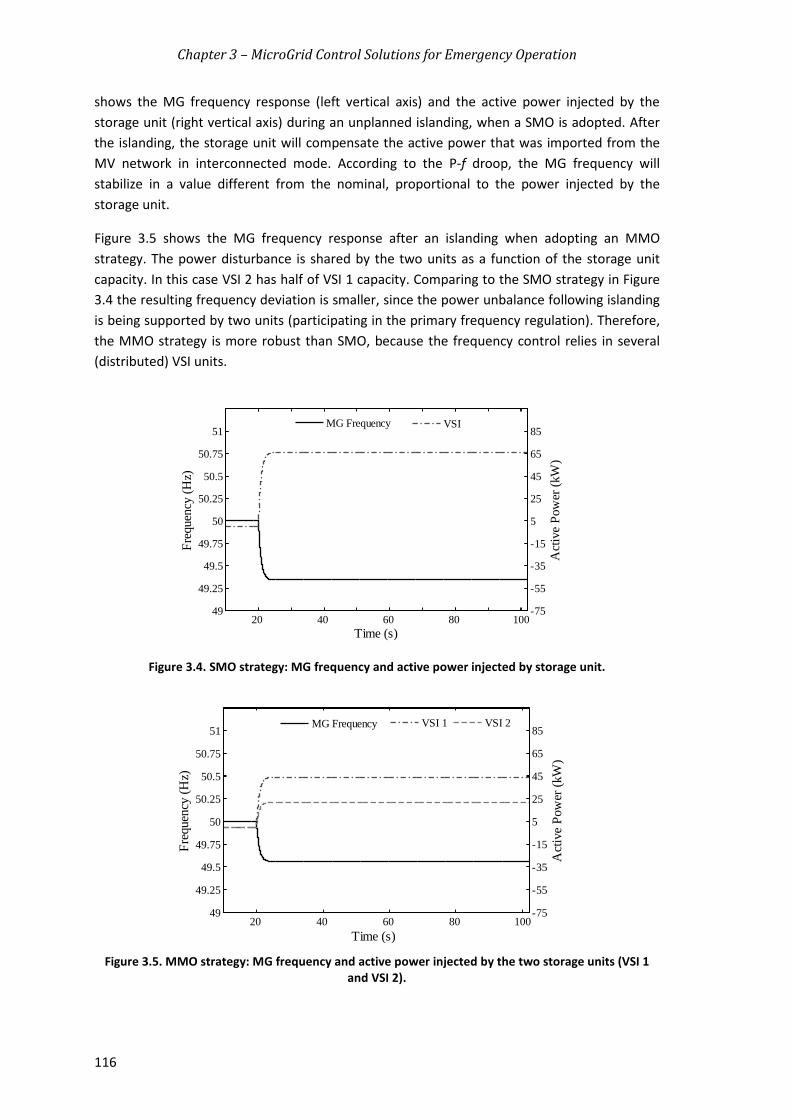
Chapter 3 – MicroGrid Control Solutions for Emergency Operation
116
shows the MG frequency response (left vertical axis) and the active power injected by the storage unit (right vertical axis) during an unplanned islanding, when a SMO is adopted. After the islanding, the storage unit will compensate the active power that was imported from the MV network in interconnected mode. According to the P-f droop, the MG frequency will stabilize in a value different from the nominal, proportional to the power injected by the storage unit.
Figure 3.5 shows the MG frequency response after an islanding when adopting an MMO strategy. The power disturbance is shared by the two units as a function of the storage unit capacity. In this case VSI 2 has half of VSI 1 capacity. Comparing to the SMO strategy in Figure 3.4 the resulting frequency deviation is smaller, since the power unbalance following islanding is being supported by two units (participating in the primary frequency regulation). Therefore, the MMO strategy is more robust than SMO, because the frequency control relies in several (distributed) VSI units.
Figure 3.4. SMO strategy: MG frequency and active power injected by storage unit.
Figure 3.5. MMO strategy: MG frequency and active power injected by the two storage units (VSI 1
and VSI 2).
49
49.25
49.5
49.75
50
50.25
50.5
50.75
51
Freq
uenc
y (H
z)
20 40 60 80 100-75
-55
-35
-15
5
25
45
65
85
Time (s)
Act
ive
Pow
er (k
W)
MG Frequency VSI
49
49.25
49.5
49.75
50
50.25
50.5
50.75
51
Freq
uenc
y (H
z)
20 40 60 80 100-75
-55
-35
-15
5
25
45
65
85
Time (s)
Act
ive
Pow
er (k
W)
MG Frequency VSI 1 VSI 2

Chapter 3 – MicroGrid Control Solutions for Emergency Operation
117
3.4 Electric Vehicles Contribution to Primary Frequency Support As previously discussed in Chapter 2, the EV load flexibility and storage capacity can provide a set of ancillary services to support power systems operation. Considering the specific case of MG operation, EV contribution for the provision of primary reserve would reduce the central storage capacity required to assure MG system robustness, during islanding conditions. In order to provide primary reserve, the EV charger can be controlled through the frequency-active power droop (f-P) control strategy proposed in [15], [133], [134], which will change the EV charging power according to the MG frequency.
The EV droop characteristic is represented in Figure 3.6. For frequencies around the nominal value the EV will charge the battery at a pre-defined charging rate (Pref). If a disturbance occurs and the frequency drops below the dead-band minimum, the EV reduces its power consumption, reducing the load of the system. When the MG frequency overpasses the frequency dead-band maximum, the EV can also increase its power consumption. For large disturbances, causing the frequency to go below the zero-crossing frequency (∆f0), the EV starts to inject power into the grid (Vehicle-to-Grid – V2G functionality). When the MG frequency becomes out of the pre-defined frequency range the vehicle will inject/absorb a fixed power (Pmax or Pmin).
The definition of the EV control parameters such as Pmax or Pmin and Pref will depend of the EV charger characteristics. Considering the charger technical limitations and the willingness of EV owners to participate in such services, the MGCC may remotely change the EV charging rate (Pref) and the frequency parameters such as ∆f0, ∆fmin and ∆fmax, in order to promote adequate coordination with the MG frequency regulation mechanisms (load shedding schemes, availability of energy storage devices and their State Of Charge (SOC)).
Figure 3.6. EV f-P droop characteristic.
Pmax
Dead-band
P
∆f
Pmin
∆f max
∆f min
Power Consumption
Pref
∆f0
V2G
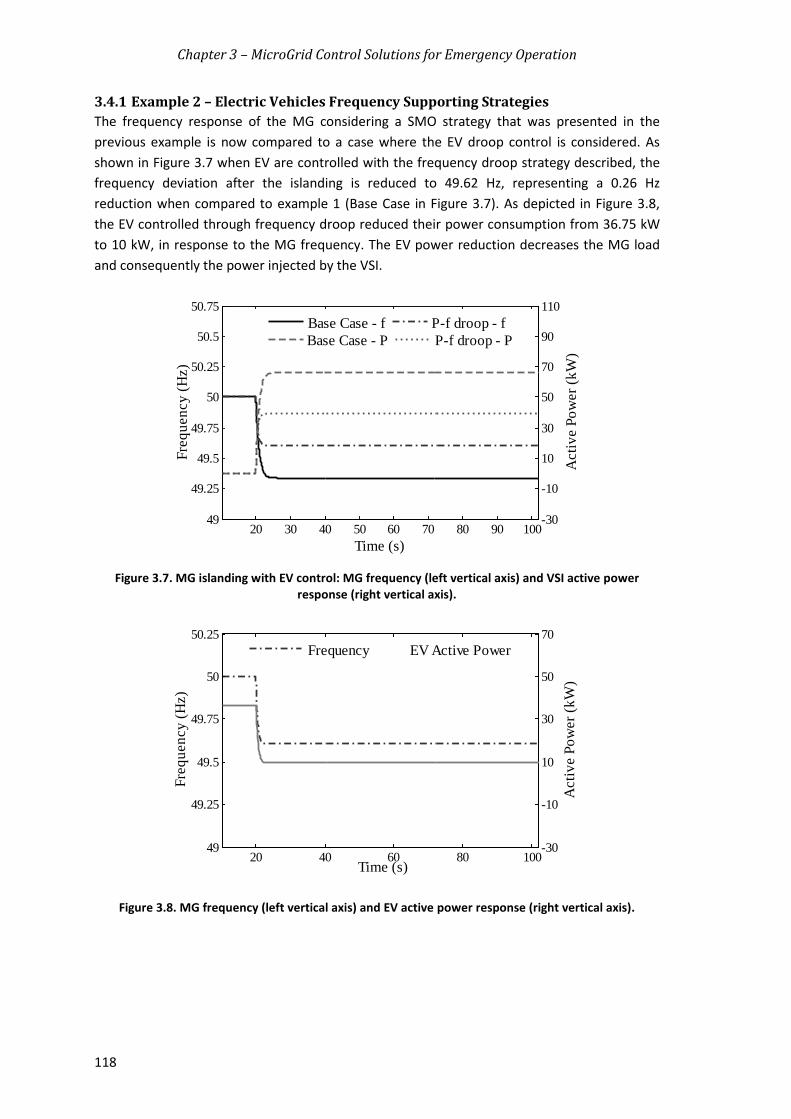
Chapter 3 – MicroGrid Control Solutions for Emergency Operation
118
3.4.1 Example 2 – Electric Vehicles Frequency Supporting Strategies The frequency response of the MG considering a SMO strategy that was presented in the previous example is now compared to a case where the EV droop control is considered. As shown in Figure 3.7 when EV are controlled with the frequency droop strategy described, the frequency deviation after the islanding is reduced to 49.62 Hz, representing a 0.26 Hz reduction when compared to example 1 (Base Case in Figure 3.7). As depicted in Figure 3.8, the EV controlled through frequency droop reduced their power consumption from 36.75 kW to 10 kW, in response to the MG frequency. The EV power reduction decreases the MG load and consequently the power injected by the VSI.
Figure 3.7. MG islanding with EV control: MG frequency (left vertical axis) and VSI active power response (right vertical axis).
Figure 3.8. MG frequency (left vertical axis) and EV active power response (right vertical axis).
49
49.25
49.5
49.75
50
50.25
50.5
50.75
Freq
uenc
y (H
z)
20 30 40 50 60 70 80 90 100-30
-10
10
30
50
70
90
110
Time (s)A
ctiv
e Po
wer
(kW
)
Base Case - P P-f droop - PBase Case - f P-f droop - f
49
49.25
49.5
49.75
50
50.25
Time (s)
Freq
uenc
y (H
z)
20 40 60 80 100-30
-10
10
30
50
70
Act
ive
Pow
er (k
W)
EV Active PowerFrequency

Chapter3–MicroGridControlSolutionsforEmergencyOperation
119
3.5 SecondaryLoad‐FrequencyControl
The secondary frequency control ensures that after a disturbance the frequency returns to its nominal value. As shown in Figure 3.4 and Figure 3.5, during the islanding transient the power balance is assured by the MG energy storage devices, which would keep on injecting or absorbing active power until the frequency is restored to the idle value.
The secondary control will dispatch controllable MS, such as microturbines and/or fuel cells in order to compensate the power injected by the storage units, consequently correcting the frequency deviation. Two secondary load‐frequency control strategies were identified: one implemented locally at each controllable MS and another centralized and mastered by the MGCC.
3.5.1 LocalSecondaryFrequencyControlLocal secondary frequency control is added to the active power control of MS in order to determine the new active power reference to compensate the power injected by the storage units. The main advantage of local secondary frequency control is that it only relies on local frequency measurement to define the new reference power. However, the MS active power response will also depend of the PI controller parameters, consequently influencing the time of response of the secondary frequency control.
If the MS inverter is controlled with a PQ strategy, the new reference for the MS active power output (Pref) is determined by a PI controller based on MG frequency error [89], as shown in Figure 3.9 a). If the MS inverter is controlled as a VSI (usually when the MS is coupled to a storage unit), local secondary control can be performed by updating the idle frequency (ω0) of the MS P‐f droop function, as in Figure 3.9 b). A PI controller can be used to determine the new idle frequency (ω0f) based on the MG frequency deviation in order to update the active power droop characteristic [41], [42], as in (3.4).
)'()'(
00
refIrefP
if
kk
(3.4)
Where,
f0 ‐ New idle angular frequency value (rad/s)
i0 ‐ Initial idle angular frequency value (rad/s)
ref ‐ MG reference angular frequency (rad/s)
ω’ ‐ Post‐disturbance MG angular frequency (rad/s)
a)
reff
measf dispatchP
f refPP

Chapter 3 – MicroGrid Control Solutions for Emergency Operation
120
b)
Figure 3.9. Local secondary frequency control for: a) PQ control and VSI control.
3.5.2 Centralized Secondary Frequency Control Centralized secondary control determines the new MS set-points based on the overall state of the MG. The control relies on the communication infrastructure to send the set-points to the MS controllers. In [42] a centralized secondary frequency and voltage restoration loop was proposed considering only droop controlled VSI. The frequency error is corrected through PI controllers as in (3.4) and the obtained compensation signals are sent to each VSI. However, this method assumes that all the VSI have the same frequency droop parameters, namely the initial idle frequency. This might not be truth if the VSI is coupled to storage and other MS, where the initial idle frequency is set to the power available from the MS.
In [89] the active power set-points to be sent to the MS are determined considering the MG frequency deviation and an economic dispatch problem formulation, which is solved online at the MGCC. The MS power set-points are then defined according to participation factors, determined through pre-defined cost functions. The strategy adopted in [89] requires the implementation of an optimal power dispatch algorithm, which updates the participation factors every minute. In [156], a simpler strategy was proposed, where the participation factors which will define the MS power set-points are determined according to the MS capacity. However, this solution may not lead to a feasible solution, because the units’ response will depend on their reserve capacity and not only in their maximum power capacity. For example, if the unit with high capacity is operating at its maximum power its participation factor should be zero, since it won’t be able to participate in secondary frequency regulation.
An alternative centralized secondary control strategy based on active power unbalance is proposed in this dissertation. The control strategy maintains the simplicity of the strategy proposed in [156]. However the real-time data provided by the SM and local controllers will be considered to characterize the MS current power injection and its reserve capacity. The algorithm developed enables the coordination between MS controlled as PQ and VSI as well as with other MG entities, such as flexible loads or EV.
The algorithm to be implemented at the MGCC is shown in Figure 3.10. The MG power unbalance (∆P) is determined considering the power injected by the MG main storage unit (PVSI) and the EV injected power (PEV). The contribution of each controllable MS will be defined through a participation factor (fpi), which is determined (for unit i) by the ratio between its
minP maxP
ω
P
0ω
01ω Normal operating conditions
Secondary frequency control
0

Chapter 3 – MicroGrid Control Solutions for Emergency Operation
121
reserve and the total controllable MS reserve, as in (3.5). The resulting set-points are then sent from the MGCC to local MC. In order to be compatible with MS control, the algorithm determines new idle values for the angular frequency of the MS droop characteristics (ω0) for MS controlled as VSI, and new power set-points for PQ controlled MS.
∆=∆
⋅∆=∆
=
∑=
PP
fpPPRRfp
n
iMS
iMS
ii
i
i
1
(3.5)
Where, fpi - Participation factor of the ith controllable MS. Ri - Reserve capacity of unit i. R - Total MS reserve capacity. ∆PMSi - Active power step of unit i. ∆P - Active power unbalance following a disturbance.
Figure 3.10. Centralized secondary control algorithm.
Start
• Determines power unbalance ∆P:∆P=PVSI + ∆PEV
• Determines new power set-points for controllable MS:
∆PMSi=fpi.∆P
No
Yes
MS 1 MS 2
∆PMS1
)( 110 MSPPkp ∆++= ωω
Determines droop compatible dispatch
Determines droop compatible dispatch
PMS2
PMS1 PMSn
PVSI
)( 220 MSPPkp ∆++= ωω
∆PMS2 ∆PMSn
| PVSI|> VSIdb
PEV
MS n
MGCC
VSI controlled MS
MSnnnewref PPP ∆+=_
PQ controlled MS
Determines new reference power

Chapter 3 – MicroGrid Control Solutions for Emergency Operation
122
3.5.3 Example 3 – MicroGrid Secondary Frequency Control Figure 3.11 compares the MG frequency when considering primary and secondary frequency response with and without the participation of EV in primary frequency control (MG islanding takes place at t = 20s). The centralized secondary frequency control algorithm is able to correct the frequency error in less than 20 seconds.
As shown in Figure 3.12, secondary control reduces the power injected by the storage unit, recovering the frequency to the nominal value (in this case 50 Hz). In this case, in order to compensate the 66 kW of power imported from the MV network, it was assumed that the MG comprises three Single Shaft Microturbines (SSMT) running on gas, that were dispatched to their maximum capacity (30 kW in this scenario) after islanding. The typical response of this type of units is presented in Figure 3.13.
Figure 3.11. MG frequency response considering: only primary regulation (Base Case), primary and secondary control and the EV f-P droop.
Figure 3.12. VSI active power response considering: only primary regulation (Base Case), primary and secondary control and the EV f-P droop.
10 20 30 40 50 60 70 80 90 10049
49.25
49.5
49.75
50
50.25
50.5
Time (s)
Freq
uenc
y (H
z)
Base CaseSecond. ControlSecond. Control and EV
10 20 30 40 50 60 70 80 90 100-15
5
25
45
65
85
105
Time (s)
Act
ive
Pow
er (k
W)
Base CaseSecond. ControlSecond. Control and EV

Chapter 3 – MicroGrid Control Solutions for Emergency Operation
123
Figure 3.13. Active power injected by controllable MS.
3.6 Load Control Strategies for MicroGrid Emergency Operation As previously discussed, the development of innovative DR strategies dedicated to LV consumers may contribute to improve MG stability, particularly for the provision of primary and secondary reserve. Controlling the MG loads during emergency operation may be required when operating autonomously in order to:
• Maintain power balance between local generation and load. In the moments subsequent to MG islanding the energy storage unit(s) is(are) responsible for compensating the power unbalance between generation and load. Then, secondary control regulates frequency to its nominal value, by changing the power output of the controllable MS for compensating the power injected by the storage unit. However, if there isn’t enough generation reserve, the MG load will have to change in order to meet the available generation. Otherwise, the MG will only operate during the period where the storage unit is capable of absorbing or supplying the required energy to maintain power balance.
• Avoid the disconnection of the MG storage unit due to violation of maximum current limit or inadequate SOC. In the second case, if fully charged, the storage unit won’t be able to absorb power when the MG generation exceeds the load. On the other hand, if discharged the storage will not be able to supply the energy required during the period of response of the secondary control.
• Avoid large frequency excursions to avoid the cascade disconnection of MS and loads.
For each one of the situations described above, the duration of the load control event will vary. For example, in the first case, if the MG load exceeds the available controllable microgeneration reserve, some loads will have to be disconnected until the MG load decreases or the non-controllable microgeneration increases, or until the MG reconnects to the MV network. The disconnection period may last from minutes to several hours or days.
In order to avoid the disconnection of the storage unit or MG resources, load control is required even when the MG has sufficient generation reserve, in order to reduce the power required from the storage and consequently reduce the frequency excursion. However, load
10 20 30 40 50 60 70 80 90 1000
10
20
30
40
Time (s)
Act
ive
Pow
er (k
W)
SSMT 1SSMT 2SSMT 3

Chapter 3 – MicroGrid Control Solutions for Emergency Operation
124
control will only be required until the secondary control stabilizes the MG frequency. For example, if the MG is importing a large amount of power from the upstream network causing a large frequency excursion, disconnecting some of the MG load will reduce the initial power disturbance. Since the MG has sufficient generation to supply the load, those can be reconnected after the islanding transient. Therefore, the duration of the load control event will last some tens of seconds or a couple of minutes, depending of the time of response of the controllable MS. In this sense, the MG load control actions within an emergency load control program can be classified according to its duration:
• Temporary load control – the load will participate in primary frequency response during the islanding transient, in order to reduce the frequency excursion or the energy required during the secondary control action.
• Permanent load control – the loads will participate in primary frequency response during the islanding transient, until the generation and/or load change or the MG reconnects to the upstream network.
A load control strategy has been designed specifically for the MG emergency operation, considering smart metering infrastructure, the framework developed under European project ADDRESS and the additional frequency responsive schemes discussed in section 2.4. The main objective is to improve MG stability by increasing the flexibility of MG loads, while minimizing consumers’ discomfort. In order to minimize the amount of load to be disconnected while ensuring the security of the MG operation, the strategy proposed enables the consumer to prioritize their home appliances in order to maximize its comfort.
The emergency load control architecture is represented in Figure 3.14. Contrarily to what has been proposed in ADDRESS framework, in this work it has been considered that the MGCC will be able to interact directly with the household loads through the interface provided by the SM. At the household level, the HEM will be responsible for interacting with the MG operation system and the loads. The following HEM functionalities were considered:
• Incorporating consumers’ preferences. The HEM incorporates a Graphical User Interface (GUI), allowing the user to define their preferences and comfort limits. Based on this information the HEM defines a load priority list, dividing the household appliances in different groups as in [25], [142], [143], [155]. An example of such a list is shown in Table 3.1, considering the first group of loads as the less priority loads.
• Calculating the load availability. The HEM will define the availability for load control every 15 minutes, considering owner’s priority list and the appliances power consumption and technical requirements [144]-[146]. It was assumed that the availability of loads wouldn’t change significantly during the next 15 min as in [144]-[146]. The aggregated availability should be divided in temporary and permanent load availability.
• Control the loads. The HEM will be responsible for sending the on/off signals to the load controllers, based on the frequency measurement collected from the SM as proposed in [153] and the permanent and temporary load scheduling performed by the MGCC.
The availability of loads for temporary and permanent load control are sent to the MGCC, through the smart metering infrastructure. This information is then processed at the MGCC,

Chapter 3 – MicroGrid Control Solutions for Emergency Operation
125
which based on the algorithm described in section 3.7 will define for every 15 minutes the load control solution (including dumb charging EV) required to maintain the stability of the MG in islanding conditions and send it to the SM. The information sent by the MGCC includes:
• The amount of power to connect/disconnect temporarily. • The amount of power to connect/disconnect permanently. • The switching off frequency for each group of loads, as proposed in [151]-[153].
Frequency trigger can be updated according to the MGCC algorithm. As in [153], less priority loads will be disconnected first and the priority loads will only disconnect during large frequency excursions.
Figure 3.14. Emergency load control architecture.
Table 3.1. Load group characterization.
Non-priority
Priority
Load Group Appliances
I Pool and water pumps
II Space and water heaters, tumble dryers
III Cloth and dish washing machines
IV Electric cookers, refrigerators, lighting and general plugs
In this thesis, it was assumed that the algorithm housed at the HEM, responsible for controlling the switching on/off the loads, ensures in adequate time frame the load control actions defined by the MGCC such as proposed in [143], [153]. Additional delays are also introduced to avoid further transients caused by the synchronous response of the devices.
The LC can be implemented as intelligent plugs, which measure the load power consumption and are capable of responding to the control signals sent by the HEMS. The frequency measurement could be integrated in the LC as proposed in [149] or based on the measurement of the SM as in [153] .

Chapter 3 – MicroGrid Control Solutions for Emergency Operation
126
As shown in Figure 3.14, the EV was also included in the load control architecture. The MGCC will use the information sent by the VC, differentiating between dumb charging and smart charging EV adherents. When adopting a dumb charging mode, the EV cannot be controlled through f-P droop strategy, behaving as a conventional (constant) load. In this case, the algorithm housed at the MGCC will disconnect all the dumb charging EV with a SOC higher than 80%, prior to considering the demand availability. If disconnecting the dumb charging EV is not sufficient, the load availability is taken into consideration.
When the LC incorporates local frequency measurement, an additional enabling load control signal is required, in order to disable the control of some load groups and prevent their unwanted response to the MG frequency. For example, loads participating in temporary load control will only return to their initial state when frequency returns to 49.9 Hz and if the MG has sufficient generation reserve to compensate their connection/disconnection.
3.6.1 Example 4 – MicroGrid Emergency Load Control Strategy Figure 3.15 shows the MG frequency behaviour following islanding at t=20s, when considering the MG emergency load control strategy proposed in this work. Four scenarios were tested for illustrative purposes:
• Base Case – considering only primary and secondary frequency control. The EV and loads do not participate in the MG frequency regulation.
• Case 1 – All the EV connected to the MG are controlled with a f-P droop, representing a total of 49 kW. Load control is not considered.
• Case 2 – Only 40% of the EV connected to the system are controlled with a f-P droop characteristic and 20% of the MG load is available for participating in the emergency load control strategy.
• Case 3 - The EV do not participate in the MG frequency regulation and 36% of the MG load is available for participating in the emergency load control strategy.
Figure 3.15. MG frequency response with EV and emergency load control.
10 20 30 40 50 60 70 8049
49.25
49.5
49.75
50
50.25
Time (s)
Freq
uenc
y (H
z)
Base CaseCase 1 (EV=100% DR=0%)Case 2 (EV=40% DR=20%)Case 3 (EV=0% DR=36%)

Chapter 3 – MicroGrid Control Solutions for Emergency Operation
127
The coordination of EV and load control strategies demonstrates great benefits in terms of the severity of the frequency disturbance and consequently in the storage solicitation. As shown in Figure 3.16, similarly to the results obtained for the EV frequency droop control, the participation of load provides primary reserve to the system during the secondary control response time. Further improvements on the reconnection of loads can be performed in order to minimize the transients.
Figure 3.16. VSI active power output with EV and emergency load control.
3.7 Managing the MicroGrid Energy Balance Following Islanding During autonomous operation, the effectiveness of the MG frequency regulation discussed in sections 3.3 and 3.6 relies on the availability of the MG resources, such as:
• MG storage capacity, which is essential to ensure primary frequency regulation. • Controllable MS reserve capacity, in order to perform secondary frequency regulation. • Non-controllable MS power production, which acts as a negative load in the system. • MG flexible load, including the EV connected to the LV network. • MG load in comparison to total generation.
Monitoring these variables and promoting the coordination among all MG resources will improve the MG resilience to severe disturbances and maximize the time that the MG is able to operate autonomously.
In this sense, a new module running online in a periodic basis is proposed to be integrated in the MGCC. This module will use the information sent by the SM in order to characterize the MG operating conditions and update the MG emergency operation strategies according to the actual operating state. The main objectives of this module are:
• Minimize the amount of load to be disconnected. • Minimize the time during which loads are disconnected. • Ensure that the MG has sufficient storage and reserve capacity to ensure frequency
regulation following a given disturbance. • Maintain frequency excursions within admissible limits.
10 20 30 40 50 60 70 80-30
-10
10
30
50
70
90
110
Time (s)
Act
ive
Pow
er (k
W)
Base CaseCase 1 (EV=100% DR=0%)Case 2 (EV=40% DR=20%)Case 3 (EV=0% DR=36%)

Chapter 3 – MicroGrid Control Solutions for Emergency Operation
128
The MGCC module runs online in a periodic basis and is responsible for the management of MG autonomous operation. It includes two algorithms: the load and EV emergency scheduling algorithm and the MG online balancing tool. The first one will run periodically during MG interconnected operation in order to evaluate the MG operating state and schedule (if necessary) flexible loads and EV to support primary and secondary frequency control following an unplanned islanding event, according to the strategy described in section 3.6. The main objective of this procedure is to minimize the loads to be disconnected in the moments subsequent to the islanding transient, while assuring that frequency and storage devices SOC remain within acceptable limits.
Following MG islanding, the first module is disabled and the MG online balancing tool will be used to ensure MG operation. The main objective of this tool is to manage the MG resources during islanded operation and ensure the MG stability if additional disturbances caused by the fluctuation of load and microgeneration occur. If a sudden loss of power generation due to the variability of renewable resources occurs or load increases and the microgeneration reserve is insufficient, the algorithm will schedule additional load control actions or reduce microgeneration or EV power.
3.7.1 Load and Electric Vehicles Emergency Scheduling Algorithm MG islanding may occur either due to planned actions or due to severe disturbances occurring in the main grid. In the first case, the islanding transient can be minimized by balancing the MG load and generation before islanding. However, an unplanned islanding may occur with major unbalance between load and generation, compromising the stability of the system.
Focusing in the unplanned islanding events, the load and EV emergency scheduling algorithm will evaluate (periodically) the MG operating state and determine if the available resources are adequate to successfully maintain a secure autonomous operation. The proposed algorithm has been published in [174].
An overview of the proposed algorithm is represented in Figure 3.17 and consists of five main steps:
1) Characterize the MG operating state, regarding the power flow between the MG and the MV network and the MG load (disaggregated between the controllable/flexible and non-controllable load), storage and microgeneration reserve capacity, either to increase (Rup) or reduce (Rdown) its power output.
2) Determine the severity of the disturbance, resulting from the difference between the power imported/exported from the main grid (Pdist) and the total microgeneration reserve capacity (R).
3) Determine the amount of load to shed/connect (∆P). In case the MG does not have enough reserve capacity, it is necessary to exploit emergency responsive loads to ensure power balance. If the MG is importing power and there isn’t enough reserve capacity to supply the excess load, it is necessary to shed the exceeding power. On the contrary, if the MG is exporting power it might be necessary to connect flexible loads. An initial solution for permanent load shedding (as described in 3.6) is determined at this stage.
4) Evaluate the security of the MG during an unplanned islanding. Following step 3), the algorithm determines if the MG frequency and the batteries SOC goes out of admissible

Chapter 3 – MicroGrid Control Solutions for Emergency Operation
129
limits, in the moments subsequent to islanding. 5) Schedule temporary load control. If frequency and/or storage capacity (SOC) are out of
admissible limits it might be necessary to temporarily shed/connect some loads to ensure power balance during the time of response of secondary control.
Figure 3.17. MG load and EV emergency scheduling algorithm.
The proposed approach is intended to support MG islanding operation during short periods of time (i.e. less than 1 hour). The algorithm will run online at the MGCC every 15 minutes, considering the availability of responsive loads determined by the HEM and received from the SM. It has been considered that the power disturbance (Pdist) is positive when the MG is

Chapter 3 – MicroGrid Control Solutions for Emergency Operation
130
importing power from the MG and negative when exporting. For larger time frames of operation in islanding conditions, complementary approaches need to be considered, involving forecasting of loads with different degrees of flexibility (including EV) as well as forecasts for renewable based microgeneration [157].
The main steps of the algorithm are now described in detail.
1) Characterize the MG operating state
The algorithm will characterize the MG operating state based on the information collected locally at the MGCC and remotely from the SM, as described in Table 3.2.
Table 3.2. Data collected at the MGCC for MG operating state characterization.
From Data Description
MGCC – Active power flow between the MG and the MV network. – Storage active power consumption/injection and SOC.
Smart meter
EV – Active power consumption from EV charging – Battery SOC – Charging mode (non-controllable, f-P droop enabled )
Other loads – Active power consumption – Availability to participate in MG emergency load control
strategy
MS
– Non controllable: Active power generation from RES (PV panels, micro-wind turbines)
– Controllable: o Active power generation from controllable sources
(micro-CHP with gas microturbines or fuel cells) o Reserve up o Reserve down
Storage (if participating in primary frequency control)
– Storage active power consumption/injection and SOC.
Being a key element of MG emergency operation, the MGCC quantifies the MG total storage capacity of the unit(s) providing primary frequency regulation. At least one unit is necessary and is likely to be installed at the LV busbar of the MV/LV substation. Otherwise, the MGCC will have to communicate with the storage unit management system in order to assess the storage unit SOC. If there are other storage units connected to the MG, the respective SM should be able to send this information. Additionally, the algorithm requires as input the active power exchanged with the MV network, which will reflect the initial power disturbance during islanding.
Regarding local loads, the algorithm differentiates the power consumption related to EV charging from the other loads. Regarding the EV, the algorithm will determine the power consumption of EV controlled through f-P droop strategy and the dumb charging. When adopting a dumb charging strategy, the EV which batteries have SOC higher than 80% will be considered non-priority loads for load shedding.

Chapter3–MicroGridControlSolutionsforEmergencyOperation
131
In order to implement the emergency load control strategy described in the previous section, the algorithm will differentiate the power consumption from responsive loads. As described in the previous section, loads will be divided in distinct groups according to their priority. This information will be aggregated at the MGCC as represented in Figure 3.18. For each group a maximum control period is considered (tII, tIII, TIV shown in Figure 3.18) with exception of the loads in Group I (i.e. non‐priority loads), which can be disconnected for an indefinite period of time. Switching on and off frequencies will be determined for each load group.
Figure 3.18. Aggregated load availability for the next time period.
In order to correctly characterize the MG resources it is also necessary to differentiate the generation resources regarding their controllability, aggregating separately the active power injection from controllable and non‐controllable MS. In this thesis, the active power injected by the non‐controllable MS such as PV panels or micro‐wind turbines was considered constant during the algorithm scheduling timeframe of 15 minutes. This could be improved if the MGCC integrates the information of short‐term solar and wind forecasting, as proposed in [157].
Regarding controllable MS, such as microturbines or fuel cells, in addition to their actual power generation it is also necessary to quantify their reserve. The MG total reserve capacity up and down will result in the sum of all the values received from the SM as in (3.6).
n
i
iiG
n
i
idown
iiG
n
i
iupup
Gdown
G
PPRR
PPRR
1min
1
max1
(3.6)
Where,
upR , downR ‐ MG total reserve capacity up and down respectively. iupR , i
downR ‐ Reserve capacity up and down of unit i, respectively.
i
GP ‐ Active power generation of MS of unit i.
iGP max ,
iGP min ‐ Maximum and minimum active power generation limits of unit i.

Chapter 3 – MicroGrid Control Solutions for Emergency Operation
132
2) Determine the severity of the disturbance
The severity of the disturbance caused by an unplanned islanding, Pdist, results from the balance between the MG active power generation and consumption, which is equal to the active power flow with the MV network prior to the islanding (neglecting the LV network active power losses). After the islanding, the MG generation will have to match the load in order to stabilize the MG frequency in the nominal value.
If the MG is exchanging a small amount of power with the upstream MV grid (a dead-band of 1 kW was considered), it is assumed as balanced and no load or EV will be scheduled for control. This dead-band should be adjusted according to the storage power capacity and droop characteristics, to avoid a significant permanent frequency error or excessive discharging of the battery. If power unbalance is within the dead-band, the algorithm will wait for a new set of data and run for the next 15 min. Otherwise, if Pdist is higher the algorithm will evaluate if load control is required in order to maintain the stability of the MG after the islanding.
3) Determine the amount of load to shed/connect (∆P)
In step 3) the algorithm will evaluate if the MG has sufficient generation reserve to match the MG load. Two different situations can occur:
• Load disconnection, if the MG load exceeds the MG maximum generation capacity it is necessary to disconnect some of the MG loads;
• Dump load connection, if the MG generation is higher than the MG loads, it might be necessary to connect some dump loads in order to avoid that the MS operate below their minimum technical limit and overcharging the MG storage unit(s).
In both cases, load control is required until the MG generation and load changes, or the MG reconnects to the upstream network. Therefore, permanent load control will be mobilized.
The amount of load to control (∆P) is determined as in (3.7), based on the MG reserve capacity up (Rup) and down (Rdown) and on the active power unbalance (Pdist) estimated in step 2).
<−=∆>−=∆
00,
, distdistdown
distdistup
PPRPPPRP
(3.7)
If the total load to control (∆P) is lower than a pre-defined minimum limit, no permanent load control scheme will be considered and the algorithm will jump to step 4 in order to evaluate the resilience of the MG following an unexpected islanding. Otherwise, an initial solution for the permanent load shedding will be determined based on the aggregated availability of loads and EV.
Load control will be implemented considering the emergency load control strategy described previously in section 3.6. When the algorithm ends, a final solution for permanent load control is defined and will be sent to the SM. The HEM will then be responsible for ensuring that loads respond accordingly during an unplanned islanding, based on a local frequency measurement.

Chapter 3 – MicroGrid Control Solutions for Emergency Operation
133
4) Evaluate the security of the MG during an unplanned islanding
During islanding conditions, if the MG lacks energy to ensure power balance, the system will collapse. The storage unit energy balance (values in Joule) in the moments subsequent to MG islanding can be determined by (3.8).
MSEVLoad EEEE −+= (3.8)
Where, E - Energy balance of the storage unit
LoadE - Energy consumed by the MG loads.
EVE - Energy consumed during EV charging.
MSE - Energy provided by the MS (both controllable and non-controllable).
The energy consumed by the loads will change if load control is considered as in (3.9).
RLNRLLoad EEE += (3.9)
Where,
NRLE - Energy consumed by the non-responsive loads
RLE - Energy of responsive loads participating in emergency load control.
The energy consumed by EV (EEV) will vary according to the charging strategy adopted as in (3.10).
%80%80 >< ++= dumbSOCdumbSOCdroopEV EEEE (3.10)
Where,
droopE - Energy consumed by the EV controlled through f-P droop strategy
%80<dumbSOCE
- Energy consumption of EV adopting a dumb charging strategy with battery SOC lower than 80%.
%80>dumbSOCE
- Energy consumption of EV adopting a dumb charging strategy with battery SOC higher than 80%.
As discussed previously, when load shedding is required the EV with SOC higher than 80% will be considered for disconnection. When adopting a dumb charging strategy, the EV charging was considered constant during the 15 minute period.
The controllable MS will participate in secondary frequency control, having a direct influence on the energy injected/absorbed by the MG storage unit. However, the controllable MS such as SSMT or fuel cells (for example Solid Oxide Fuel Cells – SOFC) present significant time constants with respect to power variations, as it is represented in Figure 3.13. In order to correctly estimate the energy provided by these MS a dynamic model is required. Without relying in complete models, which are discussed in detail in the next chapter, at this stage a conceptual approach to the procedure is provided. The simplified MG dynamic model represented in Figure 3.19 was adopted, which corresponds to a single equivalent bus, considering the MG load, generation and storage resources. The model adopted neglects the

Chapter 3 – MicroGrid Control Solutions for Emergency Operation
134
LV network and the dynamics of the power inverters, which has inherent time constants much lower than the ones representing the main MG dynamic behaviour. Under these assumptions, the energy storage unit coupled to a VSI and EV power electronic interfaces are represented by their external P-f control loop. Complementarily, a time delay TdP (s) is used to represent the decoupling functions used in VSI, being responsible for the dynamics of the MG response in the first moments subsequent to any transient. A small time constant Tinv (s) is used in order to represent delays associated to the response of the EV grid coupling inverter [35]. Loads and non-controllable MS are represented as constant active power sources.
Figure 3.19. MG simplified dynamic model to run at the MGCC.
The load and EV schedule and the MS dispatch resulting from the secondary control algorithm are used as inputs of the MG dynamic model in order to evaluate the energy balance within the MG and the expected frequency deviation for a given period. As outputs, the model provides the total energy injected by the storage units and the MG frequency response. The VSI energy is measured as the model simulates the islanding until the secondary frequency control stabilizes frequency close to the nominal value (a 5 mHz dead-band was considered ).
5) Schedule temporary load control
Based on the values determined by the simplified dynamic model, the algorithm then verifies if the MG storage unit(s) have sufficient capacity to ensure power balance and if the minimum frequency does not violate the admissible frequency limits (fmin). If one of these conditions is violated, temporary load control will be considered. The amount of load required to minimize the power excursion and compensate the slow response of some MS is determined based on an iterative procedure. The amount of load to curtail is estimated based on the deviation

Chapter 3 – MicroGrid Control Solutions for Emergency Operation
135
between the frequency estimated by the simplified model and the frequency limit considered. The model will run again in order to evaluate if the temporary load control solution maintains frequency within limits. The process will run until a solution is defined.
The load and EV emergency schedule algorithm will run every 15 min corresponding to the refreshing time of the measurements collected from the SM. The algorithm will run and evaluate the need of changing the solution found previously.
The final solution provided by the load and EV emergency schedule algorithm includes the amount of load and EV to disconnect permanently and temporarily and its corresponding trigger frequencies. The load schedule is defined based on the aggregated load availability (see Figure 3.18), determined by the MGCC based on the information sent by the SM. For each group of load dispatched is attributed a switching off or on frequency, as proposed in [151]-[153], compatible with the minimum frequency estimated by the simplified model.
The HEM (see Figure 3.14) will receive the control solution through the SM and pre-parameterize the LC, in order to ensure that if a unplanned islanding occurs the loads will respond as planned.
3.7.2 MicroGrid Online Balancing Tool In order to ensure a secure islanding and improve the MG resilience following islanding, the MG should be able to autonomously respond to changes in the balance between local generation and loads. The algorithm described in previous section contributes to smooth the islanding transient and the impact in consumers comfort. However, the islanding operation may last several hours depending on the severity of the disturbance that occurred upstream. During this time, additional disturbances may compromise the MG stability if the MG lacks sufficient storage and generation capacity.
The MG online balancing tool main objective is to coordinate the MG controllable resources during islanded operation, in order to avoid the MG collapse. The algorithm represented in Figure 3.20 will be activated immediately after islanding. During the islanding transient, the main objective will be to coordinate the response of the secondary frequency control with the load and EV control schedule defined prior to the islanding.
Following MG islanding, the algorithm starts by activating the secondary frequency control algorithm described in section 3.5.2, in order to dispatch the controllable MS. When the storage units power output is close to zero (VSIdb), indicating that the MG is in steady state and secondary load-frequency control has stabilized frequency, the algorithm will enable the disconnection/connection of loads participating in temporary load control, scheduled by the load and EV emergency scheduling algorithm. This allows a gradual reconnection of loads, avoiding large frequency excursions that may compromise MG stability.
The algorithm will continuously monitor the MG operation state ensuring that there are sufficient resources to ensure power balance. The characterization of the MG operating state is exactly the same as previously described. However, instead of the power flow between the MG and the upstream network, the algorithm will check the power injected/ absorbed by the storage unit connected at the LV busbar of the MV/LV substation. If the storage units’ power

Chapter 3 – MicroGrid Control Solutions for Emergency Operation
136
becomes outside the dead-band (VSIdb) the algorithm checks if there is enough reserve or storage capacity to ensure balance, otherwise the algorithm will evaluate the availability of flexible loads and determine if it is necessary to curtail or reconnect some of the loads. If a solution is found, the MGCC sends a signal to the SM in order to control the loads.
Figure 3.20. MG islanded operation algorithm.
In case controlling flexible loads is insufficient to ensure balance and the storage units SOC is close to its maximum or minimum SOC, the algorithm will activate a last resource control, which consist of a rule based procedure which gradually change EV and MS reference power or disconnect some consumers to avoid the MG collapse. The procedure is as follows:
1. Checks the storage SOC: a. The storage SOC is below the minimum admissible limit. If there isn’t any load
available for control and the battery SOC is reaching its minimum admissible limit the algorithm will start by decreasing EV charging power and then disconnect non-priority consumers until balance between generation and load is achieved.

Chapter 3 – MicroGrid Control Solutions for Emergency Operation
137
b. The storage SOC is above the maximum admissible limit. If batteries are fully charged and the microgeneration increases and there isn’t any load available for control, the algorithm will try to connect EV, or as a last resource gradually reduce the MS reference power. The power reduction signal will be done in small steps.
The integration of the two algorithms at the MGCC will not override the autonomous response of the frequency control strategies described. Instead, its main objective will be to ensure that there are sufficient resources to perform both primary and secondary frequency control. The efficiency of some of the strategies proposed could be optimized. However, this would increase the complexity of the strategies to be implemented in real controllers with limited processing capabilities. During any stage of the algorithm, if the upstream MV network becomes available, the algorithm will be interrupted in order to allow MG synchronization with the main grid.
3.8 MicroGrid Restoration Procedure Integrating Electric Vehicles The MG flexibility allows the design of control mechanisms for islanding operation that can also enable the development of service restoration procedures at the LV network in case a general blackout occurs or if the MG islanding fails [36]. Similarly to conventional power system, the MG restoration procedure initially proposed in [36] consists of pre-established guidelines and operating routines, running step by step. However, when compared to conventional power system restoration, the MG service restoration procedure will benefit from a considerable problem size reduction, and hence the reduction of the number of controllable variables. This is expected to enable the implementation of a fully automatic procedure which do not requires the intervention of the distribution network operators.
The MG restoration procedure will be triggered by the MGCC when a general or local blackout occurs or when the MV network is not able to restore service in LV network after a pre-defined time interval. The MGCC is responsible for coordinating the process and ensure system stability for each step of the procedure. Frequency and voltage control will be ensured by the MG energy storage and controllable MS.
In order to perform service restoration at the MG level, it is assumed that the MG is equipped with:
• MS with Black Start (BS) capability, such as a SSMT, capable of communicating to the MGCC their generation availability and operational status.
• LV switches to disconnect the MG feeders, loads and MS in case a generalized blackout occurs.
• Communication infrastructure powered by dedicated auxiliary power units, in order to ensure the communication between the MGCC and the local controllers.
• Adequate protection equipment in order to protect MS and the LV grid from the fault currents and to isolate the faulted area.

Chapter 3 – MicroGrid Control Solutions for Emergency Operation
138
Controllable MS with BS capability usually require additional DC storage capacity to power the ancillary equipment when starting the MS. These units are usually prepared to supply local loads, being its coupling inverter controlled as a VSI in order to provide voltage and frequency references to the local system. Therefore, during the MG restoration procedure a MMO strategy could be adopted increasing the MG robustness during the procedure. When the MG stabilizes before synchronizing to the upstream network, the MS grid-coupling inverters can switch its control strategy to PQ.
3.8.1 Participation of Electric Vehicles in the MicroGrid Restoration Procedure Similarly to what has been proposed for MG islanding operation, the EV can also be actively integrated in the MG service restoration procedure by contributing to MG primary frequency regulation and hence contribute to reduce frequency excursions and the solicitation from the local energy storage units.
The EV power electronic interface controlled through an f-P droop strategy can be integrated in the MG restoration procedure as grid supporting units. The EV available to provide this service will be connected to the MG during the first steps of the restoration procedure. However, they won’t be allowed to charge at the nominal frequency, being synchronized to the grid with a zero power set-point, as shown in Figure 3.21. As a result, during the first steps of the procedure and whenever the frequency remains within the EV f-P droop frequency dead-band, the EV will not exchange power with the MG. However, when the loads and MS begin to be reconnected, the EV will inject or absorb power in order to reduce the resulting frequency excursion, consequently reducing the solicitation from the main storage unit and providing frequency support to the MG.
Figure 3.21. EV control and interaction with the MGCC for the MG service restoration.
3.8.2 MicroGrid Service Restoration Procedure Following the MG restoration strategy presented in [36] and the proposed EV control strategy, the overall MG restoration procedure can be organized in the following sequence of events:
1. MG status determination. The MGCC evaluates the network status both upstream and downstream:
a. Upstream network status – the MGCC only launches the restoration procedure if there isn’t any alternative to reconnect the MG to the main grid. Therefore,

Chapter 3 – MicroGrid Control Solutions for Emergency Operation
139
the MGCC waits for the distribution system operator authorization in order to activate the BS procedure.
b. Downstream network status – the MGCC evaluates the LV network status, analysing switches status and alarms, in order to check the existence of local faults or equipment failures. At this stage the MGCC also evaluates the available generation and active load resources, in order to ensure the successful MG service restoration. Historical data resulting from the MG operation prior to the islanding can provide information about the priority loads to be restored.
2. MG preparation in order to start the restoration procedure. The MGCC sends a signal to the local controllers (MC, LC and VC) in order to ensure the disconnection of loads, MS and EV. Then, MS with BS capability can be restarted to power some local loads. This procedure ensures that the MS with storage capacity providing back power to their local loads are not energizing larger parts of the LV network. As it was previously stated, the controllable MS coupling inverter is controlled as VSI with droop characteristics. In order to maintain the frequency close to nominal values, the idle power and frequency values of (Pi and ω0i) of the MS droop characteristic have to be adequately parameterized.
3. LV grid energization, through the connection of the MG main storage unit installed at the MV/LV substation and by closing the substation LV feeder switches. The connection of the MG main storage unit in no load/generation conditions ensures the MG operation with nominal frequency and voltage.
4. Synchronization of the running MS to the MG. The synchronization is enabled by the MGCC, being the necessary conditions – such as phase sequence, frequency and voltage differences (both in phase and amplitude) checked by the MC.
5. Reconnection of EV to the MG. The EV chargers are connected to the LV network with initial zero power consumption (see Figure 3.21), causing as minimum impact as possible.
6. Coordinated reconnection of loads and non-controllable MS, considering the available storage capacity and local generation. The secondary frequency control scheme presented in Figure 3.10 will correct frequency deviations, ensuring that the frequency remains close to nominal values.
7. Enabling EV charging. After the reconnection of all the MG loads, if there is sufficient reserve capacity, the MGCC can gradually increase the EV charging power for nominal frequency (Prated).
8. MG synchronization with the main grid after service restoration at the MV network. The MGCC should receive a confirmation from the distribution network operator to start the synchronization with the upstream network.

Chapter 3 – MicroGrid Control Solutions for Emergency Operation
140
3.9 MicroGrid Unbalanced Operation Sections 3.3 to 3.7 presented the control strategies required for the provision of frequency regulation. Simultaneously, the VSI Q-V droop control is used to define the magnitude of MG voltage. However, as discussed previously, reactive power control will have a limited effect in MG voltages. Additional strategies are required to ensure voltage quality, due to the unbalanced nature of LV distribution systems.
As discussed in section 2.2.4, the main cause for voltage unbalance of distribution networks is the uneven distribution of single-phase loads by the three phases of the system. In addition, the additional load from EV charging and the connection of single-phase MS can contribute to increase voltage unbalance. In fact, the majority of EV chargers and MS are single-phase in order to be compatible with residential charging. If the LV network has already an uneven distribution of single-phase consumers by the three-phases of the system, single-phase EV charging will probably increase the voltage unbalance problem.
In order to mitigate the voltage unbalance in MG, the strategy adopted in this thesis is based on the voltage balancing mechanism provided by MG power electronic interfaces described in Chapter 2 (see section 2.2.4.3). The implementation of balancing mechanisms in VSI controlled inverters will be considered in order to avoid the need of installing additional equipment and avoid limiting the dispatchable capacity of renewable based MS.
Therefore, the three-phase four-leg shunt-inverter topology proposed in [106] will be considered being a control functionality of the VSI connected to the MG energy storage device(s). This topology is a general one and is able to mitigate zero and negative sequence voltages, regardless the loading. The VSI controller will determine the reference voltage based on the droop characteristics discussed in section 3.3. Then, the voltage balancing mechanism proposed in [106] adds a voltage compensating signal to mitigate negative and zero sequence voltage components, as in [106], [107]. Details on the VSI controllers design are provided in Chapter 4 (see section 4.11.1).
The main objective in this thesis is beyond the balancing effect that can be achieved by a single power converter, aiming to maximize the voltage balancing effect and maintain voltage unbalance within limits in a MG. However, as the electric distance between the voltage balancing unit and the unbalance source increases the voltage balancing effect fades out. Therefore, it is necessary to evaluate possible locations for considering the inclusion of voltage balancing mechanisms.
As discussed in section 3.3, the MG can operate with one or more VSI in a SMO and MMO modes, respectively. In a SMO the VSI is usually considered to be installed at the MV/LV substation. Mitigating voltage unbalance at the MG interconnection point will ensure the effective synchronization to the upstream network and the operation of protection systems. However, for LV networks with long feeders, this might not be sufficient to maintain voltage unbalance between admissible limits. In this case, installing the VSI close to the points with higher voltage unbalance might improve voltage quality and maintain the unbalance at the point of interconnection within admissible limits. In a MMO operation, the possibility of

Chapter 3 – MicroGrid Control Solutions for Emergency Operation
141
performing voltage balancing downstream the feeder increases. However, it might not be necessary to consider voltage balancing mechanisms in every VSI.
A simple methodology is proposed in this work in order to identify MG locations to include power electronic inverters equipped with voltage unbalance compensation and therefore contribute to maintain voltage unbalance within admissible limits. A general procedure for addressing this issue can be organized as follows:
1. Initial characterization of MG voltage unbalance. An initial numerical simulation is performed without considering the voltage balancing mechanisms, in order to identify the nodes where voltage unbalance is outside admissible limits.
2. Voltage balancing effect at the MV/LV substation. The MG requires at least one VSI, which will usually be installed at the LV bus of the MV/LC substation. In this case the initial VSI is replaced by three-phase four-wire inverter with the additional voltage balancing mechanism. A new simulation is performed to evaluate the voltage balancing effect.
3. Voltage balancing in the problematic feeder. If considering the voltage balancing mechanisms at the MV/LV substation is not sufficient to balance voltages, a new VSI should be considered. In this case three different hypothesis are tested:
a. Changing PQ control of a three-phase controllable MS to VSI. Controllable three-phase MS with energy storage can be controlled as VSI, which will regulate the voltage at its terminals thus contributing to the voltage balancing effect.
b. Consider the VSI with voltage balancing mechanism at the MS interface if MS VSI control is not sufficient to balance voltages.
c. Add a VSI with additional voltage balancing mechanism in the problematic node. As a last resource it might be required to compensate voltage unbalance in the problematic node. In this case it will be necessary to install additional equipment.
The implementation of this procedure relies on an extensive set of numerical simulation studies in order to characterize the voltage behaviour in different MG nodes. As it will be demonstrated in Chapter 5, the solution is dependent on the specificities of each case, considering LV feeders characteristic and the distribution of single-phase loads, MS and EV.
3.10 Summary and Main Conclusions This chapter discusses the development of advanced MG load and EV management functionalities, which are able to improve MG resilience following islanding, taking into account the MG limited energy storage capability and frequency response. Ensuring the stability of the MG system requires the adoption of specific voltage and frequency control strategies considering the MG resources controllability. Storage and controllable MS such as microturbines and fuel cells are key elements of the MG frequency control. Storage coupled to a VSI establishes the MG voltage (in magnitude and frequency) and ensures primary frequency regulation, until the controllable MS (participating in secondary frequency control) are able to supply the MG loads.

Chapter 3 – MicroGrid Control Solutions for Emergency Operation
142
In this chapter the MG hierarchical control structure was extended, exploiting EV and responsive loads as complementary resource to MG primary frequency regulation. These resources are integrated in MG emergency operation as additional grid supporting units and considering the deployment of smart metering infrastructures. The preliminary examples presented throughout the chapter demonstrate that the strategies proposed have the potential to improve MG stability and reduce the solicitation from the storage unit.
A supervisory module was proposed to monitor the MG operating state and ensure that the MG has sufficient storage and generation resources to survive an unplanned islanding. The module is composed of two algorithms: one to schedule load and dumb charging EV control to minimize the islanding disturbance and another to balance the MG load and generation during islanded operation. The proposed approach is intended to support MG islanded operation during short periods of time (i.e. less than 1 hour). For larger time frames of operation in islanding conditions, complementary approaches need to be considered, involving forecasting of loads with different degrees of flexibility (including EV) as well as forecasts for renewable based microgeneration.
If these operational strategies fail and the islanding is unsuccessful leading to the MG collapse, the MG will launch the MG service restoration procedure. The procedure initially proposed in [36] was adapted in order to exploit the control flexibility of EV either as a load or distributed storage through the V2G functionality. The EV will be synchronized to the MV network in the first steps of the procedure with a zero active power reference. Then, considering the EV active power-frequency regulation scheme, it will change its reference power in order to support the reconnection of the loads and MS, while reducing MG frequency deviations as well as the solicitation from the main storage system. The procedure was tested through numerical simulation and validated experimentally, as presented in Chapter 5 and Chapter 6.
The final section of this chapter focus on the MG voltage unbalance problem. The characteristics of LV feeders and the unbalanced nature of its operation may compromise the stability of the system particularly when islanding. Voltage unbalance can cause excessive currents in some of the phases which can trip overload-protection, cause excessive heating of electronic components and decrease the life of the capacitors, ultimately leading to the MG collapse. In order to promote voltage balancing, a simulation procedure was proposed in order to study the effectiveness of considering the deployment of advanced power electronic interfaces with voltage balancing mechanisms in the MG. In addition to frequency and voltage regulation, the VSI will be able to compensate voltage unbalance. However, it is necessary to determine the proper locations to install this type of equipment in order to maximize the balancing effect along the MG feeders.
The developed functionalities are of paramount importance for the MG online operation and management and for improving the robustness of its self-healing functionalities. The control concepts proposed in this chapter were developed and validated initially through numerical simulation and in a second stage implemented and demonstrated experimentally.
The dynamic models of the MG elements are presented in Chapter 4 and were incorporated in a simulation platform developed using MATLAB®/Simulink®. The laboratorial validation and demonstration tests are discussed in Chapter 6.

Chapter 4 – Dynamic Models for Three-phase Four-Wire Unbalanced MicroGrids
143
– Dynamic Models for Three-phase Chapter 4Four-Wire Unbalanced MicroGrids The validation of the MicroGrid (MG) operational characteristics, particularly with respect to the control strategies that are adopted, requires the study of the dynamic behaviour of the MG. Therefore, this chapter describes the MG dynamic modelling approach in order to evaluate the effectiveness of the control strategies identified in the previous chapter. The modelling approach integrates the individual models of several MG components, namely MicroSources (MS), energy storage devices, Electric Vehicles (EV), loads and feeders, which will be connected to a three-phase four-wire LV network, operating under unbalanced conditions. The implementation of the MG emergency regulation functionalities and voltage balancing mechanisms described in Chapter 3 are also discussed. The main objective of the tool developed is to evaluate the MG resilience and stability when adopting the new EV and load control strategies. The representation of the MG as a three-phase four-wire system constitutes a differentiating feature of the platform, enabling also the study of voltage balancing strategies.
4.1 Introduction The MG full model presented in this chapter was based on the work previously developed under the European project MICROGRIDS [43]. Within this project, a MG simulation platform was developed in order to assess the feasibility of the MG concept, particularly during emergency conditions, namely islanding operation and restoration procedure. However, the platform modelled the LV grid as a three-phase balanced system.
A set of enhancements and adaptations were made in order to represent the MG as an unbalanced system and include the new controllable resources and control strategies that are proposed in this work. Therefore, the existing simulation platform was adapted in order to incorporate EV models for smart charging and Vehicle-to-Grid (V2G) operation. Additionally, platform adaptation and enhancement was oriented in order to allow studies under three-phase balanced and unbalanced operating conditions, including voltage balancing and control for mitigating negative and zero sequence voltage components. New models for single-phase MS were also derived and implemented. The unique feature of the simulation platform is that it allows the dynamic simulation of isolated networks without rotating masses directly coupled to the network (only interfaced via power electronics). MATLAB®/Simulink® is then used as the computational tool for the implementation of the simulation models and the MG control strategies. The main contributions of this work for improving the existing platform were:
• Development and implementation of models for representing the behaviour of single-phase power electronic interfaces, both for EV charging interface and MS.
• Development and implementation of the EV charging interface model incorporating the grid supporting functionalities described in Chapter 3.
• Development of the additional voltage balancing mechanisms to be placed at the power electronic inverter level.
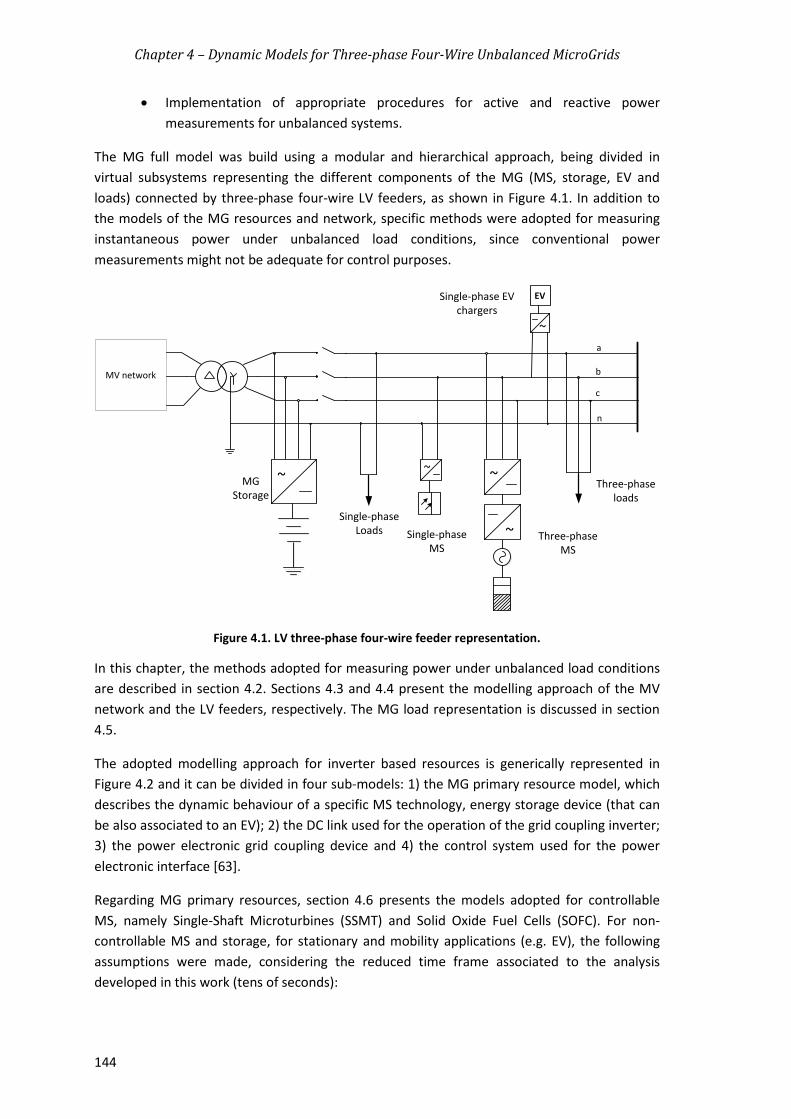
Chapter 4 – Dynamic Models for Three-phase Four-Wire Unbalanced MicroGrids
144
• Implementation of appropriate procedures for active and reactive power measurements for unbalanced systems.
The MG full model was build using a modular and hierarchical approach, being divided in virtual subsystems representing the different components of the MG (MS, storage, EV and loads) connected by three-phase four-wire LV feeders, as shown in Figure 4.1. In addition to the models of the MG resources and network, specific methods were adopted for measuring instantaneous power under unbalanced load conditions, since conventional power measurements might not be adequate for control purposes.
Figure 4.1. LV three-phase four-wire feeder representation.
In this chapter, the methods adopted for measuring power under unbalanced load conditions are described in section 4.2. Sections 4.3 and 4.4 present the modelling approach of the MV network and the LV feeders, respectively. The MG load representation is discussed in section 4.5.
The adopted modelling approach for inverter based resources is generically represented in Figure 4.2 and it can be divided in four sub-models: 1) the MG primary resource model, which describes the dynamic behaviour of a specific MS technology, energy storage device (that can be also associated to an EV); 2) the DC link used for the operation of the grid coupling inverter; 3) the power electronic grid coupling device and 4) the control system used for the power electronic interface [63].
Regarding MG primary resources, section 4.6 presents the models adopted for controllable MS, namely Single-Shaft Microturbines (SSMT) and Solid Oxide Fuel Cells (SOFC). For non-controllable MS and storage, for stationary and mobility applications (e.g. EV), the following assumptions were made, considering the reduced time frame associated to the analysis developed in this work (tens of seconds):
~
~
EV
MV network
a
b
c
n
Single-phase Loads Single-phase
MSThree-phase
MS
Three-phase loads
Single-phase EV chargers
~
~
MGStorage
~

Chapter 4 – Dynamic Models for Three-phase Four-Wire Unbalanced MicroGrids
145
• Storage devices including EV batteries are considered ideal DC sources, due to their fast charging or discharging capability [175], [176].
• Non-controllable MS such as PhotoVoltaic (PV) panels and micro-Wind Turbines (WT) were modelled as constant power sources, thus neglecting the variable nature associated to the power production from this type of generation sources.
Figure 4.2. General block diagram of MG resources’ dynamic model (adapted from [63]).
Based on these assumptions the dynamic model of these resources will be composed only by the model of the power electronic grid coupling device and by its control system. Nonetheless, sections 4.7 and 4.8 present a brief description of the non-controllable MS and storage devices model and of the simplifications that were considered.
Finally the models for the MG grid-coupling devices are discussed in sections 4.9 to 4.11, including the implementation of the voltage balancing mechanism. For the representation of power electronic interfaces, the following considerations are assumed:
• An average value model is adopted for the power electronic inverters, represented as ideal voltage sources, thus neglecting fast switching transients, harmonics and the inverter losses [175], [176].
• Harmonic compensation and filtering was not considered in the models. The main objective of the model is to study the MG behaviour at the fundamental frequency.
The controller defines the reference current/voltage based on accurate measurements and on specific control objectives. As discussed in Chapter 2 and Chapter 3, depending on the controllability of the resource, the inverter can be controlled with an active power and reactive power (PQ) strategy or as a Voltage Source Inverter (VSI). In the second case, additional control grid supporting strategies can be implemented, in order to provide frequency and voltage regulation [32], [35], [41],[42], [76]-[78], compensate voltage unbalance [104]-[110] and/or other power quality issues [63], [64]. The control of the PQ and VSI grid-coupling inverters is discussed in sections 4.10 and 4.11, respectively.

Chapter4–DynamicModelsforThree‐phaseFour‐WireUnbalancedMicroGrids
146
The design of the controllers used in each power electronic interface is dependent on its specific application, being necessary to use several reference domains, namely: 1) synchronous d‐q reference frame, stationary reference frame or directly in natural frame control (i.e. using abc voltages/currents) [63]. Depending on the chosen reference frame it will be necessary to transform the signals. The time domain transformations between the different reference frames are shown in Figure 4.3 [177].
Figure 4.3. Overview of time domain reference frame transformations [177].
The abc voltage/currents can be derived in the synchronous dq0 reference frame by first using quad transformation (Tαβ0) to derive stationary reference frame voltage/currents and then the Park transformation (Tdq0) matrix as in (4.1) to (4.3). The transformation matrixes considering the neutral are based in the quad transform proposed in [177].
In case of an unbalanced system, Park transformation matrix will only lead to positive sequence voltages. In order to derive voltage symmetrical components it is necessary to obtain the negative and zero sequence voltages, as in (4.4) and (4.5).The subscript +, ‐ and 0 are used to differentiate the positive, negative and zero sequence voltage components.
abcndqdq VTTV ..3
2000 (4.1)
n
c
b
a
n
c
b
a
V
V
V
V
V
V
V
V
T
V
V
V
22
3
0
0
22
1
22
1
22
12
3
2
30
2
1
2
11
.3
2.
3
20
0
(4.2)
00
0
0 100
0)cos()sin(
0)sin()cos(
..3
2
V
V
V
tt
tt
V
V
V
T
V
V
V
dqq
d
(4.3)
00 100
0)cos()sin(
0)sin()cos(
V
V
V
tt
tt
V
V
V
q
d
(4.4)
00 100
0)cos()sin(
0)sin()cos(
V
V
V
tt
tt
V
V
V
q
d
(4.5)

Chapter4–DynamicModelsforThree‐phaseFour‐WireUnbalancedMicroGrids
147
Where,
abcnV ‐ Voltage vector in abc reference frame
0dqV ‐ Voltage vector in dq0 reference frame
0T ‐ Stationary reference frame transformation matrix
0dqT ‐ Symmetrical components transformation matrix
V , V , 0V ‐ Voltages referred to αβ0 reference frame
dV , qV , 0V ‐ Voltages referred to dq0 reference frame
aV , bV , cV ‐ Phase voltages
nV ‐ Neutral voltage
‐ Angular frequency of the system (rad/s)
After deriving the compensating signals either in terms of current or voltage it is necessary to generate the gating signals to the converter. Usually PWM voltage or current control is followed. However, since the converter is modelled as an ideal voltage source no representation of the gating signals is required. The controllers generate the voltage reference for the ideal voltage source.
The MG models described in this chapter were incorporated in a simulation platform developed in MATLAB®/Simulink®, which is presented in section 4.12.
4.2 PowerMeasurementsunderUnbalancedConditions
Measuring active and reactive power in the nodes of the MG is required for both the implementation of the controllers and for analysing the dynamic behaviour of the MG. Power is an established concept for both single‐phase and three‐phase balanced systems. However, under unbalanced conditions the power will contain oscillatory components which can deteriorate the effectiveness of the controllers’ response.
4.2.1 PowerinSingle‐phaseandThree‐phaseBalancedSystemsIn a single‐phase circuit the instantaneous power p(t) can be determined as in (4.6), being possible to identify the active power (P) and reactive power (Q) as in (4.7).
)2sin()sin()2cos(1cos)().()( tVItVItitvtp (4.6)
VIsenQ
VIP
tQtPtp
cos
)2sin()2cos(1)(
(4.7)
Where,
)(tp ‐ Instantaneous single‐phase power
)(tv ‐ Instantaneous single‐phase voltage
)(ti ‐ Instantaneous single‐phase current V ‐ Voltage magnitude(V)
I ‐ Current magnitude (A)P ‐ Average value of active power (W)

Chapter4–DynamicModelsforThree‐phaseFour‐WireUnbalancedMicroGrids
148
Q ‐ Average value of reactive current (var) ‐ Phase displacement angle of current related to the voltage (rad) ‐ Angular frequency of the system (rad/s)
The instantaneous reactive power (second term in 4.6) is a pure oscillatory component at twice the system frequency with a maximum value of Q and with a zero average value. This means that the reactive power will oscillate between the source and the load and does not realize work.
For a three phase balanced system, the instantaneous active power results from the sum of the instantaneous active power in the three‐phases of the system, as in (4.8).
)()()()().()().()().()(3 tptptptitvtitvtitvtp cbaccbbaa (4.8)
Where, )(3 tp ‐ Instantaneous three‐phase active power
)(tva , )(tia ‐ Instantaneous voltage and current in phase A
)(tvb , )(tib ‐ Instantaneous voltage and current in phase B
)(tvc , )(tic ‐ Instantaneous voltage and current in phase C
)(tpa )(tpb )(tpc ‐ Instantaneous active power in phases A, B and C
Considering that the system is balanced, only positive sequence voltages and currents will flow in the system. The instantaneous active power can be determined as (4.9).
)cos(3)(3 IV
IVtp (4.9)
Where, V , I ‐ Magnitude positive sequence voltage (V) and current (A)
V , I
‐ Positive sequence voltage and current phase angle (rad)
Contrarily to single‐phase systems the three‐phase power doesn’t contain any oscillatory components. The reactive power results from the imaginary part of the complex power and as for the active power it is constant in time.
4.2.2 Single‐phaseandThree‐phasePowerinUnbalancedSystemIn a three‐phase four‐wire system supplying an unbalanced three‐phase load, the currents flowing in each phase are no longer equal in magnitude, producing different voltage drops in each phase. Also, a current will flow in the neutral conductor.
Considering the decomposition of the system voltage and currents in their symmetrical components, besides positive sequence components, both negative and zero sequence components will flow in the system. The instantaneous system phase voltages and currents in terms of their symmetrical components can be described as in (4.10) and (4.11). The subscript +, ‐ and 0 are used to identify the positive, negative and zero sequence components of voltage and currents.

Chapter4–DynamicModelsforThree‐phaseFour‐WireUnbalancedMicroGrids
149
)sin(2)3
2sin(2)
3
2sin(2)(
)sin(2)3
2sin(2)
3
2sin(2)(
)sin(2)sin(2)sin(2)(
00
00
00
VVV
VVV
VVV
tVtVtVtvc
tVtVtVtvb
tVtVtVtva
(4.10)
)sin(2)3
2sin(2)
3
2sin(2)(
)sin(2)3
2sin(2)
3
2sin(2)(
)sin(2)sin(2)sin(2)(
00
00
00
III
III
III
tItItItic
tItItItib
tItItItia
(4.11)
Where, V , I ‐ Negative sequence voltage (V) and current (A) magnitude. 0V , 0I ‐ Zero sequence voltage (V) and current (A) magnitude.
V , I ‐ Phase angle of negative sequence voltage and current (rad).
0V , 0I ‐ Phase angle of zero sequence voltage and current (rad).
According to the instantaneous active and reactive power theory, also known as p‐q theory [179], the three phase active power can be decomposed in an average, oscillatory and zero sequence power components as in (4.12), which can be described in terms of its positive, negative and zero sequence components as in (4.13).
)()(~
00
~
03 ppppppp (4.12)
)2cos(3
)2cos(3)2cos(3
)cos(3
)cos(3)cos(3
00
00
00~
0
~
000
IV
IVIV
IV
IVIV
tIVp
tIVtIVp
IVp
IVIVp
(4.13)
Where, p ‐ Instantaneous active power
0p ‐ Zero sequence power
p , ~
p ‐ Average and oscillatory components of the instantaneous active power
0p , ~
0p ‐ Average and oscillatory components of the zero sequence instantaneous power
The instantaneous three‐phase reactive power can also be defined based on abc instantaneous voltage and currents as in (4.14) or by its positive and negative voltage and current components as in (4.15).

Chapter4–DynamicModelsforThree‐phaseFour‐WireUnbalancedMicroGrids
150
)(3
1)()()(
3
13 bcaabccabbacacbcba ivivivivvivvivvq (4.14)
)2sin(3)2sin(3
)sin(3)sin(3~
~
3
tIVtIVq
IVIVq
qqq
IV
IVIV
(4.15)
Where,
3q ‐ Instantaneous three‐phase reactive power
q , ~
q ‐ Average and oscillatory components of the instantaneous reactive power
According to p‐q theory the sum of the instantaneous active power and zero sequence power represents the energy exchanged between the source and load, as represented in Figure 4.4. The instantaneous reactive power or imaginary power corresponds to the energy exchanged between the phases of the system, without contributing to the energy flow between the source and load.
Figure 4.4. Physical meaning of instantaneous powers according to p‐q theory [179].
Following the instantaneous p‐q theory, the active and reactive power will be determined directly from the abc instantaneous voltage and currents as in (4.8) and (4.14). The resulting PQ measurement block is shown in Figure 4.5. The oscillatory components are then filtered using the decoupling block, which act as low pass filters, extracting only the average components. For controllers designed in αβ0 stationary reference, the symmetrical
components of the instantaneous voltage vector [ V
V ]T can be obtained through the
complex transformation described in (4.16) [180]. The same transformation can be applied for the instantaneous measured currents. The positive sequence active and reactive power can then be determined as in (4.17) and (4.18).
2,1
1
2
1
jeq
V
V
q
q
V
V
(4.16)
a
b
c
n
a
b
c
n
System A (~)
System B (~)
ia(t)
ib(t)
ic(t)
p+p0
q
va(t)
vb(t)
vc(t)

Chapter4–DynamicModelsforThree‐phaseFour‐WireUnbalancedMicroGrids
151
ivivp2
33
(4.17)
ivivq2
33
(4.18)
Where, v ,
i ‐ Positive sequence voltage and current referred to the α axis v ,
i ‐ Positive sequence voltage and current referred to the β axis
a) b)
Figure 4.5. Three‐phase instantaneous power calculation: a) active power and b) reactive power.
Single‐phase active and reactive power measurement
For single‐phase system, the method proposed by Burger and Engler in [181] was adopted. The authors decompose the single‐phase voltage and currents in two fictitious orthogonal components, as in (4.19), similarly to the d‐q coordinate frame for three‐phase systems.
srj
srj
jiieii
jvvevvN
N
ˆ
ˆ
(4.19)
Where, v, i ‐ Complex voltage and current space vectors
rv , sv ‐ Complex voltage space vectors represented in the r and s fictitious components
ri , si ‐ Complex current space vectors represented in the r and s fictitious components
N ‐ Resonant frequency of the system set to 314 rad/s
The r axis has the same phase as the input signal (single phase voltage or current) and the s component is shifted by 90°. The peak value and Root‐Mean Squared (RMS) voltage are determined as in (4.20).
3
1

Chapter4–DynamicModelsforThree‐phaseFour‐WireUnbalancedMicroGrids
152
2
ˆ
ˆ 22
vv
vvv
RMS
sr
(4.20)
Where, v ‐ Voltage peak value (V)
RMSv ‐ Voltage magnitude (V)
The power is computed by using the complex apparent power split up in its real and imaginary part, as in (4.21).
))((2
1*
2
1srsr jiijvvivjQPS (4.21)
Where, S ‐ Complex apparent power P ‐ Active power at the fundamental frequencyQ ‐ Reactive power at the fundamental frequency
This approach is simpler and fast, not requiring zero crossing detection and enabling a decoupled control of active and reactive power. The generation of the r and s components is obtained using the block diagram in Figure 4.6. The phase shift between the fictitious orthogonal components is obtained by a second order low pass filter with the transfer function described in (4.22).
22)(
s
sksLPF (4.22)
Where, LPF ‐ Transfer function of the low pass filter k ‐ Gain and is set to 1.48 rad/s. ‐ System angular frequency(rad/s)
Figure 4.6. Block diagram of single‐phase active and reactive power measurement [181].
s
1
s
1
s
1
s
1
21
21

Chapter 4 – Dynamic Models for Three-phase Four-Wire Unbalanced MicroGrids
153
4.3 Medium Voltage Network Model
When operating interconnected to the MV network, the MG voltage and frequency is established by the main grid. The characteristics of the upstream network, namely it’s short-circuit power will influence the network voltage profile. Even when operating interconnected with the upstream grid, the networks with low short-circuit power have higher probability of having higher voltage unbalance [95].
For simulation purposes, a positive sequence Thévenin impedance was defined at the LV busbar of the distribution transformer, thus incorporating the influence of the short-circuit power in the MV grid and the leakage reactance of the distribution transformer (Figure 4.7). The network short circuit power is modelled by an equivalent RL parallel branch. The transformer of the MV/LV substation was not explicitly modelled, since the majority of the studies that are conducted are related to MG islanding operation (and in this case the MV/LV transformer will be disconnected).
Figure 4.7. MV network equivalent model.
4.4 Low Voltage Feeders Model The MG system can be constituted for both overhead lines and underground cables. The feeders are represented only by their series impedance constituted by the series resistance (R) and inductance (L) of the electric cable as represented in Figure 4.8 a). The shunt admittance was not considered.
For improving simulation speed the Three-phase parallel RL block from SimPowerSystem® toolbox was adopted. The block implements a balanced three-phase RL parallel model, meaning that the impedance of the three phases is considered equal. As shown in Figure 4.8 b), the neutral impedance is represented separately by a single phase RL parallel model, since the neutral conductor can have smaller sections and consequently different electric parameters.

Chapter 4 – Dynamic Models for Three-phase Four-Wire Unbalanced MicroGrids
154
a)
b)
Figure 4.8. Three-phase four-wire line model.
4.5 MicroGrid Loads Dynamic Model
The MG can supply both single and three-phase loads, such as resistive loads and small to medium induction motors. Without lack of generality, the MG loads were modelled by static constant impedance model as in (4.23). According to this model, the active and reactive power absorbed by the load will vary with the square of the MG voltage as in (4.24). The parameters of the model are the nominal voltage (V0), active (P0) and reactive power (Q0). The load active and reactive power consumption will vary according to the MG voltage (V).This approach will produce acceptable results when not considering the presence of larger induction machines. As described in [182], induction motor loads may compromise the MG stability particularly during unplanned islanding occurring due to faults in the MV network. However, the study of MG islanding during fault conditions was not considered in this thesis. The main objective of the studies was to first validate the control strategies proposed in Chapter 3 when the MG operates under unbalanced conditions. The integration of dynamic loads will be considered for future work.
(4.23)
Where,
- Equivalent load impedance (Ω) V - Voltage magnitude (V)
- Apparent power (VA)
(4.24)
Where, P - Active power (W) Q - Reactive power (var) P0 - Nominal active power (W) Q0 - Nominal reactive power (W) V0 - Nominal voltage magnitude (V)

Chapter 4 – Dynamic Models for Three-phase Four-Wire Unbalanced MicroGrids
155
4.6 Controllable MicroSources The controllable MS such as microturbines and fuel cells are dispatchable sources, participating in the MG secondary frequency control. Their response to the active power control signals will have a great impact on the MG transient behaviour. In this work only SSMT SOFC were considered, given their technology maturity as discussed in Chapter 2.
4.6.1 Single-shaft Microturbine Dynamic Model Microturbines can be used for several applications and can combine power generation with cooling and heating. From the microturbines technologies, the SSMT is usually considered, with powers ranging from a few kW (residential applications) to 100 kW (for LV applications). A three-phase connection was considered for the connection of SSMT to the LV network.
The basic configuration of the SSMT is represented in Figure 4.9. In the SSMT engine the ambient air is compressed and passes through the recuperator, where it is heated before entering the combustor chamber. The high pressure mixture of the compressed air with the compressed fuel (usually natural gas) is burned and the resulting gas will then pass through the turbine. The turbine and the compressor are mounted in the same shaft. Therefore, the mechanical energy produced by the turbine will drive the Permanent Magnet Synchronous Generator (PMSG) shaft and also the compressor. The permanent magnet generator produces high frequency AC power which is not compatible with the grid. Therefore, an AC/DC/AC power conversion unit couples the SSMT to the LV network.
Figure 4.9. Basic configuration of a SSMT.
For heat or cooling purposes the exhaust gases will pass through the recuperator and fed to a boiler or chiller. However, this was not considered in the model, since the main objective is to represent the power production of the SSMT. The SSMT dynamic model described in [176] was adopted and includes the SSMT engine model, the PMSG model and the power conversion and control system model.
The SSMT engine model is based on the simplified model of the gas turbine system usually referred to as GAST model, as represented in Figure 4.10. The model represents the response of the turbine in terms of its mechanical power to changes in its reference power. Its response

Chapter 4 – Dynamic Models for Three-phase Four-Wire Unbalanced MicroGrids
156
will largely depend on the fuel system, represented by time constants T1 and T2 and considering the maximum (Vmax) and minimum (Vmin) fuel valve positions. The flow is limited by the load limit parameter (Lmax) and time constant (T3). The influence of the fuel mass flow in the heat produced is represented by the temperature control loop with gain (kt).
Figure 4.10. Dynamic Model of SSMT Engine [176], [183].
The reference mechanical power of the SSMT is obtained by the external control loop represented in Figure 4.11. The reference power is determined by a PI regulator which corrects the error between the power measured at the SSMT output and the reference value, which can result in a set-point sent by the MGCC.
Figure 4.11. Active Power Control of Controllable MS.
The turbine will drive the PMSG in order to produce electric power. The PMSG dynamic model is represented in the rotor d-q reference frame and can be described by the electrical and mechanical equations in (4.25) and (4.26) respectively [184].
( )[ ]qdqdqme
mq
qddqsq
ddqqdsd
iiLLipT
pdtdi
LiLpiRv
dtdiLiLpiRv
−+Φ=
Φ++−=
+−=
23
ωω
ω
(4.25)
ωω FdtdJTT me +=− (4.26)
Low Value Gate sT1
1
1+ sT11
2+
sT11
3+-
+++
inP
minV
maxV
mP
maxL
tk
+–
Pref
P
K ++
sKI
Pin

Chapter 4 – Dynamic Models for Three-phase Four-Wire Unbalanced MicroGrids
157
Where,
, - d and q axis terminal voltages (V)
, - d and q axis currents (A)
- Electromagnetic torque (N.m)
- Flux inducted by the permanent magnets (Wb)
- Mechanical torque (N.m) - Angular velocity of the rotor (rad/s) , - d and q axis inductances (H)
- Stator resistance (Ω) - Number of pole pairs
- Combined inertia of the compressor, turbine, shaft and PMSG (kg.m2)
- Combined friction factor of the compressor, turbine, shaft and PMSG (N.m.s/rad)
The PMSG angular velocity and power factor will be controlled by the AC/DC inverter controller implemented in d-q reference frame. As shown in Figure 4.12, d axis reference current (Id*) is determined by a PI regulator, based on the error of the angular speed. The SSMT reference speed (ωref) is determined according the machine P-ω characteristic and is compared to the shaft speed (ωr). An additional PI is used to correct the error between the reference d axis current and the PMSG measured current (Id), and determine d axis voltage (vd). The q axis voltage (vq) is regulated to control the reactive power output of the PMSG. The controllers are implemented in d-q reference frame. The reference voltages are then transformed to natural reference frame for generating the gating signals of the machine side converter.
Figure 4.12. General structure of the input-side controller of the SSMT [176], [184].

Chapter 4 – Dynamic Models for Three-phase Four-Wire Unbalanced MicroGrids
158
The increase of fuel mass flow will generate more power consequently increasing the mechanical power produced by the turbine. However, the response of the turbine is not instantaneous. The power response of the SSMT to a step change in the reference power is represented in Figure 4.13. The unit takes about 30 seconds to reach nominal power. The increase of fuel rate will initially drop power, because there isn’t the necessary volume of compressed air to burn the fuel. As the turbine-compressor block increases speed more air is drawn into the combustor, allowing for all the extra fuel to be burned and increasing the power output [175].
Figure 4.13. SSMT active power step response.
4.6.2 Fuel Cell Dynamic Model Fuel cells are electrochemical devices that convert the chemical energy contained in hydrocarbon fuels directly into electricity, through reduction and oxidation reactions [176]. Solid oxide fuel cell is usually considered for micro-CHP applications, since they operate with high temperatures (600-1000ºC), producing waste heat that can be used for heating purposes. Also, a diversity of hydrocarbons based fuels can be used, such as natural gas, methane and propane gases [185]. The power capacity of SOFC can vary from 2 KW to hundreds of MW [186]. However, for MG applications only SOFC with a power capacity lower than 100 kW will be considered.
The SOFC basic architecture is shown in Figure 4.14. The hydrocarbon fuel is fed to the fuel processor which converts it into gas, which is then fed to a stack of several fuel cells. A single fuel cell produces a low voltage and reduced amount of power. Similarly to a battery, several cells are connected in parallel in order to achieve adequate DC voltage. A DC/AC inverter couples the source to the AC network.
As represented in Figure 4.15 the pre-processed fuel is continuously fed to the anode where the oxidation reaction occurs. The electrons are conducted to the external circuit while the protons coming through the membrane react with the oxygen atoms dissociated in the cathode forming water [185]. The main chemical reactions are described in (4.27).

Chapter4–DynamicModelsforThree‐phaseFour‐WireUnbalancedMicroGrids
159
Figure 4.14. Basic configuration of a SOFC.
Figure 4.15. Fuel Cell working principle diagram [187].
OeOCatode
eOHOHAnode
22
1:
2:
2
22
(4.27)
The fuel cell open voltage (E) is determined by the Nernst equation as in (4.28). Based on the fuel cell open voltage the SOFC voltage (V) can be computed applying Ohm’s law, as in (4.29) [176].
OH
H
p
pOp
F
RTENE
2
2 200 ln
2 (4.28)
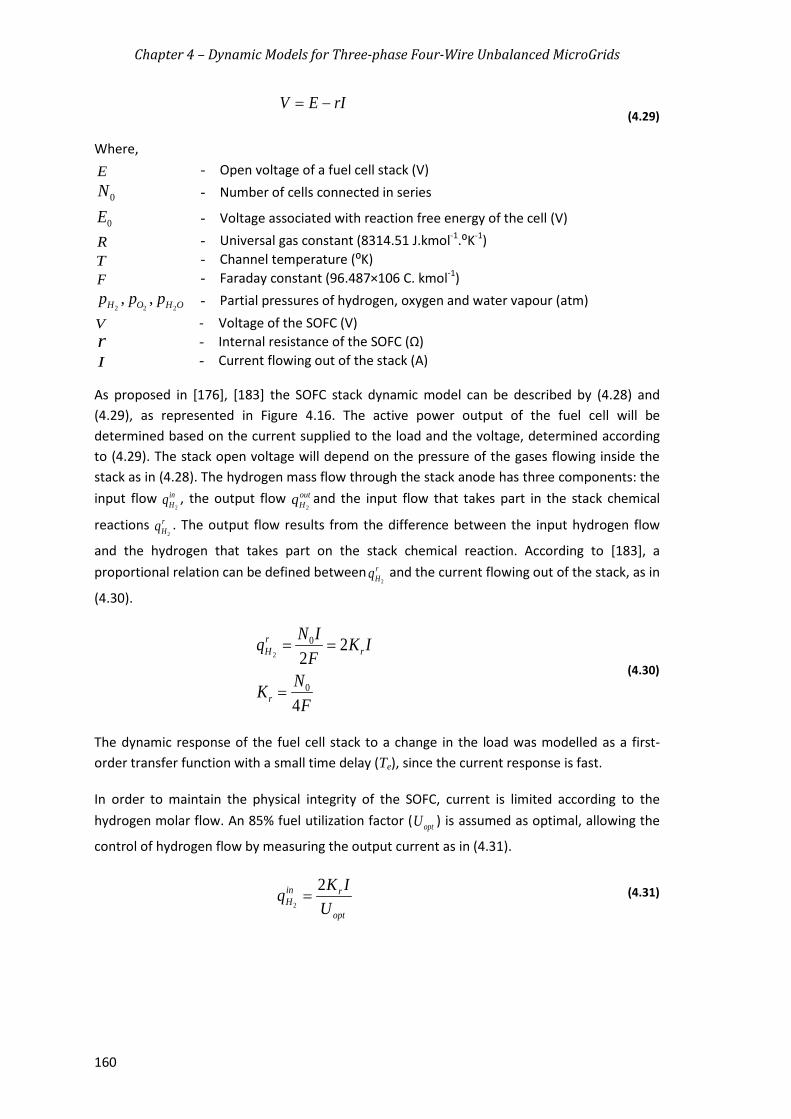
Chapter 4 – Dynamic Models for Three-phase Four-Wire Unbalanced MicroGrids
160
rIEV −= (4.29)
Where, E - Open voltage of a fuel cell stack (V)
0N - Number of cells connected in series
0E - Voltage associated with reaction free energy of the cell (V)
R - Universal gas constant (8314.51 J.kmol-1.⁰K-1) T - Channel temperature (⁰K) F - Faraday constant (96.487×10⁶ C. kmol-1)
2 2 2, ,H O H Op p p
- Partial pressures of hydrogen, oxygen and water vapour (atm) V - Voltage of the SOFC (V) r - Internal resistance of the SOFC (Ω) I - Current flowing out of the stack (A)
As proposed in [176], [183] the SOFC stack dynamic model can be described by (4.28) and (4.29), as represented in Figure 4.16. The active power output of the fuel cell will be determined based on the current supplied to the load and the voltage, determined according to (4.29). The stack open voltage will depend on the pressure of the gases flowing inside the stack as in (4.28). The hydrogen mass flow through the stack anode has three components: the input flow in
Hq2, the output flow out
Hq2
and the input flow that takes part in the stack chemical
reactions rHq
2. The output flow results from the difference between the input hydrogen flow
and the hydrogen that takes part on the stack chemical reaction. According to [183], a proportional relation can be defined between r
Hq2 and the current flowing out of the stack, as in
(4.30).
FNK
IKFINq
r
rrH
4
22
0
02
=
== (4.30)
The dynamic response of the fuel cell stack to a change in the load was modelled as a first-order transfer function with a small time delay (Te), since the current response is fast.
In order to maintain the physical integrity of the SOFC, current is limited according to the hydrogen molar flow. An 85% fuel utilization factor ( optU ) is assumed as optimal, allowing the
control of hydrogen flow by measuring the output current as in (4.31).
opt
rinH U
IKq 22
= (4.31)

Chapter 4 – Dynamic Models for Three-phase Four-Wire Unbalanced MicroGrids
161
Figure 4.16. Dynamic model of SOFC [176].
P ref
V fcin
Lim
it
r
max
2KU
r
min
2KU
sT
11
e+
r2K
rK
sτ
1K1
22
HH
+s
τ1
K1
OH
OH
22
+
optr
U2Ks
T1
1f
+H
_O1 r
sτ
1K1
22
OO
+
+
OH
OH
00
2
22 p
pp
ln2FR
TE
N
× ÷
×P
r +
in H2
q
in O2
q
I
I
I-
in H2
q
in H2
q
+-
+-
2Hp
OH
2p
2Op
VE
Fuel
Pro
cess
or
SOFC
Cur
rent
Lim
iter
SOFC
Sta
ck D
ynam
ic M
odel

Chapter 4 – Dynamic Models for Three-phase Four-Wire Unbalanced MicroGrids
162
The hydrogen flow in the stack will also depend of the fuel processor response, represented by a first order transfer function with time delay Tf. The flow of oxygen in
Oq2will be determined by
the ration of hydrogen to oxygen (rH-O). According to [183], the fuel cell pressure difference between the hydrogen and oxygen inside the fuel cell should be kept below 4 kPa under normal operation conditions, in order to avoid damaging the electrolyte. An air compressor will ensure that the rH-O is maintained at 1.145.
According to (4.28), the stack open voltage will also depend on the partial pressure of the water vapour, which is a product of the reaction of the hydrogen protons with the oxygen atoms dissociated in the cathode. The partial pressure of each gas can be described in Laplace domain as in (4.32). In [176], it is shown that the molar flow of water vapour will be equal to the hydrogen molar flow that takes part of the stack chemical reactions.
qs
Kpτ+
=1
1 (4.32)
Where, p - Partial pressure of a gas inside a channel (atm) q - Molar flow of the gas (kmol/s) K - Valve molar constant (kmol/(atm.s)) τ - Response time for the gas molar flow (s)
Figure 4.17 shows the power response of a SOFC to a step change in reference power from 0.2 to 1p.u. occurring at 20s of simulation time. A small increase in the SOFC power output can be observed in the first 2 to 3 seconds, corresponding to the response of the SOFC stack to a sudden increase in charges at the sides of the membrane. However, the SOFC will only reach reference power when the membrane reaches its thermal equilibrium [176]. As shown in Figure 4.17 the SOFC takes 150 seconds to reach nominal power. Compared to the response of the SSMT (see) the SOFC presents a much slower response to power signals, being more adequate for stationary power generation.
Figure 4.17. Active power step response of a SOFC.

Chapter 4 – Dynamic Models for Three-phase Four-Wire Unbalanced MicroGrids
163
4.7 Non-controllable MicroSources The MG non-controllable MS are usually based on variable Renewable Energy Sources (RES), such as PV systems and micro-WT.
The micro-WT system is represented in Figure 4.18, where it is assumed the use of a variable speed PMSG directly coupled to the turbine drive train. The PMSG is driven by a fixed pitch WT. The PMSG variable frequency voltage is then rectified into a constant DC voltage, which is then inverted into AC grid compatible power. A detailed description of complete dynamic model can be found in [175], [188].
The solar photovoltaic system is composed by the PV panels, a DC/DC converter and a DC/AC grid-coupling inverter, as shown in Figure 4.19. The DC/DC converter regulates the voltage of the PV array in order to extract the maximum power from the PV panels, through Maximum Power Point Tracker (MPPT) algorithms [67], [176].
Figure 4.18. Basic configuration of the micro-WT system.
Figure 4.19. Basic configuration of the solar PV system.

Chapter 4 – Dynamic Models for Three-phase Four-Wire Unbalanced MicroGrids
164
The power output of renewable based generation such as PV panels and micro-WT will depend on the availability of the renewable resources. The high variability associated to solar and wind resources do not offer sufficient controllability for considering their participation in the frequency regulation strategies discussed in previous chapter. For this reason, these MS usually are controlled in order to inject the maximum active power possible, considering the availability of the resource [175].
Since the main objective of the MG model developed is to study the dynamic stability of the MG during emergency operating conditions and evaluate the effectiveness of frequency and voltage regulation strategies, the micro-WT and PV panels will be modelled as constant DC power sources, considering the following assumptions:
• Wind speed and the power generated by the wind turbine are considered constant. • The dynamics of the PMSG is neglected. This is acceptable given the small capacity
considered for these units (<10 kW). • Temperature and irradiance are considered constant, which means that the MPPT
controlled DC/DC converter extracts the maximum power from the PV panel. • The dynamics of input-side converter is neglected.
These simplifications have been adopted in similar studies [35], [41], [42], and are acceptable given the short-term nature of the studies to be performed. The general block diagram of the non-controllable single-phase MS is shown in Figure 4.20, representing the DC link and the grid-coupling inverter, responsible for controlling the power flow between the source and the grid. More details are provided in sections 4.8 and 4.10.
Figure 4.20. General block diagram of non-controllable single-phase MS.
4.8 Energy Storage Devices Storage is a key element of the MG for maintaining balance between generation and load and enabling MG autonomous operation. Fast acting storage technologies are used to stationary applications, providing frequency and voltage regulation and load following capabilities during autonomous operation. In some cases, they can also be coupled to controllable MS such as SSMT in order to provide Black Start (BS) capabilities. However, storage is also present for mobility applications when considering the deployment of EV. In this case, the EV will act as an active element of the network supporting the MG frequency regulation.

Chapter 4 – Dynamic Models for Three-phase Four-Wire Unbalanced MicroGrids
165
4.8.1 MicroGrid Stationary Storage Stationary storage technologies considered in MG applications usually consists of fast acting storage technologies, in order to provide a fast response to the system disturbances. Four technologies are usually considered individually or combined, namely:
• Flywheels • Batteries banks • Superconducting magnetic energy storage • Supercapacitors
Regarding technology maturity and cost-benefit analysis, battery and flywheels are usually preferred for the MG integration. Figure 4.21 a) and b) represent the basic configuration of the flywheel and battery bank, respectively. These storage technologies present high power density and short response times, being able to compensate the power mismatch between MG generation and load during the first moments of the disturbance, as discussed in previous chapters.
a)
b)
Figure 4.21. General configuration of MG storage technologies: a) flywheel and b) battery.

Chapter 4 – Dynamic Models for Three-phase Four-Wire Unbalanced MicroGrids
166
The flywheel is an electromechanical storage system. A rotor rotating at high speeds originates kinetic energy, which is then converted to electric energy by a motor/generator. The energy is stored by the flywheel can be determined as in (4.33).
2
21
rIE ω= (4.33)
Where,
E - Energy stored by the flywheel (J) I - Moment of Inertia (kg·m²)
rω - Angular rotation speed (rad/s)
A bidirectional AC/DC fast inverter controls the current injected or absorbed by the flywheel, in order to discharge or charge the flywheel. The response of the flywheel and AC/DC response is fast (as in Table 2.2) in order to enable the support to transient disturbances [190]. A DC/AC converter couples the flywheel to the AC network.
Flooded lead acid or lithium-ion batteries are usually adopted for the MG storage. The desired DC voltage and current are achieved by connecting several cells in series and parallel respectively. A DC/DC bidirectional inverter controls the current flowing from/to the battery pack and provides constant DC voltage to the DC/AC inverter input. The DC link voltage is controlled to be constant by an adequate adjustment of the power flow with the AC grid. The variations seen in the DC-link capacitor voltage are due to the power demand/injection on the battery side.
Based on the capacity of these storage technologies to charge and discharge rapidly and the short-term nature of the transient stability studies to be performed, the storage units can be considered ideal DC sources with the dynamic model shown in Figure 4.22. The storage power control, current and voltage limits are implemented in the controllers of the power inverters [175], [191]. The MG storage units are coupled to a Voltage Source Inverter (VSI) in order to provide voltage and frequency regulation. The control of VSI is discussed in section 4.11.
Figure 4.22. Storage dynamic model.
4.8.2 Controllable MicroSources with DC Storage Some SSMT manufactures have presented commercial solutions for SSMT integrating DC storage as in Figure 4.23, in order to provide emergency backup power to critical loads. The battery bank will compensate the power injected by the SSMT in order to meet the required power. From the grid-coupling inverter point of view the group composed by the SSMT and storage can be seen as a very stiff DC bus voltage, similarly to what has been considered for
Pstorage
s36001 Estorage
Pstorage

Chapter 4 – Dynamic Models for Three-phase Four-Wire Unbalanced MicroGrids
167
the MG storage units. Therefore, the storage dynamic model in Figure 4.22 will be adopted. The DC/AC inverter connecting the controllable MS to the MG will have two operating modes. In normal operating conditions the inverter is controlled as a PQ unit. However, during emergency conditions, such as the occurrence of a general blackout, the inverter will be controlled as a VSI.
Figure 4.23. SSMT system with DC storage.
4.8.3 Energy Storage for Electric Vehicles As discussed in previous chapters, when connected to the MG the EV can be regarded as a flexible load or storage device. Depending on the charging mode, the EV may participate in grid supporting services namely for supporting MG frequency regulation.
For validating the EV grid supporting strategies proposed, it is only necessary to model the EV battery and its power electronic interface with the grid, as presented in Figure 4.21 b). The EV battery model and DC/DC converter are considered a DC ideal source. The connection to the LV network will be provided through a single-phase power electronic interface.
When participating in frequency regulation, the EV charging power will be determined by its droop characteristic. The EV droop characteristic discussed in Chapter 3 is therefore responsible for defining the power set point of the EV charger, as shown in Figure 4.24.
Figure 4.24. Block diagram of EV charger power set-point definition (adapted from [15], [133]).
In normal operating conditions the EV connected to the grid will charge the battery according to the Battery Management System (BMS) algorithm. In this thesis, the EV is considered to be charging at nominal power. If a disturbance occurs and a frequency deviation is measured at the EV terminals, the EV charging power will be changed according to the droop characteristics. However, the BMS can limit the power absorbed or injected by the battery, in order to avoid damaging the EV battery. The BMS algorithm was not integrated in the dynamic

Chapter 4 – Dynamic Models for Three-phase Four-Wire Unbalanced MicroGrids
168
model. However, the interaction of the BMS with the EV was implemented in the controller prototype implemented in the laboratory, as will be discussed in Chapter 6.
The EV DC/AC inverter will be controlled in order to maintain the DC link voltage constant by an adequate adjustment of the power flow with the AC grid. The variations seen in the DC-link capacitor voltage are due to the power demand/injection on the battery side. Therefore, the EV grid coupling device will be controlled with a PQ strategy as discussed in section 4.10.
4.9 DC-Link Model The DC link couples the input-side inverter/converter to the grid-side inverter. Neglecting losses, the power balance in the capacitor of the DC-link (PC) is the difference between the power received from the MS (PMS) and the inverter output power (Pinv), as in (4.34). The power delivered by the capacitor can also be written as a function of the DC-link voltage (VDC) and current (IDC), as in (4.35).
invMSC PPP −= (4.34)
DCDCC IVP = (4.35)
The grid-side inverter is controlled in order to maintain the DC-link voltage at a specified reference voltage, thus maintaining the balance between the power received from the MS and the inverter output power. The DC-link voltage can be computed as in (4.36),
dtIC
V DCDC ∫=1
(4.36)
where C (expressed in F) is the value of the capacitance in the DC-link.
Combining the previous equations and taking the Laplace transform, the DC-link dynamics can be modelled as in Figure 4.25.
Figure 4.25. DC-link dynamic model.
4.10 PQ Inverters The DC/AC inverters coupling the MS and EV to the grid are controlled through a PQ control strategy, whose main objective is to control the active and reactive power flow with the LV network. This type of inverters was modelled as current controlled voltage source with single-phase or three-phase connection, depending on the nominal power of the units. The
MSP
invP
+ -x
sC1 D CV

Chapter 4 – Dynamic Models for Three-phase Four-Wire Unbalanced MicroGrids
169
description of the model adopted for each type of connection is presented in the next subsections.
4.10.1 Single-phase PQ Inverter The single-phase PQ inverter is based on a current controlled voltage source, being the reference voltage of the inverter determined based on a reference current as proposed in [181]. Figure 4.26 represents the block diagram of a single-phase DC-AC grid-coupling inverter. The same control is implemented for the EV charger and for single-phase MS such as PV and micro-WT. The main difference relies in the reference power, which in the EV case is determined based on the droop characteristics and BMS limitations as discussed in section 4.8.3.
Figure 4.26. Single-phase grid coupling inverter PQ control.
Current components in phase (iact) and quadrature (ireact) with the inverter terminal voltage are computed based on the method proposed by Engler [181] for mean power calculation in single-phase inverters, discussed in section 4.2.2. The active power control is achieved by maintaining the DC link voltage constant. Power variations in the MS or EV battery induce a DC-link voltage error, which is corrected via the PI-1 regulator by adjusting the magnitude of the active current output delivered to the grid. The reactive power output is controlled via the PI-2 regulator by adjusting the magnitude of the inverter reactive current output. The reference reactive power is usually set to zero, as these units usually operate with a unity power factor
As it can be observed in Figure 4.26, the single-phase PQ inverter control system is formed by two cascaded loops. The inner most control loop regulates the inverter internal voltage (v*) to meet a desired reference current (iref). The outer most control loop consists on active and reactive power regulators.
Microsource or EV battery Vdc
Vdc ref
Phase
actireactiQ
ΣQ
1sT1
Q +xΣ
refQ
reacti
-+
refi
xPI-1Σ
-+ acti
PI-2
DC
AC
PWM
*v
++
)ii(kvv ref* −+=
i ,vi ,v
NeutralR, L

Chapter 4 – Dynamic Models for Three-phase Four-Wire Unbalanced MicroGrids
170
The reference current can be determined as in (4.37), based on the voltages described in the fictitious axis r and s, where r has the same phase as the input voltage and the s component is shifted by 90°, which are determined according to (4.19) and (4.20).
ref
sr
sref
sr
rref Q
vv
vjP
vv
vi ..2222 +
++
= (4.37)
The reference voltage for the inverter is determined as in (4.38).
)(* iikvv ref −+= (4.38)
Where, *v - Reference voltage
v - Terminal voltage k - Voltage loop gain
i - Measured current
refi - Reference current
4.10.2 Three-phase PQ inverter The control logic for the three-phase PQ inverter is also associated to the control of the DC voltage in the DC-link capacitor. The block diagram of the grid side inverter is represented in Figure 4.27.
Figure 4.27. Three-phase grid coupling inverter PQ control.
The control philosophy proposed for the single-phase was adopted: the active power control is achieved by maintaining the DC link voltage constant and the machine power factor is controlled by the reactive power output. The direct component of the reference current is determined from the DC voltage error and the reactive power output will be controlled by the quadrature component of the reference current, resultant from the error between the measured value and the reference reactive power set-point. The d-q reference currents are then transformed to the α-β stationary reference frame. Afterwards, the inner current control loop based on a proportional controller is used in order to generate the inverter output voltages [176].
+– PI +
α β
dq K α β
abc
–
+– PI + K
–
VDCref
VDC
Iα Vα Va
Vb
VC
Iα meas
I β meas
Iβ Vβ Qref
Q
Id*
Iq*
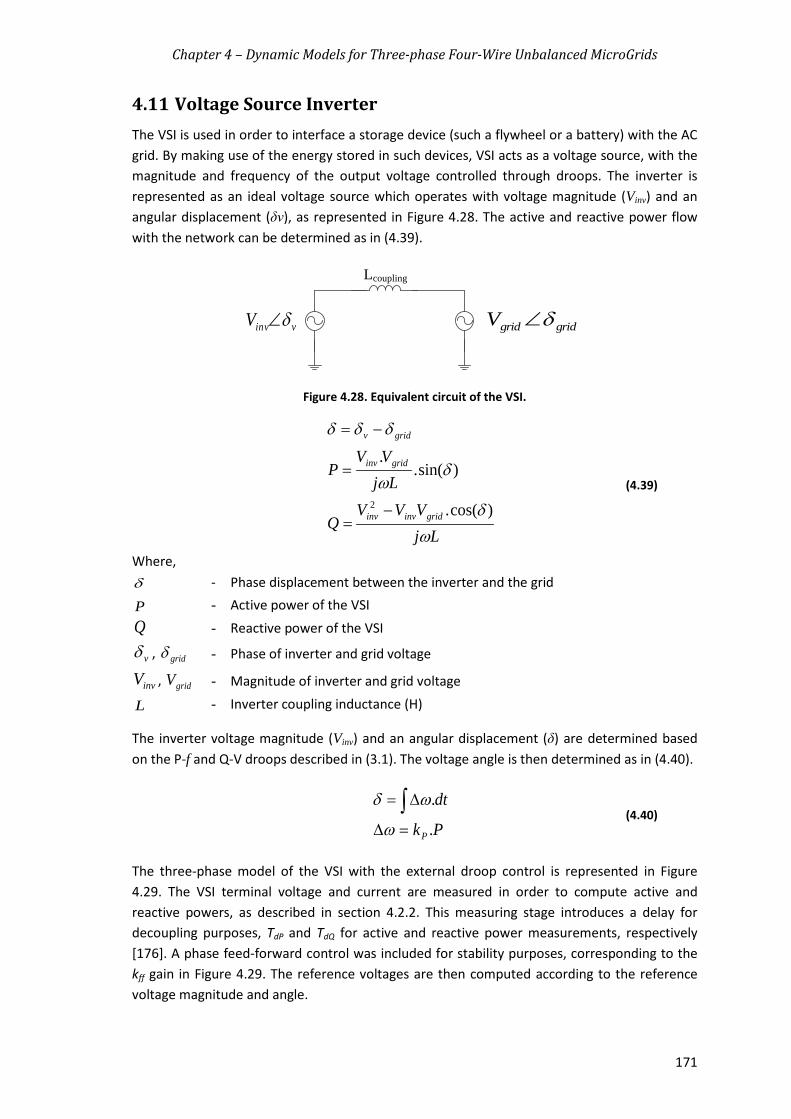
Chapter 4 – Dynamic Models for Three-phase Four-Wire Unbalanced MicroGrids
171
4.11 Voltage Source Inverter The VSI is used in order to interface a storage device (such a flywheel or a battery) with the AC grid. By making use of the energy stored in such devices, VSI acts as a voltage source, with the magnitude and frequency of the output voltage controlled through droops. The inverter is represented as an ideal voltage source which operates with voltage magnitude (Vinv) and an angular displacement (δv), as represented in Figure 4.28. The active and reactive power flow with the network can be determined as in (4.39).
Figure 4.28. Equivalent circuit of the VSI.
LjVVV
Q
LjVV
P
gridinvinv
gridinv
gridv
ωδ
δω
δδδ
)cos(.
)sin(..
2 −=
=
−=
(4.39)
Where, δ - Phase displacement between the inverter and the grid
P - Active power of the VSI Q - Reactive power of the VSI
vδ , gridδ - Phase of inverter and grid voltage
invV , gridV - Magnitude of inverter and grid voltage
L - Inverter coupling inductance (H)
The inverter voltage magnitude (Vinv) and an angular displacement (δ) are determined based on the P-f and Q-V droops described in (3.1). The voltage angle is then determined as in (4.40).
Pk
dt
P .
.
=∆
∆= ∫ω
ωδ (4.40)
The three-phase model of the VSI with the external droop control is represented in Figure 4.29. The VSI terminal voltage and current are measured in order to compute active and reactive powers, as described in section 4.2.2. This measuring stage introduces a delay for decoupling purposes, TdP and TdQ for active and reactive power measurements, respectively [176]. A phase feed-forward control was included for stability purposes, corresponding to the kff gain in Figure 4.29. The reference voltages are then computed according to the reference voltage magnitude and angle.
Lcoupling
vinvV δ∠ gridgridV δ∠

Chapter4–DynamicModelsforThree‐phaseFour‐WireUnbalancedMicroGrids
172
Figure 4.29.Three‐phase balanced VSI control model [176].
4.11.1 VoltageSourceInverterwithVoltageBalancingControlMechanismThe VSI model previously described presents at its terminals a set of three‐phase balanced voltages in case it feeds a three‐phase balanced system. However, the presence of unbalanced operating conditions in the LV MG will result in an unbalanced set of voltages at the VSI output, due to unbalanced voltage drops in the inverter coupling inductance.
The VSI model previously described was complemented with additional control functionalities aiming to reduce negative and zero sequence voltages at its connection node. A simplified scheme of the VSI incorporating the voltage balancing mechanism is represented in Figure 4.30. The reference voltage composed only by positive sequence voltage component is determined by the P‐f and Q‐V droop functions presented in section 3.3. The voltage compensation signal is determined by comparing the reference voltage to the measured voltage (which will be unbalanced).
Figure 4.30. VSI voltage control scheme with voltage balancing mechanism.
The strategy adopted in this work includes the mitigation of zero sequence voltages, thus requiring the control of a four‐leg inverter. With this topology the fourth leg controls the neutral voltage and is able to produce three independent voltages as in (4.41). The model of the four‐leg inverter is shown in Figure 4.31.
PWM
VDC
av
bv
cv
iv ,
DC
AC
*av *
bv *cv
QP ,
Decoupling
1
1
sTdP
1
1
sTdQ
s
1 Pk
Qk
ffk
P
Q
0
0V
V
‐+
‐+
peakV
+
+
3
2sin
3
2sin
sin*av
*bv
*cv
storage device
Three‐phase voltage computation

Chapter4–DynamicModelsforThree‐phaseFour‐WireUnbalancedMicroGrids
173
ng
cg
bg
ag
n
cn
bn
an
V
V
V
V
V
V
V
V
0000
1100
1010
1001
(4.41)
Where,
nabcV , ‐ Inverter output voltages referred to the neutral point
gabcV , - Inverter leg voltages
nV - Neutral voltage
Figure 4.31. Four‐leg inverter model.
The voltage balancing mechanism is constituted by the voltage‐current regulation block proposed in [106]. The control structure of the voltage balancing mechanism is represented in Figure 4.32. The Proportional‐Resonant (PR) controllers derive the current references for compensating for positive, negative and zero sequence components. Then the current error will be corrected by the inner current control block which consists in a proportional controller, since any steady state error in this loop would not affect the outer voltage loop accuracy substantially [106]. The resonant frequency used in the resonant controllers is the reference frequency set by the active power/frequency droop characteristic, avoiding the need of a mechanism to track the grid frequency. Therefore, there is no need for a PLL structure to extract the system frequency.
Three PR controllers are responsible for determining the compensating currents. The controllers have been proposed in [192], [193] as an alternative to PI controllers. They are designed in stationary reference frame dealing directly with sinusoidal signals, consequently reducing the signal processing need to perform the transformations and the sensitivity to noise. Linear control theory can be applied to study the stability of PR regulators.
va(t)
vb(t)
vc(t)
ia(t)
ib(t)
ic(t)
R L
R L
R L
vn(t) R L
va(t)
vb(t)
vc(t)
R L
R L
R L
R L
4-leg inverter Unbalanced LV network

Chapter4–DynamicModelsforThree‐phaseFour‐WireUnbalancedMicroGrids
174
Figure 4.32. Voltage Balancing mechanism with compensation of positive, negative and zero sequence voltage components.
The relation between ideal PI controller and the ideal PR controller is derived in (4.42) and (4.43).
s
sHsH DCAC 2
)(2
02 (4.42)
Considering the transfer function of and ideal PI controllers
kksH I
pDC )( ,
20
2
2)(
s
skksH I
pAC (4.43)
Where,
pk ‐ Proportional gain
Ik - Integral gain
0 - System resonant frequency
The ideal PR controller will provide infinite gain when the systems frequency is ω0, as in (4.43). For practical implementation the non‐ideal controllers is preferred, by introducing a cut‐off frequency (ωc), as in (4.44).
L coupling
DC
AC
a
b
c
n
QP ,
V*,ω*+‐
+‐
+‐
V*α
V*β
V*0
abcαβ0
vabcn
PR
PR
PR
+‐
+‐
+‐
abcαβ0
abcαβ0
Van* Vbn* Vcn*
iabcn
I*α
I*β
I*0
Voltage Balancing Mechanism Droop Control
Current Control
ω / V
P / Q
αβ0
abc

Chapter4–DynamicModelsforThree‐phaseFour‐WireUnbalancedMicroGrids
175
020
220
2
2
,2
2
)(2
)(2)(
c
c
cIp
cc
ccIpAC
ss
skK
ss
skksH
(4.44)
The following properties characterize the PR controller [192], [193]: The cut‐off frequency (ωc) should be as small as possible in order to achieve a high gain
at the fundamental frequency (ω0) and to remove steady state error.
Increasing integral gain ( Ik ) will increase the gain of the PR response without affecting
the shape of the regulator’s frequency response. Increasing the proportional gain ( pk ) will lead to a faster transient response of the
regulator.
Figure 4.33 shows the relation between the synchronous PI and PR controllers for compensating negative and zero‐sequence voltage components. The transfer function of the non‐ideal PR controller for both positive and negative sequence component control is given in (4.45). There are no cross coupling terms between α and β stationary axis, enabling the independent control of these variables. α and β stationary axis are independent from zero sequence components [194]. In order to compensate for zero sequence components a PR regulator can be also applied as proposed in [106].
Figure 4.33. Equivalent representation of synchronous PI and PR controllers, for positive and negative sequence control [194].
jeje
je )(sGdq
)(sGdq
je
)(sG
)(sG
)(sG
22
22
2
20
02
2
2
1)(
ss
skk
ss
skk
sG
c
cip
c
cip
(4.45)

Chapter 4 – Dynamic Models for Three-phase Four-Wire Unbalanced MicroGrids
176
4.12 Simulation platform The models described in this chapter were integrated in a simulation platform implemented in MATLAB®/Simulink®, using SimPowerSystem® toolbox and user defined models. As previously mentioned, the simulation platform was developed based on the work developed under the European project MICROGRIDS [43]. As referred previously, a set of enhancements and adaptations were made in order to represent the MG as an unbalanced system and include the new controllable resources and control strategies that are proposed in this work, namely:
• Representation of the LV voltage network as a three-phase four-wire system. • Development and implementation of models for EV and MS single-phase power
electronic interfaces. • Implementation of EV f-P droop control strategy for improving the MG frequency
regulation during islanding and BS. • Development and implementation of the voltage balancing mechanisms incorporated
at the VSI.
Regarding the platform simulation capabilities, it enables the dynamic simulation of different MG test system during emergency operation mode, namely MG islanded operation and local restoration procedure. The emergency control strategies proposed in this thesis can be also evaluated through simulation and compared to cases where only the basic voltage and frequency regulation strategies are provided.
The simulation environment is represented in Figure 4.34, where it is possible to identify the blocks integrating the models of different MG elements. The MG model developed in MATLAB®/Simulink® follows a hierarchical philosophy, being composed by several sub-models. The use of Simulink® “mask” functionality allows the aggregation of the model representing a specific system in a single block, therefore allowing building user-friendly models from the graphical point of view. In order to illustrate the modularity of the simulation platform, Figure 4.35 shows the storage and VSI model, composed by the inverter model (ideal source and its coupling inductance, the measurement blocks which determine the necessary variables for control, the droop control and the voltage balancing mechanism if considered. The parameters of the VSI model can be changed externally without the need of accessing the sub-models. As shown in Figure 4.36, the parameters of the VSI droop function and voltage balancing controllers can be changed without the need of editing the sub-model. This functionality enables a fast implementation of different test systems and simulation scenarios.
The EV model is also represented in Figure 4.37. The model enables the user to choose the EV operating mode, either operating as a constant load or controlled through the f-P droop. The reference charging power is then compared to the power measured at the inverter terminals, based on the method described in 4.2. The EV grid-coupling inverter will then regulate the inverter current in order to maintain the EV charging/discharging power at the reference value.
The full MG model will result in a hybrid system with fast and slow continuous and discrete dynamics. The MATLAB®/Simulink® solver will be responsible for solving the equations representing the MG model. Solver ode23t was selected for solving the numerical integration

Chapter 4 – Dynamic Models for Three-phase Four-Wire Unbalanced MicroGrids
177
method, since it provided the best compromise between the simulation time and accuracy. These variable-step numerical methods allow adjusting the simulation time steps to obtain satisfactory results. More details on the MATLAB®/Simulink® numerical methods available can be found in [195].
Figure 4.34. MG simulation platform in MATLAB®/Simulink® environment.
Figure 4.35. Storage and VSI model implemented in MATLAB®/Simulink® environment.

Chapter 4 – Dynamic Models for Three-phase Four-Wire Unbalanced MicroGrids
178
Figure 4.36. User interface for editing the storage and VSI model parameters.
Figure 4.37. EV model implemented in MATLAB®/Simulink® environment.

Chapter 4 – Dynamic Models for Three-phase Four-Wire Unbalanced MicroGrids
179
4.13 Summary and Main Conclusions The development of new functionalities related to the MG operation with EV in unbalanced conditions, particularly in emergency mode of operation, requires the development of adequate dynamic simulation models in order to study the impact in the MG stability.
This chapter describes the dynamic models of the MG resources connected to a three-phase four-wire LV network, describing the derived EV dynamic model and the control of the MS and EV grid-coupling inverters. In order to compensate voltage unbalance an additional control mechanisms to be placed at the power electronic inverter level was presented, in order to improve MG operating conditions during islanding in case of excessive voltage unbalance. The models described in this chapter were integrated in a MATLAB®/Simulink® simulation platform using SimPowerSystem® toolbox and user defined models, in order to analyse the dynamic performance of several control strategies proposed to enhance MG operation under unbalanced conditions.


Chapter 5 – MicroGrid Emergency Control Solutions: Simulation Results
181
– MicroGrid Emergency Control Chapter 5Solutions: Simulation Results This chapter presents the most relevant results obtained through dynamic simulation regarding the MicroGrid (MG) emergency control strategies discussed in Chapter 3. The main objective is to evaluate the technical benefits of actively exploiting the flexibility of Electric Vehicles (EV) and responsive loads in order to improve MG stability and resilience during autonomous operation, namely during islanding and when performing local service restoration. Additionally, the benefits of considering the local voltage balancing mechanism described in Chapter 3 are analysed when considering its installation in distinct nodes of the MG. The MG MATLAB®/Simulink® simulation platform incorporating the models described in Chapter 4 was extensively used in order to study the dynamic behaviour of the MG operating during emergency conditions.
5.1 Introduction The MG emergency control strategies discussed in Chapter 3 aim at improving the MG resilience when operating autonomously or when performing the local service restoration procedure. The proposed strategies are focused on:
• Improving MG frequency regulation ‒ the integration of emergency load control and EV grid supporting strategies were proposed in order to increase the primary reserve available and support the storage units controlled through conventional P-f and Q-V droops. Additionally, a new set of algorithms were proposed to be integrated at the MG Central Controller (MGCC) in order to promote a better coordination between the available resources according to the MG operating state.
• Mitigating voltage unbalance ‒ the integration of single-phase Low Voltage (LV) MicroSources (MS) and EV is expected to increase voltage unbalance problems in LV networks. At the same time, when operating autonomously, voltage unbalance can be further accentuated and thus compromise the operation of three-phase connected units (loads or MS). Therefore, in a first phase it was necessary to assess the effectiveness of the MG frequency regulation strategies even when operating islanding. Then, in order to mitigate voltage unbalance, a voltage balancing mechanism was adopted to be included at the three-phase Voltage Source Inverter (VSI) coupled to storage units. Given the characteristics of LV feeders, which can be lengthy and highly resistive, the location and number of VSI with the additional voltage compensation controls needs to be assessed.
Considering the objectives of the control strategies that were proposed, the results analysis is divided in three main sections. Section 5.3 focus on the MG islanded operation considering the active participation of loads and EV. First the benefits of the EV participation in MG load-frequency control considering the f-P droop characteristic are analysed and then the emergency load control scheme proposed is considered in order to evaluate the benefits of coordinating EV and responsive loads in providing grid supporting functionalities. Section 5.4

Chapter 5 – MicroGrid Emergency Control Solutions: Simulation Results
182
presents the main results obtained for the participation of EV in the MG restoration procedure, providing Vehicle-to-Grid (V2G) services. Finally, section 5.5 presents an extensive analysis of the voltage unbalance problem for both interconnected and islanded operation. The effectiveness of the voltage balancing strategies proposed are analysed considering different operating scenarios and locations to perform compensation.
5.2 MicroGrid Test Systems Two distinct LV networks were adopted for the numerical simulation studies that were performed. A typical Portuguese urban LV network was adopted for analysing the active participation of EV and loads in the operation of the system, namely for islanded and restoration procedure. For validating the voltage balancing strategies, a rural network was adopted, since in this type of networks the risk of having severe voltage unbalance problems is higher. As previously discussed, rural networks typically have radial configurations with long overhead feeders and low short-circuit power. These characteristics associated to the low consumer density, uneven distribution of the loads among the three-phases of the system as well as the high penetration of microgeneration are likely to cause severe voltage unbalance problems. The main characteristics of each test system are described below and in more detail in Appendix A and Appendix B, respectively.
In order to allow the LV distribution grids to operate as a MG, the following resources were added, such as:
• Single-phase non-controllable MS, namely PhotoVoltaic (PV) panels and micro-Wind Turbines (WT).
• Three-phase controllable MS such as Single-Shaft gas Microturbines (SSMT) and a Solid Oxide Fuel Cell (SOFC).
• Energy Storage unit coupled to the grid through a VSI with and without the voltage balancing mechanism.
• Single-phase EV chargers distributed by the feeders of the system.
The EV connected to the LV network were considered to charge in Mode 1 with nominal charging powers close to 3 kW. The frequency parameters of the EV f-P droop characteristic considered for each EV charger are described in Table 5.1. It was considered that the EV will charge at 75% of their nominal power in order to enable the EV to increase its charging power when facing the increase of the system frequency.
Table 5.1. EV f-P droop parameters.
f-P droop Parameters Values
Nominal Frequency (Hz) 50
Zero-Crossing Frequency (Hz) 49.5
Maximum Frequency (Hz) 51
Minimum Frequency (Hz) 49
Frequency Dead-band (Hz) 0.2

Chapter 5 – MicroGrid Emergency Control Solutions: Simulation Results
183
5.2.1 MicroGrid Urban Network The urban network was initially characterized in the context of the InovGrid and REIVE projects, based on a real LV Portuguese distribution system [45], [161]. The original LV system is connected to the Medium Voltage (MV) network through a 400kVA transformer and supplies 141 clients, from which 106 have single-phase connections and 36 have three-phase connections. The network has a radial topology which is divided in six feeders and comprises 71 nodes. In order to reduce the computation burden, two simplified versions of the network were developed through nodes aggregation: Urban Network 1 comprising 16 nodes and Urban Network 2, which is composed by 9 nodes and considers only 4 of the feeders from Urban Network 1.
5.2.1.1 Urban Network 1 The single-line diagram of Urban Network 1 is represented in Figure 5.1. All the feeders from the original network were considered. However, the total number of nodes was reduced to 16 considering feeders’ equivalent impedance and by aggregating the loads in the nearest node downstream the feeder, thus representing a worst case scenario when compared to the original network. The networks feeder characteristics are given in Table A.2 of Appendix A.
Figure 5.1. Single-line diagram of the Urban Network 1.
The LV network is operated under unbalanced conditions with both single-phase and three-phase loads, having a peak power of 184 kW. The load per node and phase is detailed in Table A.3. In order to maintain power balance during islanding operation, around 66 kW of load can be disconnected considering underfrequency load shedding scheme, according to the parameterization defined in Table 5.2.
The simulation scenario is summarized in Table 5.3 regarding the loads, MS production and EV charging power and represented in Figure 5.2. The charging power of the EV connected in the same node was aggregated in an equivalent value (as in Table A.4).
Table 5.2. Load shedding parameters for Urban Network 1.
Group fmin (Hz) Nodes Pshed (kW)
I 49,7 71, 27, 75 31.65
II 49,65 15,55 12,87
III 49,6 33,40 10,66
IV 49,55 32,73 10,96
75
7429
7371
26
40
32
33
31
2569
15
5537
27
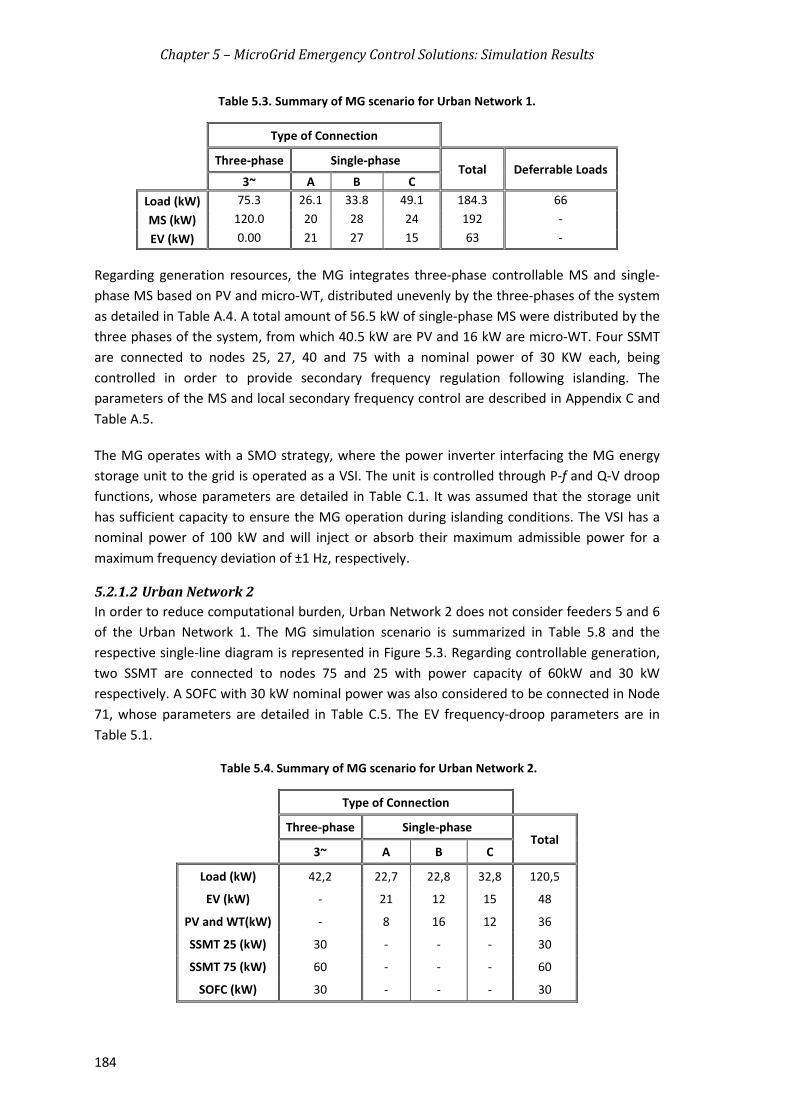
Chapter 5 – MicroGrid Emergency Control Solutions: Simulation Results
184
Table 5.3. Summary of MG scenario for Urban Network 1.
Type of Connection
Three-phase Single-phase Total Deferrable Loads
3~ A B C Load (kW) 75.3 26.1 33.8 49.1 184.3 66 MS (kW) 120.0 20 28 24 192 - EV (kW) 0.00 21 27 15 63 -
Regarding generation resources, the MG integrates three-phase controllable MS and single-phase MS based on PV and micro-WT, distributed unevenly by the three-phases of the system as detailed in Table A.4. A total amount of 56.5 kW of single-phase MS were distributed by the three phases of the system, from which 40.5 kW are PV and 16 kW are micro-WT. Four SSMT are connected to nodes 25, 27, 40 and 75 with a nominal power of 30 KW each, being controlled in order to provide secondary frequency regulation following islanding. The parameters of the MS and local secondary frequency control are described in Appendix C and Table A.5.
The MG operates with a SMO strategy, where the power inverter interfacing the MG energy storage unit to the grid is operated as a VSI. The unit is controlled through P-f and Q-V droop functions, whose parameters are detailed in Table C.1. It was assumed that the storage unit has sufficient capacity to ensure the MG operation during islanding conditions. The VSI has a nominal power of 100 kW and will inject or absorb their maximum admissible power for a maximum frequency deviation of ±1 Hz, respectively.
5.2.1.2 Urban Network 2 In order to reduce computational burden, Urban Network 2 does not consider feeders 5 and 6 of the Urban Network 1. The MG simulation scenario is summarized in Table 5.8 and the respective single-line diagram is represented in Figure 5.3. Regarding controllable generation, two SSMT are connected to nodes 75 and 25 with power capacity of 60kW and 30 kW respectively. A SOFC with 30 kW nominal power was also considered to be connected in Node 71, whose parameters are detailed in Table C.5. The EV frequency-droop parameters are in Table 5.1.
Table 5.4. Summary of MG scenario for Urban Network 2.
Type of Connection
Three-phase Single-phase Total
3~ A B C
Load (kW) 42,2 22,7 22,8 32,8 120,5
EV (kW) - 21 12 15 48
PV and WT(kW) - 8 16 12 36
SSMT 25 (kW) 30 - - - 30
SSMT 75 (kW) 60 - - - 60
SOFC (kW) 30 - - - 30

Chapter 5 – MicroGrid Emergency Control Solutions: Simulation Results
185
Figure 5.2. MG topology for Urban Network 1.
EV
EV 29B
EV
SSM
T 75
Load 29A
EV
EV 29C
EV 7
4 A
Load
3~ Lo
ad 7
4A
Load
75B
Load
75C
EVEV 7
5 A
PV 7
5 A
Node 29
Node 74Node75
0.4
kV
TRAFO 400kVA
Node 5
SSM
T 25
Load
3~
Load
25
A
Load
25
C
EVEV 2
5 A
EVEV 2
5 B
EVEV 2
5 C
Load 15B
Node15
Load 3~
Load 3~ Load 69A Load 69C
Node 69
Node 25
WT 69A
WT 69C
Load
3~
Load
27A
Load
27B
Load
27C
Load
3~
Load
71B
Lo
ad 7
1 C
PV 7
3 B
PV B &C
Node 73
Node 27 Node 71
PV 32B
Load
3~
EV
Node 31
Load
3~
Nó 33
Node 32
Load 32B
Load 3~
Load 55A
Load 55C
EVEV 55B
WT 55C
Load 3~
Load 37C
EV
EV
Node55
Node 37
Load
3~
Load
26A
EV
EV 2
6 B
PV 2
6 A
SSMT 40
Node 26
Load 3~
Load 40A
Load 40B
Load 40C
PV 37C
Node 40
Load
73A
Load
31A
EV
31
B
WT
A
EV A & B
SSM
T 27

Chapter 5 – MicroGrid Emergency Control Solutions: Simulation Results
186
Figure 5.3. MG topology for Urban Network 2.
5.2.2 MicroGrid Rural Network The rural LV network is based on a Spanish LV distribution feeder identified within the MERGE project [22]. This network has a nominal voltage of 380 V and a total peak load of approximately 200 kW, including three-phase and single-phase loads distributed unevenly by the thirteen nodes of the network. The overall LV grid comprises 1135m of overhead lines and 94m of underground cables. The feeders have high resistance compared to the reactance as can be verified from Table B.3.

Chapter 5 – MicroGrid Emergency Control Solutions: Simulation Results
187
The MG topology of the Rural Network is represented in Figure 5.4. A 100 kW storage unit was considered to be connected to the LV bus of the MV/LV substation (Node 1), thus enabling islanding operation. The storage unit is coupled to a VSI which is controlled through P-f and Q-V droop functions and can also perform voltage balancing by adopting the regulation mechanisms that were described in Chapter 4. The parameters of droop and voltage compensation controllers are detailed in Table C.1.
Similarly to what was considered in previous systems, the load from EV charging which are connected in the same phase of a node was aggregated in an equivalent charging interface. The EV f-P droop parameters adopted are presented in Table 5.1.
Three SSMT with a maximum capacity of 30 kW are connected to nodes 25, 66 and 71. These units are coupled to the LV network by a three-phase grid-tied inverter, controlled through a constant active and reactive power strategy (i.e. PQ control). The SSMT and three-phase inverter model parameters are detailed in Table C.2 and Table C.3. Regarding single-phase generation, both PV and micro-WT single-phase generation was unevenly distributed by the three-phases of the system. These renewable-based MS units are connected to the grid through single-phase grid-tied inverters (PQ control). The model parameters are described in Table C.4.
In order to derive the potential impact of the large scale integration of single-phase MS and EV, three different simulation cases were developed. The first simulation scenario corresponds to the MG operation at peak load with high penetration of MS and EV charging, as detailed in Table 5.5. The second represents the MG operation with off-peak load and high penetration of renewable based MS and EV charging. In the second scenario the load is reduced to 20% of peak load and the non-controllable MS and EV power is similar to the first scenario. The third scenario is an extreme operation scenario, where severe unbalance conditions were considered.
For better following the result analysis a summary of each simulation scenario is presented in section 5.5. Detailed information of the load, MS and EV charging powers per node can be found in Table B.5. The topology of the system integrating the MG resources is represented in Figure 5.4.
Table 5.5. MG scenario for Rural Network.
Type of Connection
Three-phase Single-phase Total Deferrable
Loads 3~ A B C
Load (kW) 87.9 46.8 41.3 26.3 202.3 160.4
MS (kW) 90.0 13.7 54.0 28.0 185.7 -
EV (kW) 0.0 24 9 30 63 -

Chapter 5 – MicroGrid Emergency Control Solutions: Simulation Results
188
Figure 5.4. MG topology of the Rural Network.
5.3 Islanding Operation This section presents the main results regarding the active participation of EV and loads in MG emergency operation, particularly during islanding operating conditions. The main objective is to identify the benefits of such controls and algorithms for improving MG frequency regulation capacity and consequently improve MG resilience following an unplanned islanding. The first part of the results discussion focus in EV participation in primary frequency control, while the second part integrates the emergency load control strategy and the algorithms proposed to promote the coordination of the flexible resources available and determine the best control solutions to avoid the MG collapse.
MG Main Storage
Node 1
Node 89
EV
EVNode 84
EV
EV
EV
Node 55
Node 25
Node 51
EV
Node 22
Node 15EV
Node 42
Node 66EV
Node 71
Node 45
Node 11
Node 36
EV
EV

Chapter 5 – MicroGrid Emergency Control Solutions: Simulation Results
189
5.3.1 MicroGrid Islanded Operation with Electric Vehicles The adoption of EV f-P droop characteristics regarding MG islanding operation is expected to improve the MG dynamic behaviour in the moments subsequent to MG islanding, as well as following other disturbances affecting the balance between local generation and load. EV f-P droop characteristic was designed to support the MG primary frequency control, being expected to improve the MG stability during islanded operation. The EV grid supporting strategies change the total power consumption from EV charging based on the system frequency, which consequently is expected to have a positive impact on the storage unit solicitation.
In order to quantify the benefits of the EV participation in frequency regulation two cases were considered, namely:
• Base case – the EV do not respond to frequency variations, being regarded as conventional loads;
• Case 1 – the EV chargers are controlled with a f-P droop strategy with the parameters described in Table 5.1.
The Urban Network 1 was considered for these simulation studies. In the beginning of the simulation, the MG is connected to the main grid. The network is operating with peak power totalizing about 184.3 kW and the SSMT are providing 62.5 kW of active power. Consequently, in interconnected mode the MG is importing about 97 kW of active power from the MV network. The EV are charging at 75% of their nominal charging power. The MG operating state before islanding is summarized in Table 5.6.
Table 5.6. MG scenario for Urban Network 1 – Initial operating conditions.
Type of Connection
Three-phase Single-phase Total Deferrable Loads
3~ A B C
Load (kW) 75.3 26.1 33.8 49.1 184.3 66
EV (kW) 0.00 15.8 20.3 11.3 47.4 -
SSMT 75 17.5 - - - 17.5 -
SSMT 25, 27, 40 15 - - - 45.0 -
MS (kW) - 20 28 24 72 -
After the unplanned islanding the MG has 57.5 kW of generation reserve to supply the 97 kW of power being imported from the upstream MV grid. Therefore, in order to maintain the balance between local generation and loads it was necessary to disconnected loads, according to the load shedding parameters in Table 5.2. Secondary frequency control is performed locally as an additional PI control loop defining the active power set-point of each SSMT according to the frequency deviation. The local secondary frequency control parameters are detailed in Table A.5. It was assumed that the storage unit has sufficient capacity to maintain power balance between generation and load.

Chapter 5 – MicroGrid Emergency Control Solutions: Simulation Results
190
5.3.1.1 Results Analysis After 10s of the simulation time, the MG is suddenly disconnected from the main grid and becomes isolated. In the moments subsequent to MG islanding, since the MG was importing a significant amount of power from the MV network, the system suffers a frequency drop, as represented in Figure 5.5. In the moments subsequent to islanding, local secondary frequency control starts to respond immediately, taking about 35 seconds to correct frequency deviation.
Comparing the MG frequency response for the two cases under consideration it is possible to observe that the EV participation reduces the initial frequency deviation. In the Base case, the minimum frequency reaches 49.49 Hz, while in Case 1 the participation of EV reduced the frequency deviation in 0.1 Hz reaching a minimum of 49.6 Hz.
Figure 5.6 presents the power absorbed/injected by the EV for Case 1. The participation of EV occurs during the 20 seconds subsequent to the MG islanding, which corresponds to the period where frequency was below 49.9 Hz (dead-band associated to the droop control used in the EV chargers). As shown in Figure 5.6, the contribution of EV will respond proportionally to the frequency and according to their droop characteristics and charging rate. Since the MG frequency is higher than the zero-crossing frequency the EV only reduces its charging power and does not invert is power flow (i.e. V2G mode).
Figure 5.5. MG frequency response after islanding.
Figure 5.6. Power absorbed/injected by EV.
0 5 10 15 20 25 30 35 40 45 50 55 60
49.6
49.8
50
50.2
Time (s)
Freq
uenc
y (H
z)
Base Case - Without EV f-P droopCase 1 - With EV f-P droop
10 20 30 40 50 60-8
-7
-6
-5
-4
-3
-2
-1
0
Time (s)
Act
ive
pow
er (k
W)
EV25AEV 25BEV 25CEV 26BEV 29BEV 29CEV 31BEV 37AEV 37BEV 55BEV 74AEV 75A
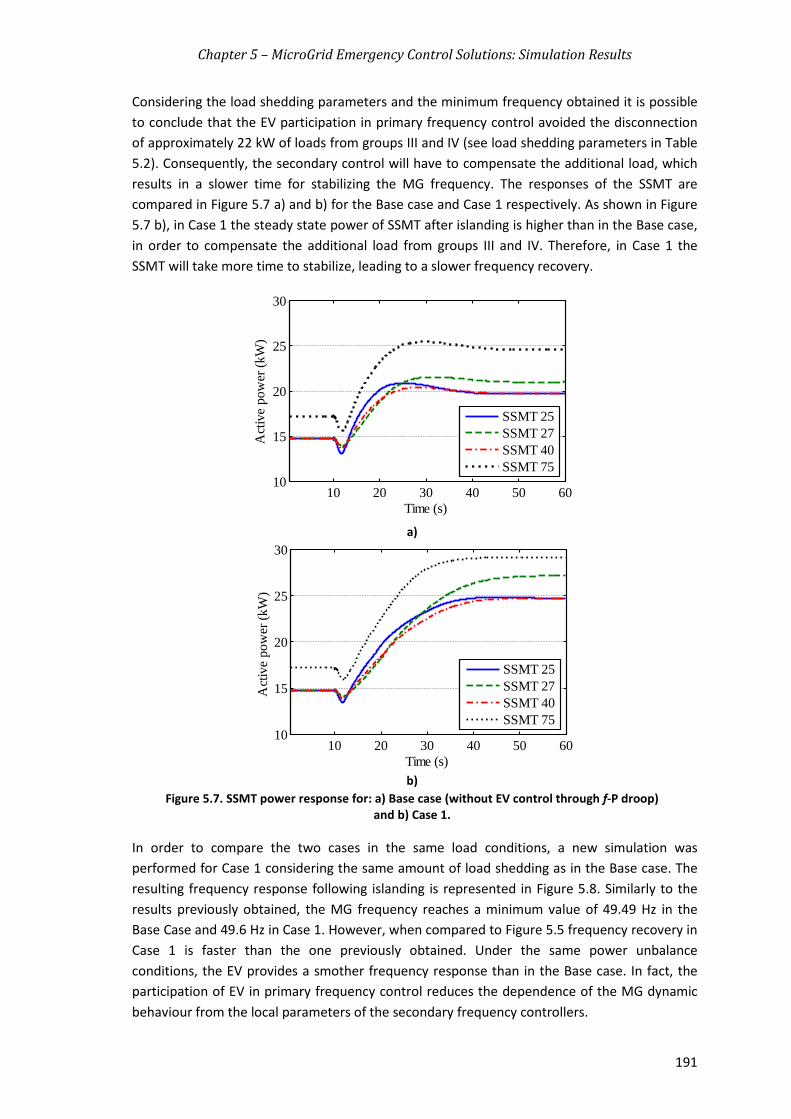
Chapter 5 – MicroGrid Emergency Control Solutions: Simulation Results
191
Considering the load shedding parameters and the minimum frequency obtained it is possible to conclude that the EV participation in primary frequency control avoided the disconnection of approximately 22 kW of loads from groups III and IV (see load shedding parameters in Table 5.2). Consequently, the secondary control will have to compensate the additional load, which results in a slower time for stabilizing the MG frequency. The responses of the SSMT are compared in Figure 5.7 a) and b) for the Base case and Case 1 respectively. As shown in Figure 5.7 b), in Case 1 the steady state power of SSMT after islanding is higher than in the Base case, in order to compensate the additional load from groups III and IV. Therefore, in Case 1 the SSMT will take more time to stabilize, leading to a slower frequency recovery.
a)
b)
Figure 5.7. SSMT power response for: a) Base case (without EV control through f-P droop) and b) Case 1.
In order to compare the two cases in the same load conditions, a new simulation was performed for Case 1 considering the same amount of load shedding as in the Base case. The resulting frequency response following islanding is represented in Figure 5.8. Similarly to the results previously obtained, the MG frequency reaches a minimum value of 49.49 Hz in the Base Case and 49.6 Hz in Case 1. However, when compared to Figure 5.5 frequency recovery in Case 1 is faster than the one previously obtained. Under the same power unbalance conditions, the EV provides a smother frequency response than in the Base case. In fact, the participation of EV in primary frequency control reduces the dependence of the MG dynamic behaviour from the local parameters of the secondary frequency controllers.
10 20 30 40 50 6010
15
20
25
30
Time (s)
Act
ive
pow
er (k
W)
SSMT 25SSMT 27SSMT 40SSMT 75
10 20 30 40 50 6010
15
20
25
30
Time (s)
Act
ive
pow
er (k
W)
SSMT 25SSMT 27SSMT 40SSMT 75

Chapter 5 – MicroGrid Emergency Control Solutions: Simulation Results
192
The storage unit response is represented in Figure 5.9 where it is possible to observe a reduction of the total power injected by the VSI, when EV participate in primary frequency control. In both cases, the maximum power injected by the storage unit is the same in the moment when the islanding occurs, because the EV only start responding when frequency is outside the ±0.1 Hz dead-band. However, the power injected by the storage unit is reduced immediately as the EV reduce their charging power. In the Base case the storage unit compensates the unbalance between load and generation until the secondary frequency control corrects the frequency deviation. However, in Case 1 the EV participation reduces the total load of the system, compensating for the slow response of the SSMT. When the MG frequency reaches the nominal value (50 Hz) the power injected by the storage unit is zero.
The power output of the SSMT for the new simulation of Case 1 is represented in Figure 5.10. When the frequency reaches 50 Hz, the SSMT stabilize in the same active power output as in the Base case (see Figure 5.7 a)), since the MG operates with the same amount of load after the islanding. However, the SSMT response is more stable in Case 1 due to the different frequency responses obtained in the Base Case and Case 1.
Figure 5.8. MG frequency response after the islanding (with the same amount of load disconnection).
Figure 5.9. Total power injected by the main storage unit (with the same amount of load
disconnection).
0 5 10 15 20 25 30 35 40 45 50 55 60
49.5
49.6
49.7
49.8
49.9
50
50.1
50.2
Time (s)
Freq
uenc
y (H
z)
Base Case - Without EV f-P droopCase 1 - With EV f-P droop
5 10 15 20 25 30 35 40 45 50 55 60-20
0
20
40
60
80
100
Time (s)
Act
ive
pow
er (k
W)
Base Case - Without EV f-P droopCase 1 - With EV f-P droop

Chapter 5 – MicroGrid Emergency Control Solutions: Simulation Results
193
Figure 5.10. SSMT power output with EV participation in MG frequency regulation (Case 1).
As it was already mentioned, the MG is operated under unbalanced conditions due to the uneven connection of single-phase loads, EV and MS (see Table 5.6, Table A.3 and Table A.4). In this case, the voltage balancing mechanisms was not considered, since it will be discussed in more detail in section 5.5.
Nevertheless, in order to provide an overview of MG voltage unbalance during islanding operation, the negative and zero sequence voltage unbalance factors (i.e. VUFneg and VUF0) were determined for each node as in (2.4) and (2.5) after the secondary frequency control stabilizes frequency at 50 Hz. As shown in Figure 5.11 a) VUFneg is outside the admissible 2% limit in nodes 31, 37, 55, 69 and 71, reaching values close to 6% in nodes 37 and 55. Such high unbalances can be explained by the fact that the phases where the majority of loads are connected do not coincide with the phases with the highest share of MS. For example, in feeder 5 (i.e. where nodes 31, 37 and 55 are connected) MS are connected mainly to phase C while the majority of loads are connected to phase A. Consequently, in this feeder phase A voltages are below 90% of the nominal voltage, while voltages in phase C are above 110% of nominal voltage. The high unbalance between the phases of the system also explains the high VUF0 obtained, which as shown in Figure 5.11 b) reaches a maximum of 13.7% in nodes 37 and 55.
Even when operating under severe unbalance conditions, the MG frequency regulation strategies were able to maintain the stability of the system. As represented in Figure 5.12, without the balancing mechanisms previously discussed, the VSI produces an unbalanced three-phase voltage reference. The VSI single-phase active power is represented in Figure 5.13. The voltage unbalance occurs, since the VSI will maintain power balance by compensating the unbalance verified at each phase of the system. As discussed in Chapter 4, single-phase power is measured with the method proposed by Engler method [181]. As shown in Figure 5.13, the single-phase power measurement as an oscillating component.
10 20 30 40 50 6010
15
20
25
30
Time (s)
Act
ive
pow
er (k
W)
SSMT 25SSMT 27SSMT 40SSMT 75

Chapter 5 – MicroGrid Emergency Control Solutions: Simulation Results
194
a)
b)
Figure 5.11. Voltage unbalance factors during MG islanded operation: a) negative sequence and b) zero sequence.
Figure 5.12. VSI phase voltages during islanding.
5 25 26 27 31 32 37 40 55 69 71 74 750
1
2
3
4
5
6
7
Nodes
VU
F neg (%
)
5 25 26 27 31 32 37 40 55 69 71 74 750
5
10
15
20
Nodes
VU
F 0 (%)
10 20 30 40 50 60210
215
220
225
230
Time (s)
Vol
tage
(V)
VAVBVC

Chapter 5 – MicroGrid Emergency Control Solutions: Simulation Results
195
Figure 5.13. Active power injected by the main storage unit per phase.
5.3.2 Active Coordination of Electric Vehicles and Active loads The participation of EV can improve the MG frequency regulation capacity. However, its effectiveness is dependent on the number of EV connected to the system and on its batteries State of Charge (SOC). As it was shown in the previous example, the participation of loads is essential to maintain power balance, in case of generation capacity shortage. However, when adopting static load shedding strategies the frequency relay settings are pre-defined and cannot be updated according to the MG operating state and available resources, which may lead to under or over shedding of loads. The MG may even collapse if load control is not configured in accordance with the MG generation and storage capacity.
As discussed in Chapter 3, the implementation of emergency load control schemes has the potential to improve MG frequency regulation, increasing the flexibility of the system in coordination with EV participation (see Figure 3.15 and Figure 3.16). However, it also requires high level coordination algorithms in order to manage the resources available and ensure a secure islanded operation.
The effectiveness of the emergency load control strategy proposed in Chapter 3 is addressed in this section. The amount of load to control will be determined by the two algorithms proposed in Chapter 3 (see section 3.7). During interconnected operation the load and EV emergency scheduling algorithm will evaluate the MG operating conditions and define the control actions accordingly. After the islanding an alternative algorithm will monitor the MG operation and evaluate if additional control of MG resources is required.
Urban network 2 described in section 5.2.1.2 was adopted for demonstrating the effectiveness of the proposed control strategies. The disturbance under analysis is an unplanned islanding, which does not allow balancing MG load and generation prior to the islanding. After the islanding transient, the MG islanded operation algorithm will be activated in order to coordinate the MG controllable resources and maintain power balance. In order to demonstrate the effectiveness of the emergency control of responsive loads, three simulation scenarios were considered:
10 20 30 40 50 60-10
0
10
20
30
40
Time (s)
Act
ive
pow
er (k
W)
PAPBPC

Chapter 5 – MicroGrid Emergency Control Solutions: Simulation Results
196
• Scenario I – in this scenario the MG lacks sufficient reserve capacity to supply the MG loads after the islanding. The SOFC connected in Node 71 was not considered, which means that the MG has only 90 kW of total generation capacity.
• Scenario II – the MG has sufficient reserve capacity to supply the MG loads. The SOFC is considered to be connected to Node 71, increasing the total generation capacity to 120 kW.
• Scenario III – this scenario is based on Scenario II. However, the MG is already operating islanded and will suffer a sudden loss of generation from non-controllable MS (i.e. based on solar and wind resources).
In order to derive the benefits of coordinating EV and responsive loads, three cases were considered for each simulation scenario considering EV availability to participate in primary frequency control, namely:
• Base Case – No participation of EV in primary frequency control is considered. Instead, the EV adopt a dumb charging strategy.
• Case 1 – 100% of the EV connected to the MG are controlled with f-P droop. • Case 2 – Only 50% of the EV connected to the system are controlled with f-P droop
characteristic.
When characterizing the state of the system, the MGCC aggregates the availability of responsive loads for participating in emergency load control strategy. The aggregated availability is divided in distinct groups according to their priority. In this case 3 load groups were considered for the load priority list, which are defined in Table 5.7. The loads in Group I (i.e. non-priority loads) can be disconnected during an indefinite amount of time, while the loads in Groups II and III have a maximum control period associated (e.g. 3 and 4 minutes considered for Group III and II).
The frequency for which the loads will be disconnected start at 49.7 Hz as in [153]. However, the switching off frequency can be updated according to the results obtained from the MG simplified model (Figure 3.19). If a temporary load curtailment is scheduled, the loads will be reconnected if the MG has sufficient generation reserve capacity to supply the additional load reconnection and when the frequency returns to values higher than 49.9 Hz.
Table 5.7. Aggregated load availability.
Load Group P (kW)
I 40
II 20
III 15
The main objective of the performed simulation studies was to evaluate the effectiveness of the energy balance algorithms in maintaining the security of operation. It was assumed that the Home Energy Manager (HEM) is able to determine the availability of flexible loads and send it upstream to the MGCC through the Smart Meter (SM). Additionally, the HEM will manage the household consumption in order to ensure that the load control solution defined by the algorithms responds accordingly when the MG emergency operation mode is activated.
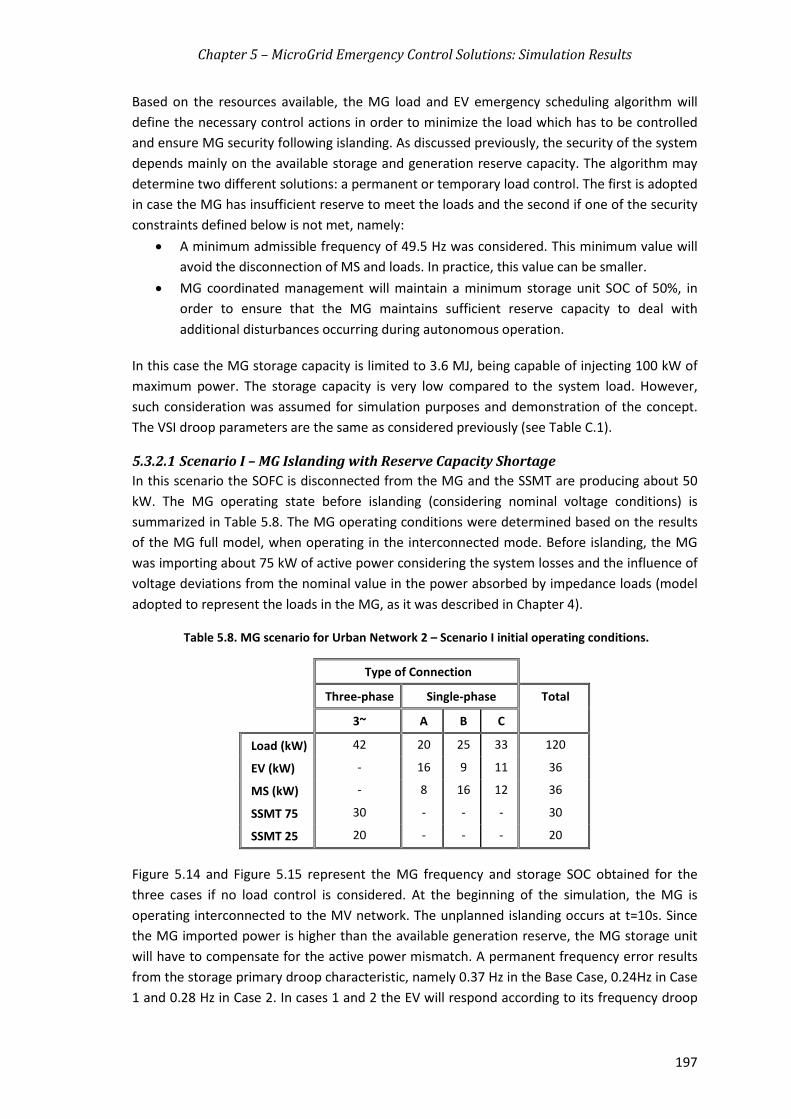
Chapter 5 – MicroGrid Emergency Control Solutions: Simulation Results
197
Based on the resources available, the MG load and EV emergency scheduling algorithm will define the necessary control actions in order to minimize the load which has to be controlled and ensure MG security following islanding. As discussed previously, the security of the system depends mainly on the available storage and generation reserve capacity. The algorithm may determine two different solutions: a permanent or temporary load control. The first is adopted in case the MG has insufficient reserve to meet the loads and the second if one of the security constraints defined below is not met, namely:
• A minimum admissible frequency of 49.5 Hz was considered. This minimum value will avoid the disconnection of MS and loads. In practice, this value can be smaller.
• MG coordinated management will maintain a minimum storage unit SOC of 50%, in order to ensure that the MG maintains sufficient reserve capacity to deal with additional disturbances occurring during autonomous operation.
In this case the MG storage capacity is limited to 3.6 MJ, being capable of injecting 100 kW of maximum power. The storage capacity is very low compared to the system load. However, such consideration was assumed for simulation purposes and demonstration of the concept. The VSI droop parameters are the same as considered previously (see Table C.1).
5.3.2.1 Scenario I – MG Islanding with Reserve Capacity Shortage In this scenario the SOFC is disconnected from the MG and the SSMT are producing about 50 kW. The MG operating state before islanding (considering nominal voltage conditions) is summarized in Table 5.8. The MG operating conditions were determined based on the results of the MG full model, when operating in the interconnected mode. Before islanding, the MG was importing about 75 kW of active power considering the system losses and the influence of voltage deviations from the nominal value in the power absorbed by impedance loads (model adopted to represent the loads in the MG, as it was described in Chapter 4).
Table 5.8. MG scenario for Urban Network 2 – Scenario I initial operating conditions.
Type of Connection
Three-phase Single-phase Total
3~ A B C
Load (kW) 42 20 25 33 120
EV (kW) - 16 9 11 36
MS (kW) - 8 16 12 36
SSMT 75 30 - - - 30
SSMT 25 20 - - - 20
Figure 5.14 and Figure 5.15 represent the MG frequency and storage SOC obtained for the three cases if no load control is considered. At the beginning of the simulation, the MG is operating interconnected to the MV network. The unplanned islanding occurs at t=10s. Since the MG imported power is higher than the available generation reserve, the MG storage unit will have to compensate for the active power mismatch. A permanent frequency error results from the storage primary droop characteristic, namely 0.37 Hz in the Base Case, 0.24Hz in Case 1 and 0.28 Hz in Case 2. In cases 1 and 2 the EV will respond according to its frequency droop

Chapter 5 – MicroGrid Emergency Control Solutions: Simulation Results
198
reducing its charging power consumption proportionally to the frequency, consequently reducing the frequency excursion during the islanding transient and the permanent error. However, as in Figure 5.15 without considering load control the MG can collapse due to the discharging of the storage unit.
Figure 5.14. Scenario I – MG frequency without load control.
Figure 5.15. Scenario I – Storage SOC without load control.
In order to avoid MG collapse and compensate for the insufficient generation reserve the load and EV emergency scheduling algorithm defines a permanent load control solution. Based on the MG operating state, the algorithm determines the severity of the disturbance (i.e. corresponding to the imported power) and schedules a total load of 35 kW for disconnection.
Considering load availability in Table 5.7 in the Base Case and Case 1, 90% of the loads from Group I are dispatched to be curtailed in the event of an unplanned islanding. In Case 2 it was considered that the EV adopt a dumb charging strategy and have a battery SOC higher than 80%. Therefore, according to the load and EV emergency scheduling algorithm the EV will be disconnected first, representing an aggregated load of 18 kW. In order to meet the 35 kW of the necessary load disconnection, an additional curtailment of 17 kW of the loads from group I was considered.
0 10 20 30 40 50 60 70 80 90 10049
49.2
49.4
49.6
49.8
50
Time (s)
Freq
uenc
y (H
z)
Base Case - Without EV and DRCase 1 - 100% EV with f-P controlCase 2 - 50% EV with f-P control
0 10 20 30 40 50 60 70 80 90 1000
20
40
60
80
100
Time (s)
SOC
(%)
Base Case - Without EV and DRCase 1 - 100% EV with f-P controlCase 2 - 50% EV with f-P control

Chapter 5 – MicroGrid Emergency Control Solutions: Simulation Results
199
The initial load control solution is tested using the simplified model in order to evaluate if the permanent load shedding is sufficient to ensure MG security following islanding. The loads are disconnected when the MG frequency decreases below 49.7 Hz.
The MG frequency and storage active power response and SOC obtained with the simplified model are represented Figure 5.16 to Figure 5.18. The permanent load control solution is able to minimize the power provided by the storage unit and consequently correct the permanent frequency error resulting from the storage droop control. Comparing Case 1 and Case 2 similar results were obtained. The main differences occur due to the reduction of the number of EV participating in primary frequency control. However, the secondary frequency control stabilizes the MG frequency at 49.96 Hz, since the SSMT are operating at their maximum power. This small frequency deviation is caused by the response of the SSMT, which do not reach their nominal power due to internal losses represented in the model (friction factor of the compressor, turbine, shaft and electric generator, as described in section 4.7.1). Consequently the storage will continue to provide a small amount of power, approximately 2.5 kW. As it will be shown in Scenario III, the islanded operation algorithm could then correct this small deviation through an additional load disconnection.
Figure 5.16. Scenario I – MG frequency with load control.
Figure 5.17. Scenario I – Active power response of storage unit with load control
0 10 20 30 40 50 60 70 80 90 10049
49.2
49.4
49.6
49.8
50
Time (s)
Freq
uenc
y (H
z)
Base Case - With DRCase 1 - 100% EV with f-P control and DRCase 2 - 50% EV with f-P control and DR
0 20 40 60 80 1000
20
40
60
80
100
Time (s)
Act
ive
Pow
er (k
W)
Base Case - With DRCase 1 - 100% EV with f-P control and DRCase 2 - 50% EV with f-P control and DR

Chapter 5 – MicroGrid Emergency Control Solutions: Simulation Results
200
Figure 5.18. Scenario I – Storage SOC with load control.
The next step of the load and EV emergency scheduling algorithm analyses the results obtained through the simplified model, regarding the minimum frequency obtained and the storage SOC. In the three cases, storage SOC remains above the 50% limit. However, in the Base case the minimum frequency criterion of 49.5 Hz was not met. As it will be shown in Scenario II, a temporary load control solution can be defined by the algorithm in order to maintain frequency within the pre-specified limits.
In order to validate the simplified model, the permanent load control solution was also tested considering the MG full model. The simplified model estimates the frequency excursion during the islanding transient and the energy provided by the storage unit. Figure 5.19 and Figure 5.20 compares the results obtained for Case 1 using both models, regarding the MG frequency and active power output of the storage unit, respectively. As shown, the accuracy of the simplified model is acceptable considering its objectives while reducing significantly the computation burden when compared to the full model.
Figure 5.19. MG frequency after the islanding for Case 1 with the simplified and full MG model.
0 20 40 60 80 10075
80
85
90
95
100
105
110
Time (s)
SOC
(%)
Base Case - With DRCase 1 - 100% EV with f-P control and DRCase 2 - 50% EV with f-P control and DR
5 10 15 20 25 30 35 40 45 50 55 60
49.7
49.75
49.8
49.85
49.9
49.95
50
50.05
Time (s)
Freq
uenc
y (H
z)
Case 1 - complete modelCase 1 - simplified model

Chapter 5 – MicroGrid Emergency Control Solutions: Simulation Results
201
Figure 5.20. Storage unit active power for Case 1 with the simplified and full MG model.
5.3.2.2 Scenario II – MG with Sufficient Reserve Capacity to Supply the MG loads In this scenario the SOFC in Node 71 is assumed to be connected to the MG, thus increasing the available generation reserve capacity. The initial power output of the SSMT and SOFC was low, totalizing 35 kW. Therefore, the MG was importing 85 kW to supply a total load of 120 kW. The initial storage unit SOC was assumed to be 80%.
Considering the operating conditions of each case, the load and EV emergency scheduling algorithm will evaluate if load control is required in order to ensure a successful islanding. If an unplanned islanding occurs, the MG has sufficient reserve capacity to supply the loads. Therefore, there is no need for defining a permanent load control. Then, the simplified MG model will verify the security conditions, namely the minimum frequency (a limit of 49.5 Hz was considered) and the MG storage capacity (should be higher than 50%).
Figure 5.21 and Figure 5.22 represent the MG frequency and the storage SOC obtained by the MG simplified model for each case. In the Base case, where the MG only depends on its storage unit and controllable MS to provide frequency regulation, a 0.9 Hz frequency deviation will be experienced, causing more than 35% drop on the storage unit SOC. As the number of EV participating in primary frequency control increases the frequency transient decreases, as in Case 1 and Case 2. In Case 1 frequency is close to the limit at approximately 49.47 Hz, whereas in Case 2 a minimum frequency of 49.38 Hz was obtained. The participation of EV also avoids surpassing the minimum admissible SOC of 50%. In Case 1 and 2 storage SOC remains above the 50% imposed limit.
For all the three cases, the algorithm will estimate a temporary load curtailment in order to maintain the frequency and SOC within the imposed limits. The following solutions were defined for the two cases:
• Base Case – the algorithm defined a temporary load shedding of 40 kW of the loads from group I, considering the minimum frequency limitation of 49.5 Hz.
• Case 1 – the algorithm defined a 5 kW of load from group I to be temporarily disconnected.
10 20 30 40 50 60-20
0
20
40
60
80
Time (s)
Act
ive
Pow
er (k
W)
Case 1 - complete modelCase 1 - simplified model

Chapter 5 – MicroGrid Emergency Control Solutions: Simulation Results
202
• Case 2 – the algorithm defined a 25 kW of load from group I to be temporarily disconnected.
Figure 5.21. Scenario II – MG frequency for Base case and cases 1 and 2.
Figure 5.22. Scenario II – Storage SOC for Base case and cases 1 and 2.
The loads were disconnected when the frequency reaches 49.7 Hz, reducing the energy required from the storage unit to ensure power balance during the frequency restoration phase (secondary control). The loads were reconnected in steps when the frequency reached 49.9 Hz, as it was previously discussed. The MG frequency for the simulation cases considering the temporary load control solution is represented in Figure 5.23. The approximate solution found by the load and EV emergency scheduling algorithm was able to reduce frequency deviation and maintain the minimum frequency close to the defined limit. The storage SOC is also maintained above the 50% imposed limit, as represented in Figure 5.24. It is important to notice that the load control strategy has a strong impact in MG frequency response, in the initial moments subsequent to the transient. Afterwards, the MG frequency response will depend on the controllable MS dynamics (in particular, the response of SOFC which is typically slower than SSMT).
0 20 40 60 80 10049
49.2
49.4
49.6
49.8
50
Time (s)
Freq
uenc
y (H
z)
Base Case - Without EV and DRCase 1 - 100% EV with f-P controlCase 2 - 50% EV with f-P control
0 10 20 30 40 50 60 70 80 90 10040
50
60
70
80
90
Time (s)
SOC
(%)
Base Case - Without EV and DRCase 1 - 100% EV with f-P controlCase 2 - 50% EV with f-P control

Chapter 5 – MicroGrid Emergency Control Solutions: Simulation Results
203
Figure 5.23. Scenario II – MG frequency considering load control.
Figure 5.24. Scenario II – Storage SOC considering load control.
5.3.2.3 Scenario III – Managing MG Energy Balance Following Islanding During islanded operation the MG may suffer additional disturbances which may compromise the stability of the system, eventually leading to the MG collapse. Due to the high number of distinct disturbances which might occur, a different algorithm was developed to manage the MG energy balance following islanding transient – the MG islanded operation algorithm represented in Figure 3.20.
Simulation Scenario II was considered to demonstrate through simulation the effectiveness of the algorithm that was adopted. In this case, a large disturbance caused by the variability of non-controllable MS was considered. As represented in Figure 5.25, at t=120s the MG loses 25 kW of the non-controllable MS power generation and then at t=160s there is an increase of 50 kW of non-controllable MS power generation, totalizing about 60 kW of active power.
0 20 40 60 80 10049.4
49.5
49.6
49.7
49.8
49.9
50
Time (s)
Freq
uenc
y (H
z)
Base Case - With DRCase 1 - 100% EV with f-P control and DRCase 2 - 50% EV with f-P control and DR
0 20 40 60 80 10040
50
60
70
80
90
Time (s)
SOC
(%)
Base Case - With DRCase 1 - 100% EV with f-P control and DRCase 2 - 50% EV with f-P control and DR

Chapter 5 – MicroGrid Emergency Control Solutions: Simulation Results
204
After the islanding transient the controllable MS, namely the SSMT and SOFC are operating at its maximum power. Therefore, in order to avoid discharging MG storage below the considered limit it is necessary to disconnect loads. The algorithm defines a load curtailment equal to the power injected by the storage unit: 25 kW.
Figure 5.25. Scenario III – Non-controllable MS disturbance during islanded operation.
The response of the controllable loads and MS are represented in Figure 5.26 (loads disconnection and reconnection) and Figure 5.27, respectively. At t=126s, the algorithm sends a disconnection signal to 25 kW of controllable loads from Group I. When the MS power increases at t=160s, the MG has sufficient down reserve to ensure balance. The algorithm waits for the secondary control to take action and then sends the reconnection signal to the loads that were disconnected initially, at t=220s.
The MG frequency during islanded operation is represented in Figure 5.28 for the three cases that were considered. When the non-controllable MS power suddenly decreases, the MG suffers a frequency drop. The frequency deviation remains constant until load is disconnected, since the controllable MS are operating at their maximum power. Similarly to the conclusions drawn from previous results, the frequency deviation is smaller for Cases 1 and 2 which consider the participation of EV in primary frequency control. When the MS power increase at t=160s the MG suffers a frequency increase, which is corrected by the secondary frequency control which dispatches the controllable MS in order to reduce their power output. Since there is sufficient reserve capacity, at t=220 the MG islanded algorithm allows the gradual reconnection of loads in order to avoid larger frequency excursions.
Figure 5.29 presents the storage SOC during islanded operation. The coordination of load control with secondary frequency control avoids the discharging of the battery below 50%. If only primary and secondary frequency control was considered (EV are also not considered), the storage’ SOC decreases below 30%. These results demonstrate the importance of integrating flexible resources such as EV and flexible loads as additional resources for MG frequency regulation and power management.
100 150 200 250 300
10
20
30
40
50
60
70
80
Time (s)
Act
ive
pow
er (k
W)
Non-Controllable MS

Chapter 5 – MicroGrid Emergency Control Solutions: Simulation Results
205
Figure 5.26. Scenario III – Controllable loads response during islanded operation.
Figure 5.27. Scenario III – Controllable generation response to secondary frequency control.
Figure 5.28. Scenario III – MG frequency considering load control during islanded operation.
100 120 140 160 180 200 220 240 260 280 3000
5
10
15
20
25
30
Time (s)
Act
ive
pow
er (k
W)
Responsive loads
100 120 140 160 180 200 220 240 260 280 3000
10
20
30
40
50
60
70
Time (s)
Act
ive
pow
er (k
W)
SSMT 75SSMT 25SOFC 71
100 150 200 250 300
49.4
49.6
49.8
50
50.2
50.4
Time (s)
Freq
uenc
y (H
z)
Base Case - With DRCase 1 - 100% EV with f-P control and DRCase 2 - 50% EV with f-P control and DR

Chapter 5 – MicroGrid Emergency Control Solutions: Simulation Results
206
Figure 5.29. Scenario III – Storage SOC considering load control during islanded operation.
5.4 MicroGrid Service Restoration Procedure with Electric Vehicles Similarly to the results obtained in previous section, the active integration of EV in the MG service restoration is also expected to improve the stability and resilience of the system. However, during the MG service restoration the EV will not be able to charge its batteries until the system is stabilized, allowing the MG to take full advantage of the EV storage capacity until loads and MS are connected to the system.
The MG restoration procedure integrating EV presented in Chapter 3 was evaluated through numerical simulation, focusing mainly in evaluating the effectiveness of EV grid supporting strategy. Urban Network 2 was also adopted considering the operating conditions described in Table 5.4. The SOFC was not considered in this case. Therefore, the MG has a total of 90 kW of controllable power generation capacity and an additional 36 kW of non-controllable MS to supply a total of 120 kW including EV. Due to insufficient generation reserve only 85 kW of loads will be reconnected in addition to the EV.
As discussed in Chapter 3, in order to perform the restoration procedure the MG should be operated with a MMO strategy. Therefore, it was considered that the SSMT connected to nodes 25 and 75 are equipped with a storage unit coupled to the DC side of their grid-side inverter which is set to operate as a VSI. Similarly to the storage unit connected to the LV bus of the MV/LV substations these units are controlled through P-f and Q-V droops. However, the droops are parameterized to supply a local load connected to the same node has the VSI (see Figure 5.3).
In order to evaluate the effectiveness of the EV participation in the MG frequency regulation, two cases were considered:
• Base Case – the EV are not controlled through f-P droop. • Case 1 – the EV are controlled through f-P droop, being synchronized to the MG with a
zero power set-point.
100 150 200 250 300
0
20
40
60
80
100
Time (s)
SOC
(%)
Base Case - Without DRBase Case - With DRCase 1 - 100% EV with f-P control and DRCase 2 - 50% EV with f-P control and DR

Chapter 5 – MicroGrid Emergency Control Solutions: Simulation Results
207
Regarding the simulation of the MG restoration procedure, it was assumed that when the simulation starts the MG is already disconnected from the main grid and it is energized by the VSI connected to the MG main storage unit. At this phase, all MG loads, EV and MS are still disconnected. The complete restoration procedure is described below:
1. Synchronization of the SSMT to the MG: (a) t=3s – MGCC enables the synchronization of SSMT25. (b) t=7s – MGCC enables the synchronization of SSMT75.
2. Connection of EV with zero charging power (t=16s). 3. Reconnection of loads and MS:
(c) t=20s – Reconnection of the first load group (total load of 24.4 kW - loads connected to nodes 15, 29, 73, 74, 75).
(d) t=45s – Reconnection of non-controllable MS (Total of 36 kW: 69, 71, 73 and 75).
(e) t=65s – Reconnection of the second loads group (Total load of 60.3 kW: 27, 69, 71).
(f) Increase of EV charging power, by changing the reference charging power of EV droop parameters:
- t=85s – EV reference power is increased from 0 to 20% of its nominal charging power.
- t=95s – EV reference power is increased to 40% of its nominal charging power.
- t=105s – EV reference power is increased to 60% of its nominal charging power.
4. Synchronization and reconnection to the MV grid.
The time instances of the restoration events where chosen based on a continuous evaluation of the MG frequency response to the restoration events and taking into account the reaction time of the primary and secondary frequency control. The rational for the choice of the time instances is directly related to the need of avoiding large frequency disturbances, therefore requiring system stabilization after each step of the restoration procedure.
5.4.1 Synchronization of the Single-shaft Microturbine to the MicroGrid Before synchronizing to the LV grid, it is assumed that SSMT successfully restart and are feeding the local loads (approximately a 6 kW load in Node 75 and an 8 kW load in Node 25). Then, after reenergizing the MG, the MGCC initiates the synchronization of the SSMT installed at nodes 25 and 75. Figure 5.30 a) shows the MG and SSMT frequency during the synchronization procedure. At t=3s the local synchronization algorithm introduces a small frequency change in the SSMT inverter in order to facilitate the synchronization process. The synchronization conditions are verified at t=4s and the SSMT in Node 25 successfully connects to the MG. At t=7s the MGCC enables the synchronization of the SSMT in Node 75 which reconnects successfully to the MG at t=7.7s.
The active power response of the MG storage unit and SSMT during the synchronization procedure is shown in Figure 5.30 b). After the reconnection transient, the MG storage unit coupled to a VSI and the SSMT share the MG load. Since the MG frequency deviation is smaller

Chapter 5 – MicroGrid Emergency Control Solutions: Simulation Results
208
than the minimum frequency deviation which triggers the secondary control (a 0.05 Hz dead-band was considered in the simulations), no power adjustment was defined by the MGCC.
a)
b)
Figure 5.30. Synchronization of the SSMTs with the MG: a) MG and SSMT frequency b) main storage unit and SSMT active power.
5.4.1.1 MG Rebuilding Considering the EV Participation in Frequency Regulation Figure 5.31 compares the MG frequency response during the service restoration time for both cases. The active participation of EV in the frequency regulation reduces the frequency deviation caused by the reconnection of loads (t=20s and t=65s) and non-controllable MS (t=45s). When the frequency stabilizes (t=75s) and since the MG had enough reserve capacity, the EV charging power is increased gradually, in order to allow EV to charge their batteries. Similarly to the conclusions drawn for islanding operation, as shown in Figure 5.32 the participation of EV in primary frequency control improves frequency stability by reducing the frequency excursions and the active power required from the MG main storage unit. The storage unit will compensate the unbalance between generation and load until the secondary frequency control stabilizes the MG frequency at its reference value.
2 4 6 8 10 12 1449.9
49.92
49.94
49.96
49.98
50
50.02
Time (s)
Freq
uenc
y (H
z)
MG FrequencySSMT 25 FrequencySSMT 75 Frequency
2 4 6 8 10 12 14
-5
0
5
10
Time (s)
Act
ive
Pow
er (k
W)
Main Storage UnitSSMT 25SSMT 75

Chapter 5 – MicroGrid Emergency Control Solutions: Simulation Results
209
Figure 5.31. MG frequency response during system rebuilding.
Figure 5.32. Active power injected by the MG main storage unit.
As represented in Figure 5.33, the EV inject power during the reconnection of loads and increase their power consumption during the reconnection of the micro-WT and PV panels. According to the EV f-P droop characteristic, the participation of EV in frequency regulation becomes more significant for large frequency disturbances.
The centralized secondary frequency control algorithm discussed in Chapter 3 was adopted. Based on the power injected by the storage unit and in the controllable generation reserve, the algorithm determines the new active power set-points for compensating power unbalance. In this case, the SSMT grid-coupling inverters are controlled as VSI, the active power set-points have to be determined considering the VSI droop characteristics, by determining a new idle angular frequency. Figure 5.34 shows the active power response of the SSMT regarding the frequency set-points, resulting from the centralized secondary load frequency control. The DC coupled storage provides immediate power response to the MGCC frequency control signals, compensating the SSMT slower power response.
20 30 40 50 60 70 80 90 100 110 12049.6
49.8
50
50.2
50.4
Time (s)
Freq
uenc
y (H
z)
Base Case - Without EV f-P droopCase 1 - With EV f-P droop
20 30 40 50 60 70 80 90 100 110 120
-20
0
20
40
60
Time (s)
Act
ive
Pow
er (k
W)
Base Case - Without EV f-P droopCase 1 - With EV f-P droop

Chapter 5 – MicroGrid Emergency Control Solutions: Simulation Results
210
Figure 5.33. EV individual and total power output during MG rebuilding.
Figure 5.34. SSMT active power response to the centralized secondary frequency control.
The MG restoration procedure has focused mainly in maintaining power balance between the available generation reserve and the amount of loads and MS reconnected. Since the majority of loads and MS are single-phase, the MG will operate under unbalance conditions. Consequently, as represented in Figure 5.35 without considering the voltage balancing mechanisms, voltage in Node 5 (i.e. the LV bus of the MV/LV substation) will be unbalanced. Before starting the reconnection of loads and MS, the VSI maintains MG voltage at 1.05 of the nominal voltage. However, as the single-phase MS and loads were reconnected, the three-phase three-leg inverter reference voltage becomes unbalanced.
20 40 60 80 100 120-40
-30
-20
-10
0
10
20
Time (s)
Act
ive
Pow
er (k
W)
EV 25AEV 25BEV 25CEV 29BEV 29CEV 74AEV 75ATotal Power
20 30 40 50 60 70 80 90 100 110 120-30
0
30
60
90
Act
ive
Pow
er (k
W)
20 40 60 80 100 12049.5
50.5
51.5
52.5
53.5
Time (s)
Freq
uenc
y (H
z)
fref
- SSMT 75 fref
- SSMT 25
P - SSMT 75 P- SSMT 25

Chapter 5 – MicroGrid Emergency Control Solutions: Simulation Results
211
The nodes with the highest voltage unbalance corresponds to the nodes connected in the end of feeders 3 and 4, namely nodes 71, 73 and 69. The node with highest unbalance corresponds to Node 73 were the VUFneg reaches 5.3% and the VUF0 14.3%. The phase voltages verified during MG rebuilding phase in Node 73 are represented in Figure 5.36 and VUFneg and VUF0 are represented in Figure 5.37. The high unbalance in Node 73 occurs since the MS are connected in phase B while loads are connected to phase A, consequently leading to high voltages in phase B when compared to phases A and C. This example demonstrates the importance of monitoring the MG system during the rebuilding phase in order to avoid further disturbances due to inadequate node voltages. As discussed next, the adoption of voltage balancing mechanism or specific voltage magnitude control mechanisms could help maintain voltage within adequate limits.
Figure 5.35. Phase voltages in Node 5 during restoration procedure.
Figure 5.36. Phase voltages in Node 73 during restoration procedure.
20 30 40 50 60 70 80 90 100 110 120215
220
225
230
235
240
245
Time (s)
Vol
tage
(V)
VAVBVC
20 30 40 50 60 70 80 90 100 110 120180
200
220
240
260
280
Time (s)
Vol
tage
(V)
VAVBVC

Chapter 5 – MicroGrid Emergency Control Solutions: Simulation Results
212
Figure 5.37. Voltage unbalance factors in Node 73 during restoration procedure.
5.5 Analysing MicroGrid Voltage Unbalance Problem This subsection focus on demonstrating the effectiveness of the MG voltage balancing mechanisms discussed in Chapter 3 and Chapter 4. The methodology proposed in Chapter 3 was tested by running several simulation studies in order to find the best location to perform voltage balancing, which results in a compromise between the node which minimizes voltage unbalance in the MG feeders and if possible avoids installing additional equipment.
For the purpose of this study the Rural Network described in 5.2.2 was adopted. In order to derive the potential impact of large scale integration of single-phase MS and EV, three different simulation cases were developed, namely:
• Scenario I – The MG was operating at peak load with high penetration of microgeneration and EV charging, as in Table 5.9.
• Scenario II – The MG was operating in off-peak load with high penetration of microgeneration and EV, as in Table 5.10.
• Scenario III – The MG was operating in off-peak load with high penetration of microgeneration. In this scenario the load from EV charging was not considered. A summary of Scenario III is described in Table 5.11.
The first two scenarios were analysed in order to find the best location for the VSI with the voltage balancing mechanism. Then the best solutions found were tested for scenario III, where severe unbalance conditions were considered.
The results analysis is divided in three sections. Section 5.5.1 presents the initial characterization of the MG voltage unbalance and the effect of adopting the voltage balancing mechanism at the MV/LV substation. Then in section 5.5.2 the advantage of adopting a MMO strategy by considering the deployment of a second VSI is considered. Finally in section 5.5.3 the most effective strategies are tested for the severely unbalanced scenario.
10 25 40 55 70 85 100 1150
5
10
15
VU
F neg (%
)
Time (s)
0
5
10
15
VU
F 0 (%)
VUFneg
VUF0

Chapter 5 – MicroGrid Emergency Control Solutions: Simulation Results
213
Table 5.9. Rural MG - Scenario I.
Three-phase Single-phase Total Deferrable
Loads
3~ A B C
Load (kW) 87.9 46.8 41.3 26.3 202.3 160.4
MS (kW) 23.0 13.7 54.0 28.0 118.7 -
EV (kW) 0.0 18.0 6.8 22.5 47.3 -
Table 5.10. Rural MG - Scenario II.
Three-phase Single-phase Total 3~ A B C
Load (kW) 17.6 8.6 8.3 5.3 39.8
MS (kW) 12.5 13.7 50.0 28.0 104.2
EV (kW) 0.00 22.5 15.8 18.0 56.3
Table 5.11. Rural MG – Scenario III.
Three-phase Single-phase Total
3~ A B C
Load (kW) 17.6 9.4 8.3 5.3 40.6
MS (kW) 12.5 18.9 51.3 12.5 95.2
EV (kW) - - - - -
5.5.1 Voltage Balancing in Single-Master Operation Mode The first step of the methodology proposed in Chapter 3 consists in characterizing the MG voltage unbalance without considering voltage balancing mechanisms, in order to identify the problematic nodes with voltage unbalance outside admissible limits. Then, if necessary, the VSI which is installed at the LV bus of the MV/LV substation is replaced by the three-phase four-leg inverter with the additional voltage balancing mechanism described in Chapter 4. Voltage unbalance will be quantified by the instantaneous negative and zero sequence Voltage Unbalance Factor (VUF) as in (2.4). In the simulation studies that were performed the EV was considered to participate in the MG primary frequency regulation.
Scenario I and II were simulated considering two hypotheses: • Base case – The main storage unit is connected to the MG through a three-leg inverter
with frequency and voltage droops (no voltage balancing mechanisms are considered); • Case 1 – The VSI is a four-leg inverter controlled with frequency and voltage droops
and with the balancing mechanism described in Chapter 4.

Chapter 5 – MicroGrid Emergency Control Solutions: Simulation Results
214
5.5.1.1 Voltage Unbalance Analysis for Scenario I In Scenario I the rural MG was importing 130 kW from the MV network prior to islanding, which occurs at 10s of the simulation time. Since the MG only has about 67 kW of generation reserve capacity, 63 kW of load has to be disconnected in order to ensure power balance. Therefore, the loads in nodes 11, 66, 42, 22 and 45 were disconnected, totalizing 66 kW of active power shedding. The SSMT will increase its power according to a local secondary frequency control as discussed in Chapter 3.
The MG voltage unbalance is caused by the uneven connection of single-phase loads, EV and MS to the three phases of the system. As discussed in previous chapters, the typically high R/X factor of the LV cables leads to a situation where the MG voltage magnitudes are mainly influenced by the active power flow. Table 5.12 compares the active power unbalance, resulting from the difference between the generation and load for each of the three-phases of each node. This unbalance will differ from the interconnected to the islanded operation, due to load shedding and secondary frequency control changing the SSMT active power injection. As shown, in both operating modes the unbalance between phases is considerable.
Table 5.12. MG rural scenario I - Power unbalance between phases prior and after islanding.
Interconnected Islanded
Node A B C A B C
P (kW) P (kW) P (kW) P (kW) P (kW) P (kW)
89 9.11 12.33 -2.15 9.11 12.33 -2.15
84 8.01 2.19 4.28 8.01 2.19 4.28 11 15.82 9.96 15.63 3.49 -2.38 3.30
55 2.55 -6.76 -5.45 2.55 -6.76 -5.45
71 -2.89 -2.89 3.01 7.11 -12.89 -6.99 66 2.86 1.82 1.82 -10.29 -11.33 -11.33 15 0.00 0.00 1.10 0.00 0.00 1.10
42 -1.06 2.14 3.66 -3.20 0.00 1.52
51 2.90 -3.90 6.33 2.90 -3.90 6.33
36 11.54 2.37 -5.13 11.54 2.37 -5.13
25 10.42 0.52 3.37 0.42 -9.48 -6.63
22 2.22 -0.68 8.13 0.00 -2.90 5.91
45 2.08 1.35 2.08 0.00 -0.73 0.00
Figure 5.38 and Figure 5.39 compare the negative and zero sequence VUF (i.e. VUFneg and VUF0) obtained for the Base case and Case 1, respectively. The VUFneg and VUF0 were determined at steady state conditions. For islanded operation the VUF values were determined after MG voltage and frequency is stabilized close to the nominal value.
With exception of nodes 1, 84 and 89 the VUFneg obtained for the other MG nodes surpasses the 2% limit imposed by EN50160 standard [92]. These values are a consequence of the high active power unbalance between the three phases of the system. The most severe case that was detected occurs in Node 36 where the VUFneg reaches 3.8% when the VSI voltage balancing mechanisms are not used (Base case).

Chapter 5 – MicroGrid Emergency Control Solutions: Simulation Results
215
The uneven connection of single-phase loads, EV and MS to the three phases of the system also generate neutral currents, and consequently zero-sequence voltages. As shown in Figure 5.39, the VUF0 reaches 4% in nodes 84 and 89, 10% in Node 36 and approximately 6% in the other nodes.
Figure 5.38. Scenario I - Negative sequence VUF in the MG nodes without (Base case) and with (Case
1) the voltage balancing mechanism.
Figure 5.39. Scenario I - Zero sequence VUF in the MG nodes without (Base case) and with (Case 1) the
voltage balancing mechanisms.
Comparing the results obtained for Base case and Case 1 it is also clear that the voltage balancing mechanism only produces a significant balancing effect in Node 1, for both MG interconnected and islanded operating conditions. Figure 5.40 compares the instantaneous values of negative and zero sequence VUF obtained for Node 1 considering the Base case and Case 1. The VSI voltage balancing mechanism is able to eliminate both the zero and negative sequence voltage components in Node 1. As a result, the voltage produced by the VSI in Case 1 is balanced as shown in Figure 5.41 b), while in the Base case the magnitude of the single-phase voltages have a small difference (Figure 5.41 a) ).
1 89 84 11 55 71 66 15 42 51 36 25 22 450
1
2
3
4
Nodes
VU
F neg (%
)
Interconnected - DroopInterconnected - Droop & PRIslanded - DroopIslanded - Droop & PR
1 89 84 11 55 71 66 15 42 51 36 25 22 450
2
4
6
8
10
12
Nodes
VU
F 0 (%)
Interconnected - DroopInterconnected - Droop & PRIslanded - DroopIslanded - Droop & PR

Chapter 5 – MicroGrid Emergency Control Solutions: Simulation Results
216
a)
b)
Figure 5.40. Scenario I - Negative and zero sequence VUF in Node 1: a) without voltage balancing mechanism and b) with voltage balancing mechanism.
a)
10 20 30 40 50 60 700
0.2
0.4
0.6
0.8
1
1.2
VU
F neg (%
)
Time (s)
0
0.2
0.4
0.6
0.8
1
1.2
VU
F 0 (%)
VUF
neg
VUF0
10 20 30 40 50 60 700
0.1
0.2
0.3
0.4
0.5
0.6
VU
F neg (%
)
Time (s)
0
0.1
0.2
0.3
0.4
0.5
VU
F 0 (%)
VUF
neg
VUF0
10 20 30 40 50 60 70215
220
225
230
235
Time (s)
Vol
tage
(V)
V
aV
bV
c

Chapter 5 – MicroGrid Emergency Control Solutions: Simulation Results
217
b)
Figure 5.41. Scenario I - Time evolution of single-phase RMS voltages in Node 1: a) without voltage balancing mechanism and b) with voltage balancing mechanism.
Figure 5.42 and Figure 5.43 present the single-phase voltages per node both for interconnected and islanding operating conditions, respectively. With exception of Node 1, in the moments subsequent to MG islanding, node voltages increase in the network due to load shedding and the increase of the SSMT power output. As expected, Node 36 presents the highest difference between the phase voltages (higher than 40 V). This difference occurs since in Node 36 the load of phase A is much higher than in phases B and C. As observed by the analysis of the voltage unbalance factors it is also clear that performing voltage balancing in Node 1 does not produce any significant change in Node 36 voltages.
Figure 5.42. Scenario I – Single-phase RMS voltages in the MG nodes during interconnected operation without (Base case) and with (Case 1) the voltage balancing mechanisms.
10 20 30 40 50 60 70215
220
225
230
235
Time (s)
Vol
tage
(V)
V
aV
bV
c
1 89 84 11 55 71 66 15 42 51 36 25 22 45170
180
190
200
210
220
230
240
Nodes
L-N
Vol
tage
(V)
Va - DroopVb - DroopVc - DroopVa - Droop & PRVb - Droop & PRVc - Droop & PR

Chapter 5 – MicroGrid Emergency Control Solutions: Simulation Results
218
Figure 5.43. Scenario I – Single-phase RMS voltages in the MG nodes during islanded operation without (Base case) and with (Case 1) the voltage balancing mechanisms.
5.5.1.2 Voltage Unbalance Analysis for Scenario II In Scenario II there is almost a match between local MG load and generation (the MG was importing 1 kW of active power from the MV network before islanding). In this case no load shedding is required, since the MG has sufficient generation reserve to compensate load following islanding. Table 5.13 summarizes the difference between generation and load for each phase and node of the MG system. The unbalance in each node is the same before and after islanding with exception of the nodes where the SSMT are connected (nodes 25, 66 and 71).
Table 5.13. MG rural scenario II - Power unbalance between phases prior and after islanding.
Interconnected Islanded
Node A B C A B C
P (kW) P (kW) P (kW) P (kW) P (kW) P (kW)
89 6.28 6.66 -10.43 6.28 6.66 -10.43
84 2.38 -5.56 0.86 2.38 -5.56 0.86 11 12.22 -3.73 3.13 12.22 -3.73 3.13
55 0.51 -11.75 -7.49 0.51 -11.75 -7.49
71 -1.08 -1.08 6.80 -3.08 -3.08 4.80 66 -8.89 -0.70 -0.70 -10.89 -2.70 -2.70 15 1.50 0.00 1.72 1.50 0.00 1.72
42 -2.77 0.43 2.45 -2.77 0.43 2.45
51 0.58 -6.22 5.15 0.58 -6.22 5.15
36 2.31 0.47 -7.03 2.31 0.47 -7.03
25 2.89 -2.95 1.56 0.89 -4.95 -0.44
22 0.44 -5.10 0.44 0.44 -5.10 0.44
45 0.42 0.34 0.42 0.42 0.34 0.42
1 89 84 11 55 71 66 15 42 51 36 25 22 45170
180
190
200
210
220
230
240
Nodes
L-N
Vol
tage
(V)
Va - DroopVb - DroopVc - DroopVa - Droop & PRVb - Droop & PRVc - Droop & PR

Chapter 5 – MicroGrid Emergency Control Solutions: Simulation Results
219
Figure 5.44 and Figure 5.45 compare the VUFneg and VUF0 obtained for the Base case (without voltage balancing mechanisms) and Case 1 (VSI of Node 1 incorporating the voltage balancing mechanisms) for both interconnected and islanded operation. Compared to Scenario I, the VUFneg obtained for Scenario II was smaller due to the reduction of load, which consequently contributes for the reduction of the power unbalance between the three phases of the system. In scenario II the highest VUFneg is obtained for the Base case during islanded operation in Node 36, presenting the highest VUFneg with 2.63%, followed by nodes 22, 11 15 42 and 51 with approximately 2%. However, VUF0 increases to values higher than 10% in both cases, reaching a maximum of 15% in Node 36.
Figure 5.44. Scenario II - Negative sequence VUF in the MG nodes with and without the voltage balancing mechanism.
Figure 5.45. Scenario II - Zero sequence VUF in the MG nodes with and without the voltage balancing mechanism.
1 89 84 11 55 71 66 15 42 51 36 25 22 450
0.5
1
1.5
2
2.5
3
3.5
Nodes
VU
F neg (%
)
Interconnected - DroopInterconnected - Droop & PRIslanded - DroopIslanded - Droop & PR
1 89 84 11 55 71 66 15 42 51 36 25 22 450
5
10
15
20
25
Nodes
VU
F 0 (%)
Interconnected - DroopInterconnected - Droop & PRIslanded - DroopIslanded - Droop & PR

Chapter 5 – MicroGrid Emergency Control Solutions: Simulation Results
220
Similarly to the conclusions drawn from Scenario I, the voltage balancing mechanism in Node 1 successfully eliminates voltage unbalance in Node 1. As shown in Figure 5.46 the voltage balancing mechanism reduces VUFneg from 0.32% and 0.56% measured in interconnected and islanded mode respectively to 0.009% in both operating modes. VUF0 is also reduced from 0.56% and 0.96% to 0.025% in both operating modes. However, as shown in Figure 5.44 and Figure 5.45 as the electric distance to Node 1 increases the compensating effect fades out. In Case 1, VUFneg increases 1.5% from Node 1 to Node 89, while VUF0 increases 12% between the same nodes.
a)
b)
Figure 5.46. Scenario II - Negative and zero sequence VUF in Node 1: a) without voltage balancing mechanism and b) with voltage balancing mechanism.
Figure 5.47 and Figure 5.48 compare the steady state voltages for interconnected and islanded operating modes, respectively. With exception of Node 1, voltages in phase B surpass the 10% voltage limit (242 V for the 380 V nominal voltage) established in EN50160 [92]. On the other hand, voltages in phase A of node 36 are below the -10% voltage limit (198 V). As shown in more detail in Figure 5.49 a), a 65V difference is observed between phases A and B of node 36. In the Base case and during MG islanding operation phase A voltage in node 36 was 191 V increasing to 192 V in Case 1.
10 20 30 40 50 60 700
0.2
0.4
0.6
0.8
1
VU
F neg (%
)
Time (s)
0
0.2
0.4
0.6
0.8
1
VU
F 0 (%)
VUFneg
VUF0
10 20 30 40 50 60 700
0.1
0.2
0.3
0.4
VU
F neg (%
)
Time (s)
0
0.1
0.2
0.3
0.4V
UF 0 (%
)
VUF
neg
VUF0

Chapter 5 – MicroGrid Emergency Control Solutions: Simulation Results
221
Figure 5.47. Scenario II – Single-phase RMS voltages in the MG nodes during interconnected operation without (Base case) and with (Case 1) the voltage balancing mechanisms.
Figure 5.48. Scenario II – Single-phase RMS voltages in the MG nodes during islanded operation without (Base case) and with (Case 1) the voltage balancing mechanisms.
From the results obtained from Scenario I and II it is possible to conclude that the additional voltage balancing mechanisms are able to effectively eliminate the voltage unbalance only at the VSI terminals, for both interconnected and islanded modes. The adoption of such strategies will ensure a secure re-synchronization with the utility grid (which requires an adequate voltage leveraging between both active systems). However, the balancing effect on the nodes connected downstream highly depends of the electric distance to the unbalance load or source.
1 89 84 11 55 71 66 15 42 51 36 25 22 45180
190
200
210
220
230
240
250
260
270
Nodes
L-N
Vol
tage
(V)
Va - DroopVb - DroopVc - DroopVa - Droop & PRVb - Droop & PRVc - Droop & PR
1 89 84 11 55 71 66 15 42 51 36 25 22 45180
190
200
210
220
230
240
250
260
270
Nodes
L-N
Vol
tage
(V)
Va - DroopVb - DroopVc - DroopVa - Droop & PRVb - Droop & PRVc - Droop & PR

Chapter 5 – MicroGrid Emergency Control Solutions: Simulation Results
222
a)
b)
Figure 5.49. Scenario II - Time evolution of the single-phase RMS voltages at Node 36: a) without voltage balancing mechanisms and b) with voltage balancing mechanisms.
5.5.2 Voltage Balancing in Multi-Master Operation Mode In order to effectively improve power quality and maintain voltage unbalance within limits in all the MG nodes, a MMO strategy was considered by adding a new VSI to the MG. Scenario II was chosen as the MG operating scenario. The eight simulation cases described in Table 5.14 were developed in order to demonstrate that the siting of the second VSI unit has important effects regarding the objective of reducing the voltage unbalance downstream the MG feeder. In cases 2 to 5, Node 66 was selected to install the second VSI unit (thus replacing the PQ inverter coupling the SSMT to the network). Node 66 is located approximately in the middle of the LV feeder and has a three-phase generation source, which is now assumed to operate as a VSI and can incorporate the voltage balancing mechanisms when necessary. From these cases it will be possible to study the contribution of a new VSI for voltage balancing with and without the additional voltage balancing controllers. In cases 6 to 8 Node 36 was selected as the
10 20 30 40 50 60 70180
200
220
240
260
Time (s)
Vol
tage
(V)
Va Vb Vc
10 20 30 40 50 60 70180
200
220
240
260
Time (s)
Vol
tage
(V)
Va Vb Vc

Chapter 5 – MicroGrid Emergency Control Solutions: Simulation Results
223
location for installing the second VSI unit, in order to study the effect of performing voltage balancing in a remote node, which in this case presents the highest VUF.
Table 5.14. Simulation cases considering a SMO and a MMO strategy.
Case MG Operating Mode VSI location Voltage Balancing
Base Single Master (SMO) Node 1 -
Case 1 Single Master (SMO) Node 1 Node 1
Case 2 Multi-master (MMO) Node 1 and Node 66 -
Case 3 Multi-master (MMO) Node 1 and Node 66 Node 1
Case 4 Multi-master (MMO) Node 1 and Node 66 Node 66
Case 5 Multi-master (MMO) Node 1 and Node 66 Node 1 and Node 66
Case 6 Multi-master (MMO) Node 1 and Node 36 Node 1
Case 7 Multi-master (MMO) Node 1 and Node36 Node 36
Case 8 Multi-master (MMO) Node 1 and Node 36 Node 1 and Node 36
5.5.2.1 Voltage Balancing in Node 66 The VUFneg and VUF0 obtained for cases 2 to 5 are represented in Figure 5.50 and Figure 5.51, respectively. The resulting impact on the MG phase voltages is shown in Figure 5.52 to Figure 5.54.
The results obtained in Case 2 demonstrate that adopting a MMO helps reducing the voltage unbalance in the LV network. Since no voltage balancing mechanism was considered, it was not possible to cancel the negative and zero sequence components in Node 1. However, compared to Case 1 the installation of an additional VSI considered in Case 2 has important benefits regarding the ability to contribute for reducing negative and zero sequence voltage components in the other nodes of the LV feeder. With exception of Node 36, the VUFneg obtained in the MG nodes connected downstream of Node 11 suffered reductions higher than 0.35%, reaching a maximum of 0.51% in node 66. Higher reductions are obtained for the zero sequence voltage components. As shown in Figure 5.51, the VUF0 suffers a reduction higher than 6% in the MG nodes (except for node 1).
Such improvement of the MG operational conditions is a natural result from the additional voltage control capabilities that is provided by a MMO strategy. In fact, the resulting voltage balancing effect of the second VSI results from the Q-V droop control which regulates the magnitude of the voltage at its terminals, improving the voltage profile in the MG nodes. However, without the voltage balancing mechanisms, it still produces a set of unbalance three-phase voltages. As shown in Figure 5.52, voltage in phase A of node 36 increase being within the admissible limit. However, the phase B voltages of nodes 22, 44, 45, 51 and 84 are higher than the admissible voltage limit of 242 V.

Chapter 5 – MicroGrid Emergency Control Solutions: Simulation Results
224
In Case 3, performing voltage balancing in Node 1 cancels the negative and zero sequence components at this node and also produces a small balancing effect in the other nodes of the MG, when compared to Case 2. However, voltages are still high and close to the maximum admissible voltage limit (particularly in phase B).
In Case 4, the voltage balancing mechanism was implemented only in Node 66, in order to investigate if installing such a unit closer to the unbalance sources would produce better results compared to Case 3. As can be observed in Figure 5.50 adding the voltage balancing mechanism produces higher reductions in the overall MG voltage unbalance. In Node 66 the VUFneg was reduced from 0.81% to 0.28% and in node 36 from 2.06% to 1.53% being within the imposed limit. Contrarily to what is observed in Node 1, the negative and zero sequence voltages are not completely cancelled in Node 66. The voltage balancing mechanism ensures three-phase balanced voltage at the SSMT terminals. However, the uneven connection of the single-phase MS and loads connected to phase A will unbalance the voltage in this node. The maximum reduction on the VUFneg occurs in nodes 55 and 71 with a 0.61% reduction. These nodes are connected to Node 66 through short feeders.
As shown in Figure 5.51, performing voltage balancing at Node 66 cancels zero sequence voltage components. In Case 4, a 0.0184% VUF0 was obtained, against the 2.048% VUF0 obtained in Case 3. An average reduction of 0.6% was obtained for VUF0 in the MG feeder. Regarding the phase voltages, in Case 4 phase B voltages are no longer outside the admissible maximum limit. The maximum voltage obtained was in node 51 with 241.5 V.
Case 5 produces the best results, achieving higher balancing effect in the majority of the MG nodes. The balancing mechanism in Node 1 cancels the negative and zero sequence VUF in Node 1 (as was observed in Case 1) and the voltage balancing mechanism in node 66 produces a balancing effect in the nodes connected downstream the feeder (as concluded for Case 4). The voltage profile is similar to the one obtained in Case 4 as shown in Figure 5.52 to Figure 5.54.
Figure 5.50. Scenario II - Negative Sequence VUF in the rural MG nodes for cases 1 to 5.
1 89 84 11 55 71 66 15 42 51 36 25 22 450
0.5
1
1.5
2
2.5
3
Nodes
VU
F neg (%
)
Base CaseCase 1Case 2Case 3Case 4Case 5

Chapter 5 – MicroGrid Emergency Control Solutions: Simulation Results
225
Figure 5.51. Scenario II - Negative Sequence VUF in the rural MG nodes for cases 1 to 5.
Figure 5.52. Scenario II - Phase A RMS voltages in interconnected mode for cases 1 to 5.
Figure 5.53. Scenario II - Phase B RMS voltages in islanded mode for cases 1 to 5.
1 89 84 11 55 71 66 15 42 51 36 25 22 450
5
10
15
20
25
Nodes
VU
F 0 (%)
Base CaseCase 1Case 2Case 3Case 4Case 5
1 89 84 11 55 71 66 15 42 51 36 25 22 45180
190
200
210
220
230
240
Nodes
L-N
Vol
tage
(V)
Base Case Case 1 Case 2 Case 3 Case 4 Case 5
1 89 84 11 55 71 66 15 42 51 36 25 22 45210
220
230
240
250
260
270
Nodes
L-N
Vol
tage
(V)
Base Case Case 1 Case 2 Case 3 Case 4 Case 5

Chapter 5 – MicroGrid Emergency Control Solutions: Simulation Results
226
Figure 5.54. Scenario II - Phase C RMS voltages in islanded mode for cases 1 to 5.
5.5.2.2 Voltage Balancing in Node 36 The second strategy that was tested considers the installation of a VSI with (Cases 7 and 8) and without (Case 6) the additional voltage balancing mechanism in the remote node with the highest voltage unbalance - Node 36. Figure 5.55 and Figure 5.56 present the VUFneg and VUF0 respectively obtained for cases 6 to 8 and compare them to the best solutions found when considering the voltage balancing mechanisms in node 66.
In Case 6 a VSI is installed in Node 36 without the voltage balancing mechanism. Compared to Case 3, installing the VSI in Node 36 instead of Node 66 reduces negative sequence voltage unbalance in all the MG nodes, with exception of Node 66. However, it is not so effective in reducing the zero sequence voltage components in the other nodes. In Case 6 VUF0 reaches values higher than 8% in nodes 84, 11, 55, 71, 15, 42, 51, 22 and 45.
If voltage balancing is to be considered downstream the network, installing the VSI with voltage balancing mechanisms in Node 36 (Case 7) effectively reduces the VUFneg to 0.25% and cancels zero sequence voltage components (VUF0 approximately 0.01%). However, analysing the compensating effect in the other nodes of the MG it is possible to conclude that performing voltage balancing in Node 66 (Case 8) would lead to higher reduction of both negative and zero sequence voltage components. This can be explained by the high resistance of the feeder interconnecting Node 36 to Node 15, attenuating the voltage balancing effect.
Similar conclusions can be drawn from Cases 5 and Case 8. The adoption of voltage balancing mechanisms in Node 1 effectively cancels negative and zero sequence voltage components in the point of interconnection to the MV network. However, if additional voltage balancing strategies are to be considered to improve voltage quality in the MG feeders, installing it in the middle of the feeder (Node 66 in this case was selected) would lead to better results.
The impact of the selected strategies in the MG steady state voltages is shown in Figure 5.57 to Figure 5.59. Installing the VSI with voltage balancing in Node 36 improves the single-phase voltages in this node. However, it fails to reduce voltage in phase B of the remaining nodes, which remain close to 250V (thus being outside the 10% limit -242 V).
1 89 84 11 55 71 66 15 42 51 36 25 22 45210
220
230
240
250
Nodes
L-N
Vol
tage
(V)
Base Case Case 1 Case 2 Case 3 Case 4 Case 5

Chapter 5 – MicroGrid Emergency Control Solutions: Simulation Results
227
Figure 5.55. Scenario II in MMO operation - Negative sequence VUF in the rural MG nodes for cases 3
to 8.
Figure 5.56. Scenario II in MMO operation - Zero sequence VUF in the rural MG nodes for cases 3 to 8.
Figure 5.57. Scenario II in MMO operation - Phase A RMS voltages in the MG nodes for cases 3 to 8.
1 89 84 11 55 71 66 15 42 51 36 25 22 450
0.5
1
1.5
2
2.5
Nodes
VU
F neg (%
)
Case 3 Case 4 Case 5 Case 6 Case 7 Case 8
1 89 84 11 55 71 66 15 42 51 36 25 22 450
2
4
6
8
10
Nodes
VU
F 0 (%)
Case 3 Case 4 Case 5 Case 6 Case 7 Case 8
1 89 84 11 55 71 66 15 42 51 36 25 22 45200
205
210
215
220
225
230
235
Nodes
L-N
Vol
tage
(V)
Case 3 Case 4 Case 5 Case 6 Case 7 Case 8
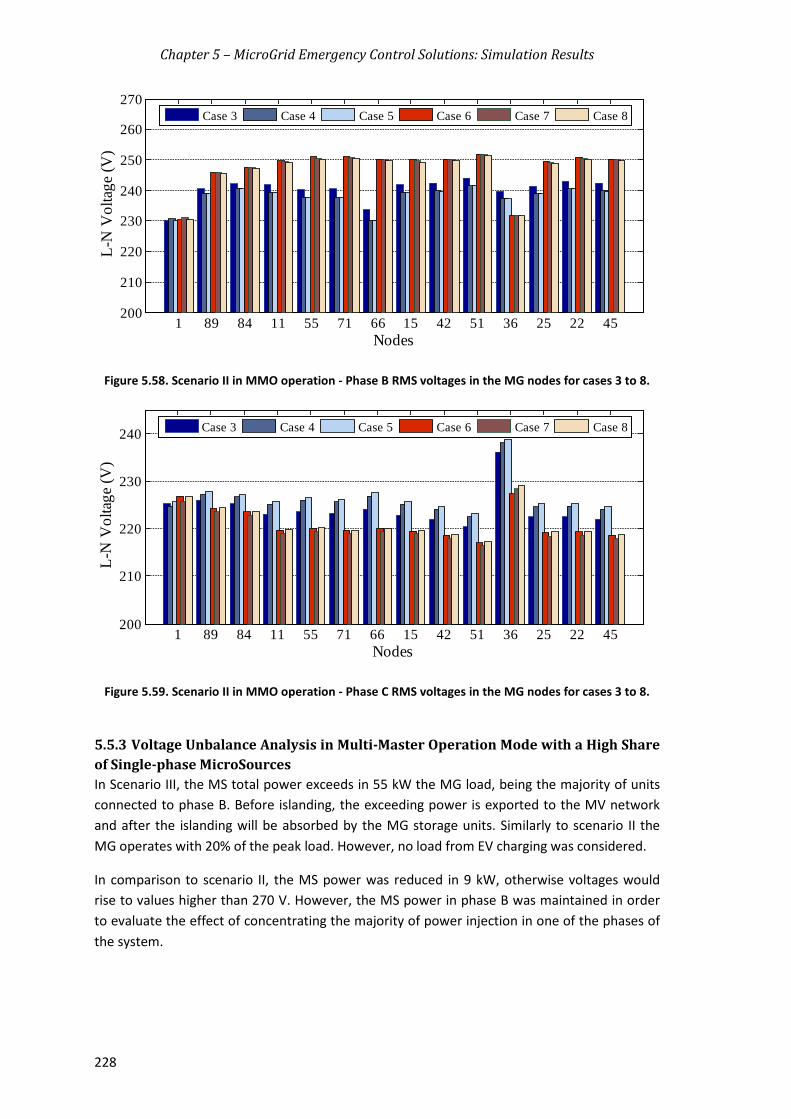
Chapter 5 – MicroGrid Emergency Control Solutions: Simulation Results
228
Figure 5.58. Scenario II in MMO operation - Phase B RMS voltages in the MG nodes for cases 3 to 8.
Figure 5.59. Scenario II in MMO operation - Phase C RMS voltages in the MG nodes for cases 3 to 8.
5.5.3 Voltage Unbalance Analysis in Multi-Master Operation Mode with a High Share of Single-phase MicroSources In Scenario III, the MS total power exceeds in 55 kW the MG load, being the majority of units connected to phase B. Before islanding, the exceeding power is exported to the MV network and after the islanding will be absorbed by the MG storage units. Similarly to scenario II the MG operates with 20% of the peak load. However, no load from EV charging was considered.
In comparison to scenario II, the MS power was reduced in 9 kW, otherwise voltages would rise to values higher than 270 V. However, the MS power in phase B was maintained in order to evaluate the effect of concentrating the majority of power injection in one of the phases of the system.
1 89 84 11 55 71 66 15 42 51 36 25 22 45200
210
220
230
240
250
260
270
Nodes
L-N
Vol
tage
(V)
Case 3 Case 4 Case 5 Case 6 Case 7 Case 8
1 89 84 11 55 71 66 15 42 51 36 25 22 45200
210
220
230
240
Nodes
L-N
Vol
tage
(V)
Case 3 Case 4 Case 5 Case 6 Case 7 Case 8
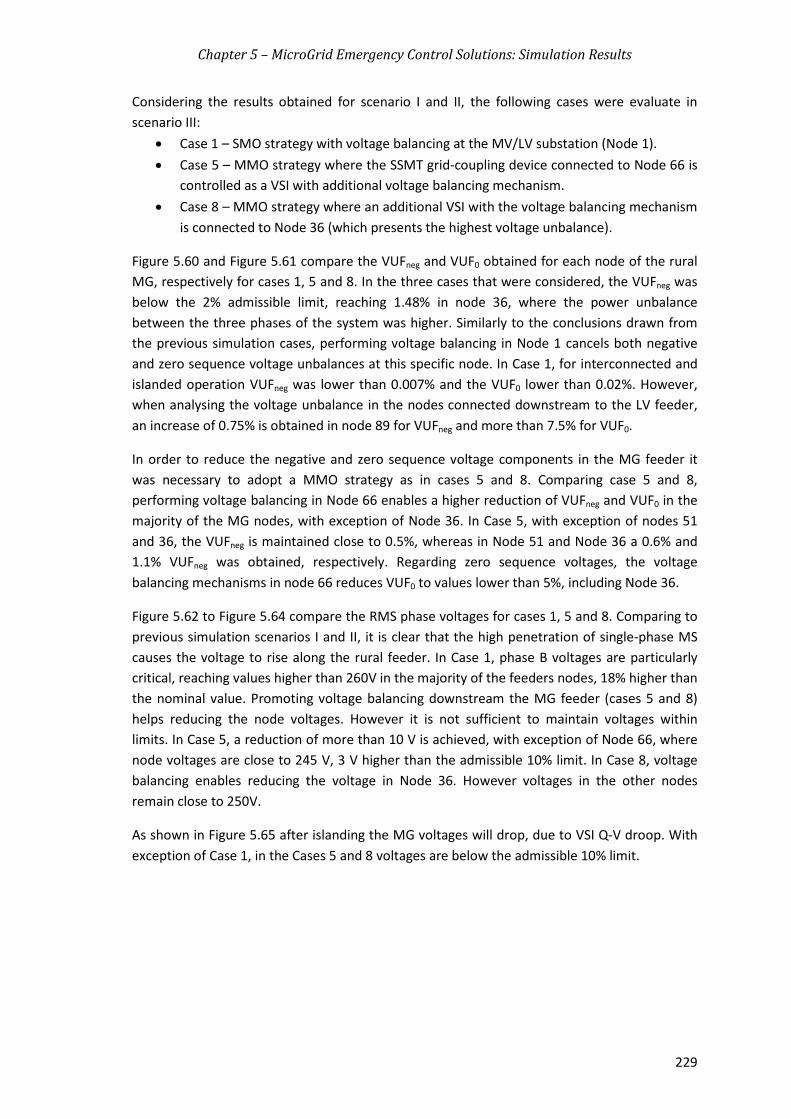
Chapter 5 – MicroGrid Emergency Control Solutions: Simulation Results
229
Considering the results obtained for scenario I and II, the following cases were evaluate in scenario III:
• Case 1 – SMO strategy with voltage balancing at the MV/LV substation (Node 1). • Case 5 – MMO strategy where the SSMT grid-coupling device connected to Node 66 is
controlled as a VSI with additional voltage balancing mechanism. • Case 8 – MMO strategy where an additional VSI with the voltage balancing mechanism
is connected to Node 36 (which presents the highest voltage unbalance).
Figure 5.60 and Figure 5.61 compare the VUFneg and VUF0 obtained for each node of the rural MG, respectively for cases 1, 5 and 8. In the three cases that were considered, the VUFneg was below the 2% admissible limit, reaching 1.48% in node 36, where the power unbalance between the three phases of the system was higher. Similarly to the conclusions drawn from the previous simulation cases, performing voltage balancing in Node 1 cancels both negative and zero sequence voltage unbalances at this specific node. In Case 1, for interconnected and islanded operation VUFneg was lower than 0.007% and the VUF0 lower than 0.02%. However, when analysing the voltage unbalance in the nodes connected downstream to the LV feeder, an increase of 0.75% is obtained in node 89 for VUFneg and more than 7.5% for VUF0.
In order to reduce the negative and zero sequence voltage components in the MG feeder it was necessary to adopt a MMO strategy as in cases 5 and 8. Comparing case 5 and 8, performing voltage balancing in Node 66 enables a higher reduction of VUFneg and VUF0 in the majority of the MG nodes, with exception of Node 36. In Case 5, with exception of nodes 51 and 36, the VUFneg is maintained close to 0.5%, whereas in Node 51 and Node 36 a 0.6% and 1.1% VUFneg was obtained, respectively. Regarding zero sequence voltages, the voltage balancing mechanisms in node 66 reduces VUF0 to values lower than 5%, including Node 36.
Figure 5.62 to Figure 5.64 compare the RMS phase voltages for cases 1, 5 and 8. Comparing to previous simulation scenarios I and II, it is clear that the high penetration of single-phase MS causes the voltage to rise along the rural feeder. In Case 1, phase B voltages are particularly critical, reaching values higher than 260V in the majority of the feeders nodes, 18% higher than the nominal value. Promoting voltage balancing downstream the MG feeder (cases 5 and 8) helps reducing the node voltages. However it is not sufficient to maintain voltages within limits. In Case 5, a reduction of more than 10 V is achieved, with exception of Node 66, where node voltages are close to 245 V, 3 V higher than the admissible 10% limit. In Case 8, voltage balancing enables reducing the voltage in Node 36. However voltages in the other nodes remain close to 250V.
As shown in Figure 5.65 after islanding the MG voltages will drop, due to VSI Q-V droop. With exception of Case 1, in the Cases 5 and 8 voltages are below the admissible 10% limit.

Chapter 5 – MicroGrid Emergency Control Solutions: Simulation Results
230
Figure 5.60. Scenario III – Negative sequence VUF in the MG nodes for cases 1, 5 and 8.
Figure 5.61. Scenario III – Zero sequence VUF in the MG nodes for cases 1, 5 and 8.
Figure 5.62. Scenario III – Phase A RMS voltages in the MG nodes during interconnected operation for
cases 1, 5 and 8.
1 89 84 11 55 71 66 15 42 51 36 25 22 450
0.25
0.5
0.75
1
1.25
1.5
1.75
2
Nodes
VU
F neg (%
)
Case 1 Case 5 Case 8
1 89 84 11 55 71 66 15 42 51 36 25 22 450
2.5
5
7.5
10
12.5
Nodes
VU
F 0 (%)
Case 1 Case 5 Case 8
1 89 84 11 55 71 66 15 42 51 36 25 22 45180
190
200
210
220
230
240
250
Nodes
L-N
Vol
tage
(V)
Case 1 Case 5 Case 8

Chapter 5 – MicroGrid Emergency Control Solutions: Simulation Results
231
Figure 5.63. Scenario III – Phase B RMS voltages determined in the MG nodes during interconnected
operation for cases 1, 5 and 8.
Figure 5.64. Scenario III – Phase C RMS voltages determined for the MG nodes during interconnected
operation.
Figure 5.65. Scenario III – Phase B RMS voltages determined for the MG nodes during islanded
operation for cases 1, 5 and 8.
1 89 84 11 55 71 66 15 42 51 36 25 22 45200
220
240
260
280
Nodes
L-N
Vol
tage
(V)
Case 1 Case 5 Case 8
1 89 84 11 55 71 66 15 42 51 36 25 22 45200
210
220
230
240
250
Nodes
L-N
Vol
tage
(V)
Case 1 Case 5 Case 8
1 89 84 11 55 71 66 15 42 51 36 25 22 45180
200
220
240
260
280
Nodes
L-N
Vol
tage
(V)
Case 1 Case 5 Case 8

Chapter 5 – MicroGrid Emergency Control Solutions: Simulation Results
232
From the results shown in Figure 5.62 to Figure 5.65 it is clear that performing voltage balancing contributes to reduce or even cancel the negative and zero sequence components, contributing to a better voltage profile in the LV feeder. However, this not means that the voltage magnitude will remain within the admissible limits. In order to maintain voltages within admissible limits, complementary measures are required. For example, in scenario III, voltage could be maintained within acceptable limits by conveniently reducing the MS active power injection or by increasing the MG load with EV charging in proper nodes.
Regarding voltage balancing, the results obtained in Scenario III reinforce the conclusions drawn in previous scenarios I and II. When a SMO strategy is adopted with the VSI connected to the MV/LV substation, performing voltage balancing will successfully cancel both negative and zero sequence voltage components, ensuring a secure synchronization of the MG to the upstream network. However, the compensating effect in the MG feeder downstream will be highly dependent of the feeder characteristics and of the power unbalance between the three phases of the system. When the MG is constituted by long feeders with high R/X ratio, the voltage balancing effect will be greatly reduced as the electrical distance increases. In these cases, considering a MMO with voltage balancing will help reducing the voltage unbalance in the feeder. The best strategy defined for the simulated cases was to install the balancing unit in the middle of the feeder, producing a balancing effect for the maximum nodes possible. However, the success of this strategy will always be dependent of the characteristics of the networks.
5.6 Summary and Main Conclusions This chapter presented the evaluation of the benefits of the active integration of EV and flexible loads in MG emergency control strategies (presented in Chapter 3) when operating under severe unbalanced load conditions, namely for islanded mode of operation and for the service restoration procedure. The performed simulations demonstrate the feasibility of the proposed frequency regulation mechanisms and improvements of MG voltage quality when adopting the voltage balancing strategies that were proposed.
Two distinct LV networks were adopted for the simulation studies, considering a large scale integration of single-phase MS, loads and EV. The urban network was adopted in order to validate the EV and load responsive strategies and the rural network was adopted for validating the voltage balancing strategies. The urban network system adopted was composed mainly by underground cables and was characterized by high load density. In this case, the main objective was to validate the frequency regulation strategies proposed when considering high power unbalance between the three phases of the system. On the contrary, the rural network was composed by long overhead feeders and was characterized by having low short-circuit power and low load density, when compared to the urban networks. Therefore, in the rural case voltage unbalance was more severe not only due to the uneven distribution of single-phase loads, MS and EV by the three-phases of the system but also due to the electrical characteristics of the LV feeders. The MG MATLAB®/Simulink® simulation platform, incorporating the models described in Chapter 4, was extensively used in order to study the dynamic behaviour of the three-phase four-wire MG, operating in emergency mode and under unbalanced load conditions.

Chapter 5 – MicroGrid Emergency Control Solutions: Simulation Results
233
Regarding the main results that were presented, first the benefits of the EV participation in MG load-frequency control were analysed following an unplanned islanding. The results presented in 5.3.1 demonstrated that the adoption of the EV f-P droop characteristic reduced the initial frequency deviation after an unplanned islanding and led to a faster recovery of the MG frequency to the nominal value. The immediate response of EV to the frequency deviation in the moments subsequent to islanding reduced the EV total power consumption, consequently reducing the main storage solicitation. However, the impact on the main storage state of charge will depend on the MG pre-fault load/generation conditions as well as on the amount of EV connected to the network.
As presented in 5.3.2 the EV droop control can be complemented by the active participation of flexible loads in order to improve the MG resilience following islanding. The implementation of the MG emergency online operation and management algorithms proposed in 3.7 enabled the seamless transition to islanding operation, as well as a stable operation in the moments subsequent to islanding. The validation of these algorithms was performed in 5.3.2, considering different MG operation scenarios. During interconnected operation the load and EV emergency scheduling algorithm has effectively defined the most adequate load control solution in the event of an unplanned islanding. The load control algorithm scheduled the minimum amount of load required to maintain power balance. Additionally, in Scenario II it was demonstrated that a temporary load control may avoid high frequency disturbances or excessive discharging of the MG storage, compromising the MG security. However, during islanded operation additional disturbances may occur due to load or MS power variability. In this case, as demonstrated for Scenario III, the MG islanded operation algorithm defined the additional control solutions required to avoid the MG collapse and considering the available resources (i.e. flexible loads, EV and MS).
The results obtained for a MG Urban Network 2 demonstrated the quality and the feasibility of the proposed tools, which provided effective results regarding the improvement of the MG resilience during autonomous operation. The proposed online management approach is intended to support MG islanding operation during short periods of time (i.e. less than 1 hour). For larger time frames of operation in islanding conditions, complementary approaches need to be considered, involving forecasting of loads with different degrees of flexibility (including EV), as well as forecasts for renewable based microgeneration.
Regarding MG service restoration procedure, the results presented in section 5.4 have shown that the EV supports the reconnection of the loads and MS when considering the f-P droop characteristic. Contrarily to the characteristic adopted for the islanded mode of operation, during the MG restoration procedure the EV are connected to the network with zero consumption. When frequency exceeded the pre-defined dead-band, the EV responded immediately absorbing or injecting power in order to avoid larger frequency excursions. From the results presented for the MG rebuilding phase, it was demonstrated that the proposed EV grid supporting strategy improve the MG load following capability, reducing the initial deviation caused by the reconnection of the loads and reducing the main storage solicitation. Globally, the active participation of EV could contribute to reduce the service restoration time and the solicitation of the main storage system, increasing the possibility of a successful
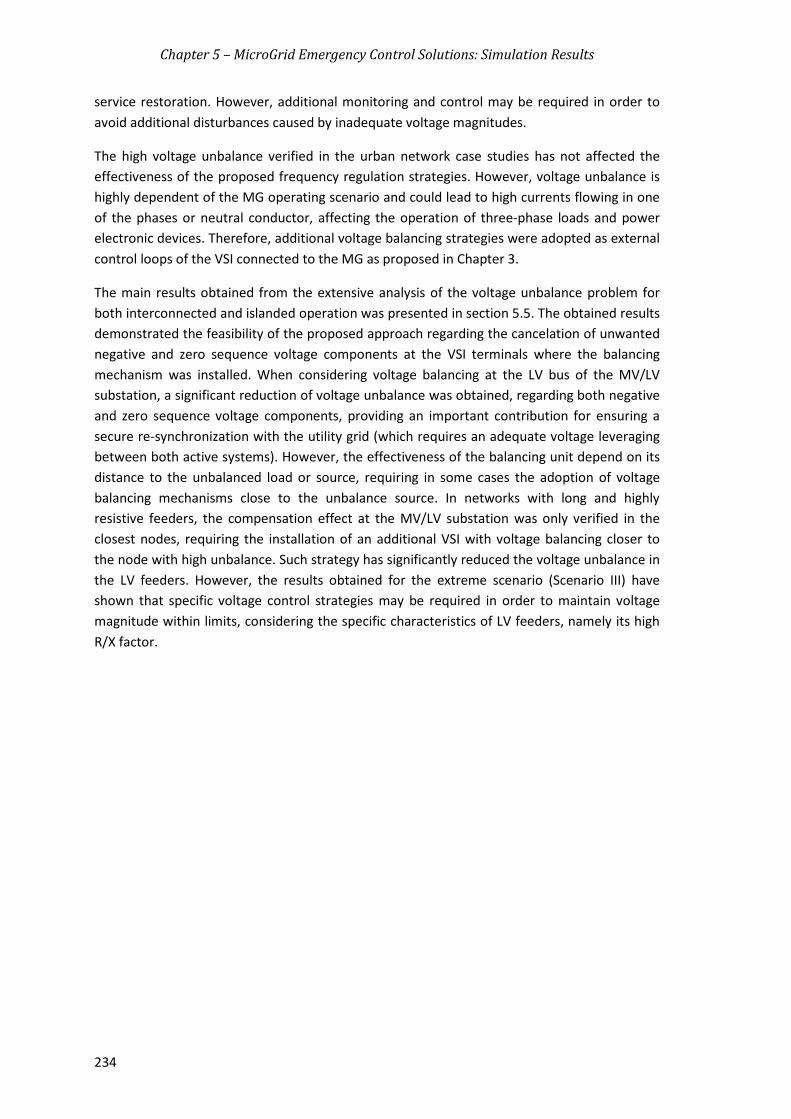
Chapter 5 – MicroGrid Emergency Control Solutions: Simulation Results
234
service restoration. However, additional monitoring and control may be required in order to avoid additional disturbances caused by inadequate voltage magnitudes.
The high voltage unbalance verified in the urban network case studies has not affected the effectiveness of the proposed frequency regulation strategies. However, voltage unbalance is highly dependent of the MG operating scenario and could lead to high currents flowing in one of the phases or neutral conductor, affecting the operation of three-phase loads and power electronic devices. Therefore, additional voltage balancing strategies were adopted as external control loops of the VSI connected to the MG as proposed in Chapter 3.
The main results obtained from the extensive analysis of the voltage unbalance problem for both interconnected and islanded operation was presented in section 5.5. The obtained results demonstrated the feasibility of the proposed approach regarding the cancelation of unwanted negative and zero sequence voltage components at the VSI terminals where the balancing mechanism was installed. When considering voltage balancing at the LV bus of the MV/LV substation, a significant reduction of voltage unbalance was obtained, regarding both negative and zero sequence voltage components, providing an important contribution for ensuring a secure re-synchronization with the utility grid (which requires an adequate voltage leveraging between both active systems). However, the effectiveness of the balancing unit depend on its distance to the unbalanced load or source, requiring in some cases the adoption of voltage balancing mechanisms close to the unbalance source. In networks with long and highly resistive feeders, the compensation effect at the MV/LV substation was only verified in the closest nodes, requiring the installation of an additional VSI with voltage balancing closer to the node with high unbalance. Such strategy has significantly reduced the voltage unbalance in the LV feeders. However, the results obtained for the extreme scenario (Scenario III) have shown that specific voltage control strategies may be required in order to maintain voltage magnitude within limits, considering the specific characteristics of LV feeders, namely its high R/X factor.

Chapter 6 – Experimental Validation of MicroGrid Emergency Operation
235
– Experimental Validation of Chapter 6MicroGrid Emergency Operation Digital simulation based research previously discussed provides key contributions regarding MG operation and control. However, designing an experimental platform for the experimental validation of MicroGrid (MG) autonomous operation is of utmost importance regarding the proof-of-concept of the solutions previously investigated. Therefore, MG demonstration activities incorporating advanced control mechanisms are discussed in this chapter, through the implementation of the emergency strategies proposed in Chapter 3 at the Smart Grid and Electric Vehicle Laboratory (SGEVL) facilities at INESC TEC. Emphasis is given on the implementation of the software modules that will constitute the MG controllers (the MG central controller and local controllers) as well as on the discussion of the main experimental results obtained from the tests conducted for demonstrating the performance of the emergency operation functionalities previously validated through simulation.
6.1 Introduction Within the Smart Grid (SG) paradigm, the MG concept has been pointed out as a key concept for the implementation of future smart distribution networks, since it extends and decentralizes the distribution network monitoring and control capability and provides key self-healing capabilities to Low Voltage (LV) networks. The increased interest on MG concept has led to several demonstration activities that have been exploited worldwide, such as the ones described in Chapter 2.
Within this framework, the SGEVL previously described in Chapter 2, presents distinct features when compared to similar infrastructures, namely: the capability of integrating commercially available solutions and in-house developed prototypes, as well as the required communication and information layer to build the MG control and management system. The laboratory allows individual and fully integrated development and testing of concepts, algorithms and communication solutions that will allow the operation of a distribution network, under normal and emergency conditions.
This chapter describes the implementation of the MG hierarchical control for emergency operation proposed in Chapter 3 (see Figure 3.2) and presents the most relevant results obtained from the experimental tests that were conducted. First, section 6.2 describes the implementation of the control architecture regarding primary control functionalities such as Electric Vehicle (EV) droop control and load control, secondary frequency control algorithms and the MG energy balancing algorithms. The emergency control strategies were implemented considering the electric infrastructure of the laboratory, as well as its general monitoring and control architecture previously described in Chapter 2. The main results obtained are presented in section 6.3 and follow the structure adopted in Chapter 5. First the analysis focus on the participation of EV in primary frequency control during MG islanding operation, as it is described in 6.3.1. Additionally, experimental tests are reported regarding the feasibility demonstration of the centralized frequency control algorithm proposed in Chapter 3. The

Chapter 6 – Experimental Validation of MicroGrid Emergency Operation
236
experimental results regarding the participation of flexible loads, considering the algorithms for managing energy balance following an unplanned islanding are presented in section 6.3.2. Finally, the validation of MG restoration procedure integrating EV is discussed in section 6.3.3.
6.2 Implementation of the MicroGrid Hierarchical Control The MG emergency control strategies discussed in Chapter 3 results in a combination of local and centralized control, implemented at the local controllers and at the MG Central Controller (MGCC), respectively. Local control strategies are responsible for ensuring MG voltage and frequency regulation and are supported by EV and MicroSources (MS). The controls are implemented as external control loops of the grid-coupling inverters and respond based on local measurements (i.e. voltages, power, and frequency). On the other hand, the MGCC will incorporate the centralized control functionalities, which are responsible for secondary frequency control and for providing an adequate coordination between the MG resources during emergency conditions. Centralized control takes advantage of the smart metering infrastructure in order to interact with the local controllers, being supported by a communication infrastructure described in more detail in [169].
Taking as reference the SGEVL infrastructure previously discussed in Chapter 2, the first developments required for the experimental validation of MG autonomous operation are related to the implementation of the associated control architecture. The commercially available SMA Sunny Island 5048® battery incorporate P-f and Q-V droop control, which constitute key primary regulation functionalities for the MG. On the existing converter prototypes (associated to EV charger and MS) control strategies were implemented in order to provide the desired regulation functionality. Regarding the implementation of the proposed emergency load control strategy, a control setup was implemented in order to control the load banks installed in the laboratory, based on the MG frequency. The high level algorithms were implemented at the MGCC considering the laboratorial data acquisition and control system.
As previously mentioned in section 2.5.5, the laboratory data acquisition and control system is a platform developed in order to support the operation of the laboratory, for experimental data collection and storage and for supporting the MG software modules constituting the MG control system. It is intrinsically related to the SCADA system responsible for the laboratory automation and to the universal metering devices connected to each feeder of the electric panel. A Modbus to TCP-IP protocol conversion platform is used to exchange the measurement data with the MG control system and with a general database for storing experimental results [169].
6.2.1 Local Controllers The first layer of the MG control consists in the local controllers: the MS Controllers (MC), EV Controller (VC), energy storage unit controller and Load Controller (LC). Considering the resources available in the laboratory the following controllers were considered:
• Energy storage unit power inverter and controller ‒ SMA Sunny Island 5048® battery inverters (15 kW, 400 V each) are responsible for managing the battery pack and providing frequency and voltage regulation during islanded operation. Considering

Chapter 6 – Experimental Validation of MicroGrid Emergency Operation
237
their importance for the tests that were performed, a description of its main control characteristics is provided below.
• Non-controllable MC ‒ interfaces the single-phase PQ inverters coupled to the PhotoVoltaic (PV) and micro-Wind Turbine (WT) emulator.
• Controllable MC ‒ control interface of the 20kW four quadrant back-to-back inverter (4PQ), which is set to emulate the typical response of a Single-Shaft Microturbine (SSMT) and a Solid Oxide Fuel Cell (SOFC).
• VC ‒ interfaces the single-phase bidirectional EV charger prototype with the MG control system.
• LC – enables the remote control of loads by the MGCC, based on the MG measured frequency.
6.2.1.1 Storage Controller – SMA Sunny Island 5048® The SGEVL incorporates two three-phase groups of SMA Sunny Island 5048® inverters, which enable the autonomous operation of the MG (since they act as grid forming inverters with the ability of operating autonomously). Each group is composed by three single-phase inverters combined in a master-slave-slave configuration. The synchronization between the three phases is implemented through a built-in local communication. As represented in Figure 6.1, each single-phase inverter has three main connection terminals: a DC terminal used to connect the inverter to the battery bank, an AC terminal to connect the inverter to the main upstream network (AC2) and another AC terminal used to connect the inverter to the downstream LV system operating as a MG (AC1). The main characteristics of the AC inputs are summarized in Table 6.1.
Figure 6.1. SMA Sunny Island 5048® simplified connection scheme.
Main Grid
AC
DC
AC
DC
Loads
FLA battery bank(50 V, 20 kWh @ 10 h)
AC2
AC1
DC
SMA Sunny Island 5048 (230 V, 3x5 kW)
PV inverter (230 V, 3 kW)
WT inverter (230 V, 3 kW)

Chapter 6 – Experimental Validation of MicroGrid Emergency Operation
238
Table 6.1. SMA Sunny Island 5048® technical data and parameters.
Description Values
Nominal AC voltage (V) 230V/400 V
Nominal frequency (Hz) 50 Hz
Maximum efficiency (%) 95% (at 1kW)
AC1 - MG
Nominal Current (A) 21
Maximum peak current for 60ms (A) 120
Nominal power (kW) 5 (single-phase)/ 15 (three-phase group)
Maximum admissible power at 25ºC (kW) 6.5 ( 30 min) / 8.4 ( 1 min) / 12 (3s)
AC2 – Main grid
Maximum AC2 current (A) 56 A
Maximum AC2 power (kW) 12.8 kW
The connection to the main grid (AC2) integrates an internal switch that is used automatically by the inverter control system in order to transfer to autonomous operation when no voltage is detected in AC2. This internal switch is also used to reconnect to the upstream network when voltage is detected. Within this process, a built-in synchronization algorithm ensures that the system is reconnected when the synchronizing conditions are verified. Following islanding, the inverters maintain the power balance to the loads and MS connected to AC1. SMA Sunny Island 5048® inverters incorporate a built-in and proprietary frequency regulation functionality, which has two major components: an initial fast response action governed by droop control rules (in this case denominated SelfSync®), followed by a secondary frequency regulation mechanism that has the responsibility of assuring frequency restoration to nominal value. The parameters of by P-f and Q-V droops are not accessible to the users. The secondary frequency regulation functionality is able to correct the MG frequency after a disturbance. However, following the natural response of the converter in the islanded system, the battery bank will continue to charge/discharge in order to maintain power balance between generation and loads. This functionality avoids the dependence on controllable MS which may not be integrated in remote stand-alone systems, where these units are usually installed. Consequently, this built-in characteristic requires some adaptation on the MG secondary frequency regulation functionalities previously proposed, regarding the feasibility demonstration in the laboratorial platform.
SMA Sunny Island 5048® inverters only allow the connection of external sources in AC2 output, (connecting the inverter to the main grid and/ or to a backup generator). Consequently it is not possible to connect the two three-phase groups of SMA Sunny Island 5048® inverters in parallel through their AC1 output (in order to test for example the operation of the MG in Multi-Master Operation Mode). Each group can supply two distinct MG systems or operate in series, connecting the AC1 output of one group to the AC2 output of the other group. In the second case, the group of inverters connecting the two systems to the upstream network will act as a master when the system is islanded. This configuration will be adopted and discussed in the MG service restoration test in section 6.3.3.

Chapter 6 – Experimental Validation of MicroGrid Emergency Operation
239
The SMA Sunny Island 5048® also performs the management and protection of the battery bank. Two internal relays can also be configured to control loads connected nearby the converter. However, this functionality was not considered for the experimental tests. The load controller developed is described below.
6.2.1.2 Non-controllable MS Controllers As it was previously mentioned in Chapter 2, the SGEVL incorporates two prototypes of single-phase inverters that were developed in the context of the project REIVE: one of the inverters is connected to a string of PV panels and the other is used to connect a micro-WT emulator to the grid. The MS single-phase inverters are composed by half-bridge assemblies, including IGBT switches and hybrid gate drivers, as well as passive components, such as protection devices, voltage and current sensors and control hardware. Their control is implemented in a stand-alone Digital Signal Processor (DSP), which allows the inverter to operate autonomously. A detailed description of PV and micro-WT inverter design can be found in [171], [172] respectively. The PV and micro-WT general architecture are represented in Figure 6.2 a) and b), respectively.
a)
b)
Figure 6.2. General architecture of the single-phase inverter prototypes for: a) solar inverter [171] and b) micro-wind turbine inverter [172].
The differentiating features of these inverters regarding the commercial ones relies in their interaction with the MG system, which include voltage grid supporting controls and a communication interface, which enable their interaction with the Smart Meter (SM) and with the MGCC, through the MC. The inverters prototypes can be controlled in terms of its active power in order to limit their active power injection or to provide local voltage support [162].

Chapter 6 – Experimental Validation of MicroGrid Emergency Operation
240
The MGCC can specify a reference power, which will limit the power injected by the MS and/or enable the participation of the MS in voltage regulation.
The MC is emulated in a Personal Computer (PC), ensuring the communication with the MS inverters and with the MGCC through a TCP/IP based network. The user interface enables local operation and monitoring of the prototypes. Figure 6.3 shows the user interface of the micro-WT inverter prototype, where it is possible to observe a high number of configurable parameters as well as real-time local monitoring and operation options. A similar interface also enables the control of the PV unit.
Figure 6.3. Micro-WT controller user interface.
Regarding voltage support, the MS inverters incorporate the active power/voltage droop (P-V) functionality represented in Figure 6.4. When the voltage exceeds the pre-defined dead-band, the output power is reduced in order to limit the voltage rise effect. On the contrary, if the MS was operating below its maximum capacity and the voltage drops below the dead-band, the unit can increase its power output. The reference power (Pref) parameter enables the specification of a power set-point for the operation of the MS within a certain voltage dead-band. The active power control was implemented considering the different microgeneration technologies. For the PV panels, active power variations are achieved by modifying the maximum power point tracking algorithm, thus temporally degrading the efficiency of the PV panels. In the case of the micro-WT inverter, a dump load is used to dissipate the power surplus that cannot be accommodated by the LV grid. During emergency operation test (islanded and restoration procedure) voltage support strategy was not considered. However, the MGCC will be able send a power set-point to the MC in order to reduce MS power output.

Chapter 6 – Experimental Validation of MicroGrid Emergency Operation
241
As discussed in Chapter 2, these strategies based in active power control provide additional flexibility to the operation of LV networks, in comparison with more conservative approaches based on the limitation of the injected power [97]. However, this voltage control strategies are more relevant for the MG interconnected operation mode. Therefore, this functionality will not be demonstrated in the tests described in this dissertation.
Figure 6.4. MS active power/voltage droop control strategy.
6.2.1.3 Controllable MS Controller Controllable MS such SSMT and SOFC are key elements for enabling MG emergency operation, namely for ensuring secondary frequency regulation. As these types of units are not available in the laboratory, it was adopted a strategy relying on the emulation of its dynamic response, using the 20 kW 4PQ inverter available in the laboratory. The SSMT and SOFC dynamic response emulation is based on the corresponding dynamic model previously discussed in section 4.6. The 4PQ operates as a grid-tied inverter and it is remotely controlled in terms of injected or absorbed active power. Consequently, an additional control layer is required in order to emulate controlled MS in order to estimate the SSMT and SOFC dynamic response and send the corresponding power signals to the 4PQ.
In order to achieve the desired emulation functionally, the control architecture represented in Figure 6.5 was implemented in a conventional computer, being composed of four main modules:
• Communication interface through Ethernet based on Modbus protocol, which ensures the flow of information between the PC and the 4PQ inverter and with a supervisory control and data acquisition system in order to collect electric measurements at the inverter terminals.
• User interface, represented in Figure 6.6, which allows the local operation of the inverter. The interface allows the user to select the type of MS to be emulated as well as the parameterization of its participation in MG secondary frequency control. The same options can be configured remotely.
• MATLAB®/Simulink® platform, incorporating the SSMT and SOFC dynamic models described in section 4.6.
• Python® module developed in Python 2.7® programming language. The module is responsible for operating the 4PQ unit and calling the execution of the dynamic model in MATLAB®/Simulink®, in order to simulate the power response of the
Pmax
Dead band
P
ΔV
Pref
ΔV maxΔV min

Chapter 6 – Experimental Validation of MicroGrid Emergency Operation
242
selected MS, and then use the resulting active power set-point array to modulate the 4PQ active power output.
The Python® module includes three main groups of functionalities, such as: • Basic functionalities, includes routines responsible for reading the unit status, starting
and stopping the unit, changing power set-point and recording electric measurements (such as phase current, power and voltage measurements).
• Emulation of MS and storage, responsible for emulating the different types of sources. In the case of the SSMT or SOFC, the algorithm will run the corresponding MATLAB®/Simulink® model, considering the initial power measured and the desired power output. After running the model, the 4PQ power is changed in pre-defined steps in order to emulate the power response of these sources.
• Grid supporting functionalities, which enable the participation of the 4PQ in different grid supporting functionalities, such as secondary frequency control or voltage control. In the first case, the algorithm proposed in section 3.5.2 was implemented at the MGCC level in order to define the set-points for the unit.
A set of tests was initially performed to validate the emulation of controllable sources. Figure 6.7 presents the active power response of the 4PQ when emulating a SSMT, compared to the reference power determined by the dynamic model implemented in MATLAB®/Simulink® (SSMT model). The 4PQ active power response obtained presents a good approximation to the one determined through the SSMT model. The error obtained derives from communication delays between the MC and the 4PQ communication interface and also from the internal control of the 4PQ inverter.
Figure 6.5. 4PQ control architecture.

Chapter 6 – Experimental Validation of MicroGrid Emergency Operation
243
Figure 6.6. 4PQ user interface.
Figure 6.7. Comparison of the SSMT active power response for dynamic model (SSMT model) and the
4PQ.
6.2.1.4 EV Controller The EV bidirectional charger prototype presents a more compact architecture when compared to the MS prototypes, as it was previously described in Chapter 2 (see Figure 2.32). The architecture of the EV prototype and control system is represented in Figure 6.8. A detailed description of the EV prototype is provided in [170]. During MG emergency operation the EV charging power is defined by the EV f-P droop characteristic and limited by the Battery Management System (BMS) in order to avoid fully discharging or overcharging the battery pack. Similarly to the other MG resources, the EV charger communicates with the VC, which corresponds to a computer ensuring the communication interface between the EV charger and the MG system. A user interface allows local parameterization of EV charger droop control parameters and also displays the most relevant information received from the BMS and the inverter.
0 20 40 60 80 1000
2.5
5
7.5
10
12.5
Time (s)
Act
ive
pow
er (k
W)
SSMT model4PQ

Chapter 6 – Experimental Validation of MicroGrid Emergency Operation
244
Figure 6.8. Architecture of the EV bidirectional charger prototype [170].
Figure 6.9. EV bidirectional controller graphic user interface.
Similarly to the MS voltage support strategy previously discussed, the EV charging power can also provide voltage support, considering a local active power/voltage droop (P-V), as in Figure 6.10. Similarly to the EV f-P droop characteristic adopted in this thesis, the EV reference (dis)charging power is defined based on the voltage measured at its terminals. When the voltage increases, the EV will increase the power consumption (limited by its maximum power Pmax). In case of a significant voltage drop (outside the specified dead-band), the EV can decrease its charging power or even inject power to support the voltage at the connection point. The adoption of droop-based strategies will lead to a combined operation of MS and EV. The increase of EV charging power will attenuate the voltage rise effect and consequently enable an increase of the MS injected power.

Chapter 6 – Experimental Validation of MicroGrid Emergency Operation
245
The EV voltage support strategies are only considered during MG interconnected operation. Therefore, during islanding only the f-P droop control was considered.
Figure 6.10. EV active power – voltage droop control.
6.2.1.5 Loads Controller The laboratory is equipped with three controllable loads: two three-phase impedance loads with 27 kW of nominal power consumption and a 6 kW SMA Smart Load 6000® (SML). The first two, named throughout this chapter as CL1 and CL2, are resistive loads, configurable in a combination of four steps, as indicated in Table 6.2. The control of the loads is discrete and can be performed locally using the respective control panel or remotely through an Ethernet I/O control card using Modbus/TCP protocol.
Table 6.2. Active power consumption of CL1 and CL2.
Step Active Power (kW) 1 2 2 3.5 3 7 4 14.5
Total 27
CL1 and CL2 do not have local measurement capability for any electric variables. Therefore, in order to implement the emergency load control strategies based on frequency, the setup represented in Figure 6.11 was implemented. The loads active power consumption is measured with the universal metering device UGM 103®, while the MG frequency is measured using a multimeter for obtaining a larger measurement sampling (50 ms). A Python® module operating as a master requests the measurements to the measuring devices (e.g. slaves) and is also responsible for controlling the loads. The load control can be performed locally through a user interface or remotely as outputs of the higher level control algorithms implemented at the MGCC, as detailed in the next sections.
dead-band
V2G
Power Consumption
Pmax
∆V
Pmin
∆V max
∆V min
Pref
∆V0

Chapter 6 – Experimental Validation of MicroGrid Emergency Operation
246
Figure 6.11. Laboratory setup for CL1 and CL2 control.
The SML is an electronic load with 3×2 kW resistors connected at the DC side, which can be controlled in a continuous mode through a DC reference voltage in order to consume a specific power, as generally represented in Figure 6.12. Alternatively, the SML can be set to respond to grid frequency or voltage variations according to built-in functionalities. In the experiments conducted in this thesis the load was operated as a constant three-phase load by specifying the DC voltage control signal, which is determined according to (6.1) and is generated by a control card with Ethernet communication capabilities. The control is implemented remotely through the Python® module.
16000
8+= refDC PV (6.1)
Where,
DCV ‒ Input DC voltage (V).
refP ‒ Reference output power (W).
Figure 6.12. SMA Smart Load 6000 –Active power output vs. reference DC voltage input.
VDC (V)
P (kW)
6
1
1 9

Chapter 6 – Experimental Validation of MicroGrid Emergency Operation
247
6.2.1.6 Smart Meter The SM enables the integration of household appliances, EV and MS in MG operation. Similarly to the local controllers, the SM was implemented in a PC, having two way communication capabilities in order to interact with the MGCC and with the local controllers. The SM has also a local module for processing relevant information and measurements (voltage, active power, among others). The user interface represented in Figure 6.13 enables the integration of user preferences regarding the participation in grid support services and remote management of load and generation.
a)
b)
c)
Figure 6.13. SM user interface: a) Household real-time data, user preferences for b) household appliances and c) EV charging.

Chapter 6 – Experimental Validation of MicroGrid Emergency Operation
248
6.2.2 Centralized Control The MG Central Controller (MGCC) is responsible for monitoring, control and managing the MG. The controller incorporates high level algorithms to coordinate the MG resources, based on the data received from the SM and local controllers connected downstream. As discussed previously, during emergency conditions the main objective of the MGCC is to support the action of local control frequency and voltage regulation strategies and to trigger the MG restoration procedure in the event of a blackout.
The architecture of the MGCC software prototype is represented in Figure 6.14. The algorithms were implemented in Python 2.7® programming language and are organized in several modules. Based on an Ethernet bidirectional communication infrastructure, the MGCC is able to interact with the MG management and control architecture, receiving data from the SM and local controllers and sending the control signals resulting from the algorithms running at the MGCC level. The MGCC also interacts with the laboratory supervisory and data acquisition system, namely for collecting the measurement from the equipment involved in MG operation and for commanding the electric panel through the SCADA system.
Figure 6.14. Architecture of MGCC prototype and interface with the laboratory control and supervision and MG lower control levels.

Chapter 6 – Experimental Validation of MicroGrid Emergency Operation
249
Considering the MG hierarchical emergency control architecture defined in Chapter 3 (see Figure 3.2), three algorithms were integrated at the MGCC:
• Centralized secondary frequency control algorithm, which is responsible for dispatching the MG controllable MS in order to restore the MG frequency to the nominal value.
• Management of MG energy balance following islanding, which includes the load and EV emergency scheduling and the islanding operation algorithm.
• MG restoration procedure, integrating the active participation of EV.
6.2.2.1 Implementation of Centralized Secondary Frequency Control The centralized frequency control algorithm proposed in Chapter 3 (see Figure 3.10) was implemented at the MGCC level for validation purposes. As previously explained, the response of the grid forming inverters SMA Sunny Island 5048® precludes a direct implementation of a secondary control action based on the frequency deviation in the moments subsequent to the MG islanding. The SMA Sunny Island 5048® inverters intrinsically incorporate a frequency restoration functionality which corrects the frequency deviation after a disturbance. As a result, these units inject the power required to balance the load and generation in the islanded MG even after correcting the frequency.
The adaptations introduced in the algorithm initially proposed consist on defining the dispatch of controllable MS based on the active power injected by the VSI instead of the MG frequency. By dispatching the power being injected by these inverters to controllable MS, the rational that has been followed in this dissertation is kept: under steady state conditions, in a MG with a Single Master Operation (SMO) strategy, the power being injected by the VSI associated to the energy storage unit should be zero.
The secondary frequency control algorithm implemented is represented in Figure 6.15. The algorithm is enabled immediately after the islanding is detected. When the power injected by the SMA Sunny Island 5048® battery inverter (PVSI) exceeds a pre-defined limit (Pmin), the algorithm will dispatch the 4PQ inverter. According to the algorithm presented in section 3.5.2, the new power set-point is determined based on a participating factor determined according to the available reserve capacity of the controllable MS. The new power adjustment (∆PMS) is sent to the MC which will be responsible for changing the power of the 4PQ according to the type of source selected (storage, SSMT or SOFC). The secondary control algorithm will run until the MG reconnects to the main grid. If a new disturbance occurs, new set-points will be determined for compensating the power injected by the SMA Sunny Island 5048® battery inverter. In this case, a new set-point is only sent if the MS has stabilized in the reference power sent in the previous iteration (e.g. identified in Figure 6.15 with the condition MS_state==0).
6.2.2.2 Implementation of MG Energy Balance Management Algorithms As discussed in Chapter 3, two algorithms are proposed to run at the MGCC for managing MG energy balance following: the load and EV emergency scheduling algorithm and the MG islanded operation algorithm. The algorithms were implemented in the MGCC prototype using Python 2.7® programming language.

Chapter 6 – Experimental Validation of MicroGrid Emergency Operation
250
Figure 6.15. Laboratory implementation of secondary frequency control.
The architecture of the module incorporating the two algorithms is represented in Figure 6.16. The MG continuously checks for the MG operating state, in order to detect an eventual islanding. As previously discussed in section 3.7, the load and EV emergency scheduling algorithm is enabled when the MG is operating interconnected. If MG disconnects from the main grid, the MG islanded operation algorithm is enabled, running until the MG reconnects with the upstream network.
During MG interconnected operation, the load and EV emergency scheduling algorithm was set to run every 15 minutes in order to characterize the MG operation state and define if additional load and EV control is required. All the required measurements are collected from the corresponding metering devices or through the SM. Then, in order to evaluate the security of the MG in the event of an unplanned islanding, the algorithm control solution is tested through the simplified dynamic simulation approach, which is initialized according to the actual MG operating state. It is important to notice that in the overall implementation the

Chapter 6 – Experimental Validation of MicroGrid Emergency Operation
251
model discussed in Chapter 3 was adapted in order to represent the response of the laboratory scale MG, particularly in what concerns SMA Sunny Island 5048® inverters. As previously discussed these inverters incorporate a frequency restoration functionality, which was implemented in the simplified model through a PI controller responsible for correcting frequency deviation. The parameters were adjusted using an iterative procedure based on trial and error and according to the records resulting from several islanding tests. Based on the results from the simplified model, the algorithm defines the total load and EV active power required to connect/disconnect. The dispatch of the loads connected to the system is performed an additional algorithm according to the availability of flexible loads to participate in the operation of the system.
As discussed in 3.7.2, when an islanding is detected the MG islanded operation algorithm will be enabled, starting by activating the centralized secondary frequency control module. Then, the algorithm will continuously monitor the system in order to detect additional disturbances affecting the security of autonomous operation. If the MG is stable the algorithm will verify if there is sufficient reserve capacity to restore the initial state of the loads participating in temporary load control. Otherwise, if additional disturbances occur the algorithm may schedule additional load and EV control or as last resource disconnect consumers’ premises or reduce the MS power.
Figure 6.16. Architecture of the MG energy balance algorithms implemented at MGCC.

Chapter 6 – Experimental Validation of MicroGrid Emergency Operation
252
6.2.2.3 Implementation of MG restoration Procedure The MG restoration procedure proposed in Chapter 3 consists of an automatic sequence of actions enabling the connection of the EV, MS and loads and the reconnection to the upstream network. The algorithm was implemented using Python 2.7® programming language interacting with MG local controllers (directly or through the SM) and the SCADA system, in order to enable the remote electric configuration of the LV network.
The procedure starts by ensuring that all the MG resources are disconnected and that the system can be reenergized at no load conditions. Before starting the reconnection of loads and MS, the EV bidirectional charger prototype will be allowed to reconnect to the system with a zero power set-point. The MGCC sends to the VC the initial droop parameters and will enable the EV charging when the system rebuilding is stabilized. After starting the rebuilding phase, the algorithm enables the centralized secondary frequency control algorithm, in order to compensate the energy provided by the battery bank. When the MV network becomes available (by closing the interconnecting switch), the SMA Sunny Island 5048® start the synchronization algorithm automatically.
6.3 Experimental Tests The MG software control modules developed and integrated in the experimental MG test platform were subjected to extensive testing envisioning proof-of-concept of the emergency control strategies proposed in this thesis. In addition to preliminary testing of the controllers, three main experiments were conducted:
• Experiment 1 ‒ Validation of MG islanding operation considering the EV participation in MG primary frequency control through f-P droop characteristic and the centralized frequency control algorithm, where the 4PQ inverter emulates the dynamic response of a SSMT.
• Experiment 2 ‒ Validation of emergency load control strategy and energy balance algorithms.
• Experiment 3 ‒ Validation of MG restoration procedure integrating the active participation of EV.
Although the experimental campaigns that were performed do not focus the operational performance of the MG regarding the voltage balancing problem, they consider a three-phase four-wire system operation under unbalanced conditions. Therefore, the obtained results are also important regarding the validation of the proposed solutions under such conditions.
For each test a different MG configuration was adopted, involving the following electric equipment:
• The 3 kW PV inverter and the micro-WT prototypes were connected to phase A of the test systems. For testing purposes the PV inverter prototype was connected to a DC voltage source, avoiding the introduction of additional disturbances caused by the variability of PV panels output.
• Single-phase bidirectional EV charger prototype connected to a bank of lithium-ion batteries (128 cells, 3V per cell, 40 Ah) and the associated BMS.

Chapter 6 – Experimental Validation of MicroGrid Emergency Operation
253
• The 4PQ inverter controlled in order to emulate a SSMT and provide secondary generation reserve.
• The two three-phase groups of SMA Sunny Island 5048® battery inverters, named hereafter as VSI 1 and VSI 2, in order to enable the islanded tests as well as the implementation of the restoration procedure. Only one group was used regarding the MG islanding operation tests. The second group was introduced in experiment 3 for MG restoration procedure, as a controllable MS with black start capability.
• Two three-phase-four-wire LV cables simulators (100A and 50A nominal current) with a nominal resistance of 0.3 Ω and 0.6 Ω, respectively (per phase and neutral).
• Two controllable resistive load banks (CL1 and CL2, with 27 kW of nominal power consumption each) and the SML.
The grid topology, testing scenarios and procedures are presented in the next sections, for a better understanding of the results. The test procedures were programmed in Python 2.7® programming language, enabling the comparison between different test conditions.
As previously explained in Chapter 2, the electrical configurations used in each experiment were realized through an electric panel, whose connection points are duly instrumented with power analysers Janitza UGM 103® (measurement uncertainty of 0.2 for phase voltages and 0.5 for line currents). These devices have a RS485 communication interface with Modbus/RTU slave protocol. The measurements are collected with a sampling time of 500 ms and are saved for offline analysis. For analysing fast frequency and power transients during MG islanded operation the power quality analyser Fluke 1760TR® is used (in continuous recording mode, with an average sampling time of 10ms).
6.3.1 Experiment 1 – MicroGrid Islanding Operation The experimental validation of MG islanding operation has two main objectives. First, the experiment aimed at demonstrating this MG operation state as well as the transition to it, and the contribution provided by the active participation of EV in primary frequency control. The second objective of this experiment is related to the validation of the secondary frequency control algorithm during MG islanding operation during load following conditions. In order to achieve these objectives, two sets of tests were performed:
• Validation of EV participation in MG primary frequency control. In this case the secondary frequency control was not considered, being the MG primary and secondary frequency regulation ensured by SMA Sunny Island 5048® inverters and supported by the participation of EV bidirectional charger prototype in primary frequency regulation.
• Validation of centralized secondary frequency control algorithm. The second tests were focused on the validation of the secondary frequency control algorithm, considering the operation of the 4PQ inverter as a storage unit (PQ controlled) and emulating a SSMT.

Chapter 6 – Experimental Validation of MicroGrid Emergency Operation
254
6.3.1.1 Test System The experimental MG topology represented in Figure 6.17 was adopted, including the PV and the micro-WT inverter prototypes, the EV bidirectional charger prototype, one 27 kW resistive load bank (CL2) and the 4PQ inverter. The three-phase group of SMA Sunny Island 5048® inverters (VSI 1) is connected to node 1. When operating in normal conditions, loads are supplied directly from the main grid. When the grid is disconnected, the SMA Sunny Island 5048® inverter ensures power balance and the MG voltage and frequency regulation.
Figure 6.17. Experiment 1‒MG test system for MG islanded operation.
6.3.1.2 Validation of EV Participation in MG Primary Frequency Control The experimental tests starts with the MG test system interconnected to the main grid. At the beginning of the experiment the MG was importing about 10 kW from the upstream network. CL2 is operating as a three-phase balanced load consuming about 10 kW and the EV charger prototype is operating at approximately 1.5 kW, connected to phase A of the system. Regarding generation, the 4PQ power output is maintained at 3 kW throughout the entire test. In the beginning of the experiment, the PV and micro-WT inverters are connected to phase A of the system with a zero power output. The experimental procedure was as follows:
1. At t=0s the MG is operating interconnected to the MG. 2. At t=85s, the LV contactor connecting VSI 1 to node 1 was opened causing the MG
islanding. 3. At t=200s, the CL2 load is disconnected. 4. At t=265s CL2 is reconnected. 5. At t=295s PV and micro-WT power output is increased to 3kW.
0.4 kV
TRAFO 400kVA
Node 1
Node 2
Node 3
Node 4
VSI 1
LV 100
WT
PV
EV
LV 50
4PQ CL2
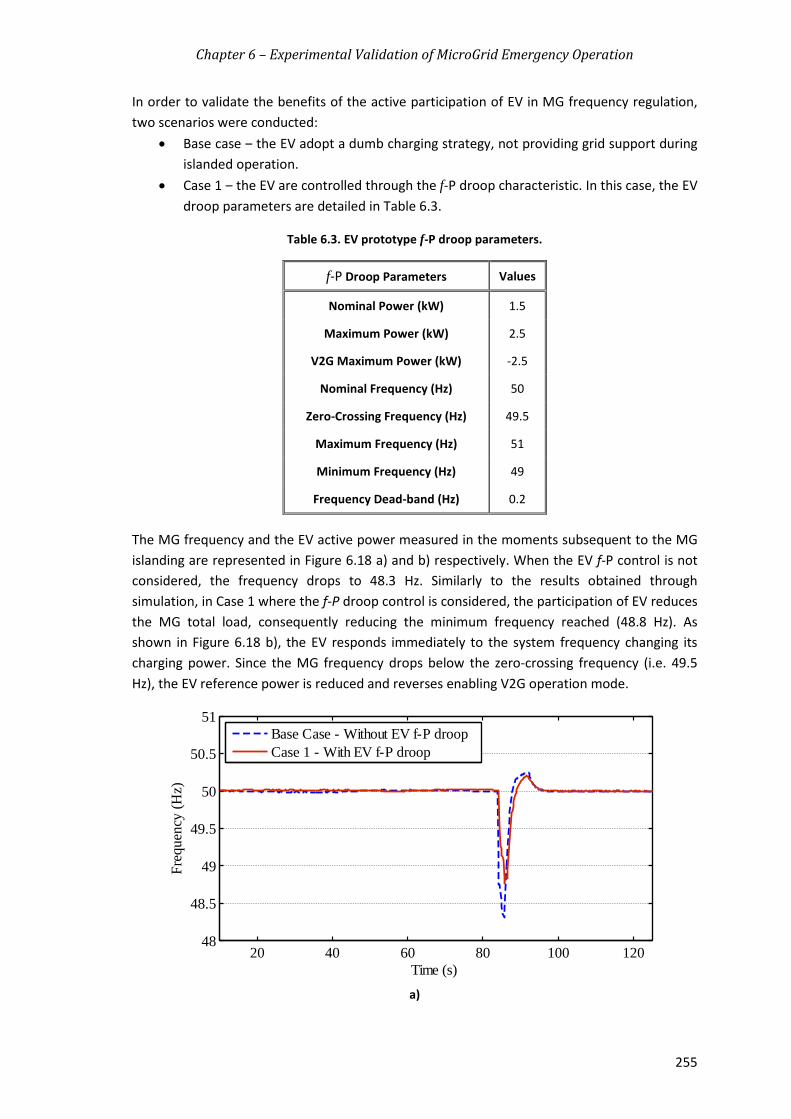
Chapter 6 – Experimental Validation of MicroGrid Emergency Operation
255
In order to validate the benefits of the active participation of EV in MG frequency regulation, two scenarios were conducted:
• Base case ‒ the EV adopt a dumb charging strategy, not providing grid support during islanded operation.
• Case 1 ‒ the EV are controlled through the f-P droop characteristic. In this case, the EV droop parameters are detailed in Table 6.3.
Table 6.3. EV prototype f-P droop parameters.
f-P Droop Parameters Values
Nominal Power (kW) 1.5
Maximum Power (kW) 2.5
V2G Maximum Power (kW) -2.5
Nominal Frequency (Hz) 50
Zero-Crossing Frequency (Hz) 49.5
Maximum Frequency (Hz) 51
Minimum Frequency (Hz) 49
Frequency Dead-band (Hz) 0.2
The MG frequency and the EV active power measured in the moments subsequent to the MG islanding are represented in Figure 6.18 a) and b) respectively. When the EV f-P control is not considered, the frequency drops to 48.3 Hz. Similarly to the results obtained through simulation, in Case 1 where the f-P droop control is considered, the participation of EV reduces the MG total load, consequently reducing the minimum frequency reached (48.8 Hz). As shown in Figure 6.18 b), the EV responds immediately to the system frequency changing its charging power. Since the MG frequency drops below the zero-crossing frequency (i.e. 49.5 Hz), the EV reference power is reduced and reverses enabling V2G operation mode.
a)
20 40 60 80 100 12048
48.5
49
49.5
50
50.5
51
Time (s)
Freq
uenc
y (H
z)
Base Case - Without EV f-P droopCase 1 - With EV f-P droop
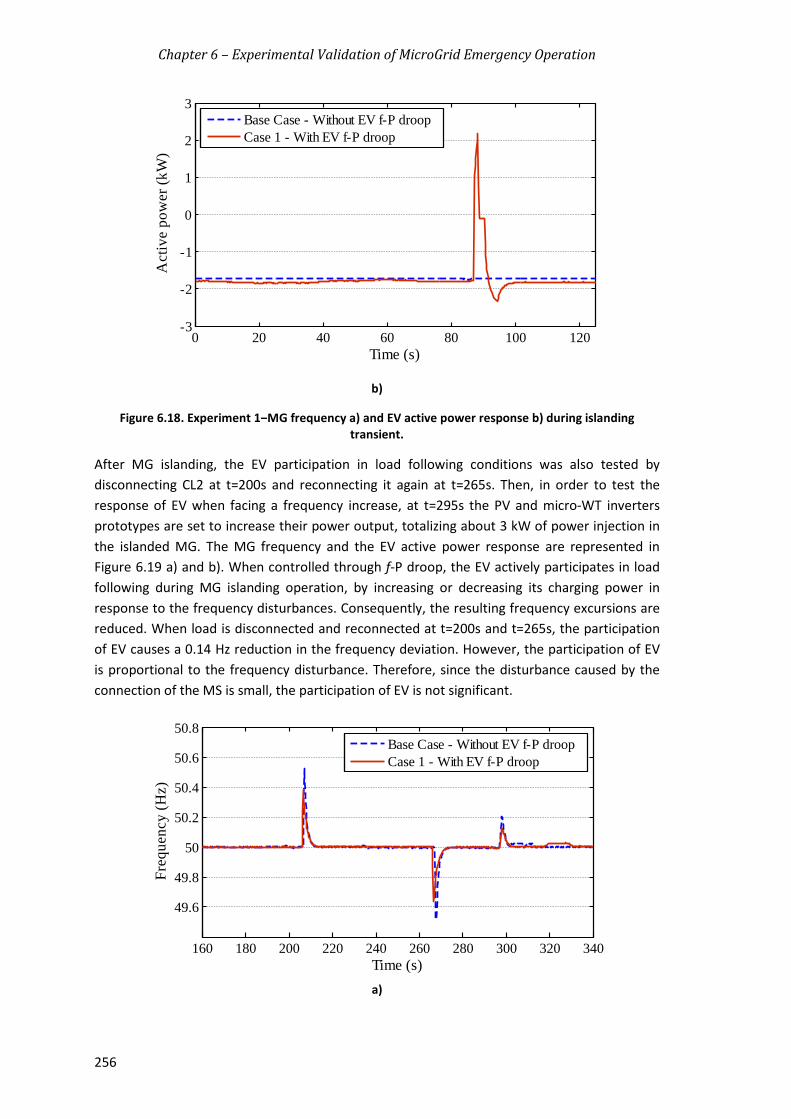
Chapter 6 – Experimental Validation of MicroGrid Emergency Operation
256
b)
Figure 6.18. Experiment 1‒MG frequency a) and EV active power response b) during islanding transient.
After MG islanding, the EV participation in load following conditions was also tested by disconnecting CL2 at t=200s and reconnecting it again at t=265s. Then, in order to test the response of EV when facing a frequency increase, at t=295s the PV and micro-WT inverters prototypes are set to increase their power output, totalizing about 3 kW of power injection in the islanded MG. The MG frequency and the EV active power response are represented in Figure 6.19 a) and b). When controlled through f-P droop, the EV actively participates in load following during MG islanding operation, by increasing or decreasing its charging power in response to the frequency disturbances. Consequently, the resulting frequency excursions are reduced. When load is disconnected and reconnected at t=200s and t=265s, the participation of EV causes a 0.14 Hz reduction in the frequency deviation. However, the participation of EV is proportional to the frequency disturbance. Therefore, since the disturbance caused by the connection of the MS is small, the participation of EV is not significant.
a)
0 20 40 60 80 100 120-3
-2
-1
0
1
2
3
Time (s)
Act
ive
pow
er (k
W)
Base Case - Without EV f-P droopCase 1 - With EV f-P droop
160 180 200 220 240 260 280 300 320 340
49.6
49.8
50
50.2
50.4
50.6
50.8
Time (s)
Freq
uenc
y (H
z)
Base Case - Without EV f-P droopCase 1 - With EV f-P droop
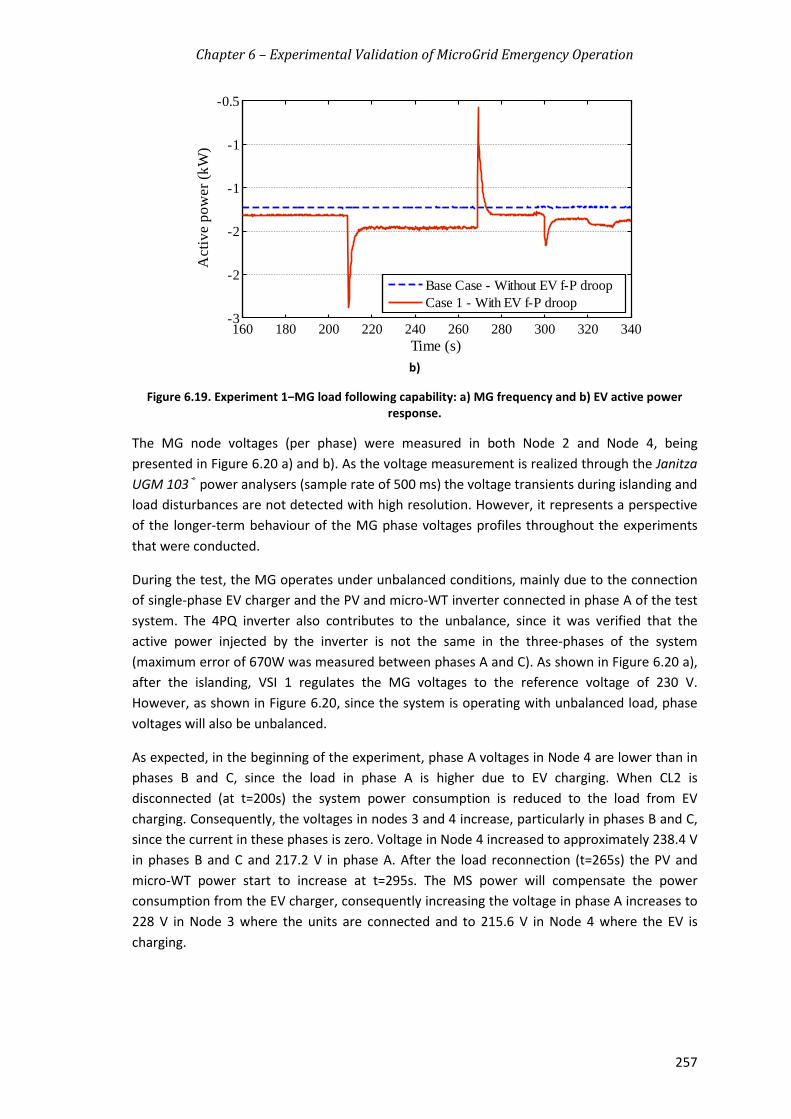
Chapter 6 – Experimental Validation of MicroGrid Emergency Operation
257
b)
Figure 6.19. Experiment 1‒MG load following capability: a) MG frequency and b) EV active power response.
The MG node voltages (per phase) were measured in both Node 2 and Node 4, being presented in Figure 6.20 a) and b). As the voltage measurement is realized through the Janitza UGM 103® power analysers (sample rate of 500 ms) the voltage transients during islanding and load disturbances are not detected with high resolution. However, it represents a perspective of the longer-term behaviour of the MG phase voltages profiles throughout the experiments that were conducted.
During the test, the MG operates under unbalanced conditions, mainly due to the connection of single-phase EV charger and the PV and micro-WT inverter connected in phase A of the test system. The 4PQ inverter also contributes to the unbalance, since it was verified that the active power injected by the inverter is not the same in the three-phases of the system (maximum error of 670W was measured between phases A and C). As shown in Figure 6.20 a), after the islanding, VSI 1 regulates the MG voltages to the reference voltage of 230 V. However, as shown in Figure 6.20, since the system is operating with unbalanced load, phase voltages will also be unbalanced.
As expected, in the beginning of the experiment, phase A voltages in Node 4 are lower than in phases B and C, since the load in phase A is higher due to EV charging. When CL2 is disconnected (at t=200s) the system power consumption is reduced to the load from EV charging. Consequently, the voltages in nodes 3 and 4 increase, particularly in phases B and C, since the current in these phases is zero. Voltage in Node 4 increased to approximately 238.4 V in phases B and C and 217.2 V in phase A. After the load reconnection (t=265s) the PV and micro-WT power start to increase at t=295s. The MS power will compensate the power consumption from the EV charger, consequently increasing the voltage in phase A increases to 228 V in Node 3 where the units are connected and to 215.6 V in Node 4 where the EV is charging.
160 180 200 220 240 260 280 300 320 340-3
-2
-2
-1
-1
-0.5
Time (s)
Act
ive
pow
er (k
W)
Base Case - Without EV f-P droopCase 1 - With EV f-P droop

Chapter 6 – Experimental Validation of MicroGrid Emergency Operation
258
a)
b)
Figure 6.20. Experiment 1‒MG voltage during islanding test in: a) node 2 and b) node 4.
6.3.1.3 Validation of Secondary Frequency Control Algorithm As previously mentioned, SMA Sunny Island 5048® inverters are able to provide both primary and secondary frequency regulation. However, after correcting frequency deviation, the inverter continues to provide the necessary power to the islanded MG in order to balance load and generation. Under a SMO strategy, the rational that has been followed for frequency control leads to a solution where the power to be injected by the energy storage device should be zero at steady state conditions. In this sense, the centralized secondary frequency control algorithm that was implemented dispatches the 4PQ inverter in order to compensate the power injected by the SMA Sunny Island 5048® inverters. The algorithm was tested considering the system presented in Figure 6.17.
In order to demonstrate the effectiveness of the algorithm two tests were performed: first considering the emulation of a storage unit and a second where the 4PQ emulates the dynamic response of a SSMT.
4PQ operating as a power controlled storage unit The first experimental campaign that was performed for the validation of the secondary frequency control considers that the 4PQ unit is operating as a controllable storage unit (coupled to a grid-tied inverter). Therefore, after receiving the new active power set-point
70 90 110 130 150 170 190 210 230 250 270 290 310 330230
232
234
236
238
240
242
Time (s)
Vol
tage
(V)
VAVBVC
70 90 110 130 150 170 190 210 230 250 270 290 310 330210
220
230
240
250
260
Time (s)
Vol
tage
(V)
VAVBVC

Chapter 6 – Experimental Validation of MicroGrid Emergency Operation
259
from the MGCC, the 4PQ unit responds by changing its power in small steps (approximately 1 kW each 3s).
The initial conditions of the experiments are the same ones previously considered. During islanded operation the MG supplies a total of 11.5 kW to CL2 and to the EV charger. The 4PQ is supplying about 3 kW of power. The experimental procedure was conducted as follows:
1. At t=0s the MG is operating in islanding conditions. 2. At t=80s the secondary frequency control is enabled at the MGCC. 3. At t=130s the CL2 load is disconnected. 4. At t=210s CL2 is reconnected. 5. At t=285s PV power output is increased to 1.5 kW. 6. At t=333s the main grid becomes available and the islanded MG synchronizes with
upstream network.
In order to demonstrate the effectiveness of the centralized secondary control algorithm, the experimental procedure was conducted considering the following distinct cases:
• Base case ‒ the secondary control algorithm was not considered. • Case 1 ‒ the secondary control algorithm is enabled at t=80s.
The active power response of the 4PQ is represented in Figure 6.21 and compared to the active power response of the SMA Sunny Island 5048® inverter (VSI), when considering the secondary control algorithm. Positive active power values refer to the active power injected by SMA Sunny Island 5048® inverters and by the 4PQ. After MG islanding, the 4Q inverter dispatch is activated at t=80s and then the algorithm will respond to the transients caused by CL2 disconnection (about 10 kW) at t=130s and reconnection (t=210s). When considering the secondary regulation, the 4PQ inverter starts increasing its power output at t=80s in order to compensate the 10 kW of load connected to the MG. On the contrary, at t = 130 s when there is an excess of generation due to the loads disconnection, the 4PQ inverter reduces its power output in order to reduce the power absorbed by VSI.
Figure 6.21. Experiment 1 ‒ Active power response of the SMA Sunny Island 5048® and 4PQ to secondary frequency control.
50 75 100 125 150 175 200 225 250 275 300 325 350-10
-5
0
5
10
15
Time (s)
Act
ive
pow
er (k
W)
VSI4PQ
Secondary Control enabled

Chapter 6 – Experimental Validation of MicroGrid Emergency Operation
260
Figure 6.22 a) and b) compare the MG frequency and VSI active power response for the Base case and Case 1. Regarding MG frequency, since the SMA Sunny Island 5048® are capable of permanently correcting frequency deviation, it is possible to observe only small oscillations caused by the 4PQ active power response, being possible to observe similar frequency responses in both cases. However, as shown in Figure 6.22 b), the SMA Sunny Island 5048® inverter was discharging and charging in order to maintain the power balance between the local generation and loads. The implementation of secondary control algorithm enabled the dispatch of the 4PQ in order to ensure secondary frequency regulation and avoid continuous charging/discharging of the VSI battery bank. The MG starts the synchronization process with the main grid at t=333 s. As represented in Figure 6.22 a), the SMA Sunny Island 5048® battery inverters (VSI) introduce a small frequency deviation in order to facilitate the synchronization process. The synchronization process ends at t=350s with the reconnection of the MG to the main grid.
a)
b)
Figure 6.22. Experiment 1 ‒ Active power injected by the SMA Sunny Island 5048® with and without secondary frequency control.
4PQ emulating the dynamic response of a SSMT A second test was performed considering the participation of 4PQ unit emulating the dynamic response of a SSMT. As previously discussed, the SSMT model was implemented in
50 75 100 125 150 175 200 225 250 275 300 325 350
49.4
49.6
49.8
50
50.2
50.4
Time (s)
Freq
uenc
y (H
z)
Base Case - Without Secondary ControlCase 1 - With Secondary Control
50 75 100 125 150 175 200 225 250 275 300 325 350-10
-5
0
5
10
15
Time (s)
Act
ive
pow
er (k
W)
Base Case - Without Secondary ControlCase 1 - With Secondary Control

Chapter 6 – Experimental Validation of MicroGrid Emergency Operation
261
MATLAB®/Simulink® and is set to run online in order to modulate the active power response of the 4PQ with respect to the power set-points defined by the secondary frequency control running at the MGCC level. In this case only CL2 was considered in addition to the 4PQ.
The experimental procedure was conducted as follows: 1. At t=0s the MG is operating interconnected with the upstream grid. 2. At t=4s the MG is disconnected from the main grid and secondary frequency control is
enabled. 3. At t=65s the CL2 load increases from 3.5 kW to 10 kW. 4. At t=145s CL2 load decreases to 3.5 kW. 5. At t=238s the main grid becomes available and the VSI start the synchronization
process. Secondary frequency control is disabled. 6. At t=333s the MG synchronizes with the main grid.
Before islanding the MG was importing approximately 2 kW, since the 4PQ inverter is only injecting about 2 kW to supply 3.5 kW of load (the system losses are about 500 W). At t=4s, the islanding occurs and the MG frequency drops to 49.68 Hz, recovering to 50 Hz after approximately 7s, as in Figure 6.23. The secondary frequency algorithm is enabled immediately after the islanding is detected, sending the new power set-point of 4.5 kW to the 4PQ. The active power response of the 4PQ emulating the SSMT is represented in Figure 6.24 and compared to the power response of the VSI. The SSMT takes about 36s to stabilize in the new power output (4.5 kW), compensating the power that was being provided by the VSI. When CL2 load is increased to 10 kW at t=65s the VSI injects a maximum of 6.5 kW in order to compensate the additional load. However, since the secondary frequency control is active, the 4PQ responds to a new dispatch increasing its power output to 10 kW. Consequently, at t=106s the VSI power is within the considered dead-band (about 800 W). Similarly, when CL2 is disconnected the 4PQ dispatch compensates for exceeding generation, avoiding overcharging the batteries. When the main grid becomes available at t=238 s the secondary frequency control is disabled and VSI automatically starts the synchronization process. SMA Sunny Island 5048®introduce a small frequency deviation in order to facilitate the synchronization process.
Figure 6.23. Experiment 1 ‒ MG frequency with secondary frequency control and SSMT emulation.
0 50 100 150 200 250 300
49.6
49.8
50
50.2
50.4
Time (s)
Freq
uenc
y (H
z)

Chapter 6 – Experimental Validation of MicroGrid Emergency Operation
262
Figure 6.24. Experiment 1 ‒ Active power response of VSI and 4PQ emulating a SSMT.
6.3.2 MicroGrid Energy Balance Management The validation of the emergency load control strategy and MG energy balance was performed considering the test system represented in Figure 6.25. The laboratory MG setup consists of a three-phase four-wire implementation with three nodes: the secondary side of the MV/LV substation (Node 1), the node where the SMA Sunny Island 5048® inverter (VSI 1) is connected (Node 2) and a generic consumer node (node 3). A LV cable emulator with a nominal resistance of 0.3 Ω is used to interconnect nodes 2 and 3.
Figure 6.25. Experiment 2 ‒ Test system for MG islanding with emergency load control.
0 50 100 150 200 250-10
-5
0
5
10
Time (s)
Act
ive
pow
er (k
W)
VSI4PQ
0.4 kV
TRAFO 400kVA
Node 1
Node 2
Node 3
VSI 1
CL2 CL14Q
LV 100
WT PV EV SML

Chapter 6 – Experimental Validation of MicroGrid Emergency Operation
263
MG load and generation resources are connected to node 3. Regarding MS, both the PV and micro-WT inverter prototypes were considered. The 4PQ converter was set to emulate the typical dynamic response of a SSMT and will participate in the centralized secondary frequency control. The 4PQ was considered to have a maximum capacity of 10 kW and minimum power output of 4 kW. Regarding loads, CL1, CL2 and the 6 kW SML were considered. However, only CL1 and CL2 will participate in temporary or permanent load control. The SML was operated as a three phase constant power load. The EV bidirectional charger is connected to node 3 charging at 1.5 kW. The EV f-P droop control was disabled, in order to study the effectiveness of the participation of the load in MG frequency control.
Three scenarios were adopted to demonstrate the effectiveness of the control strategies that were previously discussed in Chapter 3 and tested through simulation in Chapter 5. In the first two scenarios the disturbance under analysis is an unplanned islanding considering that: in 1) the MG is importing power from the MV network and in 2) the MG was exporting power to the upstream grid. In Scenario 3, the MG is islanded, considering the islanding conditions resulting from Scenario 2.
When operating interconnected to the upstream grid, the load and EV emergency scheduling algorithm will be activated in order to define an emergency load and EV control solution. As discussed previously, the simplified dynamic model (represented in Figure 3.19) is used in order to evaluate the MG resilience conditions following the islanding transient. The model discussed in Chapter 3 was adapted in order to represent the response of the experimental MG setup. The VSI control was enhanced in order to incorporate the frequency restoration functionality of SMA Sunny Island 5048® inverters. The parameters were adjusted according to experimental results.
6.3.2.1 Scenario 1– MG Importing Power from the MV Network In the beginning of the experiment the MG was connected to the upstream grid and was importing approximately 9.5 kW of active power, considering the system losses and voltage conditions during the test. The MG was supplying a total of 13 kW of load and the 4PQ inverter was operating as an SSMT emulator, while producing approximately 4 kW of active power. CL1 and CL2 were considered for load control purposes, while the SML operates as a constant load. The initial conditions of the experiment are summarized in Table 6.4.
Table 6.4. MG scenario 1 – Initial operating conditions.
Type of connection Active Power (kW)
SML Three-phase 4
CL1 Three-phase 3.5
CL2 Three-phase 3.5
EV Phase A 2
4PQ Three-phase 4
WT Phase A 0
PV Phase A 0

Chapter 6 – Experimental Validation of MicroGrid Emergency Operation
264
The MG load and EV emergency scheduling algorithm is activated after starting the experiment to define the most adequate strategy for an eventual islanding. Since the MG was importing about 10 kW of power, having only 6kW of generation reserve, the load and EV emergency scheduling algorithm defined the permanent disconnection of 4 kW of load. Considering the load available for control, CL1 is dispatched to disconnect following the islanding transient. Based on this initial solution the MG simplified model is simulated in MATLAB®/Simulink®, estimating a minimum frequency excursion of 49.27 Hz. For demonstration purposes, the minimum admissible frequency limit was set to 49.5 Hz. Therefore, the algorithm defines an additional temporary load shedding of 3.5 kW, in order to compensate for the time constant associated to the dynamic response of the emulated SSMT.
Figure 6.26 shows the MG frequency response determined by the MATLAB®/Simulink® model comparing three cases:
• Base case load control is not considered. • Case 1 considering CL1 permanent shedding. • Case 2 considering the permanent and temporary load shedding of CL1 and CL2
respectively.
The MG islanding occurs at t=65s. In the Base case where no load shedding is considered, the minimum frequency estimated is 48.87 Hz. As shown in Figure 6.26, the frequency excursion estimated during the islanding transient is reduced as the amount of load disconnection increases: 49.26 Hz in Case 1 and 49.45 Hz in Case 2.
The same three cases were tested in the MG laboratory setup. As shown in Figure 6.27, the results obtained in the experiment are similar to the ones obtained with the simplified dynamic model. Differences between the results occur due to the small delays in load shedding and due to the resistive loads whose power consumption varies with the system voltage.
Figure 6.26. Experiment 2 ‒ MG estimated frequency (simplified MG model) for scenario 1.
60 65 70 75 80 85 90 95 100 105 110 115 120
49
49.2
49.4
49.6
49.8
50
50.2
Time (s)
Freq
uenc
y (H
z)
Base CaseCase 1Case 2
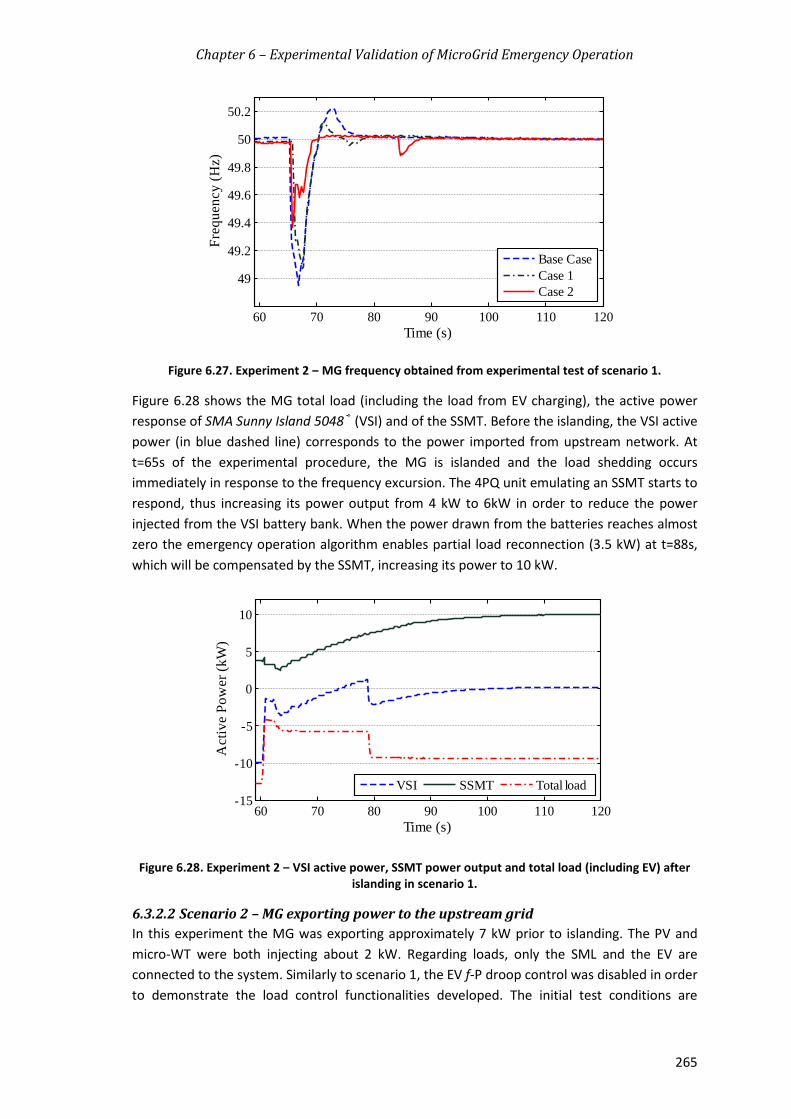
Chapter 6 – Experimental Validation of MicroGrid Emergency Operation
265
Figure 6.27. Experiment 2 ‒ MG frequency obtained from experimental test of scenario 1.
Figure 6.28 shows the MG total load (including the load from EV charging), the active power response of SMA Sunny Island 5048® (VSI) and of the SSMT. Before the islanding, the VSI active power (in blue dashed line) corresponds to the power imported from upstream network. At t=65s of the experimental procedure, the MG is islanded and the load shedding occurs immediately in response to the frequency excursion. The 4PQ unit emulating an SSMT starts to respond, thus increasing its power output from 4 kW to 6kW in order to reduce the power injected from the VSI battery bank. When the power drawn from the batteries reaches almost zero the emergency operation algorithm enables partial load reconnection (3.5 kW) at t=88s, which will be compensated by the SSMT, increasing its power to 10 kW.
Figure 6.28. Experiment 2 ‒ VSI active power, SSMT power output and total load (including EV) after islanding in scenario 1.
6.3.2.2 Scenario 2 – MG exporting power to the upstream grid In this experiment the MG was exporting approximately 7 kW prior to islanding. The PV and micro-WT were both injecting about 2 kW. Regarding loads, only the SML and the EV are connected to the system. Similarly to scenario 1, the EV f-P droop control was disabled in order to demonstrate the load control functionalities developed. The initial test conditions are
60 70 80 90 100 110 120
49
49.2
49.4
49.6
49.8
50
50.2
Time (s)
Freq
uenc
y (H
z)
Base CaseCase 1Case 2
60 70 80 90 100 110 120-15
-10
-5
0
5
10
Time (s)
Act
ive
Pow
er (k
W)
VSI SSMT Total load

Chapter 6 – Experimental Validation of MicroGrid Emergency Operation
266
described in Table 6.5. In this test CL1 and CL2 are disconnected but available to participate in load control.
Table 6.5. MG scenario 2 – Initial operating conditions.
Type of connection Active Power (kW)
SML Three-phase 3
CL1 Three-phase 0
CL2 Three-phase 0
EV Phase A 1.5
4PQ Three-phase 8
WT Phase A 2
PV Phase A 1.5
A minimum SSMT power of 4 kW was considered. Therefore, prior to the islanding the MG has a total of 4 kW of generation reserve for downward regulation. In the beginning of the test the MG is operating interconnected and the MG energy balance module is activated, enabling the load and EV emergency scheduling algorithm.
Based on the characterization of the MG conditions, the algorithm defines the connection of 4 kW of load, in order to compensate the exceeding power generation and avoid overcharging of VSI battery bank. After defining the initial permanent load control solution the MATLAB®/Simulink® module is activated in order to run the MG simplified model.
As shown in Figure 6.29, the permanent load control solution ensures power balance after the islanding (Estimated 1 green dashed line). However, during the islanding transient the MG frequency would reach a maximum of 50.72 Hz. Since a limit of 50.5 Hz was imposed, the algorithm defines the temporary connection of an additional 3.5 kW.
Figure 6.29. Experiment 2 ‒ Comparison between MG frequency for scenario 2 obtained experimentally and through simulation results.
30 40 50 60 70 80 90
49.8
50
50.2
50.4
50.6
50.8
Time (s)
Freq
uenc
y (H
z)
ExperimentalEstimated 1Estimated 2

Chapter 6 – Experimental Validation of MicroGrid Emergency Operation
267
Considering the availability of CL1 and CL2 for participating in the emergency load control, a total of 7 kW was dispatched to participate in the load control solution: 3.5 kW for the permanent load control and 3.5 kW to be temporarily connected.
In order to validate the solution defined, at t=30s the MG test system is disconnected from the main grid. Figure 6.30 represents the active power response of MG load, SMA Sunny Island 5048® (VSI) and SSMT. After the islanding the load is immediately connected and the secondary control starts to reduce the power from the SSMT emulator. When the SSMT emulator reaches steady state the load is allowed to reconnect. This strategy avoids the MG collapse maintaining VSI power close to zero after 90s of the experiment. As shown in Figure 6.29, the experimental frequency response obtained (blue solid line) is quite similar to the one estimated with the simplified model (red dashed line corresponding to Estimated 2).
Figure 6.30. Experiment 2 ‒ MG power balancing in scenario 2: VSI active power, SSMT power output, renewable based generation and total load (including EV).
6.3.2.3 Scenario 3 – MG Operation during Islanding In this test, the MG is already operating autonomously, considering the operation conditions described in Table 6.6. The 4PQ is already operating at its minimum power (4 kW limit was considered). Therefore, there isn’t sufficient downward regulation reserve to respond to possible disturbances. MG balancing will then rely in load, EV and non-controllable MS connected to the system. The main objective of this test was to validate the MG islanded operation algorithm considering a set of disturbances occurring during islanded operation, namely:
1. At t=0s the MG is operating islanded and the MG islanding algorithm is running. 2. At t=116s CL2 load is disconnected from the MG. 3. At t=156s the EV becomes charged and the SML decreases its power consumption
from 3 kW to 1.5 kW.
The test procedure and the control of MG resources in terms of active power are represented in Figure 6.31. At t=116s when CL2 is disconnected, the 3.5 kW exceeding power is absorbed by the SMA Sunny Island 5048® (VSI). In order to avoid batteries’ overcharging (batteries were
30 40 50 60 70 80 90 100 110 120-15
-10
-5
0
5
10
15
Time (s)
Act
ive
Pow
er (k
W)
VSI SSMT PV + WT Total Load

Chapter 6 – Experimental Validation of MicroGrid Emergency Operation
268
operating with a 99% SOC), the algorithm checks the load availability for control (connection). As CL1 is available for control, the power balancing algorithms enables the connection of CL1 at t=122.5s. The additional load (3.5 kW active power consumption from CL1) reduces power unbalance while maintaining the VSI power within the defined dead-band.
For the second disturbance it was considered that CL1 and CL2 are no longer available to participate in load control. When the EV charging ends at t=156s and the SML decreases its power consumption to 1.5 kW, the VSI absorbs the 3 kW exceeding generation power. Again, in order to avoid excessive battery charging and the disconnection of the VSI, the balancing algorithm checks for available resources. Since only microgeneration is available, the algorithm defines a progressive reduction of the PV and micro-WT power, which will reduce its power from 2 kW to approximately 1 kW. At t=180s the MG power balance is completely restored.
Table 6.6. MG scenario 3 – Initial operating conditions.
Type of connection Active Power (kW)
SML Three-phase 3
CL1 Three-phase 0
CL2 Three-phase 3.5
EV Phase A 1.5
4PQ Three-phase 4
WT Phase A 2
PV Phase A 1.5
Figure 6.31. Active power response of MG resources for scenario 3.
100 110 120 130 140 150 160 170 180 190 200
-4
-2
0
2
4
6
Time (s)
Act
ive
Pow
er (k
W)
VSI CL1+CL2 SML EV PV+WT
EV disconnection and SML power reductionDisconnection of CL2
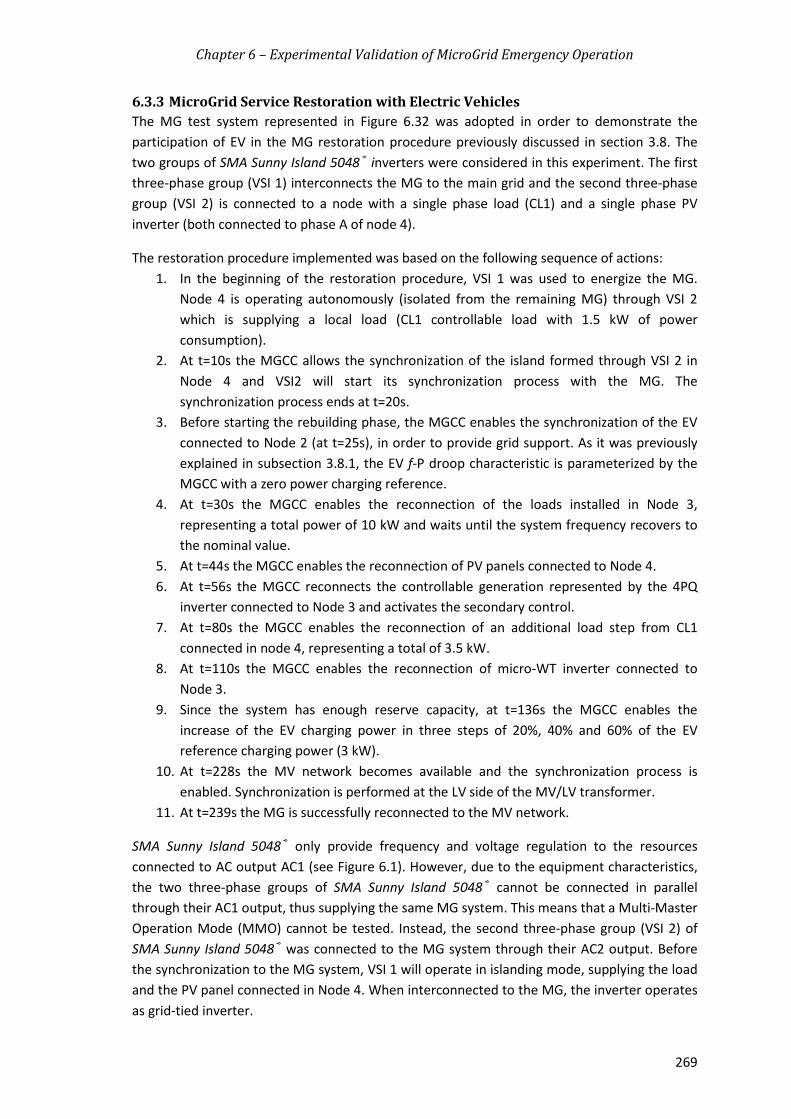
Chapter 6 – Experimental Validation of MicroGrid Emergency Operation
269
6.3.3 MicroGrid Service Restoration with Electric Vehicles The MG test system represented in Figure 6.32 was adopted in order to demonstrate the participation of EV in the MG restoration procedure previously discussed in section 3.8. The two groups of SMA Sunny Island 5048® inverters were considered in this experiment. The first three-phase group (VSI 1) interconnects the MG to the main grid and the second three-phase group (VSI 2) is connected to a node with a single phase load (CL1) and a single phase PV inverter (both connected to phase A of node 4).
The restoration procedure implemented was based on the following sequence of actions: 1. In the beginning of the restoration procedure, VSI 1 was used to energize the MG.
Node 4 is operating autonomously (isolated from the remaining MG) through VSI 2 which is supplying a local load (CL1 controllable load with 1.5 kW of power consumption).
2. At t=10s the MGCC allows the synchronization of the island formed through VSI 2 in Node 4 and VSI2 will start its synchronization process with the MG. The synchronization process ends at t=20s.
3. Before starting the rebuilding phase, the MGCC enables the synchronization of the EV connected to Node 2 (at t=25s), in order to provide grid support. As it was previously explained in subsection 3.8.1, the EV f-P droop characteristic is parameterized by the MGCC with a zero power charging reference.
4. At t=30s the MGCC enables the reconnection of the loads installed in Node 3, representing a total power of 10 kW and waits until the system frequency recovers to the nominal value.
5. At t=44s the MGCC enables the reconnection of PV panels connected to Node 4. 6. At t=56s the MGCC reconnects the controllable generation represented by the 4PQ
inverter connected to Node 3 and activates the secondary control. 7. At t=80s the MGCC enables the reconnection of an additional load step from CL1
connected in node 4, representing a total of 3.5 kW. 8. At t=110s the MGCC enables the reconnection of micro-WT inverter connected to
Node 3. 9. Since the system has enough reserve capacity, at t=136s the MGCC enables the
increase of the EV charging power in three steps of 20%, 40% and 60% of the EV reference charging power (3 kW).
10. At t=228s the MV network becomes available and the synchronization process is enabled. Synchronization is performed at the LV side of the MV/LV transformer.
11. At t=239s the MG is successfully reconnected to the MV network.
SMA Sunny Island 5048® only provide frequency and voltage regulation to the resources connected to AC output AC1 (see Figure 6.1). However, due to the equipment characteristics, the two three-phase groups of SMA Sunny Island 5048® cannot be connected in parallel through their AC1 output, thus supplying the same MG system. This means that a Multi-Master Operation Mode (MMO) cannot be tested. Instead, the second three-phase group (VSI 2) of SMA Sunny Island 5048® was connected to the MG system through their AC2 output. Before the synchronization to the MG system, VSI 1 will operate in islanding mode, supplying the load and the PV panel connected in Node 4. When interconnected to the MG, the inverter operates as grid-tied inverter.

Chapter 6 – Experimental Validation of MicroGrid Emergency Operation
270
Figure 6.32. MG test system for the MG restoration procedure.
Figure 6.33 a) and b) represents the active power response of the resources during the MG restoration procedure in nodes 3 and 4, respectively. In the beginning of the experiment VSI 2 is disconnected from the remaining MG supplying 1.5 kW to CL1. After synchronizing VSI 2 to the MG system, the MGCC enables the connection of EV with zero power consumption. Then it starts the rebuilding process by reconnecting CL2, 4PQ and micro-WT. The 4PQ inverter will also ensure secondary frequency regulation through the centralized algorithm implemented at the MGCC. However, in order to focus the analysis in the participation of EV no specific source was emulated.

Chapter 6 – Experimental Validation of MicroGrid Emergency Operation
271
a)
b)
Figure 6.33. Experiment 3 ‒ Active power of MG resources during MG restoration procedure: a) in Node 3 and b) in Node 4.
Figure 6.34 a) and b) compares the MG frequency response and the EV active power output during the restoration procedure (negative power represents EV charger prototype power absorption from the MG). Similarly to the results obtained through simulation, the participation of EV reduces the frequency disturbances resulting from the reconnection of loads and generation. For example, at t=30s when the load CL2 is reconnected, the EV active power injection of 1.3 kW contributes to reduce the frequency excursion from 49.64 Hz to 49.73 Hz. On the contrary, when the 4-quadrant converter is reconnected at t=56s, the increase of the EV power consumption to 600 W reduced the frequency excursion from 50.24 Hz to 50.1 Hz.
0 20 40 60 80 100 120 140 160 180 200 220 240 257
-10
-5
0
Time (s)
Act
ive
pow
er (k
W)
4PQCL2WT
0 20 40 60 80 100 120 140 160 180 200 220 240 257-4
-2
0
2
4
Time (s)
Act
ive
pow
er (k
W)
VSI2CL1PV

Chapter 6 – Experimental Validation of MicroGrid Emergency Operation
272
a)
b)
Figure 6.34. Experiment 3 ‒ MG restoration procedure with and without f-P droop control: a) frequency response and b) EV active power.
The MG voltages were measured in both Node 3 and Node 4 during MG service restoration as represented in Figure 6.35 a) and b), respectively. In the beginning of the experiment, VSI 1 maintain MG voltages balanced at 232.5 V. Node 4 is islanded from the remaining LV system and VSI 2 is supplying 1.5 kW to CL1 (connected to phase A). However, despite the small unbalance VSI 2 also maintains voltage at 232.5 V.
In Figure 6.35 b) it is possible to observe the impact of the synchronization process between VSI 1 and the MG particularly in Node 4 (at t=10s), which suffers a transient voltage decrease during the process. When CL2 is connected in Node 3, the MG will suffer a voltage drop particularly affecting Node 4, which is connected through a high resistance cable emulator (with approximately 0.6 Ω). VSI 1 regulates MG frequency during islanded operation in order to maintain three-phase voltages close to 230 V. However, VSI 2 is operating in grid connected mode with droop control deactivated. Therefore, the voltage in Node 4 depends on the MG voltages. As the rebuilding procedure continues with the connection of single-phase MS, 4PQ and CL1 load increase, the voltages become more balanced remaining close to 232.5 V in Node 3 and Node 4 (232 V in phase A and 235 in phases B and C).
0 20 40 60 80 100 120 140 160 180 200 220 240 260 280 30049.6
49.8
50
50.2
50.4
Time (s)
Freq
uenc
y (H
z)
Base Case - Without f-P droopCase 1 - With f-P droop
0 20 40 60 80 100 120 140 160 180 200 220 240 260 280 300-2
-1
0
1
2
Time (s)
Act
ive
Pow
er(k
W)
Base Case - With f-P droopCase 1 - Without f-P droop

Chapter 6 – Experimental Validation of MicroGrid Emergency Operation
273
a)
b)
Figure 6.35. Experiment 3 ‒ MG voltages during the MG service restoration test in a) Node 3 and b) Node 4.
6.4 Summary and Main Conclusions This chapter presented the main contributions towards the proof of concept of the MG emergency control strategies proposed in this thesis. The functionalities described in Chapter 3 were implemented and adapted to the existing laboratory infrastructure in order to test their effectiveness in near real world conditions. Additionally, an important achievement of the several experimental campaigns that were conducted is related to the implementation of MG operating scenarios where it was possible to coordinate the coexistence of commercially available equipment and prototype solutions, through the software modules that were implemented and tested.
The first section of this chapter described the implementation of the software prototypes to integrate in MG local and centralized controllers. The laboratory MG system is operated through a hierarchical control architecture implemented according to the solutions proposed in Chapter 3 and previously validated through numerical simulation as discussed in Chapter 5. The local controllers interact with the MG flexible resources, namely controllable and non-controllable MS, responsive loads and EV chargers and enable their active participation in grid
0 20 40 60 80 100 120 140 160 180 200 220 240225
227.5
230
232.5
235
237.5
240
Time (s)
Vol
tage
(V)
VAVBVC
0 20 40 60 80 100 120 140 160 180 200 220 240215
220
225
230
235
240
Time (s)
Vol
tage
(V)
VAVBVC

Chapter 6 – Experimental Validation of MicroGrid Emergency Operation
274
supporting services. The algorithms integrated in the MGCC increase the MG monitoring capability and promote an effective management of MG resources in order to balance the system during autonomous operation.
The second part of this chapter described the main experimental results intended to demonstrate the effectiveness of the proposed control solutions. The experimental results obtained successfully validate the simulation results presented in Chapter 5. The participation of EV in MG frequency regulation during MG islanding and restoration procedure improves MG frequency regulation capacity, decreasing frequency disturbances and leading to a stable autonomous operation. Also, the experimental tests show the importance of integrating controllable MS (such as SSMT) in the secondary frequency regulation, in order to avoid overcharging or discharging the batteries. In addition to the frequency restoration control of SMA Sunny Island 5048® inverters, the centralized algorithm incorporated in MGCC prototype dispatches the 4PQ inverter in order to compensate the active power injected/absorb by the battery bank, minimizing the solicitation from the storage unit.
Regarding the implementation of MG energy balance algorithms, the experimental tests performed demonstrate that the coordination of MG resources based on the system real-time operation conditions improves MG resilience during autonomous operation, by exploiting flexible loads and EV. A Python® module was developed incorporating both load and EV emergency scheduling algorithm and the islanded operation algorithm, which run during interconnected and islanded operation modes, respectively. During interconnected operation, the load and EV emergency scheduling algorithm analysed the MG operating state based in the measurement collected in the laboratory system and determined a solution for load and EV control, which minimize frequency excursions and storage solicitation in the event of an unplanned islanding. Similarly to the results obtained with the MG full model, the simplified model (adapted to the laboratory MG system) accurately estimated the MG frequency. Load dispatch was then sent to the LC, which based on the local frequency measurement disconnected loads during the islanded test. The islanding tests performed incorporating the permanent and temporary participation of loads improve MG primary frequency regulation and help balance local load and generation, supporting storage and EV f-P droop control.
After the islanding transient, the MG islanded operation algorithm continuously monitors the MG in order to evaluate the security of the system. In the tests performed, the effectiveness of the algorithm was tested for a sudden decrease of load. In order to avoid overcharging the batteries, the algorithm mobilized the available generation power from PV and micro-WT in order to reduce the MG total generation and avoid the MG collapse. The tests performed have demonstrated the importance of having flexible generation and load resources, in addition to the MG storage and controllable generation capacity. Active control of EV, load and MS (based on RES) particularly during emergency operation will improve the security and robustness of the MG.
The experimental tests performed demonstrate the successful interaction between the frequency control strategies proposed and implemented in software and hardware prototypes and the MG primary frequency and voltage regulation incorporated in commercial SMA Sunny Island 5048® inverters.

Chapter 6 – Experimental Validation of MicroGrid Emergency Operation
275
Following a worldwide track record on MG research activities, significant demonstrations have been implemented. Within this dissertation, activities related to the implementation of a MG laboratorial infrastructure was also presented aiming the feasibility demonstration of MG operation in grid connected and autonomous mode, while exploiting distinctive control and management solutions for Distributed Energy Resources (DER). The infrastructure is composed of commercially available components, which are complemented by hardware and software prototypes developed in accordance with strategies developed for DER active integration in MG operation. The development and implementation of hierarchical control schemes allows the effective operation of the MG in autonomous conditions. The results described in this chapter reinforce the fact that the coordination between the MG centralized and local control strategies provides additional resources to deal with the increasing integration of DER. The development of laboratorial facilities and test conditions, such as the ones employed in this work, plays an important role in the consolidation of innovative solutions that are the key for a successful development of the smart grid paradigm.


Chapter 7 – Conclusions
277
– Conclusions Chapter 7In this chapter, the main contributions of this thesis for improving MicroGrid (MG) resilience following major system disturbances are clearly identified. Furthermore, the perspectives for future work to be developed are envisaged, regarding the MG emergency control strategies proposed in Chapter 3 and its experimental validation in the Smart Grid and Electric Vehicle Laboratory (SGEVL) available at INESC TEC.
7.1 Main Contributions of the Thesis In the last decade the need for improving distribution system reliability and flexibility, particularly at the Low Voltage (LV) level, led to an increased interest in the development of the MG concept. Energy policies focused on Renewable Energy Sources (RES) and electrification of the transportation sector placed the electricity sector in the centre of energy policy, requiring a change of paradigm in power system operation towards a smarter grid. In order to implement Smart Grid (SG) concepts, major changes are required particularly at the distribution level where the new players, namely microgeneration, Electric Vehicles (EV) and flexible loads are expected to be connected. Under this new paradigm the MG concept provides the adequate framework for the integration of the new SG players, being able to manage the system in order to prevent and solve in real-time operation constraints that might occur (e.g. under or overvoltage problems, congestion problems, among other). More importantly, it is expected that the MG concept enables the development of key self-healing strategies, namely the possibility of operating islanding or implement local bottom-up service restoration procedures following severe disturbances occurring in the power network upstream. Therefore, MG black start capability enables the development of new restoration strategies following a major blackout, through the combination of top-down and bottom-up approaches.
As discussed in Chapter 2, the development of the MG and SG concepts has been the focus of several research projects, from which experimental activities have also been included. Current research and development activities in these topics are focused on experimental validation of concepts, developed either in laboratory scale systems or pilot sites. However, considering the technical challenges associated to MG autonomous operation, further testing was required in order to validate MG emergency operation integrating SG concepts and players.
Ensuring a successful MG operation under emergency operating conditions is quite challenging. The MG is an inverter dominated system, being inertialess due to the absence of synchronous generators. Consequently, when operating autonomously, the system frequency is quite sensitive to the unbalance between loads and generation. Due to the MicroSources (MS) response time constants, the power balance needs to be ensured by fast acting storage units, controlled with specific voltage and frequency strategies. In addition, during emergency operation the MG has to ensure adequate voltage quality levels, despite the fact that LV networks are usually operated under unbalanced conditions due to the uneven distribution of loads, MS and EV by the three phases of the system. Such characteristics, associated to LV

Chapter 7 – Conclusions
278
feeders high resistance and reduced short-circuit power during islanded operation requires the adoption of innovative voltage balancing mechanisms.
The main contributions of this thesis were towards improving MG resilience and stability during emergency operating conditions, exploiting SG new players namely EV and active loads in addition to MS and storage. The innovative control strategies proposed were implemented and successfully tested in the SGEVL at INESC TEC, which is a very relevant outcome of this thesis. The major achievements of this thesis were the following:
• Active integration of EV during MG emergency operation. The EV connected to the MG were controlled in order to provide frequency support through the adoption of a frequency droop (f-P) strategy. The EV f-P control provides high degree of flexibility, reflecting the characteristics of the EV chargers, willingness of EV owners to participate in such services and allowing the coordination with other MG frequency regulation mechanisms (load shedding schemes, availability of energy storage devices and their state of charge) and service restoration procedures. The simulation and experimental results have effectively demonstrated that even when operating under severe unbalanced conditions, the participation of EV in the MG frequency regulation led to a smoother transition to islanding operation following an unplanned islanding. The local response of EV supports the reconnection of loads and MS, reducing the storage solicitation and reducing the necessary time to stabilize the system to nominal frequency. However, the impact on the main storage state of charge will depend on the MG pre-fault load/generation conditions as well as on the number of EV connected to the network.
• Improvement of MG resilience under emergency conditions through the integration of responsive loads. A load control architecture was proposed in order to enable the integration of household appliances in MG emergency control, considering the deployment of smart metering infrastructures and home energy management systems. The control system manages the household energy consumption based on the MG Central Controller (MGCC) load control request, consumers’ preferences and technical limitations of the equipment. Two types of load control were defined: one permanent and another temporary. The permanent load control requires loads to be connected or disconnected until the system generation reserve increases or the MG reconnects with the upstream network. The temporary control was designed to reduce power unbalance during frequency transients, while taking into consideration the need of reducing the amount of load to be shed. Simulation and laboratorial tests have shown that the coordination between EV and active loads brings great benefits, since it reduces the MG unbalance during islanding transient by reducing the power unbalance between load and generation.
• Development of a real-time algorithm for short-term management of MG energy balance during islanded operation. A new MG application was designed to coordinate the MG resources according to MG operating state, in order to ensure seamless transition to islanding mode and manage the local resources during islanded operation. During interconnected operation the algorithm will schedule the minimum load and EV required to participate in load control in order to ensure a secure islanding. The main objective of the tool is to prevent MG collapse after islanding due

Chapter 7 – Conclusions
279
to storage insufficient capacity. The effectiveness of the proposed algorithm was validated through simulation and then implemented and tested through laboratorial experiments. Results have shown the importance of high level management of the MG during emergency operating conditions. In fact, local control strategies designed to provide frequency regulation are only effective if the MG has sufficient storage and generation capacity to stabilize the system frequency and ensure the balance between generation and load. Therefore, real-time monitoring of MG operating conditions enables defining the most adequate strategy (i.e. based on the MG operating state) to ensure a successful islanding and take the necessary control actions to balance microgeneration and loads during islanding operation.
• Development of MG restoration procedure integrating EV as a grid supporting units. Based on the benefits of EV frequency droop strategy, EV were also integrated in MG restoration procedure with the main objective of improving system stability during the rebuilding phase. However, in order to take full benefit of EV load flexibility and storage capacity during the restoration phase, they are proposed to be connected to the network with zero active power reference. The role of the EV in this mode is to support frequency transients following load and MS reconnection. Extensive dynamic simulations demonstrated that the EV active frequency regulation scheme supports the reconnection of the loads and MS, while reducing MG frequency deviations as well as the solicitation from the main storage system. Similar results were obtained in the MG experimental setup presented, thus it is possible to conclude about the feasibility and benefits resulting from the active integration of EV in MG restoration procedures.
• Development and evaluation of voltage balancing strategies for MG operation. Voltage unbalance problem affecting LV networks could compromise MG islanded operation and the success of the service restoration procedure. While it was shown through simulation that the frequency control strategies adopted were effective, even when the system is operated under severe unbalanced conditions, voltage unbalance may lead to the disconnection of some loads such as three-phase inverters or reduce the efficiency of induction machine based loads. In order to mitigate voltage unbalance and avoid the need for additional investments in voltage balancing compensators, a voltage balancing mechanism was incorporated in Voltage Source Inverters (VSI) control. The results presented in Chapter 5 demonstrated that the voltage balancing mechanism eliminates unwanted negative and zero sequence voltage components at the VSI terminals. However, in a network with long and highly resistive feeders the effectiveness of the balancing unit will depend on its distance to the unbalanced load or source. In order to maximize the voltage balancing effect, a methodology has been proposed to derive the best location to perform voltage unbalance compensation. Results have shown that in some cases the installation of an additional VSI with voltage balancing closer to the node with high unbalance is required.
• Laboratory implementation, test and validation of the MG architecture and control strategies. The development of the control functionalities for MG islanding operation and provision of restoration procedures were developed in close coordination with the laboratorial infrastructures, envisioning proof of concept of the developed control strategies. Prototypes of the MG controllers, namely the MGCC and the local

Chapter 7 – Conclusions
280
controllers (i.e. load controller, MS controller and EV controller) were developed, incorporating the proposed control strategies and algorithms. The experimental results obtained and presented in Chapter 6 successfully validated the conclusions initial drawn from simulation studies, demonstrating the effectiveness of MG emergency control in improving MG resilience and stability following severe disturbances.
The work developed within this dissertation brought relevant contributions for the future deployment of MG concept as a controllable cell of the SG, particularly when operating under emergency conditions. The developed MG controllers, incorporating the proposed grid supporting strategies, represent a strong improvement in the current state-of-the-art and a step further towards the deployment of MG systems.
7.2 Future Perspectives The work developed and presented in this thesis focused in MG operation during emergency conditions, considering SG new players such as the EV and active loads. Two main components characterize the research work: one focused on the development and validation through simulation of new control strategies for MG emergency operation and the second phase focused on the implementation and test of such strategies in the SGEVL. Further developments on the MG emergency control strategies as well as its implementation and validation in the laboratory consist of:
• Studying the effectiveness of MG emergency control strategies considering fault conditions prior to the islanding. During emergency operation the MG will isolate from the main grid under severe operating conditions, caused by the occurrence of faults in the main grid. In order to study the MG dynamic behaviour under such conditions, the dynamic models of storage (with and without balancing unit), MS and EV would need to be upgraded, incorporating current limiting characteristics and protection devices. Dynamic loads such as induction motors could be also included in the simulation platform. In order to reduce the risk of failure when moving to islanded operation or during the restoration procedure additional studies regarding the fault-ride-through capability of different microgeneration technologies would also be required.
• Validating emergency load control strategies and the energy balance algorithm for larger time frames and considering specific models and limitations of household appliances. The proposed MG energy balance algorithms support MG islanding operation during short periods of time (i.e. less than 1 hour). For larger time frames of operation in islanding conditions, complementary approaches need to be considered, involving forecasting of loads with different degrees of flexibility (including EV) as well as forecasts for renewable based microgeneration.
• Complementing MG voltage balancing strategies with local voltage control of MS and EV. In order to improve MG voltage quality, the MG voltage balancing mechanisms proposed could be supported by local or centralized voltage control strategies, aiming at changing the active power output of MG resources in order to maintain single-phase voltages within admissible limits. Such controls could improve MG voltage regulation. However, during islanding operation voltage control needs to

Chapter 7 – Conclusions
281
be coordinated with frequency regulation mechanisms, since the active power control of MS, loads and EV will also affect the power balance between local generation and load.
• Implementation and testing of voltage balancing mechanisms. More recently a three-phase four-wire back-to-back inverter was installed in the SGEVL with the possibility of being fully programmable in MATLAB®/Simulink®. The inverters controls can be upgraded in order to incorporate voltage balancing mechanisms and current limits. Therefore, additional islanded and interconnected tests can be performed, in order to study the interaction between voltage balancing mechanisms and local and centralized voltage control strategies. Additionally, this power converter allows the implementation of a power hardware-in-the-loop test bed that can be exploited in order to better characterize and study the performance of voltage balancing control mechanisms.
• Regarding the implementation of emergency load control strategies it is necessary to upgrade the existing Smart Meter (SM) prototype in order to incorporate or interact with a home energy management system, which in turn control home appliances such as water heaters, space heaters, among others. The SM would then send the load availability for control to the MGCC, in order to manage MG energy balance. Microgeneration and load forecasting are being developed at INESC TEC in the context of several research projects, which are to be integrated in the laboratory as well. Therefore, further developments on the energy balance algorithm for larger time-frames could also be implemented and validated experimentally.
The work developed within this dissertation together with the above mentioned future developments provides a valuable contribution towards the development of SG controller prototypes. Further development of the laboratorial infrastructure towards a more near to real environment will contribute to more realistic testing of the software and hardware developed solutions.


References
283
References [1] Communication from the European Commission, "EUROPE 2020 - A strategy for smart,
sustainable and inclusive growth", March 3rd 2010. [Online]. Available: http://ec.europa.eu/news/economy/100303_en.htm[Consulted on April 2014].
[2] "Vision and Strategy for Europe's Electricity Networks of the Future" [Online]. Available: http://www.smartgrids.eu/ [April 2014].
[3] The European Electricity Grid Initiative (EEGI), "Roadmap 2010-18 and Detailed Implementation Plan 2010-12," May 25th 2010, Version V2. [Online]. Available: http://www.smartgrids.eu/ [ April 2014].
[4] "Smart Grids: Strategic Deployment Document for Europe's Electricity Networks of the Future," April 2010. [Online].Available: http://www.smartgrids.eu/ [April 2014].
[5] "Communication from the commission to the European Parliament, the Council, the European economic and social committee and the committee of regions - Energy Roadmap 2050," December 15th 2011. [Online]. Available: http://eur-lex.europa.eu/legal-content/EN/TXT/?uri=CELEX:52011DC0885 [April 2014].
[6] Eurostat, European Environment Agency, "Share of renewable energy in gross final energy consumption," April 2014. [Online]. Available:http://epp.eurostat.ec.europa.eu/portal/page/portal/europe_2020_indicators/headline_indicators [Dec. 2014].
[7] European Renewable energy council (EREC), "EU Roadmap - Mapping Renewable Energy Pathways towards 2020," March 2011. [Online]. Available: http://www.erec.org/media/publications/eu-roadmap.html [Oct. 2014].
[8] J. a. P. Lopes, N. Hatziargyriou, J. Mutale, P. Djapic, and N. Jenkins, “Integrating distributed generation into electric power systems: A review of drivers, challenges and opportunities,” Electric Power Systems Research, vol. 77, no. 9, pp. 1189–1203, Jul. 2007.
[9] P. Djapic, C. Ramsay, D. Pudjianto, G. Strbac, J. Mutale, N. Jenkins, R. Allan, "Taking an active approach," IEEE Power and Energy Magazine, vol.5, no.4, pp. 68-77, July-Aug. 2007.
[10] Goran Strbac, "Demand side management: Benefits and challenges,"Energy Policy, vol. 36, no. 12, pp. 4419-4426, December 2008.
[11] A. Brooks, E. Lu, D. Reicher, C. Spirakis, B. Weihl, "Demand Dispatch," IEEE Power and Energy Magazine, vol.8, no.3, pp.20-29, May-June 2010.
[12] A. Ipakchi, F. Albuyeh, "Grid of the future," IEEE Power and Energy Magazine, vol.7, no.2, pp.52-62, March-April 2009.
[13] J.A. Peças Lopes, F.J. Soares, P.M.R. Almeida, P. C. Baptista, C. M. Silva, T. L. Farias, “Quantification of Technical Impacts and Environmental Benefits of Electric Vehicles Integration on Electricity Grids,” ELECTROMOTION 2009 - 8th International Symposium on Advanced Electromechanical Motion Systems , Lille, France, July 2009.
[14] K.J. Dyke, N. Schofield, M. Barnes, "The Impact of Transport Electrification on Electrical Networks," IEEE Transactions on Industrial Electronics, vol.57, no.12, pp.3917-3926, Dec. 2010.
[15] J.A. Peças Lopes, F.J. Soares, P.M.R. Almeida, "Integration of Electric Vehicles in the Electric Power System", Proceedings of the IEEE, vol.99, no.1, pp.168-183, Jan. 2011.
[16] K. Moslehi, R. Kumar, "A Reliability Perspective of the Smart Grid," IEEE Transactions on Smart Grid, vol.1, no.1, pp.57-64, June 2010.
[17] Jiyuan Fan, S. Borlase, "The Evolution of Distribution," IEEE Power and Energy Magazine, vol. 7, no. 2, pp. 63 - 68, March-April 2009.

References
284
[18] CEN-CENELEC-ETSI Smart Grid Coordination Group, "Smart Grid Reference Architecture", Nov. 2012, version V3. [Online]. Available: http://ec.europa.eu/energy/gas_electricity/ smartgrids/taskforce_en.htm. [May 2014].
[19] Joint Research Center (JRC) - Institute for Energy and Transport, "2011 Technology Map of the European Strategic Energy Technology Plan (SET-Plan)- Technologies Descriptions", 2011. Available at: http://setis.ec.europa.eu/newsroom-items-folder/2011-technology-map-of-the-set-plan-now-available. [May 2014].
[20] European Association for Storage of Energy (AESE) and European Energy Research Alliance (EERA), "European Energy Storage Technology Development Roadmap towards 2030", March 2013. Available: http://www.ease-storage.eu/Technical_Documents.html. [May 2014].
[21] European Research Project ADDRESS. [Online]. Available: http://www.addressfp7.org/ [Oct. 2014].
[22] European Research Project MERGE. [Online]. Available: http://www.ev-merge.eu/ [Oct. 2014].
[23] evolvDSO project ‒Development of methodologies and tools for new and evolving DSO roles for efficient DRES integration in distribution networks. [Online]. Available: http://www.evolvdso.eu/Home/About [Oct. 2014].
[24] ADDRESS Project Deliverable 1.1, “ADDRESS Technical and Commercial Conceptual Architectures”, Oct. 2009. [Online]. Available: http://www.addressfp7.org/ [Nov. 2014].
[25] ADDRESS Project Deliverable 2.1, “Algorithms for aggregators, customers and for their equipment which enables active demand”, May. 2011. [Online]. Available: http://www.addressfp7.org/index.html?topic=config/progress_deliverables [Nov. 2014].
[26] MERGE Project Deliverable 1.2, “Extend concepts of MG by identifying several EV Smart Control Approaches to Embedded in the Smart Grid Concept to Manage EV individually or in clusters”, June 2010. [Online]. Available at: http://www.ev-merge.eu/ [Nov. 2014].
[27] R.H. Lasseter, "Smart Distribution: Coupled Microgrids," Proceedings of the IEEE, vol.99, no.6, pp.1074-1082, June 2011.
[28] J. Peças Lopes, A. G. Madureira, C. Moreira, "A View of Microgrids", Wiley Interdisciplinary Reviews: Energy and Environment, vol.2, no.1, pp.86-103, Janeiro, 2013.
[29] A. G. Madureira, J. Pereira, N. Gil, J. A. Peças Lopes, G. Korres, N. Hatziargyriou, "Advanced Control and Management Functionalities for Multi-MicroGrids," European Transactions on Electrical Power, vol.21, no.2, pp.1159-1177, March, 2011.
[30] "Microgrids Evolution Roadmap - Working Group C6.22," CIGRE Working Group C6.22, 2012.
[31] R. H. Lasseter, “Control of Distributed Resources,” Bulk Power System and Controls IV Conference, August 24-28, 1998, Santorini, Greece.
[32] B. Lasseter, "Microgrids [distributed power generation]," IEEE Power Engineering Society Winter Meeting 2001, vol.1, no., pp.146-149, 28 Jan-Feb 2001.
[33] R. H. Lasseter, A. Akhil, C. Marnay, J Stephens, J Dagle, R Guttromson, A. Meliopoulous, R Yinger, and J. Eto, “The CERTS Microgrid Concept,” White paper for Transmission Reliability Program, Office of Power Technologies, U.S. Department of Energy, April 2002. [Online]. Available: http://certs.lbl.gov/pdf/50829.pdf [Nov. 2014].
[34] Lasseter, R.H., P. Piagi, “Control of small distributed energy resources,” US Patent 7 116 010, Oct. 3, 2006.
[35] J.A. Peças Lopes, C.L. Moreira, A.G. Madureira, “Defining control strategies for MicroGrids islanded operation,” IEEE Transactions on Power Systems, vol.21, no.2, pp. 916- 924, May 2006.
[36] C. L Moreira, F. O. Resende, J. A. P. Lopes, "Using Low Voltage MicroGrids for Service Restoration," IEEE Transactions on Power Systems, vol.22, no.1, pp.395-403, Feb. 2007.

References
285
[37] L. Che, M. Khodayar, M. Shahidehpour, “Only Connect: Microgrids for Distribution System Restoration,” IEEE Power and Energy Magazine, vol. 12, no. 1, pp. 70–81, Jan. 2014.
[38] Electric Power Research institute (EPRI), "Microgrid: A Primer", Draft report, September 2013. Available: http://nyssmartgrid.com/wp-content/uploads/Microgrid_Primer_v18-09-06-2013.pdf. [May 2014].
[39] A. von Jouanne, B. Banerjee, "Assessment of voltage unbalance," IEEE Transactions on Power Delivery, vol.16, no.4, pp.782-790, Oct 2001.
[40] A. G. Madureira, J. C. Pereira, N. J. Gil, J. A. Peças Lopes, “Advanced control and management functionalities for multi-microgrids,” European Transactions on Electrical Power, vol.21, no. 2, January 2010, pp. 1159–1177, March 2011.
[41] F. Katiraei, M.R. Iravani, "Power Management Strategies for a Microgrid With Multiple Distributed Generation Units," IEEE Transactions on Power Systems, vol.21, no.4, pp.1821-1831, Nov. 2006.
[42] J.M. Guerrero, J.C. Vasquez, J. Matas, L.G. de Vicuna, M. Castilla, "Hierarchical Control of Droop-Controlled AC and DC Microgrids—A General Approach Toward Standardization," IEEE Transactions on Industrial Electronics, vol.58, no.1, pp.158-172, Jan. 2011.
[43] European Research Project MICROGRIDS. [Online]. Available: http://www.microgrids.eu/ [May 2014].
[44] Évora InovCity Project - Smart Energy Living. [Online]. Available at: http://www.inovcity.com/pt/ [Nov. 2014].
[45] Project REIVE – Smart Grids with Electric Vehicles [Online]. Available: http://reive.inescporto.pt/en [Jan. 2013].
[46] Fundação para a Ciência e Tecnologia Project “Microgrids+EV: Identification of Control and Management Strategies for Microgrids with Plugged-in Electric Vehicles”, PTDC/EEA-EEL/103546/2008. [Online]. Available: http://www.fct.pt/apoios/projectos/ consulta/vglobal_projecto?idProjecto=103546&idElemConcurso=2767 [June 2012].
[47] N. Hatziargyriou, H. Asano, R. Iravani, C. Marnay, "Microgrids," IEEE Power and Energy Magazine, vol.5, no.4, pp.78-94, July-Aug. 2007.
[48] N.W.A. Lidula, A.D. Rajapakse, “Microgrids research: A review of experimental microgrids and test systems,” Renewable and Sustainable Energy Reviews, vol. 15, no. 1, pp. 186-202, January 2011.
[49] M. Barnes, J. Kondoh, H. Asano, J. Oyarzabal, G. Ventakaramanan, R. Lasseter, N. Hatziargyriou, T. Green, "Real-World MicroGrids-An Overview," IEEE International Conference on System of Systems Engineering, pp.1-8, 16-18 April 2007.
[50] N.W.A. Lidula, A.D. Rajapakse, "Microgrids research: A review of experimental microgrids and test systems," Renewable and Sustainable Energy Reviews, vol. 15, no. 1, pp. 186-202, Jan. 2011.
[51] R.H. Lasseter, J.H. Eto, B. Schenkman, J. Stevens, H. Vollkommer, D. Klapp, E. Linton, H. Hurtado, J. Roy, "CERTS Microgrid Laboratory Test Bed," IEEE Transactions on Power Delivery, vol.26, no.1, pp.325-332, Jan. 2011.
[52] E. Alegria, T. Brown, E. Minear, R.H. Lasseter, "CERTS Microgrid Demonstration With Large-Scale Energy Storage and Renewable Generation," IEEE Transactions on Smart Grid, vol.5, no.2, pp.937-943, March 2014.
[53] MICROGRIDS project Deliverable DH1, "Description of the laboratory micro grids", September 2009. [Online]. Available: http://www.microgrids.eu/micro2000/ [Oct. 2014].
[54] DEMOTEC Laboratory [Online]. Available: http://www.iset.unikassel.de/pls/w3isetdad/ www_iset_new.main_page?p_name=7230090&p_lang=eng [Jan. 2014].
[55] M. Barnes, A. Dimeas, A. Engler, C. Fitzer, N. Hatziargyriou, C. Jones, S. Papathanassiou, M. Vandenbergh, "Microgrid laboratory facilities," 2005 International Conference on Future Power Systems, pp.6-18, 18 Nov. 2005.

References
286
[56] B. Zhao, X. Zhang, and J. Chen, “Integrated Microgrid Laboratory System,” IEEE Transactions on Power Systems, vol. 27, no. 4, pp. 2175–2185, Nov. 2012.
[57] X. Tan, Q. Li, and H. Wang, “Advances and trends of energy storage technology in Microgrid,” International Journal of Electrical Power & Energy Systems, vol. 44, no. 1, pp. 179–191, Jan. 2013.
[58] Bjorn Bolund, Hans Bernhoff, Mats Leijon, “Flywheel energy and power storage systems”, Renewable and Sustainable Energy Reviews, vol. 11, no. 2, Pages 235-258, February 2007.
[59] K. C. Divya and J. Østergaard, “Battery energy storage technology for power systems—An overview,” Electric Power Systems Research, vol. 79, no. 4, pp. 511–520, Apr. 2009.
[60] A. Etxeberria, I. Vechiu, H. Camblong, and J.-M. Vinassa, “Comparison of three topologies and controls of a hybrid energy storage system for microgrids,” Energy Conversion and Management, vol. 54, no. 1, pp. 113–121, Feb. 2012.
[61] M.-E. Choi, S.-W. Kim, and S.-W. Seo, “Energy Management Optimization in a Battery/Supercapacitor Hybrid Energy Storage System,” IEEE Transactions on Smart Grid, vol. 3, no. 1, pp. 463–472, Mar. 2012.
[62] G. Albright, J. Edie, S. Al-Hallaj, "A Comparison of Lead Acid to Lithium-ion in Stationary Storage Applications," white paper published by AllCell Technologies LLC. March; 2012. [Online]. Available: http://www.batterypoweronline.com/main/wp-content/uploads/ 2012/07/Lead-acid-white-paper.pdf. [November 2014].
[63] F. Blaabjerg, R. Teodorescu, M. Liserre, A.V. Timbus, “Overview of Control and Grid Synchronization for Distributed Power Generation Systems," IEEE Transactions on Industrial Electronics, vol.53, no.5, pp.1398-1409, Oct. 2006.
[64] Singh, Bhim; Al-Haddad, K.; Chandra, A., "A review of active filters for power quality improvement," IEEE Transactions on Industrial Electronics, vol.46, no.5, pp.960-971, Oct 1999.
[65] N. Jayawarna, N. Jenkins, M. Barnes, M. Lorentzou, S. Papthanassiou, N. Hatziagyriou, "Safety analysis of a microgrid," 2005 International Conference on Future Power Systems, pp.1-7, 18 Nov. 2005.
[66] T. C. Green and M. Prodanović, “Control of inverter-based micro-grids,” Electric Power Systems Research, vol. 77, no. 9, pp. 1204–1213, Jul. 2007.
[67] Mei Shan Ngan, Chee Wei Tan, "A study of maximum power point tracking algorithms for stand-alone Photovoltaic Systems," 2011 IEEE Applied Power Electronics Colloquium (IAPEC), pp.22-27, 18-19 April 2011.
[68] J. Rocabert, A. Luna, F. Blaabjerg, and I. Paper, “Control of Power Converters in AC Microgrids,” IEEE Transactions on Power Electronics, vol. 27, no. 11, pp. 4734–4749, Nov. 2012.
[69] A. G. Madureira and J. A. Peças Lopes, “Coordinated voltage support in distribution networks with distributed generation and microgrids,” IET Renewable Power Generation, vol. 3, no. 4, p. 439, Dec. 2009.
[70] A.L. Dimeas, N.D. Hatziargyriou, "Operation of a Multiagent System for Microgrid Control," IEEE Transactions on Power Systems, vol.20, no.3, pp. 1447- 1455, Aug. 2005.
[71] N. Hatziargyriou, "The Microgrids Concept" in Microgrids: Architectures and Control 2014, Ed. United Kingdom, John Wiley & Sons Ltd, 2014, ch. 1, pp.1-24.
[72] A. Sá, J. T. Saraiva, "Development of a Market Approach to Integrate Microsources in LV Distribution Networks," Proceedings of PowerTech2005 - IEEE St. Petersburg Power Tech 2005, St. Petersburg, Russia, July 2005.
[73] F. Katiraei, R. Iravani, N. Hatziargyriou, A. Dimeas, "Microgrids management," IEEE Power and Energy Magazine, vol.6, no.3, pp.54-65, May-June 2008.
[74] C.L. Moreira, J.A. Peças Lopes, "MicroGrids Dynamic Security Assessment," ICCEP '07. International Conference on Clean Electrical Power 2007, pp.26-32, 21-23 May 2007.

References
287
[75] ENTSO-E, "Policy One - Load-Frequency Control and Performance" in Operational Handbook, Union for the Co-ordination of Transmission of Electricity (UCTE), June 2004. [Online].Available:https://www.entsoe.eu/fileadmin/user_upload/_library/publications/entsoe/Operation_Handbook/Policy_1_final.pdf [Nov. 2014].
[76] M. C. Chandorkar, S. Member, and M. Deepakraj, “Control of Parallel Connected Inverters in Standalone ac Supply Systems,” vol. 29, no. 1, pp. 136–143, 1993.
[77] A. Arulampalam, M. Barnes, A. Engler, A. Goodwin, N. Jenkins, “Control of power electronic interfaces in distributed generation microgrids,” International Journal of Electronics, vol. 91, no. 9, pp. 503–523, Sep. 2004.
[78] A. Engler, “Applicability of droops in low voltage grids,” DER Journal, no. 1, pp. 1–5, 2005.
[79] J.M. Guerrero, M. Chandorkar, T. Lee, P.C. Loh, “Advanced Control Architectures for Intelligent Microgrids—Part I: Decentralized and Hierarchical Control," IEEE Transactions on Industrial Electronics, vol.60, no.4, pp.1254-1262, April 2013.
[80] Hannu Laaksonen, P. Saari, R. Komulainen, "Voltage and frequency control of inverter based weak LV network microgrid," 2005 International Conference on Future Power Systems, pp.6, 18 Nov. 2005.
[81] K. De Brabandere, B. Bolsens, J. Van den Keybus, A. Woyte, J. Driesen, and R. Belmans, “A Voltage and Frequency Droop Control Method for Parallel Inverters,” IEEE Transactions on Power Electronics, vol. 22, no. 4, pp. 1107–1115, Jul. 2007.
[82] Y. W. Li and C. Kao, “An Accurate Power Control Strategy for Power-Electronics-Interfaced Distributed Generation Units Operating in a Low-Voltage Multibus Microgrid,” IEEE Transactions on Power Electronics, vol. 24, no. 12, pp. 2977–2988, Dec. 2009.
[83] J. M. Guerrero, L. GarciadeVicuna, J. Matas, M. Castilla, and J. Miret, “Output Impedance Design of Parallel-Connected UPS Inverters With Wireless Load-Sharing Control,” IEEE Transactions on Industrial Electronics, vol. 52, no. 4, pp. 1126–1135, Aug. 2005.
[84] J. M. Guerrero, J. Matas, L. Garcia de Vicuna, M. Castilla, and J. Miret, “Decentralized Control for Parallel Operation of Distributed Generation Inverters Using Resistive Output Impedance,” IEEE Transactions on Industrial Electronics, vol. 54, no. 2, pp. 994–1004, Apr. 2007.
[85] R. Majumder, A. Ghosh, G. Ledwich, and F. Zare, “Angle droop versus frequency droop in a voltage source converter based autonomous microgrid,” in 2009 IEEE Power & Energy Society General Meeting, 2009, pp. 1–8.
[86] D. De, V. Ramanarayanan, “Decentralized Parallel Operation of Inverters Sharing Unbalanced and Nonlinear Loads,” IEEE Transactions on Power Electronics, vol. 25, no. 12, pp. 3015–3025, Dec. 2010.
[87] R. Majumder, S. Member, B. Chaudhuri, and A. Ghosh, “Improvement of Stability and Load Sharing in an Autonomous Microgrid Using Supplementary Droop Control Loop,” vol. 25, no. 2, pp. 796–808, 2010.
[88] N. Soni, S. Doolla, and M. C. Chandorkar, “Improvement of Transient Response in Microgrids Using Virtual Inertia,” IEEE Transactions on Power Delivery, vol. 28, no. 3, pp. 1830–1838, Jul. 2013.
[89] A. Madureira, C. L. Moreira, J. A. Peças Lopes, “Secondary Load-Frequency Control for MicroGrids in Islanded Operation,” Proceedings of ICREPQ'05 - International Conference on Renewable Energies and Power Quality, Zaragoza, Spain, Março, 2005.
[90] E. Barklund, N. Pogaku, M. Prodanovic, T. C. Green, and S. Member, “Energy Management in Autonomous Microgrid Using Stability-Constrained Droop Control of Inverters,” IEEE Transactions on Power Electronics, vol. 23, no. 5, pp. 2346–2352, Sept. 2008.

References
288
[91] S. Conti, R. Nicolosi, S. A. Rizzo, H. H. Zeineldin, and A. Member, “Optimal Dispatching of Distributed Generators and Storage Systems for MV Islanded Microgrids,” IEEE Transactions on Power Delivery, vol. 27, no. 3, pp. 1243–1251, July 2012.
[92] CENELEC EN 50160, "Voltage characteristics of electricity supplied by public distribution systems”, 1999.
[93] C. L. Masters, “Voltage rise: the big issue when connecting embedded generation to long 11 kV overhead lines,” Power Engineering Journal, vol. 16, no. 1, pp. 5–12, Feb. 2002.
[94] F. Katiraei, J. Aguero, “Solar PV Integration Challenges,” IEEE Power and Energy Magazine, vol. 9, no. 3, pp. 62–71, May 2011.
[95] A. Baggini, “Voltage and Current unbalance” in Power Quality Handbook, Ed. John Wiley & Sons, 2008, chap. 6, pp. 163-185.
[96] F. Shahnia, R. Majumder, A. Ghosh, G. Ledwich, and F. Zare, “Voltage imbalance analysis in residential low voltage distribution networks with rooftop PVs,” Electric Power Systems Research, vol. 81, no. 9, pp. 1805–1814, Sep. 2011.
[97] T. Stetz, F. Marten, M. Braun, "Improved Low Voltage Grid-Integration of Photovoltaic Systems in Germany," IEEE Transactions on Sustainable Energy, vol.4, no.2, pp.534,542, April 2013.
[98] E. Demirok, D. Sera, P. Rodriguez, and R. Teodorescu, “Enhanced local grid voltage support method for high penetration of distributed generators,” presented at the 37th Annu. Conf. IEEE Ind. Electron. Soc., Melbourne, Australia, Nov. 7–10, 2011.
[99] E. Demirok, P. Casado González, K.H.B. Frederiksen, D. Sera, P. Rodriguez, R. Teodorescu, "Local Reactive Power Control Methods for Overvoltage Prevention of Distributed Solar Inverters in Low-Voltage Grids," Photovoltaics, IEEE Journal of , vol.1, no.2, pp.174,182, Oct. 2011
[100] C.L.Fortescue, “Method of Symmetrical Coordinates Applied to the Solution of Polyphase Networks,” Transactions of American Institute of Electrical Engineers, pt. II, vol 37, pp. 1027-1140, 1918.
[101] M. Rashid, “Active Filters” in Power Electronics Handbook, 3rd edition, Ed. Elsevier, Butterworth-Heinemann, 2010, chap. 41, pp. 1193-1227.
[102] H. Akagi, E. H. Watanabe, M. Aredes, “Shunt Active Filters” in Instantaneous Power Theory and Applications to Power Conditioning, Ed. Wiley-IEEE Press, 2007, chap. 4, pp. 109-220.
[103] A. Ghosh, G. Ledwich, “Custom Power Devices: An Introduction” in Power Quality Enhancement Using Custom Power Devices (2002), Ed. Kluwer Academic Publishers, 2002, chap. 4, pp. 121-126.
[104] J.M. Guerrero, Poh Chiang Loh, Tzung-Lin Lee, M. Chandorkar, "Advanced Control Architectures for Intelligent Microgrids—Part II: Power Quality, Energy Storage, and AC/DC Microgrids," IEEE Transactions on Industrial Electronics, vol.60, no.4, pp.1263-1270, April 2013.
[105] Fei Wang, J.L. Duarte, M.A.M. Hendrix, "Grid-Interfacing Converter Systems With Enhanced Voltage Quality for Microgrid Application-Concept and Implementation," IEEE Transactions on Power Electronics, vol.26, no.12, pp.3501-3513, Dec. 2011.
[106] Y. Li, D. M. Vilathgamuwa, P. C. Loh, “Microgrid power quality enhancement using a three-phase four-wire grid-interfacing compensator,” IEEE Transactions on Industry Applications, vol.41, no. 6, pp.1707-1719, November/December 2005.
[107] Yun Wei Li, D.M. Vilathgamuwa, Poh Chiang Loh, "A grid-interfacing power quality compensator for three-phase three-wire microgrid applications," IEEE Transactions on Power Electronics, vol.21, no.4, pp.1021,1031, July 2006
[108] M. Hamzeh, H. Karimi, H. M okhtari, "A New Control Strategy for a Multi-Bus MV Microgrid Under Unbalanced Conditions," Power Systems, IEEE Transactions on , vol.27, no.4, pp.2225,2232, Nov. 2012
References
289
[109] M. Savaghebi, A. Jalilian, J.C. Vasquez, J.M. Guerrero, "Secondary Control Scheme for Voltage Unbalance Compensation in an Islanded Droop-Controlled Microgrid," Smart Grid, IEEE Transactions on , vol.3, no.2, pp.797,807, June 2012
[110] M. Savaghebi, A. Jalilian, J.C. Vasquez, J.M. Guerrero, "Autonomous Voltage Unbalance Compensation in an Islanded Droop-Controlled Microgrid," IEEE Transactions on Industrial Electronics, vol.60, no.4, pp.1390-1402, April 2013.
[111] International Energy Agency (IEA) and the Electric Vehicles Initiative of the Clean Energy Ministerial (EVI), “Global EV Outlook-2013- Understanding the Electric Vehicle Landscape to 2020 “, Paris, France, April 2013. [Online] Available: http://www.iea.org/publications/freepublications/publication/global-ev-outlook.htm)
[112] International Energy Agency (IEA), " Technology Roadmap: Smart Grids", Paris, France, April 2011. [Online]. Available: http://www.iea.org/publications/freepublications/ publication/technology-roadmap-smart-grids.html [Dec. 2014].
[113] W. Kempton, S. E. Letendre, “Electric vehicles as a new power source for electric utilities,” Transportation Research Part D: Transport and Environment, vol. 2, n. 3, pp. 157-175, Sept. 1997.
[114] W. Kempton, J. Tomic, S.E. Letendre, A. Brooks, T. Lipman, “Vehicle-to-Grid Power: Battery, Hybrid, and Fuel Cell Vehicles as Resources for Distributed Electric Power in California”, Institute of Transportation Studies, Univ. California, California, Tech. Rep. UCD-ITS-RR-01-03, June 2001. [Online]. Available: http://www.udel.edu/V2G/docs/V2G-Cal-2001.pdf
[115] J.A. Peças Lopes, F.J. Soares, P.M.R. Almeida, A. M. Silva, “Smart Charging Strategies for Electric Vehicles: Enhancing Grid Performance and Maximizing the Use of Variable Renewable Energy Resources,” EVS24 - The 24th International Battery, Hybrid and Fuel Cell Electric Vehicle Symposium & Exhibition, Stavanger, Norway, May 2009.
[116] B. K. Sovacool and R. F. Hirsh, “Beyond batteries: An examination of the benefits and barriers to plug-in hybrid electric vehicles (PHEVs) and a vehicle-to-grid (V2G) transition,” Energy Policy, vol. 37, no. 3, pp. 1095–1103, Mar. 2009.
[117] European Research Project Grid for Vehicles (G4V). [Online]. Available: http://www.g4v.eu/ [October 2014].
[118] MERGE Project Deliverable 2.2, "Functional Specification for tools to assess steady state and dynamic behavior impacts, impact on electricity markets and impact of high penetration of EV on the reserve levels," Feb. 2011. [Online]. Available: http://www.ev-merge.eu [October 2014].
[119] European Research Project Green eMotion. [Online]. Available: http://www.greenemotion-project.eu/ [October 2014].
[120] Green eMotion Project Deliverable 4.1, “Recommendation regarding requirements for communication protocols and grid-supporting opportunities”, March 2013. [Online]. Available: http://www.greenemotion-project.eu/ [October 2014].
[121] Electric Power Research institute (EPRI), “Transportation Electrification – A Technology Overview”, Technical Report, Jul 2011. Available at: www.epri.com [Jan 2013].
[122] D.P. Tuttle, R. Baldick, "The Evolution of Plug-In Electric Vehicle-Grid Interactions," IEEE Transactions on Smart Grid, vol.3, no.1, pp.500-505, March 2012.
[123] L. Lu, X. Han, J. Li, J. Hua, and M. Ouyang, “A review on the key issues for lithium-ion battery management in electric vehicles,” Journal of Power Sources, vol. 226, pp. 272–288, Mar. 2013.
[124] R. F. Nelson, “Power requirements for batteries in hybrid electric vehicles,” Journal of Power Sources, vol. 91, no. 1, pp. 2–26, Nov. 2000.
[125] H. Rahimi-Eichi, U. Ojha, F. Baronti, M. Chow, "Battery Management System: An Overview of Its Application in the Smart Grid and Electric Vehicles," IEEE Industrial Electronics Magazine, vol.7, no.2, pp.4-16, June 2013.

References
290
[126] IEC 61851-1, "Electric vehicle conductive charging system - Part 1: General requirements," 2010.
[127] IEC 62196-1, "Plugs, socket-outlets, vehicle connectors and vehicle inlets - Conductive charging of electric vehicles - Part 1: General requirements," 2014.
[128] S. Käbisch, A. Schmitt, M. Winter, J. Heuer, "Interconnections and Communications of Electric Vehicles and Smart Grids," 2010 First IEEE International Conference on Smart Grid Communications (SmartGridComm), pp.161-166, 4-6 Oct. 2010.
[129] C. Guille, G. Gross, “A conceptual framework for the vehicle-to-grid (V2G) implementation,” Energy Policy, vol. 37, no. 11, pp. 4379–4390, Nov. 2009.
[130] W. Kempton and J. Tomić, “Vehicle-to-grid power implementation: From stabilizing the grid to supporting large-scale renewable energy,” Journal of Power Sources, vol. 144, no. 1, pp. 280–294, Jun. 2005.
[131] J. A. Peças Lopes, P. M. Rocha Almeida, F. J. Soares, "Using Vehicle-to-Grid to Maximize the Integration of Intermittent Renewable Energy Resources in Islanded Electric Grids," ICCEP 2009 - International Conference On Clean Electrical Power Renewable Energy Resources Impact, Capri, Italy, June, 2009.
[132] M. D. Galus, S. Member, and S. Koch, “Provision of Load Frequency Control by PHEVs , Controllable Loads , and a Cogeneration Unit,” IEEE Transactions on Industrial Electronics, vol. 58, no. 10, pp. 4568–4582, Oct. 2011.
[133] J. A. Peças Lopes, P. M. Rocha Almeida, F. J. Soares, N. Hatziargyriou, "Electric Vehicles Grid Integration Under the MicroGrid Concept," Smart Grids and Mobility - Smart Grids and Mobility, Würzburg, Germany, June, 2009.
[134] J. A. Peças Lopes, Silvan A. Polenz, C.L. Moreira, Rachid Cherkaoui, “Identification of control and management strategies for LV unbalanced microgrids with plugged-in electric vehicles”, Electric Power Systems Research, vol. 80, no. 8, pp. 898-906, August 2010.
[135] N. Gil, D. Issicaba, P. M. Rocha Almeida, J. A. Peças Lopes, "Hierarchical Frequency Control in Multi-MicroGrids: The Participation of Electric Vehicles," CIGRÉ SYMPOSIUM - Cigrè International Symposium, Bologna, Italy, Sept. 2011.
[136] F. J. Soares, J. A. Peças Lopes, "Controlling Electric Vehicles in Quasi-Real-Time," PowerTech2013 - Towards carbon free society through smarter grids, pp.1-6, Grenoble, France, June, 2013.
[137] R. Rei, F. J. Soares, P. M. Rocha Almeida, J. A. Peças Lopes, "Grid Interactive Charging Control for Plug-in Electric Vehicles," ITSC 2010 - 13th International IEEE Conference on Intelligent Transportation Systems, Funchal, Madeira, Portugal, Sept. 2010.
[138] North American Electric Reliability Corporation (NERC), “Data Collection for Demand-Side Management for quantifying its influence on reliability – Results and recommendations”, Dec. 2007. Available at: http://www.nerc.com/filez/dadswg.html [Jan 2013].
[139] C. Alvarez, A. Gabaldón, A. Molina, and S. Member, “Assessment and Simulation of the Responsive Demand Potential in End-User Facilities : Application to a University Customer,” IEEE Transactions on Power Systems, vol. 19, no. 2, pp. 1223–1231, 2004.
[140] T. L. Vandoorn, J. C. Vasquez, J. De Kooning, J. M. Guerrero, L. Vandevelde, “Microgrids: Hierarchical Control and an Overview of the Control and Reserve Management Strategies,” IEEE Industrial Electronics Magazine, vol. 7, no. 4, pp. 42–55, Dec. 2013.
[141] J. Li, J. Y. Chung, J. Xiao, J. W.-K. Hong, and R. Boutaba, “On the design and implementation of a home energy management system,” International Symposium on Wireless and Pervasive Computing, pp. 1–6, Feb. 2011.
[142] C. O. Adika, L. Wang, "Autonomous Appliance Scheduling for Household Energy Management," IEEE Transactions on Smart Grid, vol. 5, no. 2, pp. 673–682, March 2014.

References
291
[143] M. Pipattanasomporn, M. Kuzlu, S. Rahman, "An Algorithm for Intelligent Home Energy Management and Demand Response Analysis," IEEE Transactions on Smart Grid, vol.3, no.4, pp.2166-2173, Dec. 2012.
[144] S. Koch, M. Zima, G. Andersson, “Potentials and applications of coordinated groups of thermal household appliances for power system control purposes,” Sustainable Alternative Energy SAE 2009 IEEE PESIAS Conference on, pp. 1–8, 2009.
[145] Miguel Delgado Heleno, Manuel Matos, João Peças Lopes, Availability and Flexibility of Loads for the Provision of Reserve, IEEE Transactions on Smart Grid, 2014.
[146] J. P. Iria, F. J. Soares, A. Madureira, M. Heleno, “Availability of Household loads to Participate in Demand Response,” IEEE 8th International Power Engineering and Optimization Conference (PEOCO2014), Langkawi, Malaysia, March 2014.
[147] Ying-Yi Hong, Ming-Chun Hsiao, Yung-Ruei Chang, Yih-Der Lee, Hui-Chun Huang, "Multiscenario Underfrequency Load Shedding in a Microgrid Consisting of Intermittent Renewables," IEEE Transactions on Power Delivery , vol.28, no.3, pp.1610-1617, July 2013.
[148] F.C. Schweppe, R.D. Tabors, J.L. Kirtley, H.R.Outhred, F.H. Pickel, A.J. Cox, "Homeostatic Utility Control," IEEE Transactions on Power Apparatus and Systems, vol.PAS-99, no.3, pp.1151-1163, May 1980.
[149] D. J. Hammerstrom, R. G. Pratt, T. A. Carlon, T. V. Oliver, W. Marek, “Pacific Northwest GridWise Testbed Demonstration Projects: Part II. Grid Friendly Appliance Project,” Pacific Northwest National Lab, October 2007. [Online] Available: https://www.smartgrid.gov/document/pacific_northwest_gridwise_testbed_demonstration_projects_part_ii_grid_friendly_appliance_0 [Nov.2014].
[150] J.A. Short, D.G. Infield, L.L. Freris, "Stabilization of Grid Frequency Through Dynamic Demand Control," IEEE Transactions on Power Systems, vol.22, no.3, pp.1284-1293, Aug. 2007.
[151] A. Molina-Garciá, F. Bouffard, D.S. Kirschen, "Decentralized Demand-Side Contribution to Primary Frequency Control," IEEE Transactions on Power Systems, vol.26, no.1, pp.411-419, Feb. 2011.
[152] Zhao Xu, J. Ostergaard, M. Togeby, "Demand as Frequency Controlled Reserve," IEEE Transactions on Power Systems, vol.26, no.3, pp.1062-1071, Aug. 2011.
[153] K. Samarakoon, J. Ekanayake, N. Jenkins, "Investigation of Domestic Load Control to Provide Primary Frequency Response Using Smart Meters", IEEE Transactions on Smart Grid, vol.3, no.1, pp.282-292, March 2012.
[154] S.A. Pourmousavi, M.H. Nehrir, "Real-Time Central Demand Response for Primary Frequency Regulation in Microgrids", IEEE Transactions on Smart Grid, vol.3, no.4, pp.1988-1996, Dec. 2012.
[155] M. Kuzlu, M. Pipattanasomporn, S. Rahman, "Hardware Demonstration of a Home Energy Management System for Demand Response Applications," IEEE Transactions on Smart Grid, vol.3, no.4, pp.1704-1711, Dec. 2012.
[156] Jong-Yul Kim, Jin-Hong Jeon, Seul-Ki Kim, Changhee Cho, June Ho Park, Hak-Man Kim, Kee-Young Nam, "Cooperative Control Strategy of Energy Storage System and Microsources for Stabilizing the Microgrid during Islanded Operation," IEEE Transactions on Power Electronics, vol.25, no.12, pp.3037-3048, Dec. 2010.
[157] R. Bessa, A. Trindade, A. Monteiro, C. P. Silva, V. Miranda, “Solar Power Forecasting in Smart Grids Using Distributed Information,” PSCC 2014 - 18th Power Systems Computation Conference, Wroclaw, Poland, August, 2014.
[158] KEMA DNV, “Smart Grid Projects”, Report. Available at: http://www.dnvkema.com/innovations/smart-grids (Last consulted on Jan. 2013)
[159] V. Giordano et al, "Smart Grid Projects in Europe - Lessons Learned and Current Developments," Institute for Energy and Transport, Joint Research Center, Publications Office of the European Union, Luxembourg, Tech. report JRC65215, 2011. [Online].

References
292
Available: http://publications.jrc.ec.europa.eu/repository/handle/111111111/22212 [Nov 2014].
[160] C. F Covrig et al, "Smart Grid Projects Outlook 2014," Institute for Energy and Transport, Joint Research Center, Publications Office of the European Union, Luxembourg, Tech. report JRC90290, 2014. [Online]. Available: http://publications.jrc.ec.europa.eu/ [Nov 2014].
[161] InovGrid Consortium. InovGrid v3 - A evolução da Rede de Distribuição como resposta decisiva aos novos desafios do sector eléctrico - requisitos funcionais. Technical report, EDP, 2010.
[162] C. Gouveia, D. Rua, F.J. Soares, C. Moreira, P.G. Matos, J.A. Peças Lopes, “Development and implementation of Portuguese smart distribution system,” Electric Power Systems Research, Available online 27 June 2014.
[163] NiceGrid Microgrid Project. [Online]. Available: http://www.nicegrid.fr [Nov 2014]. [164] L. Schmitt, J. Kumar, D. Sun, S. Kayal, S.S. Mani Venkata, "Ecocity Upon a Hill: Microgrids
and the Future of the European City," IEEE Power and Energy Magazine, vol. 11,no. 4, pp. 59-70, July/Aug. 2013.
[165] California Zero Emission Vehicle (ZEV) Program [Online]. Available: http://www.arb.ca.gov/msprog/zevprog/zevprog.htm. [Nov 2014].
[166] "Smartcity Malaga - A model of sustainable energy management for cities of the future," White paper for Endesa, 2014. [Online]. Available: http://www.endesasmartgrids.com/ index.php/en/smartcities-en/malaga-spain [Nov 2014].
[167] European Project COTEVOS. [Online]. Available: http://cotevos.eu/ [Nov 2014]. [168] SMA Report (2009). Technology Compendium 2-Solar Stand-Alone Power and Backup
Power Supply. [Online] Available: http://files.sma.de/dl/10040/INSELVERSOR-AEN101410.pdf. [Nov 2014].
[169] D. Rua, "Last-Mile Communications systems for smart electric distribution grids," PhD dissertation, Faculty of Engineering of University of Porto, Porto, 2014.
[170] R. J. Ferreira, L. M. Miranda, R. E. Araújo, J. A. Peças Lopes "A new bi-directional charger for vehicle-to-grid integration," in Proc. 2011 2nd IEEE PES International Conference and Exhibition on Innovative Smart Grid Technologies (ISGT Europe), pp.1-5, 5-7 Dec. 2011.
[171] J. Miguel Rodrigues, F. Resende, Using Photovoltaic Systems to Improve Voltage Control in Low Voltage Networks, ISGT2012 - Third IEEE PES Innovative Smart Grid Technologies Europe Conference, Berlin, Germany, October, 2012.
[172] J. Rodrigues, F. O. Resende, C. L. Moreira, “Contribution of PMSG based Small Wind Generation Systems to Provide Voltage Control in Low Voltage Networks, ISGT 2011 - IEEE PES ISGT 2011 Europe, Manchester, UK, 2011.
[173] D. Varajão, R.E. Araujo, C. Moreira, J. P. Lopes, "Impact of phase-shift modulation on the performance of a single-stage bidirectional electric vehicle charger," IECON 2012 - 38th Annual Conference on IEEE Industrial Electronics Society , vol., no., pp.5215,5220, 25-28 Oct. 2012
[174] C. Gouveia, J. Moreira, C.L. Moreira, J.A. Peças Lopes, "Coordinating Storage and Demand Response for Microgrid Emergency Operation," IEEE Transactions on Smart Grid, vol.4, no.4, pp.1898,1908, Dec. 2013.
[175] N. Hatziargyriou, G. Kariniotakis, N. Jenkins, J. A. Peças Lopes, J. Oyarzabal, F. Kanellos, X. L. Pivert, N. Jayawarna, N. Gil, C. L. Moreira, and Z. Larrabe, "Modelling of micro-sources for security studies," in Proceedings CICGRE Session, Paris, 2004.
[176] Keyhani and M. Marwali, "Microgrids Operation and Control under Emergency Conditions”, in Smart Power Grids 2011, Ed. Berlin, Springer-Verlag, 2012, ch. 12, pp. 351-399.
[177] G.C. Paap, "Symmetrical components in the time domain and their application to power network calculations," IEEE Transactions on Power Systems, vol.15, no.2, pp.522-528, May 2000.

References
293
[178] M. J. Ryan, R. W. De Doncker, and R. D. Lorenz, “Decoupled control of a four-leg inverter via a new 4×4 transformation matrix,” IEEE Transactions on Power Electronics, vol. 16, no. 5, pp. 694–701, 2001.
[179] H. Akagi, E. H. Watanabe, M. Aredes, “The Instantaneous power theory” in Instantaneous Power Theory and Applications to Power Conditioning, Ed. Wiley-IEEE Press, 2007, chap. 3, pp. 41-107.
[180] P. Rodriguez, A. Luna, M. Ciobotaru, R. Teodorescu, F. Blaabjerg, "Advanced Grid Synchronization System for Power Converters under Unbalanced and Distorted Operating Conditions," IECON 2006 - 32nd IEEE Annual Conference on Industrial Electronics, pp.5173,5178, 6-10 Nov. 2006.
[181] A. Engler and B. Burger, "Fast signal conditioning in single phase systems." in Proceedings 9th European Conference on Power Electronics and Applications, Graz, Germany, 27-29 August 2001.
[182] H. Kasem Alaboudy, H.H. Zeineldin, J.L. Kirtley, “Microgrid Stability Characterization Subsequent to Fault-Triggered Islanding Incidents," IEEE Transactions on Power Delivery, vol.27, no.2, pp.658-669, April 2012.
[183] Y. Zhu, K. Tomsovic, "Development of models for analyzing the load-following performance of microturbines and fuel cells," Electric Power Systems Research, vol. 62, no. 1, pp. 1-11, May 2002.
[184] O. Fethi, L-A Dessaint, K. Al-Haddad, "Modeling and simulation of the electric part of a grid connected microturbine," Power Engineering Society General Meeting, 2004. IEEE , vol., no., pp.2212,2219 Vol.2, 10-10 June 2004.
[185] M.W. Ellis, M.R. Von Spakovsky, D.J. Nelson, "Fuel cell systems: efficient, flexible energy conversion for the 21st century", Proceedings of the IEEE, vol.89, no.12, pp.1808-1818, Dec 2001.
[186] "Fuel Cell Handbook," 7th ed., EG&G Technical Services, Inc., West Virginia, 2004, chap.7, pp.197-245.
[187] R. Baker, J. Zhang, “Electrochemistry Encyclopedia - Proton exchange membrane or polymer electrolyte membrane (pem) fuel cells”, April, 2011. Available at: http://electrochem.cwru.edu/encycl/art-f04-fuel-cells-pem.htm [Nov.2014].
[188] J.M. Rodrigues, F.O. Resende, C.L. Moreira, "Contribution of PMSG based small wind generation systems to provide voltage control in low voltage networks," 2011 2nd IEEE PES International Conference and Exhibition on Innovative Smart Grid Technologies (ISGT Europe), pp.1-8, Dec. 2011.
[189] M.G. Villalva, J.R. Gazoli, E.R. Filho, "Comprehensive Approach to Modeling and Simulation of Photovoltaic Arrays," IEEE Transactions on Power Electronics, vol.24, no.5, pp.1198-1208, May 2009.
[190] A. Arulampalam, M. Barnes, A. Engler, A. Goodwin, N. Jenkins, "Control of power electronic interfaces in distributed generation microgrids," International Journal of Electronics, vol. 91, no. 9, pp. 503-523, Sept. 2004.
[191] Arabi, S.; Kundur, P., "Stability modelling of storage devices in FACTS applications," Power Engineering Society Summer Meeting, 2001, vol.2, pp.767-771, 2001.
[192] D. N. Zmood, S. Member, D. G. Holmes, and G. H. Bode, “Frequency-Domain Analysis of Three-Phase Linear Current Regulators,” vol. 37, no. 2, pp. 601–610, 2001.
[193] D. N. Zmood and D. G. Holmes, “Stationary frame current regulation of PWM inverters with zero steady state error,” IEEE Transactions on Power Electronics, vol.18, no.3, pp.814,822, May 2003.
[194] R. Teodorescu, F. Blaabjerg, M. Liserre, and P. C. Loh, “Proportional-resonant controllers and filters for grid-connected voltage-source converters,” IEE Proceedings - Electric Power Applications, vol. 153, no. 5. p.p. 750- 762, 2006.
[195] Model-Based Design. [Online] Available: http://www.mathworks.com [Nov 2014].


Appendix A– Characterization of MicroGrid Urban Network Test System
295
Appendix A – Characterization of MicroGrid Urban Network Test System This appendix provides a detailed description of the LV networks adopted for the numerical simulation studies performed in Chapter 5, regarding the contribution of EV for islanding and restoration procedure. The network adopted was characterized initially in the context of InovGrid and REIVE project, based on a real LV distribution system. The original LV system connected to the MV network through a 400kVA transformer and supplies a total of 141 clients, from which 106 have single-phase and 36 three-phase connections. The network has a radial topology divided in six feeders and with a total of 71 nodes. In order to reduce the computation burden, two simplified versions of the network were considered for evaluating the MG restoration procedure. The networks feeder characteristic and a detailed characterization of the simulation scenarios are given below.
Urban network 1
Table A.1. General network characteristics.
General Data
Nominal Voltage 400 V
Nº of clients 141
Power capacity 400 kVA
Peak Power 187.4 kW

Appendix A– Characterization of MicroGrid Urban Network Test System
296
Table A.2. Urban Network 1 LV feeder impedances.
Nodes
Feeder From To Length (m) Line R (Ω) X (Ω) R/X
1 5 29 40 0,0198 0,0060 3,3
2 5 74 180 0,1543 0,0270 5,7
74 75 251 0,1115 0,0114 9,8
3
5 27 355 0,0212 0,0400 0,5
27 71 108 0,6508 0,0162 40,2
27 73 33 0,2071 0,0050 41,8
4
5 25 293 0,2037 0,0394 5,2
25 69 102 0,3109 0,0153 20,3
25 15 168 0,5217 0,0252 20,7
5
5 31 126 0,3310 0,0150 22,1
31 32 20 0,1597 0,0030 53,2
31 33 134 0,2187 0,0201 10,9
33 37 128 0,2918 0,0118 24,6
33 55 78 0,2005 0,0066 30,5
6 5 26 230 0,3500 0,0332 10,5
26 40 93 0,4455 0,0140 31,9
The neutral impedance was considered equal to the impedance of phase conductors.

Appendix A– Characterization of MicroGrid Urban Network Test System
297
Table A.3. MG Urban Network 1 Load per node.
Three-phase A B C
Feeder Node P
(kW) Q
(kvar) P
(kW) Q
(kvar) P
(kW) Q
(kvar) P
(kW) Q
(kvar)
1 29 0,00 0,00 1,90 0,76 0,00 0,00 0,00 0,00
2 74 2,60 1,04 0,00 0,00 0,00 0,00 0,00 0,00
75 2,00 0,80 6,00 2,40 4,00 2,40 8,90 3,56
3
27 16,20 6,48 6,30 2,52 10,00 4,00 13,00 5,20
71 1,96 0,79 0,00 0,00 6,00 2,40 7,10 2,84
73 0,00 0,00 0,00 0,00 5,20 2,08 0,00 0,00
4
25 7,65 3,36 2,80 1,12 0,00 0,00 1,15 0,46
69 13,25 5,30 2,00 0,80 0,00 0,00 2,65 1,06
15 7,77 3,11 0,00 0,00 3,83 1,53 0,00 0,00
5
31 2,80 1,12 2,80 1,12 0,00 0,00 0,00 0,00
32 5,76 2,30 0,00 0,00 0,94 0,38 0,00 0,00
33 6,60 2,64 0,00 0,00 0,00 0,00 0,00 0,00
37 1,97 0,79 0,00 0,00 0,00 0,00 2,23 0,89
55 0,00 0,00 1,00 0,40 0,00 0,00 4,10 1,64
6 26 2,70 1,08 1,30 0,52 0,00 0,00 6,00 2,40
40 4,06 1,62 2,00 0,80 3,84 1,54 4,00 1,60

Appendix A– Characterization of MicroGrid Urban Network Test System
298
Table A.4. MG Urban Network 1 MG Simulation Scenario.
Electric Vehicles Photovoltaic Units Wind-Turbines SSMT
Feeder Node A (kW)
B (kW)
C (kW)
A (kW)
B (kW)
C (kW)
A (kW)
B (kW)
C (kW)
3 ϕ (kW)
1 29 0 3 6 0 0 0 0 0 0 0
2 74 6 0 0 0 0 0 0 0 0 0 75 9 0 0 12 0 0 0 0 0 17,5
3
27 0 0 0 0 0 0 0 0 0 15 71 0 0 0 0 8 0 0 0 0 0 73 0 0 0 0 8 0 0 0 0 0
4
25 3 6 9 0 0 0 0 0 0 15 69 0 0 0 0 0 0 0 0 10 0 15 0 0 0 0 0 0 0 0 0 0
5
31 0 6 0 0 0 0 0 0 0 0
32 0 0 0 0 12 0 0 0 0 0
33 0 0 0 0 0 0 0 0 0 0
37 3 6 0 0 0 6 0 0 0 0
55 0 3 0 0 0 0 0 0 8 0
6 26 0 3 0 8 0 0 0 0 0 0
40 0 0 0 0 0 0 0 0 0 15
Storage and SSMT parameters are according to Appendix C.
The SSMT participate in secondary frequency control through a local strategy, which parameters are given in the next table.
Table A.5. Parameters of local secondary frequency control.
Controller parameters
SSMT Node Pinic Pmax Kp KI
25 15 30 25 4
27 15 30 10 5
40 15 30 16 4
75 17.5 30 20 6

Appendix A– Characterization of MicroGrid Urban Network Test System
299
Urban network 2
Table A.6. MG Urban Network 2 LV feeder impedances.
Nodes
Feeder From To R (Ω) X (Ω) R/X
1 5 29 0,0198 0,0060 3,3083
2 5 74 0,1543 0,0270 5,7138
74 75 0,1114 0,0035 32,1466
3 5 27 0,0036 0,0068 0,5297
27 73 0,0118 0,0003 41,8336
27 71 0,0403 0,0010 40,1707
4 5 25 0,2037 0,0394 5,1696
25 15, 69 0,3116 0,0051 60,9675
The neutral impedance was considered equal to the impedance of phase conductors.
Table A.7. MG Urban Network 2 Load per node for the MG service restoration.
Three-phase A B C
Feeder Node P
(kW) Q
(kvar) P
(kW) Q
(kvar) P
(kW) Q
(kvar) P
(kW) Q
(kvar)
1 29 0,0 0,0 1,9 0,76 0,0 0,0 0,0 0,0
2 74 2,6 1,04 0,0 0,0 0,0 0,0 0,0 0,0
75 6 2,4 2 0,8 0,0 0,0 4,9 1,96
3
27 16,2 6,48 2,3 0,92 14 5,6 13 5,2
71 1,96 0,79 0,0 0,0 6 2,4 7,1 2,84
73 0,0 0,0 5,2 2,08 0,0 0,0 0,0 0,0
4
25 7,65 3,06 0,0 0,0 2,8 1,12 1,15 0,46
69 0,0 0,0 11,28 4,51 0,0 0,0 6,62 2,65
15 7,77 3,11 0,0 0,0 0,0 0,0 0,0 0,0

Appendix A– Characterization of MicroGrid Urban Network Test System
300
Table A.8. MG Urban Network 2 Simulation Scenario for the MG service restoration.
Electric Vehicles Photovoltaic Units Wind-Turbines SSMT
Feeder Node A (kW)
B (kW)
C (kW)
A (kW)
B (kW)
C (kW)
A (kW)
B (kW)
C (kW)
3 ϕ (kW)
1 29 0 6 6 0 0 0 0 0 0 0
2 74 6 0 0 0 0 0 0 0 0 0 75 9 0 0 0 0 12 0 0 0 60
3
27 0 0 0 0 0 0 0 0 0 0 71 0 0 0 0 8 0 0 0 0 0 73 0 0 0 0 8 0 0 0 0 0
4
25 6 6 9 0 0 0 0 0 0 30 69 0 0 0 0 0 0 8 0 0 0 15 0 0 0 0 0 0 0 0 0 0

Appendix C – Characterization of MicroGrid Model Parameters
301
Appendix B – Characterization of MicroGrid Rural Network Test System This appendix provides a detailed description of the MG rural network adopted for the simulation studies performed in Chapter 5 regarding voltage unbalance problem.
Table B.1. General network characteristics.
General Data
Nominal Voltage 380 V
Contracted Power 376.65 kVA
Peak Power 100.94 kW
Table B.2. Rural Network LV feeder characteristics.
Nodes Length (m)
From To Cables 1 2 3 4 Total
1 89 RZ 0.6/1 KV 3X150/95 AL 391 - - - 391
89 84 RZ 0.6/1 KV 3X150/95 AL 121 - - - 121
89 11 RZ 0.6/1 KV 3X50/54.6 ALM 85 - - - 85
11 15 RZ 0.6/1 KV 3X95/54.6 ALM 13 - - - 13
15 36
RZ 0.6/1 KV 3X95/54.6 ALM RZ 0.6/1 KV 3X50/54.6ALM
RZ 0.6/1 KV 2X25AL DN 0.6/1 KV 25 CU
26 6 58 161 251
15 22 RZ 0.6/1 KV 3X50/54.6 ALM DN 0.6/1 KV 25 CU 38 4 - - 42
15 25 RZ 0.6/1 KV 3X50/54.6 ALM / RZ 0.6/1 KV 3X25/54.6 ALM 11 6 - - 17
11 42 RZ 0.6/1 KV 3X95/54.6 ALM RZ 0.6/1 KV 3X50/54.6 ALM 23 2 - - 25
42 45 RZ 0.6/1 KV 3X95/54.6 ALM 5 - - - 5
42 51 RZ 0.6/1 KV 3X95/54.6 ALM 66 - - - 66
11 55 RZ 0.6/1 KV 3X50/54.6 ALM 32 - - - 32
55 71 RZ 0.6/1 KV 3X50/54.6 ALM 32 - - - 32
55 66 RZ 0.6/1 KV 3X50/54.6 ALM RZ 0.6/1 KV 3X25/54.6 ALM 2 56 - - 58

Appendix B – Characterization of MicroGrid Rural Network Test System
302
Table B.3. Rural Network LV feeder impedances.
Nodes
From To R X Rn Xn R/X
1 89 0.081 0.029324998 0.12512 0.02932 2.746667
89 84 0.016 0.002 0.01405 0.002 8.012498
89 11 0.038 0.013800002 0.05888 0.0138 2.746666
11 15 0.004 0.000988 0.00731 0.00099 4.210527
15 36 0.199 0.023775998 0.20463 0.02378 8.36192
15 22 0.028 0.003519999 0.02473 0.00352 8.012503
15 25 0.018 0.0019 0.01293 0.0019 9.524737
11 42 0.009 0.002060002 0.01517 0.00206 4.50582
42 45 0.002 0.000380009 0.00281 0.00038 4.210413
42 51 0.021 0.005015995 0.03709 0.00502 4.210531
11 55 0.021 0.002559999 0.01798 0.00256 8.012505
55 71 0.021 0.002559999 0.01798 0.00256 8.012505
55 66 0.065 0.004929999 0.03091 0.00493 13.16065
Characterization of the simulation scenarios
Table B.4. Rural Network Scenario I peak load per node.
Three-phase A B C
Node P
(kW) Q
(kvar) P
(kW) Q
(kvar) P
(kW) Q
(kvar) P
(kW) Q
(kvar) 89 0 0 5.17 1.051 8.62 1.751 10.35 2.10 84 0 0 6.61 2.11 14.69 4.24 4.28 1.47 11 37 7.51 0 0 0 0 3.3 0.67 55 0 0 2.55 0.64 7.64 1.914 2.55 0.64 71 6.32 1.28 0 0 0 0 0 0 66 9.46 1.92 11.54 2.34 0 0 0 0 15 0 0 0 0 0 0 1.1 0.16 42 6.43 1.88 0 0 0 0 0 0 51 8.69 1.76 0 0 0 0 0 0 36 7.1 2.07 9.17 2.68 0 0 0 0 25 0 0 11.75 1.67 7.05 1.01 4.70 0.67 22 6.67 1.67 0 0 3.3 0.83 0 0 45 6.23 2.05 0 0 0 0 0 0

Appendix C – Characterization of MicroGrid Model Parameters
303
Table B.5. Rural Network Scenario I microgeneration and EV active power per node.
Electric Vehicles Photovoltaic Units Wind-Turbines SSMT
Node A (kW)
B (kW)
C (kW)
A (kW)
B (kW)
C (kW)
A (kW)
B (kW)
C (kW)
3 ϕ (kW)
89 6 6 0 0 0 12.5 0 0 0 0
84 3 0 0 0 12.5 0 0 0 0 0 11 6 6 0 0 0 0 0 6.2 0 0
55 0 0 0 14.4 0 0 0 8 0
71 0 0 12 0 0 0 0 0 0 15 66 0 0 0 10.5 0 0 0 0 4 15 0 0 0 0 0 0 0 0 0 0
42 0 0 3 3.2 0 0 0 0 0 0
51 0 0 6 0 0 0 0 6.8 0 0
36 0 0 0 0 0 7.5 0 0 0 0
25 0 0 0 5.2 0 0 0 0 0 4
22 0
12 0 0 0 0 6.2 0 0
45 0 3 0 2.7 0 0 0 0 0
Table B.6. Rural Network Scenario II load per node.
Three-phase A B C
Node P
(kW) Q
(kvar) P
(kW) Q
(kvar) P
(kW) Q
(kvar) P
(kW) Q
(kvar) 89 0.00 0.00 1.03 0.21 1.72 0.35 2.07 0.42 84 0.00 0.00 0.51 0.13 2.94 0.85 0.86 0.29 11 7.40 1.50 0.00 0.00 0.00 0.00 0.66 0.13 55 0.00 0.00 0.51 0.13 1.53 0.38 0.51 0.13 71 1.26 0.26 0.00 0.00 0.00 0.00 0.00 0.00 66 1.89 0.38 2.31 0.47 0.00 0.00 0.00 0.00 15 0.00 0.00 0.00 0.00 0.00 0.00 0.22 0.03 42 1.29 0.38 0.00 0.00 0.00 0.00 0.00 0.00 51 1.74 0.35 0.00 0.00 0.00 0.00 0.00 0.00 36 1.42 0.41 1.83 0.54 0.00 0.00 0.00 0.00 25 0.00 0.00 2.35 0.33 1.41 0.20 0.94 0.13 22 1.33 0.33 0.00 0.00 0.66 0.17 0.00 0.00 45 1.25 0.41 0.00 0.00 0.00 0.00 0.00 0.00

Appendix B – Characterization of MicroGrid Rural Network Test System
304
Table B.7. Rural Network Scenario II microgeneration and active power per node.
Electric Vehicles Photovoltaic Units Wind-Turbines SSMT
Node A (kW)
B (kW)
C (kW)
A (kW)
B (kW)
C (kW)
A (kW)
B (kW)
C (kW)
3 ϕ (kW)
89 9 9 0 0 0 12.5 0 0 0 0
84 3 0 0 0 8.5 0 0 0 0 0 11 18 0 0 0 0 0 0 6.2 0 0
55 0 3 0 14.4 0 0 0 8 0
71 0 0 12 0 0 0 0 0 0 4.5 66 0 0 0 10.5 0 0 0 0 4 15 0 0 0 0 0 0 0 0 0 0
42 0 0 3 3.2 0 0 0 0 0 0
51 0 0 9 0 0 0 0 6.8 0 0
36 0 0 0 0 0 7.5 0 0 0 0
25 0 3 0 5.2 0 0 0 0 0 4
22 0 0 0 0 0 0 0 6.2 0 0
45 0 6 0 2.7 0 0 0 0 0

Appendix C – Characterization of MicroGrid Model Parameters
305
Appendix C – Characterization of MicroGrid Model Parameters In this appendix, the parameters adopted for the models of the MG components previously described in Chapter 4 are given, namely for storage and its Voltage Source Inverter (VSI), single-shaft gas microturbine (SSMT) and Electric Vehicles (EV) and MicroSources (MS) grid-coupling inverters. Such parameters were adopted for the different test systems adopted.
Storage and VSI characteristics
Table C.1. Storage and VSI characteristics.
Storage Characteristics
Pmax ±100 kW
Qmax ±75 kvar
Grid Side Inverter
Tinv 1×10⁻⁴ s
R 0.005 Ω
L 70 μH
Droop Parameters
fn 50 Hz
fmin 49 Hz
fmax 51 Hz
V0 1.05 pu V
Vmin 0.9 pu V
Vmax 1.1 pu V
TdP 0.8 s
TdQ 0.8 s
kP -6.28×10⁻⁵ rad/W
kQ -2×10⁻⁶ puV/var
kϕ -8×10⁻⁶ rad/W
Voltage Balancing Control Voltage Regulator
kp 1
ki 1000
ωc 10 rad/s
Current Regulator
kii 1000

Appendix C – Characterization of MicroGrid Model Parameters
306
Table C.2. SSMT model parameters
SSMT Engine (GAST Model) Fuel System
T1 15 s
T2 0.2 s
Load Limit
T3 3 s Fuel Valve Positions
Vmax 1
Vmin -0.1
Temperature Control Loop
kt 1
Lmax 1
Mechanical power controller
kp 3
ki 0.23
Permanent Magnet Synchronous Generator
Pn 30 kW Qn 5 kvar
Electric Parameters Rstator 0.25 Ω
Ld 687.5 μH
Lq 687.5 μH
Flux per pole 53.4×10⁻³ Wb Mechanical Parameters
Number of poles – p 2
Combined Inertia - J 3×10⁻³ Kg.m2
Friction factor - F 5×10⁻⁶ N.m.s/rad
Nominal rotor angular velocity - ω 5.0265×10⁵ rad/s
Table C.3. SSMT model – Input and grid side inverter model parameters.
Input Side Coupling Inverter
Speed controller – q axis Current Controller
kp 30
ki 10 Voltage Controller
kp 100
ki 150

Appendix C – Characterization of MicroGrid Model Parameters
307
Reactive power controller – d axis
Current Controller
kp 5/30
ki 5/3
Voltage Controller
kp 50
ki 20
Grid Side Coupling Inverter
DC bus voltage - VDC 800 V
Tinv 1×10⁻⁴ s
R 3×10⁻³ Ω
L 4×10⁻⁴ μH Current Controller – d axis
kp 1
ki 10 Current Controller – q axis
kp 50
ki 100
Table C.4. EV and single-phase MS grid-side inverter model parameters.
Grid Side Coupling Inverter
DC bus voltage - VDC 400 V
Tinv 3×10⁻⁴ s
R 5×10⁻³ Ω
L 1)
Current Controller
Active current
kp -0.6
ki 30 Voltage reference generator
kp 40
1) Coupling inductance (L) is determined according to the microsource or EV charging power.

Appendix C – Characterization of MicroGrid Model Parameters
308
Table C.5. SOFC model parameters
SOFC
Voltage reference infcV 333.8 V
Fuel utilization factors
Umax 0.9
Umin 0.8
Uopt 0.85
Fuel processor response time
Tf 5s
SOFC stack
N0 384
r 0.126 Ω
Te 0.8s
T 1273⁰K
Valve molar constants
2HK 8.43e-4 kmol/atm.s
OHK2
2.81e-4 kmol/atm.s
2OK 2.52e-3 kmol/atm.s
Flow response times
2Hτ 26.1s
OH2τ 78.3s
2Oτ 2.91s