1 experimental validation - sensor technology
TRANSCRIPT
1
The Mechanical Hybrid Vehicle, an investigation of a vehicular
regenerative energy capture system
Based on PhD thesis: AN INVESTIGATION INTO HYBRID POWER TRAINS FOR VEHICLES WITH
REGENERATIVE BRAKING ©
By Dr. Ulises Diego Ayala, PhD1
Imperial College, London 1Please, reference as: Diego-Ayala, U. “An investigation into hybrid power trains for vehicles with regenerative
braking”. PhD Thesis, Department of Mechanical Engineering, Imperial College, London, 2007
1 EXPERIMENTAL VALIDATION
1.1 Introduction
This article describes the experimental investigation conducted on a scale physical model of a
mechanical hybrid system potentially suitable for vehicle propulsion. The system incorporates
a high-speed flywheel as temporary energy storage employed for braking and acceleration.
The system is based on the system presented in [1] and [2], although the vehicle itself is
replaced by a dynamometer that mimics the behaviour of a vehicle. In this way, the scale
physical model becomes a fixed installation suitable for placing in a laboratory.
The experimental tests conducted to prove the working concept of the mechanical energy
storage and transmission system are presented in this article.
1.2 Overall design
The aim of this part of the research was to design, construct and test a small-scale physical
model (small-scale rig) in order to validate the mechanical hybrid system proposed in [1].
This small-scale rig was required to demonstrate the transfer of energy between a high-speed
flywheel and a vehicle during acceleration and regeneration periods. Further tests using this
testbed can be seen in [2]. To economise on cost and time, it was deemed prudent to reuse
some components salvaged from previous experiments made at Imperial College and
assemble these together in one rig. Indeed, the author assisted other students involved in these
previous experiments and was well acquainted with what was available and what was
appropriate to reuse. During the development of the new experiments, the manufacturing of
additional parts and setting up of new instrumentation for the rig was required in order to
obtain the necessary measurements.
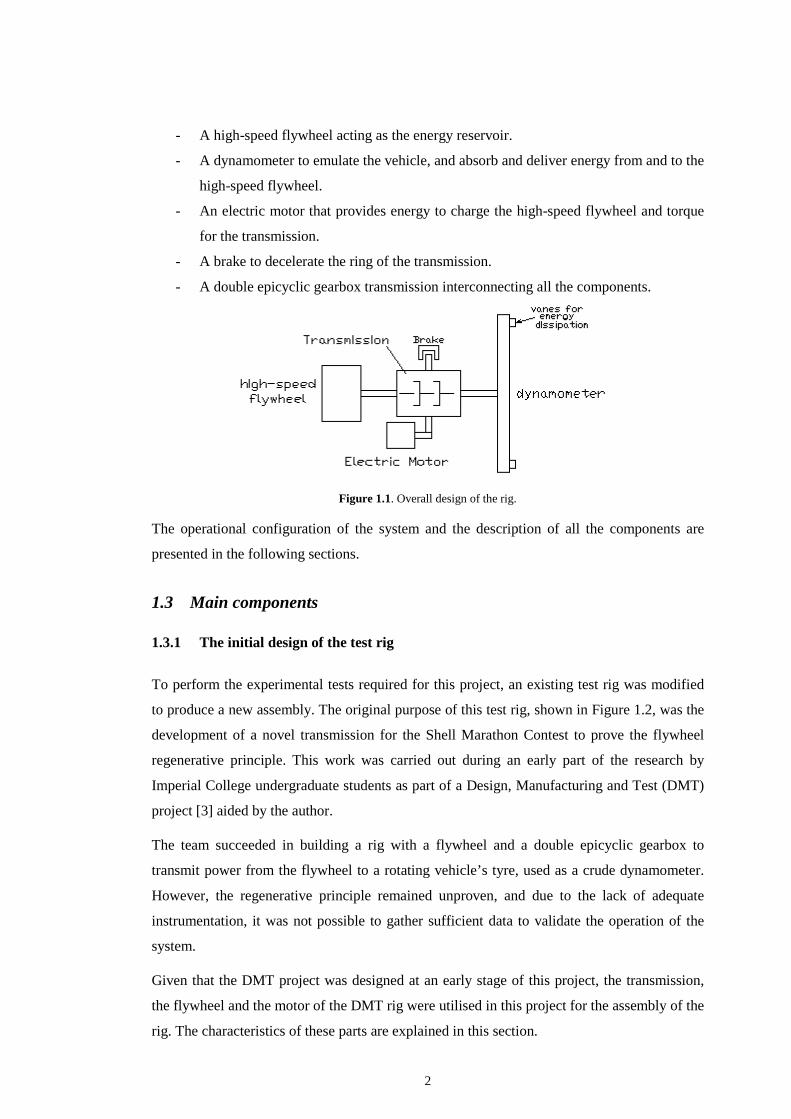
The overall design of the rig is illustrated in Figure 1.1, and is characterised by having five
major components:
2
- A high-speed flywheel acting as the energy reservoir.
- A dynamometer to emulate the vehicle, and absorb and deliver energy from and to the
high-speed flywheel.
- An electric motor that provides energy to charge the high-speed flywheel and torque
for the transmission.
- A brake to decelerate the ring of the transmission.
- A double epicyclic gearbox transmission interconnecting all the components.
Figure 1.1. Overall design of the rig.
The operational configuration of the system and the description of all the components are
presented in the following sections.
1.3 Main components
1.3.1 The initial design of the test rig
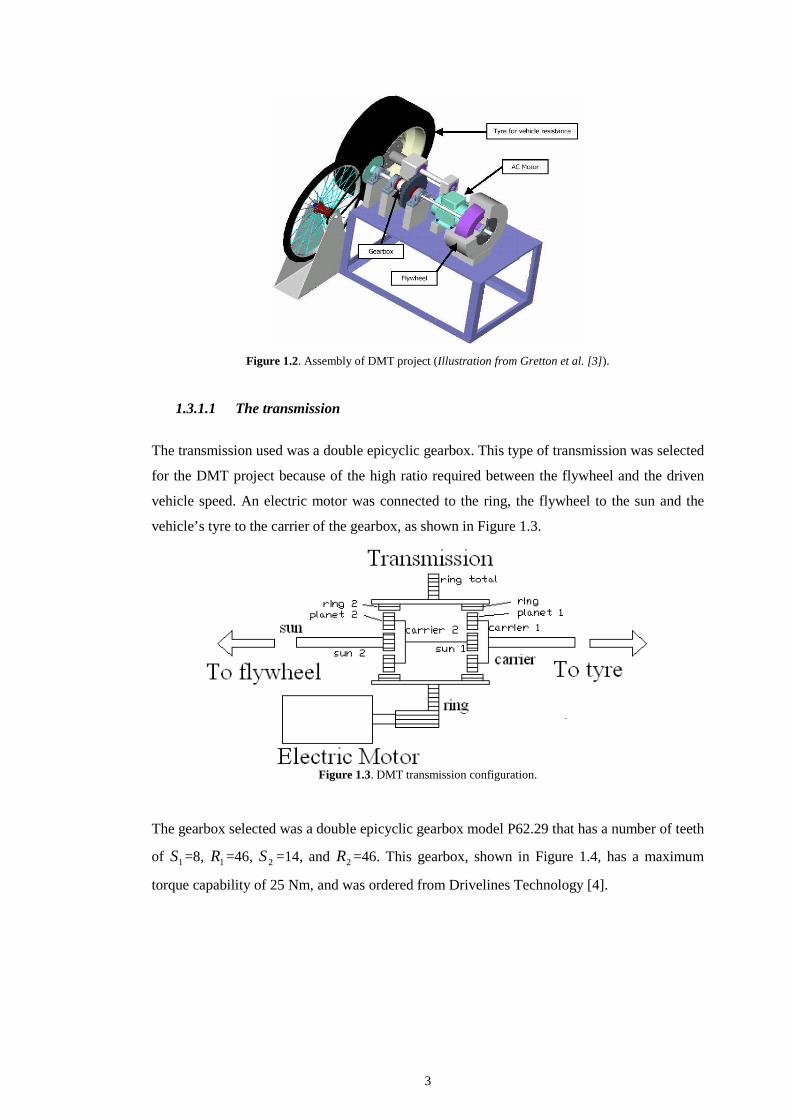
To perform the experimental tests required for this project, an existing test rig was modified
to produce a new assembly. The original purpose of this test rig, shown in Figure 1.2, was the
development of a novel transmission for the Shell Marathon Contest to prove the flywheel
regenerative principle. This work was carried out during an early part of the research by
Imperial College undergraduate students as part of a Design, Manufacturing and Test (DMT)
project [3] aided by the author.
The team succeeded in building a rig with a flywheel and a double epicyclic gearbox to
transmit power from the flywheel to a rotating vehicle’s tyre, used as a crude dynamometer.
However, the regenerative principle remained unproven, and due to the lack of adequate
instrumentation, it was not possible to gather sufficient data to validate the operation of the
system.
Given that the DMT project was designed at an early stage of this project, the transmission,
the flywheel and the motor of the DMT rig were utilised in this project for the assembly of the
rig. The characteristics of these parts are explained in this section.
3
Figure 1.2. Assembly of DMT project (Illustration from Gretton et al. [3]).
1.3.1.1 The transmission
The transmission used was a double epicyclic gearbox. This type of transmission was selected
for the DMT project because of the high ratio required between the flywheel and the driven
vehicle speed. An electric motor was connected to the ring, the flywheel to the sun and the
vehicle’s tyre to the carrier of the gearbox, as shown in Figure 1.3.
Figure 1.3. DMT transmission configuration.
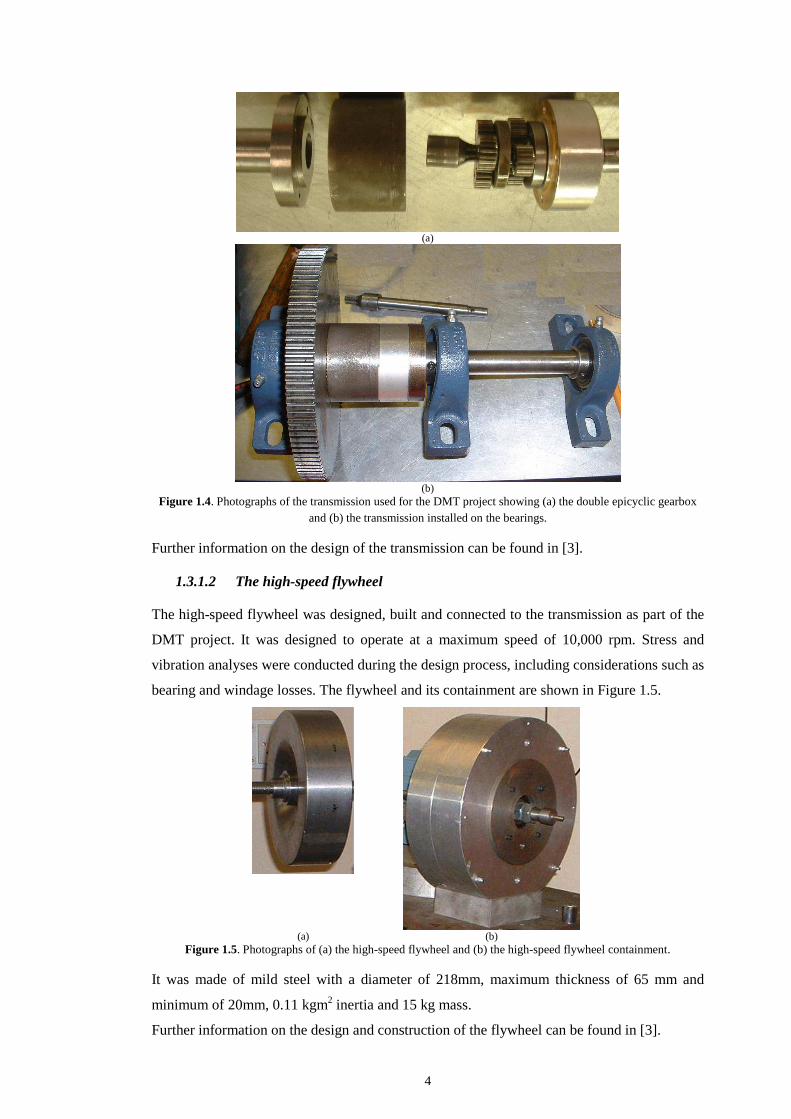
The gearbox selected was a double epicyclic gearbox model P62.29 that has a number of teeth
of 1S =8, 1R =46, 2S =14, and 2R =46. This gearbox, shown in Figure 1.4, has a maximum
torque capability of 25 Nm, and was ordered from Drivelines Technology [4].
4
(a)
(b)
Figure 1.4. Photographs of the transmission used for the DMT project showing (a) the double epicyclic gearbox and (b) the transmission installed on the bearings.
Further information on the design of the transmission can be found in [3].
1.3.1.2 The high-speed flywheel
The high-speed flywheel was designed, built and connected to the transmission as part of the
DMT project. It was designed to operate at a maximum speed of 10,000 rpm. Stress and
vibration analyses were conducted during the design process, including considerations such as
bearing and windage losses. The flywheel and its containment are shown in Figure 1.5.
(a) (b)
Figure 1.5. Photographs of (a) the high-speed flywheel and (b) the high-speed flywheel containment.
It was made of mild steel with a diameter of 218mm, maximum thickness of 65 mm and
minimum of 20mm, 0.11 kgm2 inertia and 15 kg mass.
Further information on the design and construction of the flywheel can be found in [3].
5
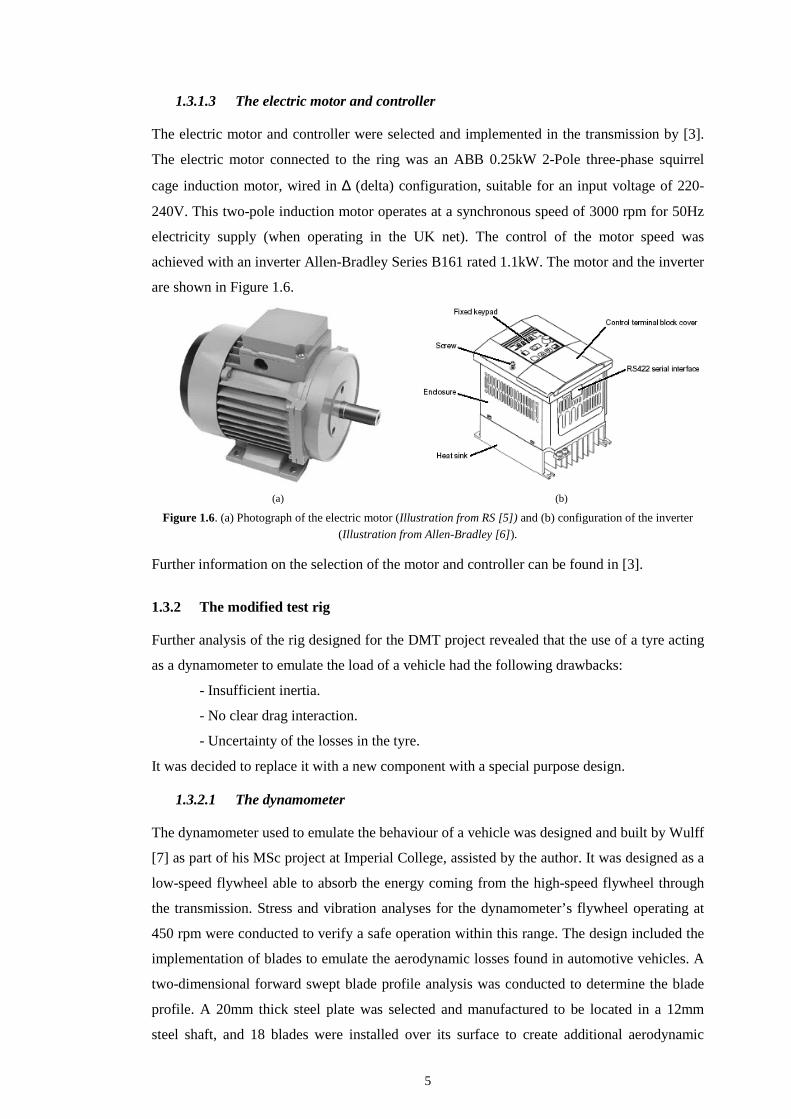
1.3.1.3 The electric motor and controller
The electric motor and controller were selected and implemented in the transmission by [3].
The electric motor connected to the ring was an ABB 0.25kW 2-Pole three-phase squirrel
cage induction motor, wired in ∆ (delta) configuration, suitable for an input voltage of 220-
240V. This two-pole induction motor operates at a synchronous speed of 3000 rpm for 50Hz
electricity supply (when operating in the UK net). The control of the motor speed was
achieved with an inverter Allen-Bradley Series B161 rated 1.1kW. The motor and the inverter
are shown in Figure 1.6.
(a) (b)
Figure 1.6. (a) Photograph of the electric motor (Illustration from RS [5]) and (b) configuration of the inverter (Illustration from Allen-Bradley [6]).
Further information on the selection of the motor and controller can be found in [3].
1.3.2 The modified test rig
Further analysis of the rig designed for the DMT project revealed that the use of a tyre acting
as a dynamometer to emulate the load of a vehicle had the following drawbacks:
- Insufficient inertia.
- No clear drag interaction.
- Uncertainty of the losses in the tyre.
It was decided to replace it with a new component with a special purpose design.
1.3.2.1 The dynamometer
The dynamometer used to emulate the behaviour of a vehicle was designed and built by Wulff
[7] as part of his MSc project at Imperial College, assisted by the author. It was designed as a
low-speed flywheel able to absorb the energy coming from the high-speed flywheel through
the transmission. Stress and vibration analyses for the dynamometer’s flywheel operating at
450 rpm were conducted to verify a safe operation within this range. The design included the
implementation of blades to emulate the aerodynamic losses found in automotive vehicles. A
two-dimensional forward swept blade profile analysis was conducted to determine the blade
profile. A 20mm thick steel plate was selected and manufactured to be located in a 12mm
steel shaft, and 18 blades were installed over its surface to create additional aerodynamic
6
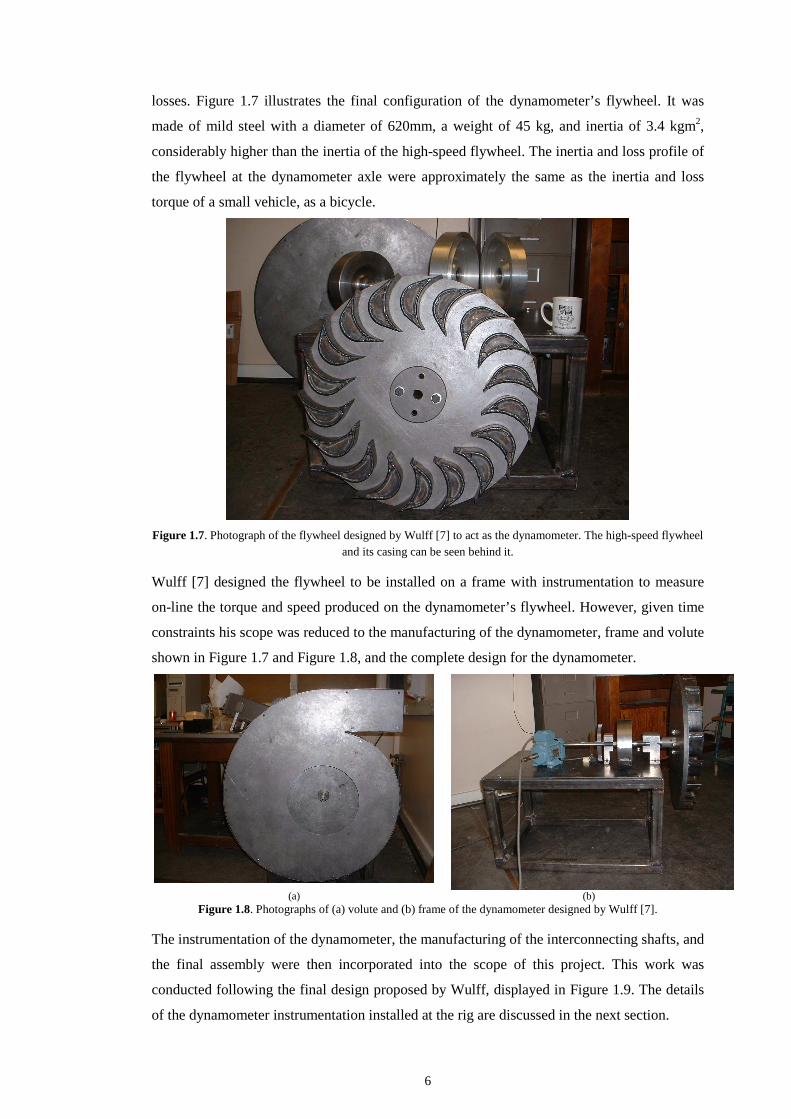
losses. Figure 1.7 illustrates the final configuration of the dynamometer’s flywheel. It was
made of mild steel with a diameter of 620mm, a weight of 45 kg, and inertia of 3.4 kgm2,
considerably higher than the inertia of the high-speed flywheel. The inertia and loss profile of
the flywheel at the dynamometer axle were approximately the same as the inertia and loss
torque of a small vehicle, as a bicycle.
Figure 1.7. Photograph of the flywheel designed by Wulff [7] to act as the dynamometer. The high-speed flywheel
and its casing can be seen behind it.
Wulff [7] designed the flywheel to be installed on a frame with instrumentation to measure
on-line the torque and speed produced on the dynamometer’s flywheel. However, given time
constraints his scope was reduced to the manufacturing of the dynamometer, frame and volute
shown in Figure 1.7 and Figure 1.8, and the complete design for the dynamometer.
(a) (b)
Figure 1.8. Photographs of (a) volute and (b) frame of the dynamometer designed by Wulff [7].
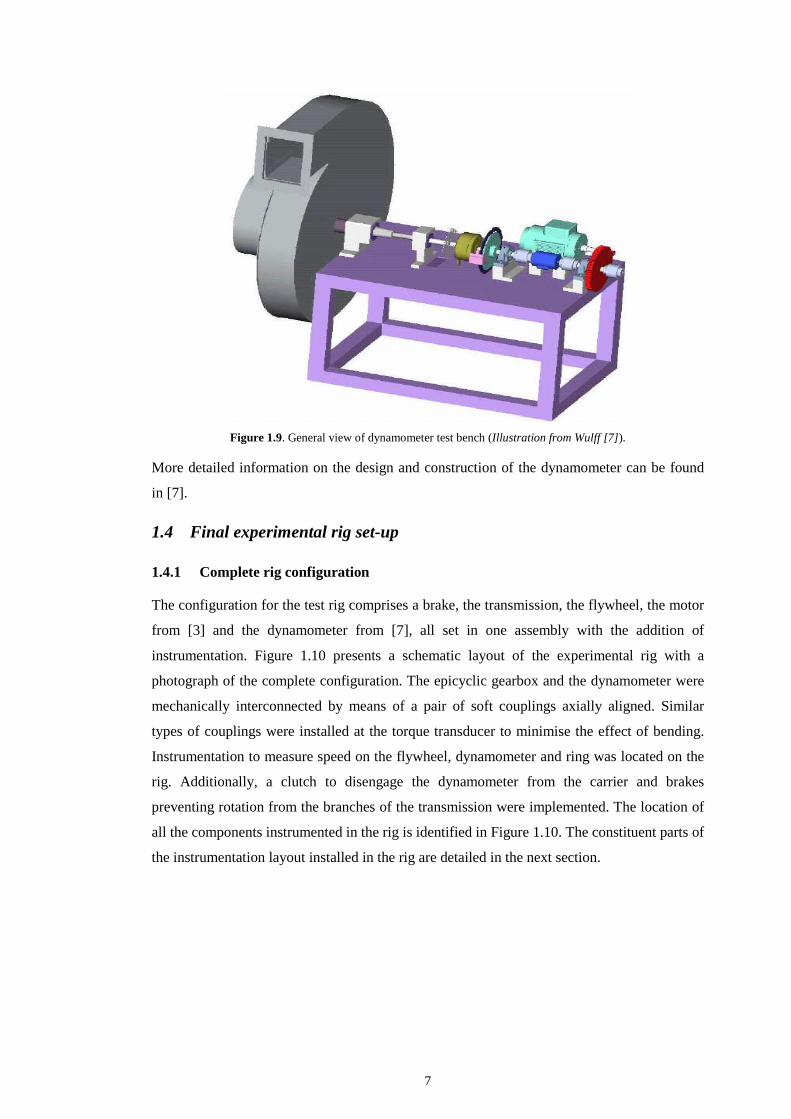
The instrumentation of the dynamometer, the manufacturing of the interconnecting shafts, and
the final assembly were then incorporated into the scope of this project. This work was
conducted following the final design proposed by Wulff, displayed in Figure 1.9. The details
of the dynamometer instrumentation installed at the rig are discussed in the next section.
7
Figure 1.9. General view of dynamometer test bench (Illustration from Wulff [7]).
More detailed information on the design and construction of the dynamometer can be found
in [7].
1.4 Final experimental rig set-up
1.4.1 Complete rig configuration
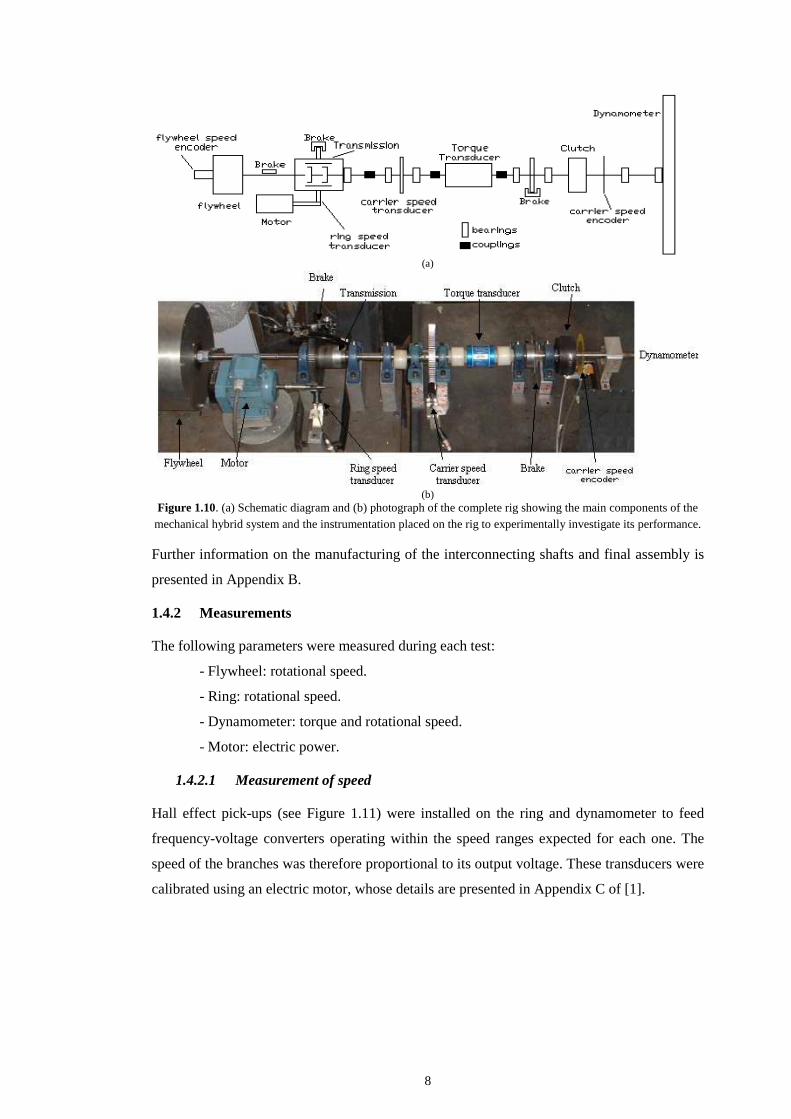
The configuration for the test rig comprises a brake, the transmission, the flywheel, the motor
from [3] and the dynamometer from [7], all set in one assembly with the addition of
instrumentation. Figure 1.10 presents a schematic layout of the experimental rig with a
photograph of the complete configuration. The epicyclic gearbox and the dynamometer were
mechanically interconnected by means of a pair of soft couplings axially aligned. Similar
types of couplings were installed at the torque transducer to minimise the effect of bending.
Instrumentation to measure speed on the flywheel, dynamometer and ring was located on the
rig. Additionally, a clutch to disengage the dynamometer from the carrier and brakes
preventing rotation from the branches of the transmission were implemented. The location of
all the components instrumented in the rig is identified in Figure 1.10. The constituent parts of
the instrumentation layout installed in the rig are detailed in the next section.
8
(a)
(b)
Figure 1.10. (a) Schematic diagram and (b) photograph of the complete rig showing the main components of the mechanical hybrid system and the instrumentation placed on the rig to experimentally investigate its performance.
Further information on the manufacturing of the interconnecting shafts and final assembly is
presented in Appendix B.
1.4.2 Measurements
The following parameters were measured during each test:
- Flywheel: rotational speed.
- Ring: rotational speed.
- Dynamometer: torque and rotational speed.
- Motor: electric power.
1.4.2.1 Measurement of speed
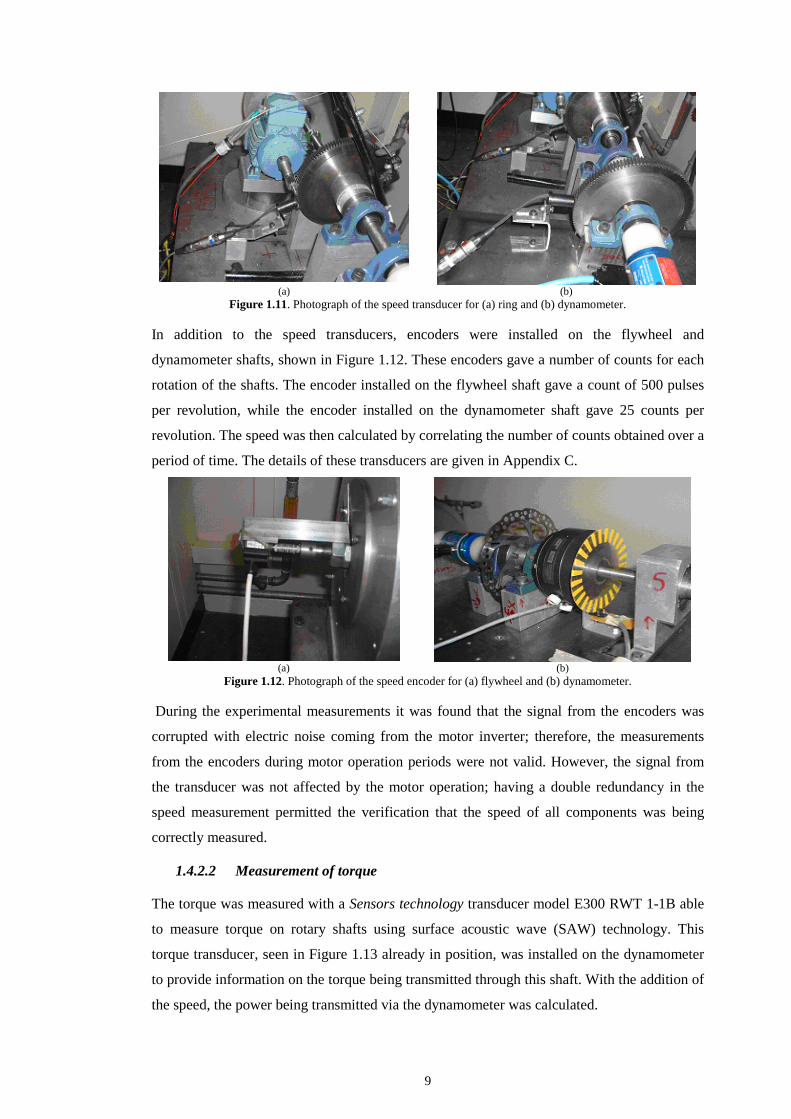
Hall effect pick-ups (see Figure 1.11) were installed on the ring and dynamometer to feed
frequency-voltage converters operating within the speed ranges expected for each one. The
speed of the branches was therefore proportional to its output voltage. These transducers were
calibrated using an electric motor, whose details are presented in Appendix C of [1].
9
(a) (b)
Figure 1.11. Photograph of the speed transducer for (a) ring and (b) dynamometer.
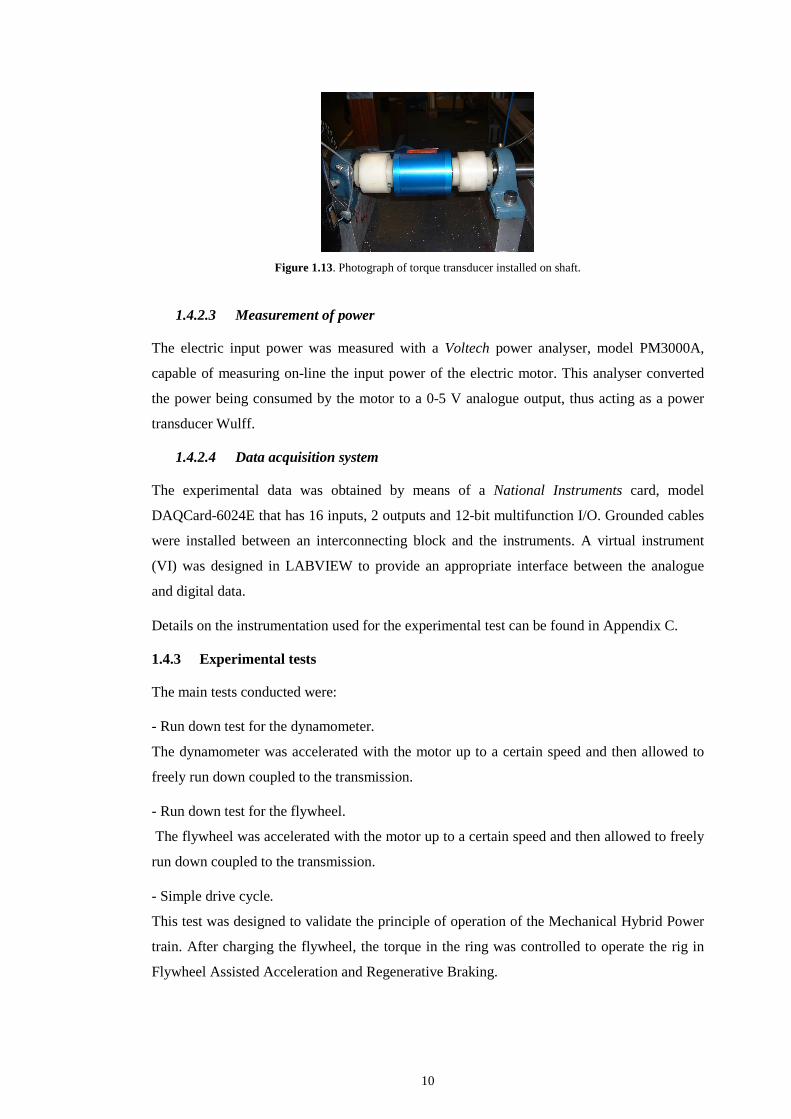
In addition to the speed transducers, encoders were installed on the flywheel and
dynamometer shafts, shown in Figure 1.12. These encoders gave a number of counts for each
rotation of the shafts. The encoder installed on the flywheel shaft gave a count of 500 pulses
per revolution, while the encoder installed on the dynamometer shaft gave 25 counts per
revolution. The speed was then calculated by correlating the number of counts obtained over a
period of time. The details of these transducers are given in Appendix C.
(a) (b)
Figure 1.12. Photograph of the speed encoder for (a) flywheel and (b) dynamometer.
During the experimental measurements it was found that the signal from the encoders was
corrupted with electric noise coming from the motor inverter; therefore, the measurements
from the encoders during motor operation periods were not valid. However, the signal from
the transducer was not affected by the motor operation; having a double redundancy in the
speed measurement permitted the verification that the speed of all components was being
correctly measured.
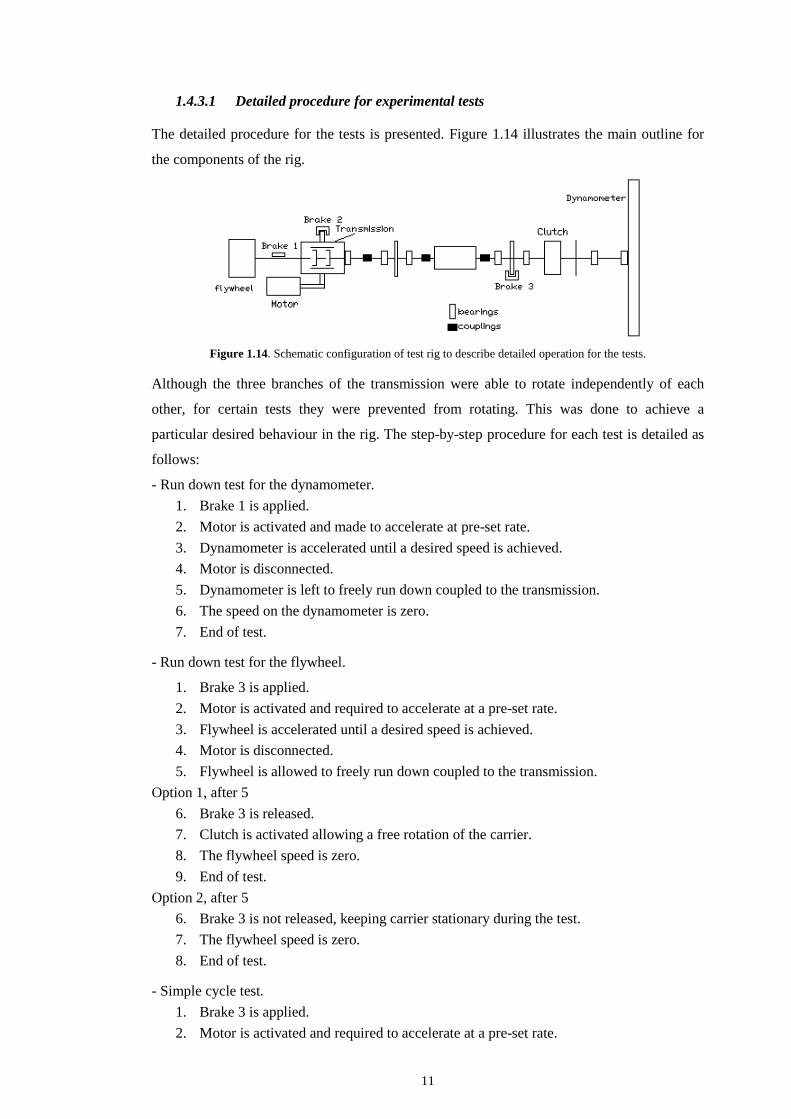
1.4.2.2 Measurement of torque
The torque was measured with a Sensors technology transducer model E300 RWT 1-1B able
to measure torque on rotary shafts using surface acoustic wave (SAW) technology. This
torque transducer, seen in Figure 1.13 already in position, was installed on the dynamometer
to provide information on the torque being transmitted through this shaft. With the addition of
the speed, the power being transmitted via the dynamometer was calculated.
10
Figure 1.13. Photograph of torque transducer installed on shaft.
1.4.2.3 Measurement of power
The electric input power was measured with a Voltech power analyser, model PM3000A,
capable of measuring on-line the input power of the electric motor. This analyser converted
the power being consumed by the motor to a 0-5 V analogue output, thus acting as a power
transducer Wulff.
1.4.2.4 Data acquisition system
The experimental data was obtained by means of a National Instruments card, model
DAQCard-6024E that has 16 inputs, 2 outputs and 12-bit multifunction I/O. Grounded cables
were installed between an interconnecting block and the instruments. A virtual instrument
(VI) was designed in LABVIEW to provide an appropriate interface between the analogue
and digital data.
Details on the instrumentation used for the experimental test can be found in Appendix C.
1.4.3 Experimental tests
The main tests conducted were:
- Run down test for the dynamometer.
The dynamometer was accelerated with the motor up to a certain speed and then allowed to
freely run down coupled to the transmission.
- Run down test for the flywheel.
The flywheel was accelerated with the motor up to a certain speed and then allowed to freely
run down coupled to the transmission.
- Simple drive cycle.
This test was designed to validate the principle of operation of the Mechanical Hybrid Power
train. After charging the flywheel, the torque in the ring was controlled to operate the rig in
Flywheel Assisted Acceleration and Regenerative Braking.
11
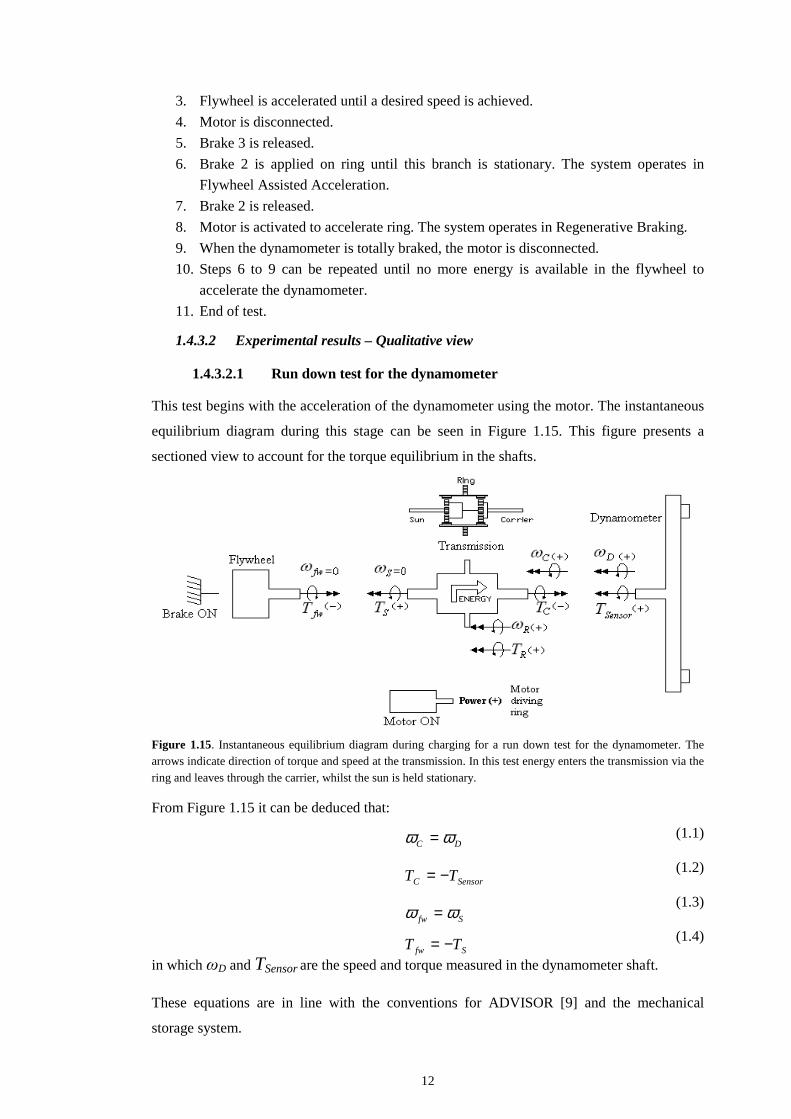
1.4.3.1 Detailed procedure for experimental tests
The detailed procedure for the tests is presented. Figure 1.14 illustrates the main outline for
the components of the rig.
Figure 1.14. Schematic configuration of test rig to describe detailed operation for the tests.
Although the three branches of the transmission were able to rotate independently of each
other, for certain tests they were prevented from rotating. This was done to achieve a
particular desired behaviour in the rig. The step-by-step procedure for each test is detailed as
follows:
- Run down test for the dynamometer.
1. Brake 1 is applied.
2. Motor is activated and made to accelerate at pre-set rate.
3. Dynamometer is accelerated until a desired speed is achieved.
4. Motor is disconnected.
5. Dynamometer is left to freely run down coupled to the transmission.
6. The speed on the dynamometer is zero.
7. End of test.
- Run down test for the flywheel.
1. Brake 3 is applied.
2. Motor is activated and required to accelerate at a pre-set rate.
3. Flywheel is accelerated until a desired speed is achieved.
4. Motor is disconnected.
5. Flywheel is allowed to freely run down coupled to the transmission.
Option 1, after 5
6. Brake 3 is released.
7. Clutch is activated allowing a free rotation of the carrier.
8. The flywheel speed is zero.
9. End of test.
Option 2, after 5
6. Brake 3 is not released, keeping carrier stationary during the test.
7. The flywheel speed is zero.
8. End of test.
- Simple cycle test.
1. Brake 3 is applied.
2. Motor is activated and required to accelerate at a pre-set rate.
12
3. Flywheel is accelerated until a desired speed is achieved.
4. Motor is disconnected.
5. Brake 3 is released.
6. Brake 2 is applied on ring until this branch is stationary. The system operates in
Flywheel Assisted Acceleration.
7. Brake 2 is released.
8. Motor is activated to accelerate ring. The system operates in Regenerative Braking.
9. When the dynamometer is totally braked, the motor is disconnected.
10. Steps 6 to 9 can be repeated until no more energy is available in the flywheel to
accelerate the dynamometer.
11. End of test.
1.4.3.2 Experimental results – Qualitative view
1.4.3.2.1 Run down test for the dynamometer
This test begins with the acceleration of the dynamometer using the motor. The instantaneous
equilibrium diagram during this stage can be seen in Figure 1.15. This figure presents a
sectioned view to account for the torque equilibrium in the shafts.
Figure 1.15. Instantaneous equilibrium diagram during charging for a run down test for the dynamometer. The arrows indicate direction of torque and speed at the transmission. In this test energy enters the transmission via the ring and leaves through the carrier, whilst the sun is held stationary.
From Figure 1.15 it can be deduced that:
(1.1)
(1.2)
(1.3)
(1.4)
in which ωD and TSensor are the speed and torque measured in the dynamometer shaft.
These equations are in line with the conventions for ADVISOR [9] and the mechanical
storage system.
DC ωω =
SensorC TT −=
Sfw ωω =
Sfw TT −=
13
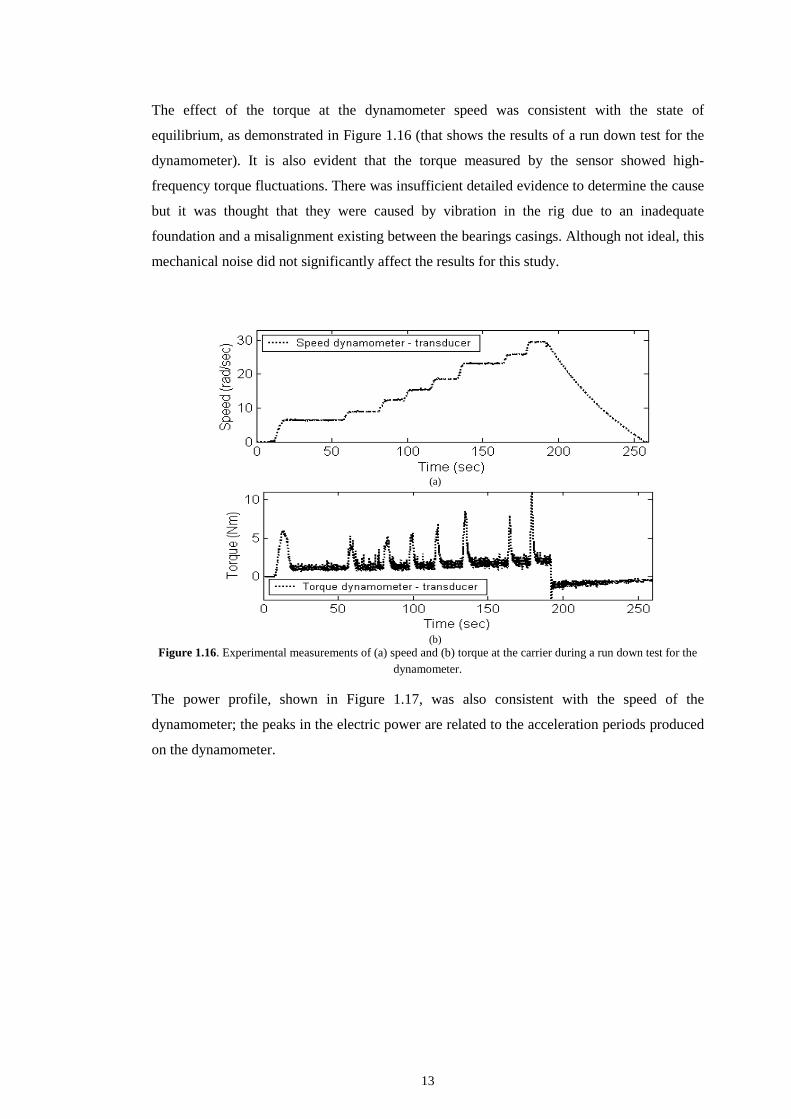
The effect of the torque at the dynamometer speed was consistent with the state of
equilibrium, as demonstrated in Figure 1.16 (that shows the results of a run down test for the
dynamometer). It is also evident that the torque measured by the sensor showed high-
frequency torque fluctuations. There was insufficient detailed evidence to determine the cause
but it was thought that they were caused by vibration in the rig due to an inadequate
foundation and a misalignment existing between the bearings casings. Although not ideal, this
mechanical noise did not significantly affect the results for this study.
(a)
(b)
Figure 1.16. Experimental measurements of (a) speed and (b) torque at the carrier during a run down test for the dynamometer.
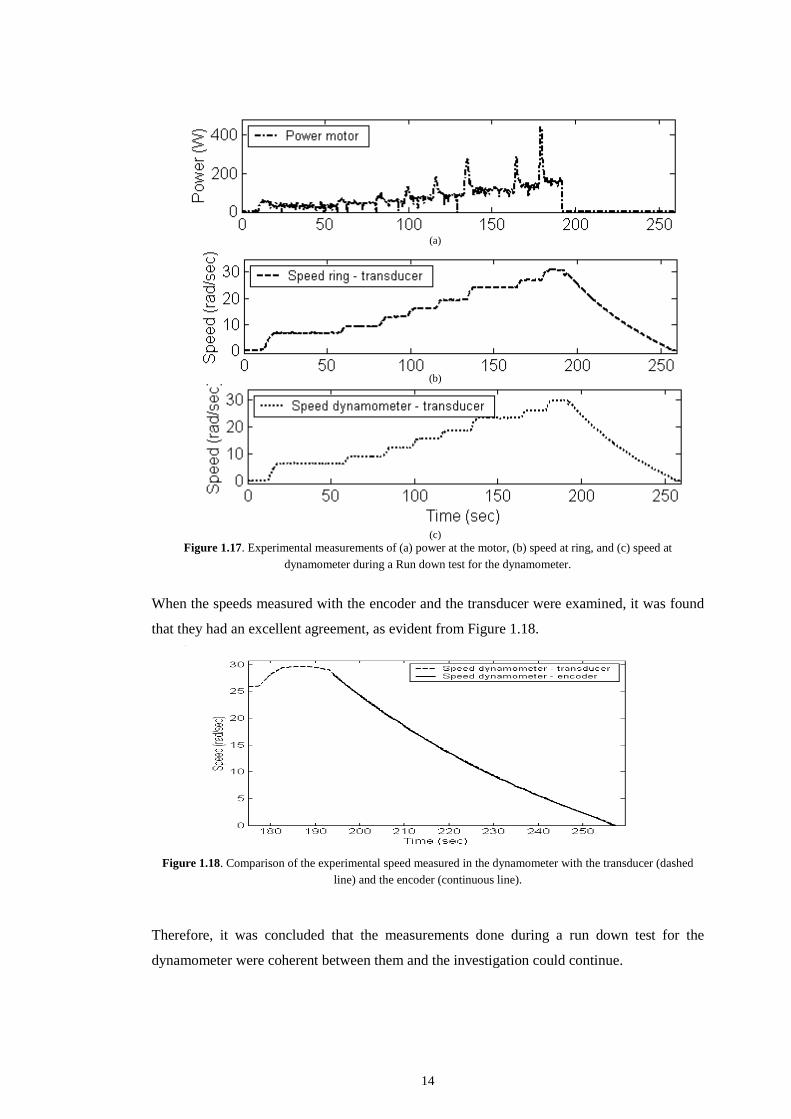
The power profile, shown in Figure 1.17, was also consistent with the speed of the
dynamometer; the peaks in the electric power are related to the acceleration periods produced
on the dynamometer.
14
(a)
(b)
(c)
Figure 1.17. Experimental measurements of (a) power at the motor, (b) speed at ring, and (c) speed at dynamometer during a Run down test for the dynamometer.
When the speeds measured with the encoder and the transducer were examined, it was found
that they had an excellent agreement, as evident from Figure 1.18.
Figure 1.18. Comparison of the experimental speed measured in the dynamometer with the transducer (dashed
line) and the encoder (continuous line).
Therefore, it was concluded that the measurements done during a run down test for the
dynamometer were coherent between them and the investigation could continue.
15
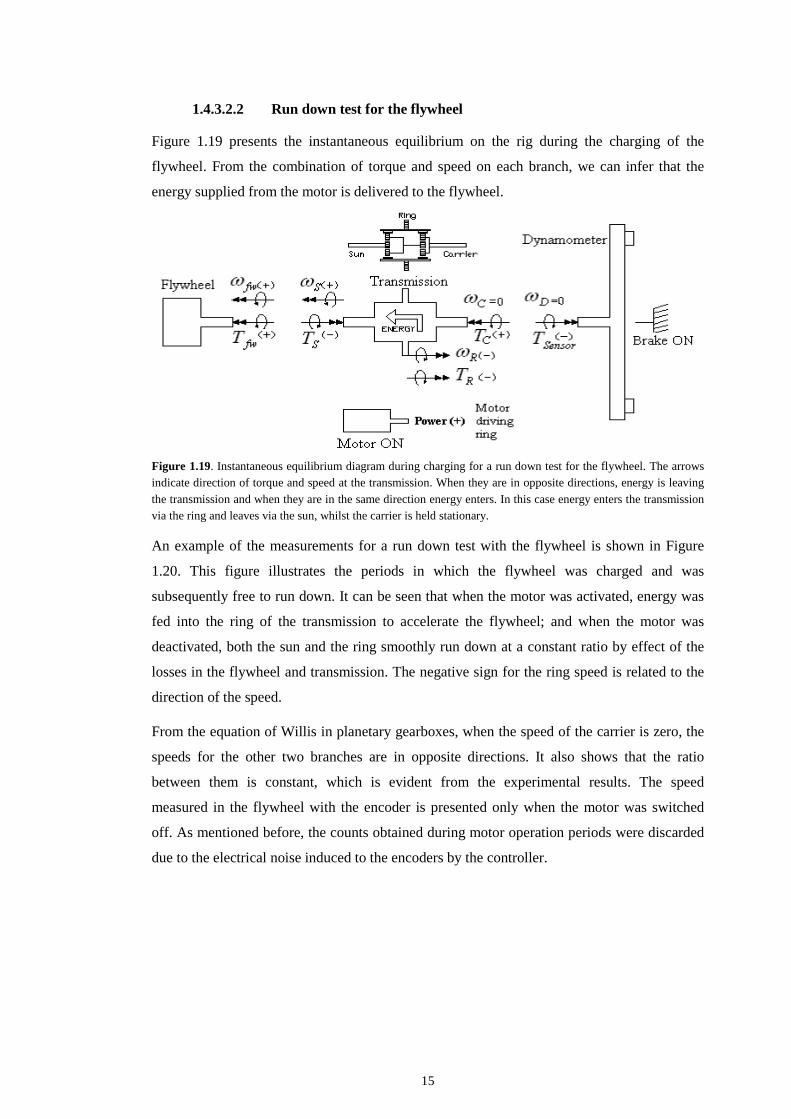
1.4.3.2.2 Run down test for the flywheel
Figure 1.19 presents the instantaneous equilibrium on the rig during the charging of the
flywheel. From the combination of torque and speed on each branch, we can infer that the
energy supplied from the motor is delivered to the flywheel.
Figure 1.19. Instantaneous equilibrium diagram during charging for a run down test for the flywheel. The arrows indicate direction of torque and speed at the transmission. When they are in opposite directions, energy is leaving the transmission and when they are in the same direction energy enters. In this case energy enters the transmission via the ring and leaves via the sun, whilst the carrier is held stationary.
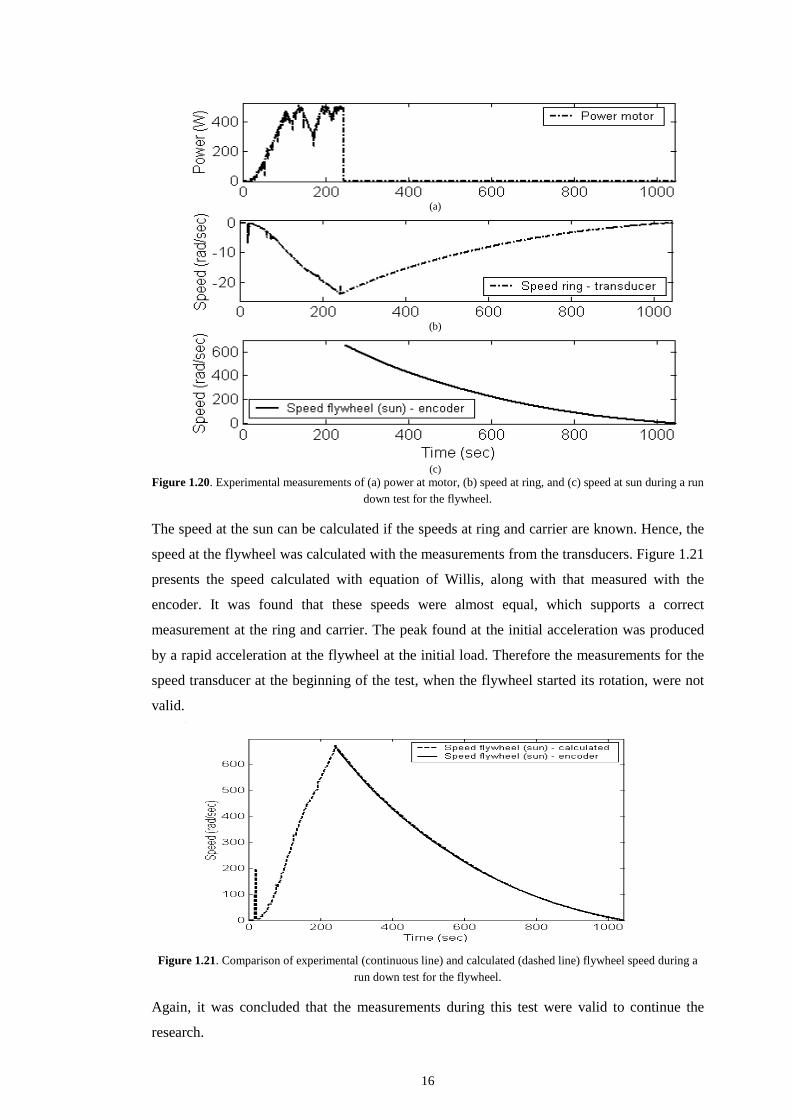
An example of the measurements for a run down test with the flywheel is shown in Figure
1.20. This figure illustrates the periods in which the flywheel was charged and was
subsequently free to run down. It can be seen that when the motor was activated, energy was
fed into the ring of the transmission to accelerate the flywheel; and when the motor was
deactivated, both the sun and the ring smoothly run down at a constant ratio by effect of the
losses in the flywheel and transmission. The negative sign for the ring speed is related to the
direction of the speed.
From the equation of Willis in planetary gearboxes, when the speed of the carrier is zero, the
speeds for the other two branches are in opposite directions. It also shows that the ratio
between them is constant, which is evident from the experimental results. The speed
measured in the flywheel with the encoder is presented only when the motor was switched
off. As mentioned before, the counts obtained during motor operation periods were discarded
due to the electrical noise induced to the encoders by the controller.
16
(a)
(b)
(c)
Figure 1.20. Experimental measurements of (a) power at motor, (b) speed at ring, and (c) speed at sun during a run down test for the flywheel.
The speed at the sun can be calculated if the speeds at ring and carrier are known. Hence, the
speed at the flywheel was calculated with the measurements from the transducers. Figure 1.21
presents the speed calculated with equation of Willis, along with that measured with the
encoder. It was found that these speeds were almost equal, which supports a correct
measurement at the ring and carrier. The peak found at the initial acceleration was produced
by a rapid acceleration at the flywheel at the initial load. Therefore the measurements for the
speed transducer at the beginning of the test, when the flywheel started its rotation, were not
valid.
Figure 1.21. Comparison of experimental (continuous line) and calculated (dashed line) flywheel speed during a
run down test for the flywheel.
Again, it was concluded that the measurements during this test were valid to continue the
research.
17
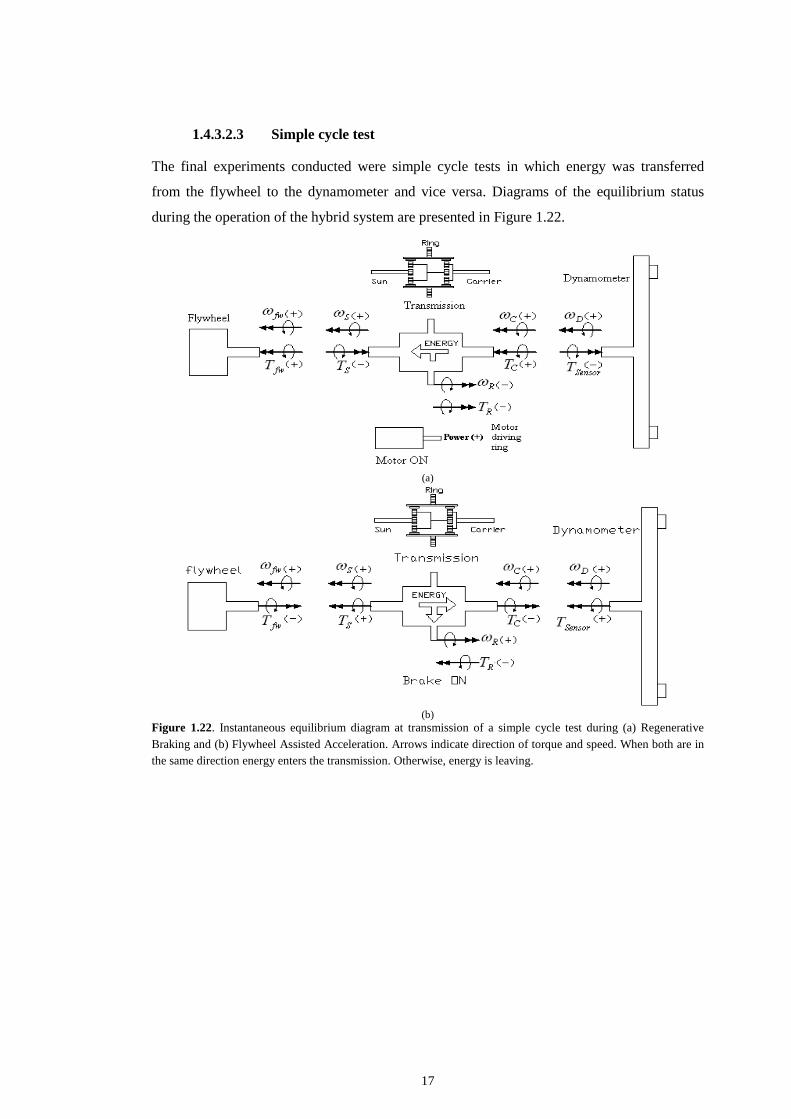
1.4.3.2.3 Simple cycle test
The final experiments conducted were simple cycle tests in which energy was transferred
from the flywheel to the dynamometer and vice versa. Diagrams of the equilibrium status
during the operation of the hybrid system are presented in Figure 1.22.
(a)
(b)
Figure 1.22. Instantaneous equilibrium diagram at transmission of a simple cycle test during (a) Regenerative Braking and (b) Flywheel Assisted Acceleration. Arrows indicate direction of torque and speed. When both are in the same direction energy enters the transmission. Otherwise, energy is leaving.
18
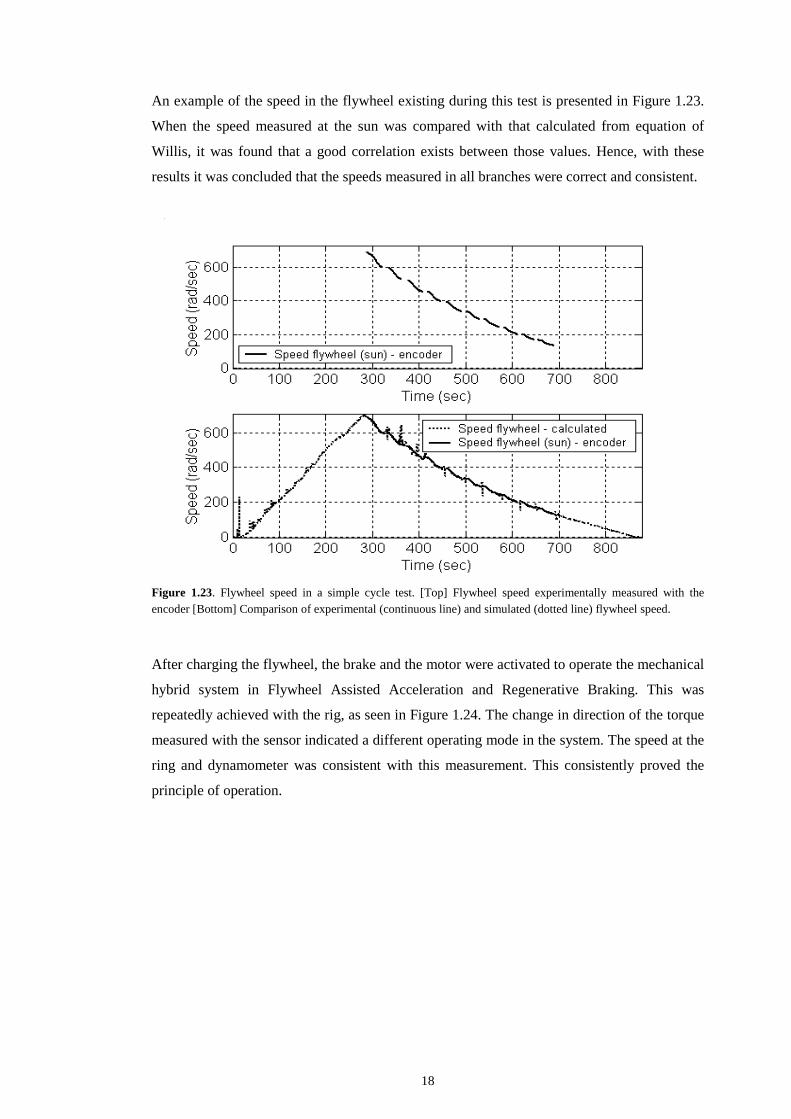
An example of the speed in the flywheel existing during this test is presented in Figure 1.23.
When the speed measured at the sun was compared with that calculated from equation of
Willis, it was found that a good correlation exists between those values. Hence, with these
results it was concluded that the speeds measured in all branches were correct and consistent.
Figure 1.23. Flywheel speed in a simple cycle test. [Top] Flywheel speed experimentally measured with the encoder [Bottom] Comparison of experimental (continuous line) and simulated (dotted line) flywheel speed.
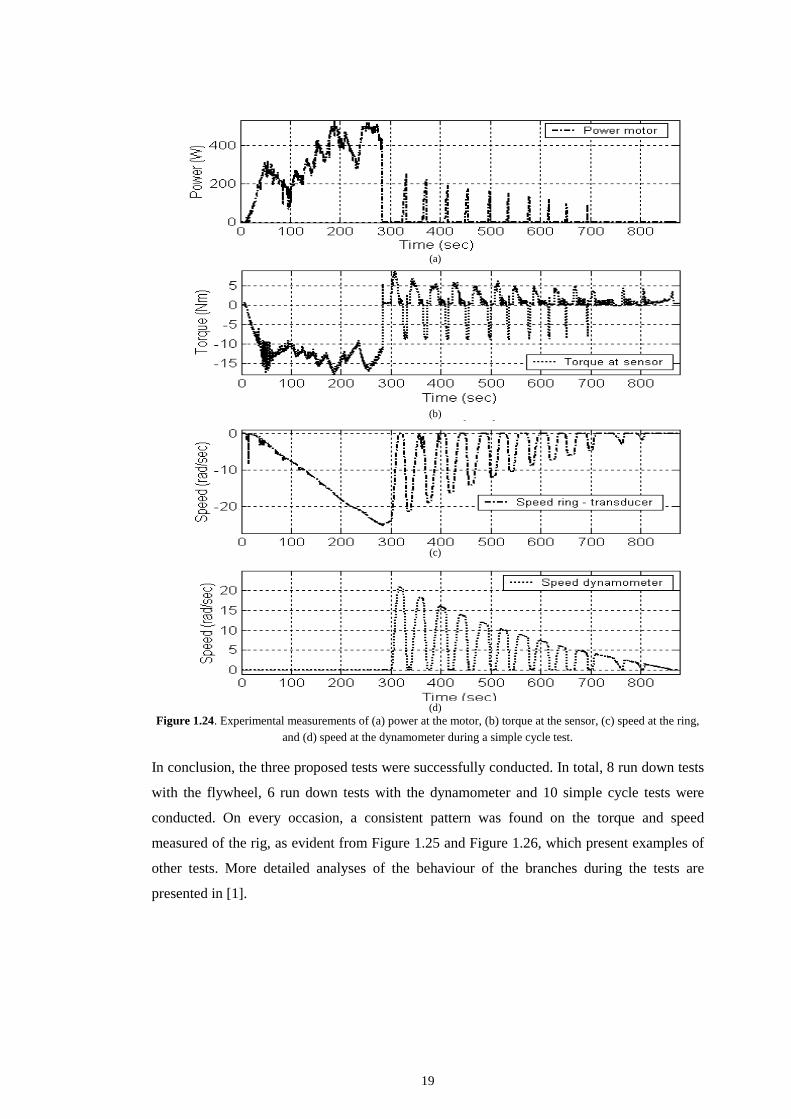
After charging the flywheel, the brake and the motor were activated to operate the mechanical
hybrid system in Flywheel Assisted Acceleration and Regenerative Braking. This was
repeatedly achieved with the rig, as seen in Figure 1.24. The change in direction of the torque
measured with the sensor indicated a different operating mode in the system. The speed at the
ring and dynamometer was consistent with this measurement. This consistently proved the
principle of operation.
19
(a)
(b)
(c)
(d)
Figure 1.24. Experimental measurements of (a) power at the motor, (b) torque at the sensor, (c) speed at the ring, and (d) speed at the dynamometer during a simple cycle test.
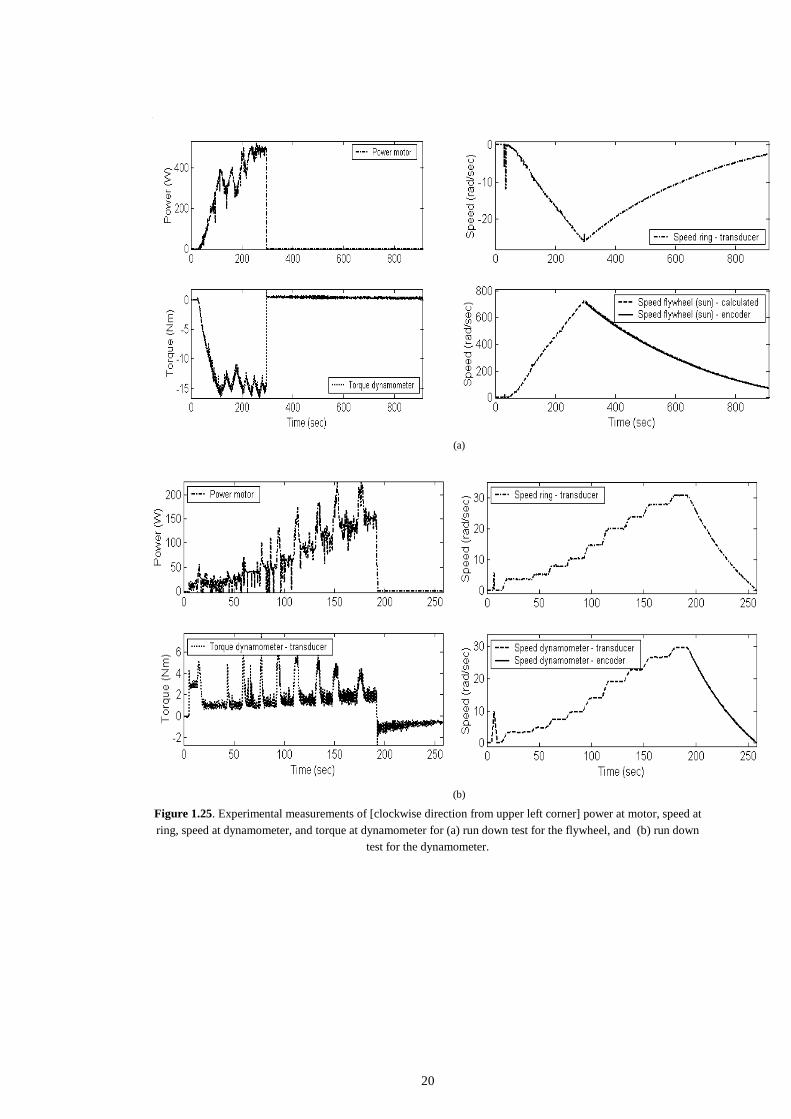
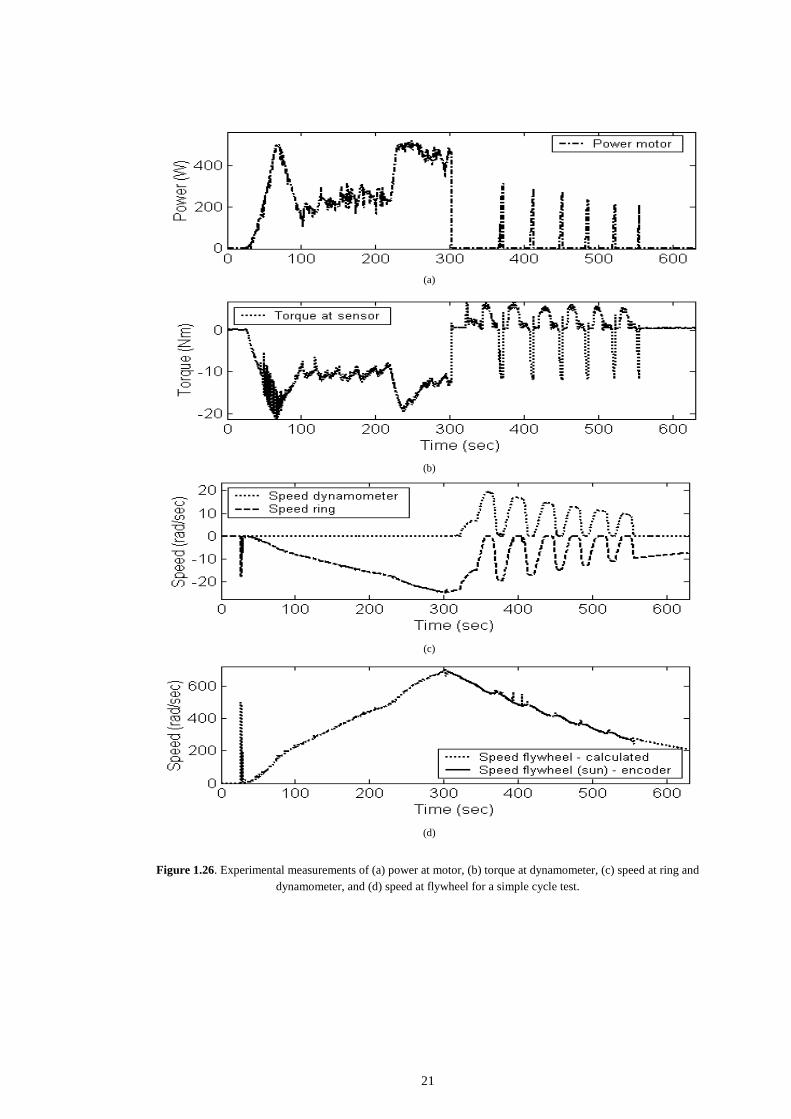
In conclusion, the three proposed tests were successfully conducted. In total, 8 run down tests
with the flywheel, 6 run down tests with the dynamometer and 10 simple cycle tests were
conducted. On every occasion, a consistent pattern was found on the torque and speed
measured of the rig, as evident from Figure 1.25 and Figure 1.26, which present examples of
other tests. More detailed analyses of the behaviour of the branches during the tests are
presented in [1].
20
(a)
(b)
Figure 1.25. Experimental measurements of [clockwise direction from upper left corner] power at motor, speed at ring, speed at dynamometer, and torque at dynamometer for (a) run down test for the flywheel, and (b) run down
test for the dynamometer.
21
(a)
(b)
(c)
(d)
Figure 1.26. Experimental measurements of (a) power at motor, (b) torque at dynamometer, (c) speed at ring and dynamometer, and (d) speed at flywheel for a simple cycle test.
22
Conclusions of the measurements conducted and the experimental test bed.
It was thus validated that the experimental system was operating according to the theory. The
nmeasurements gathered from the test bed were in total agreement with the expected
behaviour. These results were used to validate a computational model to assess the
performance of such transmission in a hybrid vehicle. The ability to faithfully model systems
of this type dynamically using computational methods in the ADVISOR/Matlab platform is
assessed and validated by comparison with these experimental tests in [1]. The validation of
the principle of operation of the mechanical energy storage system and its computation model
was required to simulate the performance of real size hybrid vehicles with confidence in a
later stage of this investigation. Further explanation of this can be seen in [1] and [2].
References
[1] Diego-Ayala, U. “An investigation into hybrid power trains for vehicles with
regenerative braking”. PhD Thesis, Department of Mechanical Engineering, Imperial
College, London, 2007.
[2] U. Diego-Ayala, P Martinez-Gonzalez, N McGlashan, and K R Pullen, “The
Mechanical Hybrid Vehicle, an investigation of a vehicular regenerative energy
capture system”, Proceedings of the IMechE, Part D Journal of Automobile
Engineering, vol 222 (11), 2008, p. 2087-2101.
[3] G. Gretton, J. Noble, M. Gosling, and S. Thomas. The development of a hybrid
transmission system for use in the shell mileage marathon vehicle. 3M DMT project
report, Imperial College, London, 2002.
[4] Drivelines Technology. power transmission solutions. Available at:
http://www.drivelines.co.uk/.
[5] RS. AC Industrial Electric Motors. In Data Sheet 232-5812, vol. September, 2001.
[6] Allen-Bradley. User manual. In Bulletin 161 AC Drive (Series B) 0.2-3.7kW (0.3 to 5
hp) FRN 2.001.
[7] J. S. Wulff. Experimental validation of a novel hybrid vehicle transmission. MSc
thesis in Department of Mechanical Engineering. London: Imperial College, 2004.
[8] Voltech. PM3000A Power Analyser User Manual. In manual VPN 98-051/5, 1998.
[9] T. Markel, A. Brooker, I. Hendricks, V. Johnson, K. Kelly, B. Kramer, M. O'Keefe,
S. Sprik, and K. Wipke. ADVISOR: a systems analysis tool for advanced vehicle
modeling. J. Power Sources, 2002, 110(2), 255-266.