numerical simulation of air ventilation and its
TRANSCRIPT
Contents lists available at ScienceDirect
Ocean Engineering
journal homepage: www.elsevier.com/locate/oceaneng
Numerical simulation of air ventilation and its suppression on inclinedsurface-piercing hydrofoils
Konstantin I. Matveeva,∗, Miles P. Wheelera, Tao Xingb
a School of Mechanical and Materials Engineering, Washington State University, Pullman, WA, 99164, USAb Department of Mechanical Engineering, University of Idaho, Moscow, ID, 83844, USA
A R T I C L E I N F O
Keywords:HydrofoilAir ventilationSurface flowsNumerical simulation
A B S T R A C T
Hydrofoils with significant camber and thickness can be hydrodynamically advantageous over thin low-camberhydrofoils commonly used on boats with surface-piercing hydrofoil systems, especially at lower speeds when apronounced drag hump is usually present and cavitation is not yet an issue. The main drawback of such high-lifthydrofoils is a danger of being ventilated with air that can easily propagate from the atmosphere along the foilsuction side resulting in a drop of the foil lift-drag ratio. The air ventilation is a complex physical process,modeling of which remains a challenging task. In this study, a computational fluid dynamics solver STAR-CCM+is applied for simulating air ventilation phenomena on surface-piercing hydrofoils. A good agreement is obtainedwith available test data for relevant configurations. It is also shown that small fences appropriately placed on theinclined surface-piercing hydrofoil can suppress both downward air ventilation and upward water spray, re-sulting in greater performance of high-lift hydrofoils at moderate Froude numbers.
1. Introduction
Hydrofoil boats are known to have high lift-drag ratios when op-erating in the optimal operational conditions at relatively high speeds.In case of common self-stabilized surface-piercing hydrofoil systems,thin low-camber foil profiles are often employed (Fig. 1a). However,such hydrofoils are ineffective at lower speeds when they do not gen-erate significant lift but create substantial drag. In order to improveboat performance at lower speeds and heavier loadings, one may try touse thicker, more cambered foil sections similar to those used on air-planes (Fig. 1b). These profiles have higher maximum lift coefficientsand higher lift-drag ratios, so they could produce larger lift and smallerdrag at moderate speeds. Although such hydrofoils are also less prone tothe leading-edge ventilation than thinner foils, thicker foils couldgenerate more spray and be more susceptible to air ventilation initiatedon the suction side away from the leading edge.
It is known that many hydrodynamic devices producing lifting/lateral/thrust forces, such as hydrofoils, rudders, and propellers, oftenexperience air ventilation when operating close to the water surface.The atmospheric air can propagate to low-pressure zones on suctionsurfaces of these devices and degrade their hydrodynamic performanceby limiting pressure decrease. The air ventilation phenomena may alsohave complex dynamics, resulting in sudden changes of forces or evennon-unique flow states at the same operational conditions, which are
usually very undesirable.One illustration of the air ventilation process on an inclined surface-
piercing hydrofoil is shown in Fig. 2a. The atmospheric air propagatesdownward along the foil span, reducing the foil lifting capabilities. Atthe same time, a water jet is formed on the foil portion located abovethe nominal water surface, leading to increased drag. Both processesreduce hydrodynamic performance of the system. One way to coun-teract them is to place small fences on the foil that will limit both theair-ventilated and water-jet zones (Fig. 2b). Numerical modeling of asurface-piercing hydrofoil with and without fences is the main subjectof this paper.
The air ventilation processes have been extensively studied since the1950's when mass production of hydrofoil boats had commenced.Ventilation on surface-piercing bodies of various shapes was exploredby Straub and Wetzel (1957). Nishiyama (1959) carried out tests up tovery low submergences of 2D hydrofoils, which demonstrated air ven-tilation. A small-scale ventilated V-shaped hydrofoil crossing was testedby Fridsma (1963); and some data from that study are used here forvalidation. A number of previous investigations addressed verticalstruts that can be also thought of as hydrofoils generating a lift force inthe lateral direction. For example, Breslin and Skalak (1959) andSwales et al. (1974) looked at the different types of ventilation onset onstruts, including initiation of the ventilated cavity at the leading andtrailing edges, via a vortex formed behind the submerged foil tip, and
https://doi.org/10.1016/j.oceaneng.2019.02.040Received 12 July 2018; Received in revised form 7 December 2018; Accepted 10 February 2019
∗ Corresponding author.E-mail address: [email protected] (K.I. Matveev).
Ocean Engineering 175 (2019) 251–261
0029-8018/ © 2019 Elsevier Ltd. All rights reserved.
T

upon cavitation inception. It can be noted that air ventilation in manycases resembles developed cavitation, where the water rupture iscaused by evaporation of water at low pressure instead of incoming air.Both ventilated and developed cavitating flows are often analyzed withsimilar mathematical tools, such as the potential flow theory (Ivanov,1980; Kinnas and Young, 2003; Matveev, 2011). A thesis of Rothblum(1977) discussed a variety of methods for suppressing ventilation onsurface-piercing struts, including variable taper/camber, fences,blowing/suction, and other means. Among recent tests with ventilatedhydrofoils, an experimental program by Harwood et al. (2016) shouldbe noted; and their results are also utilized here for validation purposes.For a comprehensive review of air ventilation phenomena on liftingobjects, the readers are referred to a recent paper by Young et al.(2017). There are also other situations when hydrofoil ventilation isimportant. For example, Karn et al. (2015) investigated aeration of
hydrofoils with a purpose to increase oxygen content in the discharge ofhydroturbines.
Modeling of air ventilation is a challenging task due to complicatednature of multi-phase and surface flows, which may exhibit strongunsteadiness and history-dependent phenomena. The potential flowtheory has been used for approximate modeling of air-ventilated flowsin relatively simple geometries, e.g., by Ivanov (1980), Vinayan andKinnas (2010), and Harwood et al. (2016). Inclusion of viscous effects
Nomenclature
A characteristic areac hydrofoil chord
=CDD
U A
2
2drag coefficient
=CLL
U A
2
2lift coefficient
D drag forceE difference between numerical and experimental resultsf body forceF factor of safety
=FrU
gcFroude number
Gk turbulent productionh submergencek turbulent kinetic energyL lift forcep pressurepob observed order of accuracypth theoretical order of accuracy
=ReUc
µReynolds number
S modulus of the mean strain rate tensort timeu flow velocityu flow velocityU incident flow velocityUD experimental uncertaintyUNS numerical simulation uncertaintyUV validation uncertaintyx coordinate
angle of attackvolume fraction occupied by air
RE correction due to Richardson extrapolationdifference between results obtained on different gridsturbulent dissipation ratehydrofoil dihedral
µ viscosityµt turbulent eddy viscosity
densitykinematic viscosity
0 0.2 0.4 0.6 0.8 1-0.2
-0.1
0
0.1
0.2
x / c
y/c
(a)
0 0.2 0.4 0.6 0.8 1-0.2
-0.1
0
0.1
0.2
x / c
y/c
(b)
Fig. 1. Profiles of (a) flat-convex foil section typical for Russian surface-pier-cing hydrofoil systems and (b) high-lift Eppler E603 airfoil. c is the foil chord.
Fig. 2. Front-view schematics of inclined surface-piercing hydrofoil: (a) withpronounced air ventilation and water spray and (b) with fences limiting ven-tilation and spray.
K.I. Matveev, et al. Ocean Engineering 175 (2019) 251–261
252
and consideration of more complex practical configurations can beaccomplished with modern computational fluid dynamics (CFD) sol-vers. In recent years, several CFD studies addressed hydrodynamics ofsurface-piercing hydrofoils including regimes with air ventilation(Brizzolara and Villa, 2012; Harwood et al., 2014; Keller et al., 2016).Califano and Steen (2009) studied propeller ventilation using RANSapproach. Ji et al. (2010) considered a three-component model for si-mulating both cavitation and ventilation with application to under-water vehicles. Wang et al. (2015) applied both experimental and nu-merical methods to study air leakage from ventilated cavities. Yanget al. (2018) recently analyzed a ventilated 2D hydrofoil with differentturbulence modeling methods.
An effect of fences on hydrofoil ventilation at extreme (beyond ty-pical practical range) attack angles and without any validation wasreported by Andrun et al. (2016). The authors of the present paper haverecently conducted a validation study of a ventilated strut in a broadrange of yaw angles and demonstrated a capability of CFD to predictnon-unique flow states (hysteresis) that can exist at the same nominalconditions (Matveev et al., 2018).
The main objectives of the present study are to show validation of aRANS-based CFD approach with modest numerical cell counts for air-ventilated foils, to model hydrodynamic forces and flow regimes on aninclined surface-piercing hydrofoil with a high-lift, soft-stall sectionE603 (Fig. 1b) at moderate Froude numbers (when chord-based Fr isroughly between 2 and 5), and to demonstrate how small fences canlimit the extent of ventilation and improve hydrodynamic performance.The far-field features of the flow are not modeled in the present studydue to adopted here economical computational approach with limitedmesh refinement zones.
2. Computational approach
The computational fluid dynamics (CFD) program employed in thiswork was STAR-CCM+ of version 12.04.011. The finite-volume seg-regated flow solver utilizes SIMPLE solution algorithm and the secondorder upwind convection scheme, details of which are elaborated byFerziger and Peric (1999). The unsteady approach is based on thesecond-order implicit stepping in time. For most cases reported in thispaper only steady-state results are presented; they correspond to thestates when the time-averaged flow properties are no longer evolving.As the air ventilation phenomena include both air and water, and theEulerian multiphase approach with constant-density fluids is appliedhere for their modeling. To capture the air-water interface, the volume-of-fluid (VOF) method is employed (Hirt and Nichols, 1981). A surfacetension model and gravity are also included.
The Reynolds-averaged governing equations for incompressiblefluids include the continuity, momentum and volume fraction transportequations,
=
u
x0,
j
j (1)
+ = + + +u
t
u u
x
p
x xµ
u
x
u
xu u f
( ) ( )[ ( ) ] ,
i i j
j i j
i
j
j
ii j i
(2)
+ =
t
u
x
( )0,
i
i (3)
where ui are the Reynolds averaged velocity components, is themixture density, f is the body force (such as gravity), u ui j is theReynolds stresses, and represents the volume fraction occupied by air,so that the effective fluid density ρ and viscosity μ are calculated as= + (1 )
air waterand = +µ µ µ (1 )air water . The
Reynolds stresses are modeled with the Boussinesq hypothesis, whichfor incompressible fluids results in the following expression,
= +u u µu
x
u
xk( )
2
3,i j t
i
j
j
iij
(4)
where µt is the turbulent eddy viscosity and k is the turbulent kinetic
energy.In almost all cases studied in this work, the realizable two-layer K-
Epsilon model (Shih et al., 1995; Rodi, 1991) was utilized, although theK-Omega model was also tried for one validation case discussed in thenext section. The transport equations for the turbulent kinetic energy kand the turbulent dissipation rate in the realizable K-Epsilon modelare given as follows,
+ = + +k
t
ku
x xµ
µ k
xG
( ) ( )[( ) ] ,
j
j j
t
k jk
(5)
+ = + +
+t
u
x xµ
µ
xC S C
k
( ) ( )[( ) ] ,
j
j j
t
j1 2
2
(6)
where Gk is the generation of turbulent kinetic energy due to the meanvelocity gradients, =S S S2 ij ij is the scalar invariant of the strain rate
tensor = +S ( )iju
x
u
x
1
2
i
j
j
i, is the kinematic viscosity, C 1 and C 2 are the
model coefficients, and σk and σε
are the turbulent Prandtl numbers fork and ε, respectively. The turbulent eddy viscosity is expressed as fol-lows,
=µ Ck,t µ
2
(7)
where Cµ depends on both the mean flow and turbulence properties(e.g., Mulvany et al., 2004). More sophisticated models for the turbu-lent eddy viscosity are available in the literature that have additionalcoefficients explicitly accounting for the volume fractions (Coutier-Delgosha et al., 2003), but they have not been tried in this study.
Because of our goal to use a modest cell count due to limitedcomputational resources, we relied on the wall functions with averageY+ values for the near-wall cells of around 50, which is in the rangesuggested for the wall function approach (e.g., Wilcox, 2006; Salim andCheah, 2009). The time step on the fine mesh was selected as c U/(200 ),in accordance with ITTC recommendations (ITTC, 2011), where c is thehydrofoil chord and U is the velocity of the incoming flow. Ten inneriterations were performed to ensure adequate convergence at each timestep.
Besides the hydrofoil geometry and attitude, the important non-di-mensional parameters characterizing flow regimes are Froude andReynolds numbers,
=FrU
gc,
(8)
=ReUc
µ,
water
water (9)
where the foil chord c is used as the characteristic length for all casesconsidered in this paper. The non-dimensional force parameters ofhydrofoils are the lift and drag coefficients,
=CL
U A
2,L
water
2 (10)
=CD
U A
2,D
water
2 (11)
where the characteristic area A corresponds to the hydrofoil planformarea for a horizontally oriented, completely submerged hydrofoil. Forvertical hydrofoils crossing the water surface, only the part of theplanform area below the nominal (undisturbed) water surface is ac-counted for. In case of inclined hydrofoils, the characteristic area isusually the area projected on a horizontal plane by the hydrofoil por-tion submerged under the nominal water surface.
K.I. Matveev, et al. Ocean Engineering 175 (2019) 251–261
253

3. Verification and validation
For validation purposes three configurations with available test datawere selected in this study. The first is a ventilated vertical strut inturbulent flow at moderate Froude numbers (Harwood, 2016), thesecond is a small-scale V-shaped hydrofoil operated in wetted andventilated regimes (Fridsma, 1963), and the third is a two-dimensionalairfoil with E603 section in single-phase flow (Lasauskas andNaujokaitis, 2009). The complete verification and validation procedureis described in details below for the first case, since experimental un-certainties were well defined, and Reynolds and Froude numbers wererelatively close to the hydrofoil setup investigated later in this study.The second case has a geometric orientation similar to that of an in-clined hydrofoil, although the foil section and Reynolds number arerather different. In the third case for E603 foil profile (used later insimulations with an inclined hydrofoil) the experimentally measuredlift coefficient in a single-phase fluid is available in a broad range ofattack angles, including the stall regime.
3.1. Vertical surface-piercing strut
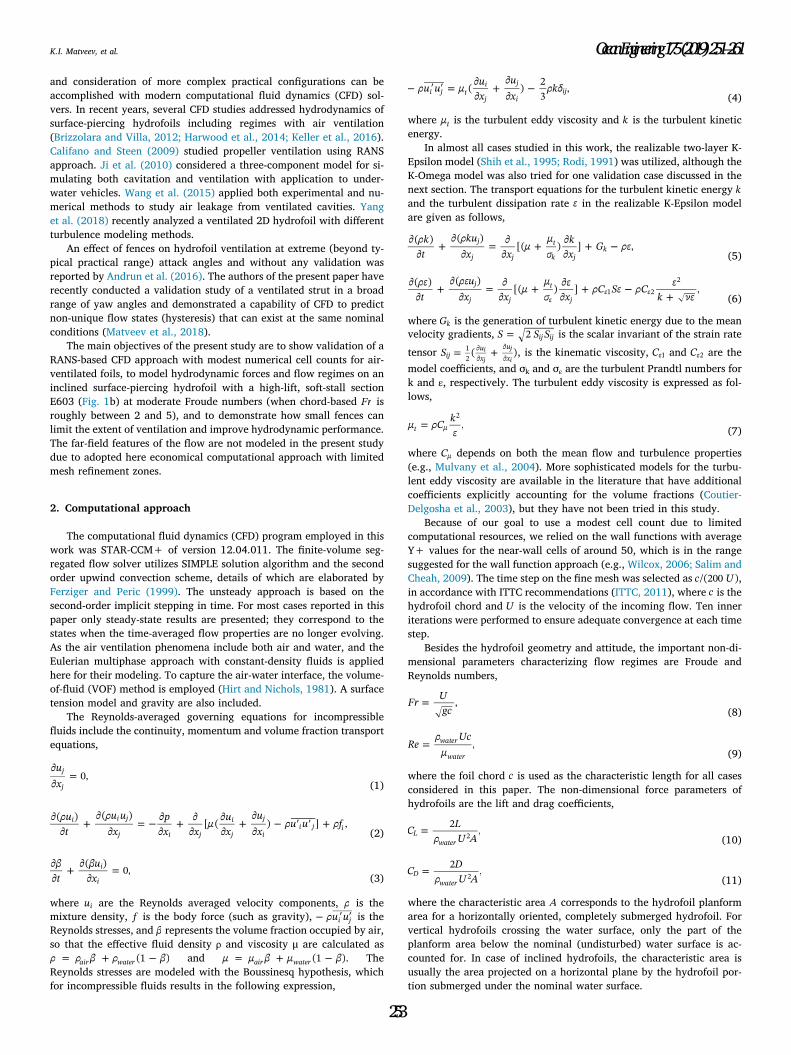
A cross section of the vertical surface-piercing strut used in the firstvalidation study is shown in Fig. 3 along with surrounding numericalmesh. The strut had a rounded nose and was yawed at angle of 25⁰ withrespect to the incident flow direction. The constructed numerical flowdomain and the trimmed mesh with mainly hexahedral cells are shownin Figs. 3–5. A prism layer was generated near the strut surface to re-solve the boundary layer. A block with finer mesh is formed around thestrut and in the near-wake region. Another grid refinement is im-plemented along the free surface (Fig. 3). The simulated conditioncorresponds to the submergence h of the strut bottom tip that was equalto the strut chord c = 27.94 cm (see Fig. 5).
The no-slip boundary condition is applied on the strut surface,whereas all external boundaries of the domain (besides the downstreamsurface) are treated as the velocity inlets, and the downstreamboundary is the pressure outlet. The damping zones of c1.5 long into thedomain are placed near the side and downstream borders. In the initialstate, the uniform water and air flows were assigned throughout thedomain. The chord Froude and Reynolds numbers (based on waterproperties) were about 3.5 and 1.6·106, respectively, similar to thecorresponding experimental conditions (Harwood et al., 2016).
Following Xing and Stern (2010), a formal numerical verificationprocedure has been applied here to evaluate the numerical uncertaintyof the steady-state solutions and compare them with experimental data.Three numerical grids with coarse, medium, and fine mesh were gen-erated, so that the cell dimensions were refined with a factor of twobetween the coarse and medium grids and between the medium andfine grids. The overall cell counts of these grids were about 0.18, 0.45and 1.62 million.
For physical characteristics of the numerical convergence study, thelift and drag coefficients of the strut, CL and CD, were used. The dragforce is exerted along the x-axis, while the lift (or side) force is definedin the negative y-direction. These axes are shown in Figs. 3–5. Thesteady-state force coefficients found with three grids are plotted inFig. 6. The air-water interface obtained on the fine mesh and defined asthe isosurface with the water fraction threshold of 0.5 is illustrated inFig. 7, showing air ventilation of the suction side and significant waterspray at and behind the pressure side of the strut. Additional imagescomparing snapshots from experimental videos and numerical simula-tions are shown in Fig. 8.
One can notice two artificial features in the simulation image inFig. 7: the aerated length of the tip vortex is rather short and thepressure-side water spray exhibits a sudden end in the vertical direc-tion. These abrupt transitions occur at boundaries of the mesh refine-ment zone, since the volume fraction of a less dominant fluid becomessmaller inside larger cells and falls below the chosen interface
threshold. If one is interested in accurately modeling flow beyond theimmediate vicinity of the foil (e.g., to access hydrodynamic influenceon system elements located behind this foil), then the refinement zoneswill need to be extended, and this will also make simulations morecomputationally expensive.
The main results of the numerical uncertainty calculations and va-lidation results are summarized in Table 1. First, using monotonicallyconverging solution results on three grids (Fig. 6), the Richardson ex-trapolation was performed to determine the expected corrections, RE ,to the fine-mesh solution (Ferziger and Peric, 1999),
=
2 1,RE p
21
ob (12)
where 21 is the difference between fine and medium mesh solutionsand pob is the observed order of accuracy. Then, the factors of safety(Xing and Stern, 2010) were applied to these corrections in order to findthe grid-based numerical simulation uncertainties, UNS,
=U F| |,NS RE (13)
where the factor of safety is determined as follows,
=Fp
p
p
p(2.45 0.85 ) if 1,
ob
th
ob
th (14)
= >Fp
p
p
p(16.4 14.8) if 1,
ob
th
ob
th (15)
When comparing computational results and experimental data, thetotal validation uncertainties, UV , that combine the numerical and testuncertainties need to be determined,
= +U U U ,V D NS
2 2(16)
The experimental errors, UD, were specified by Harwood et al.(2016) as 12.5% of the measured mean values for the considered con-dition. As shown in Table 1, the differences between the computed andexperimental force coefficients, E , are smaller than the validation un-certainties, UV . Therefore, it can be concluded that the present nu-merical approach has been validated. In the subsequent simulations inthis study, the solver settings and mesh characteristics similar to thiscase with fine grid were employed.
3.2. Surface-piercing V-foil
In the second validation case, a V-shaped hydrofoil with a wedgesection was modeled (Fig. 9a). This configuration was previously testedby Fridsma (1963). The foil span was 60.2 cm, dihedral was 30⁰, andthe foil apex submergence was 10.2 cm. Due to a small chord (5.08 cm)of the tested foil, Reynolds numbers were only about 1.6·105 at themoderate Froude number of about 4.35 of interest to this study.Nevertheless, experiments with this hydrofoil at the specified speed and
Fig. 3. Strut profile and top view on the near-strut mesh.
K.I. Matveev, et al. Ocean Engineering 175 (2019) 251–261
254
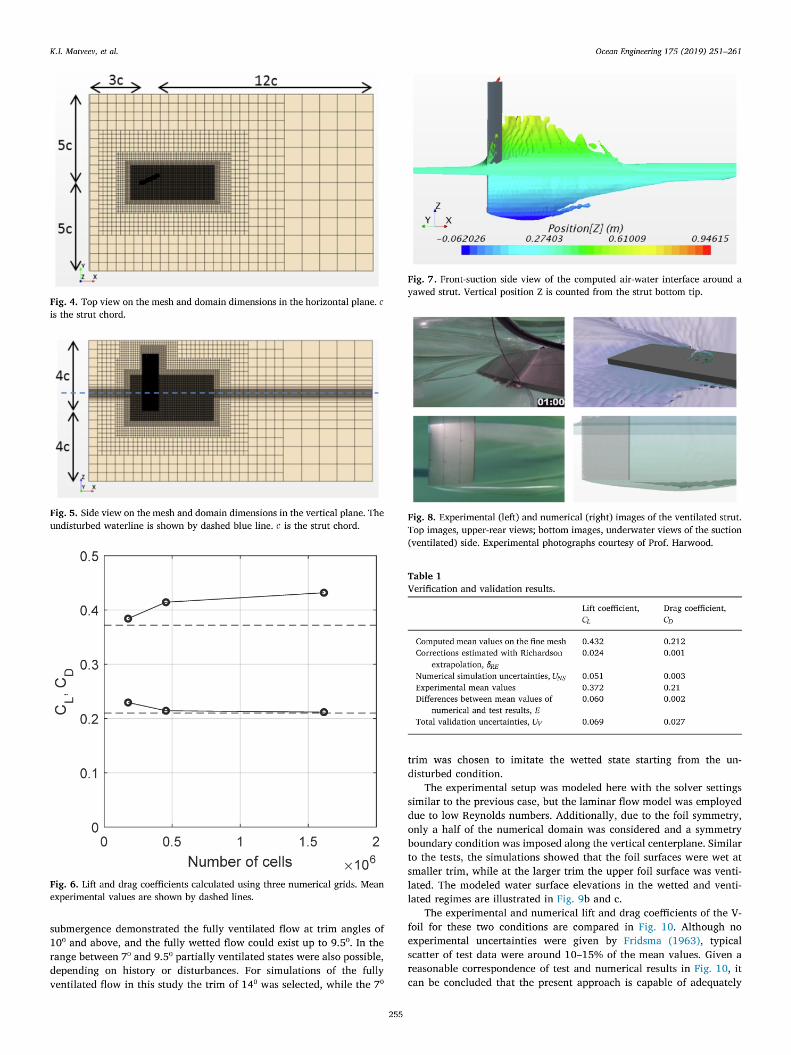
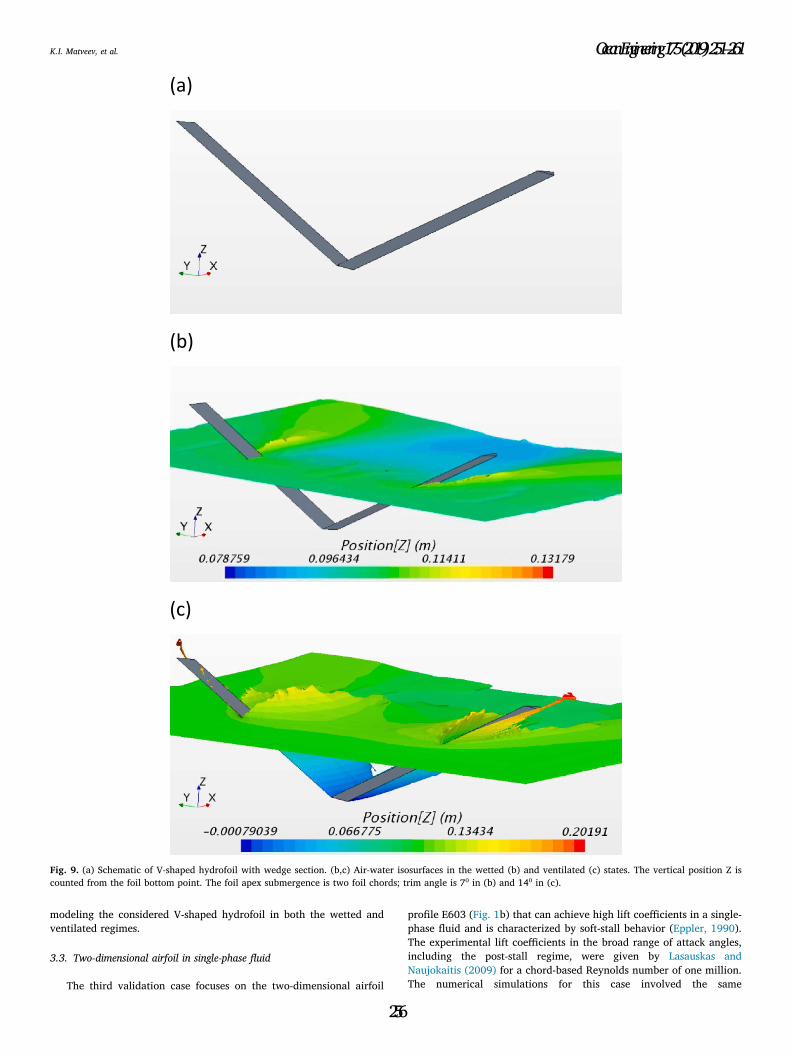
modeling the considered V-shaped hydrofoil in both the wetted andventilated regimes.
3.3. Two-dimensional airfoil in single-phase fluid
The third validation case focuses on the two-dimensional airfoil
profile E603 (Fig. 1b) that can achieve high lift coefficients in a single-phase fluid and is characterized by soft-stall behavior (Eppler, 1990).The experimental lift coefficients in the broad range of attack angles,including the post-stall regime, were given by Lasauskas andNaujokaitis (2009) for a chord-based Reynolds number of one million.The numerical simulations for this case involved the same
(a)
(b)
(c)
Fig. 9. (a) Schematic of V-shaped hydrofoil with wedge section. (b,c) Air-water isosurfaces in the wetted (b) and ventilated (c) states. The vertical position Z iscounted from the foil bottom point. The foil apex submergence is two foil chords; trim angle is 7⁰ in (b) and 14⁰ in (c).
K.I. Matveev, et al. Ocean Engineering 175 (2019) 251–261
256

computational settings as described above, but were completed in twodimensions and for a single-phase fluid. A comparison of the numericaland experimental results for the lift coefficients as functions of attackangles is shown in Fig. 11. Calculations based on the realizable K-Ep-silon model demonstrate a very good agreement with test data prior tothe stall and a relatively small overprediction of CL in the post-stallregime. It should be noted that experimental uncertainties were notreported for the test data. The K-Omega model was found to work wellat small to moderate attack angles (Fig. 11), but its predictions in thestall zone were less consistent. The solutions of the K-Omega modelproduced time-averaged values of CL with larger deviations from thetest data (Fig. 11). Hence, the realizable K-Epsilon model was adoptedfor subsequent simulations of a high-lift hydrofoil.
4. Results for inclined surface-piercing hydrofoil
In this section, a surface-piercing hydrofoil is analyzed to demon-strate performance-degrading air ventilation effects, as well as meansfor suppressing ventilation in order to achieve higher lift coefficientsand lift-drag ratios. A hydrofoil is selected to have wing section E603(Fig. 1b), total span-to-chord ratio of seven and a dihedral angle of 30⁰,as illustrated in Fig. 12. When reporting force coefficients, the effectiveplanform areas of surface-piercing hydrofoils are usually defined usingthe horizontal projection of the foil portion located under the nominal(undisturbed) water surface. For the inclined foil with the bottom-tipsubmergence of h, chord c, and dihedral , the corresponding effectiveaspect ratio is = h c/[ tan( )]. The effective aspect ratio based on thisarea is chosen in this study as four, and this corresponds to the hy-drofoil bottom tip submergence h of about c2.3 . All simulations pre-sented in this section are conducted with the absolute value for the foilchord of =c m0.5 .
The main motivation for this study is to determine whether suchsurface-piercing hydrofoils can produce high lift coefficients (e.g.,above one) at relatively low Froude numbers. However, as discussedabove, this hydrodynamic setup is likely to experience the air ventila-tion, which may prevent achieving high CL. One of the methods to
constrain the ventilation process and to improve hydrodynamic per-formance is to employ small barriers on the foil surface that can restrictspanwise flow near the nominal water level (Fig. 2b). The barrierconfiguration selected in this study consists of two fences (Fig. 12b).Each fence has thickness of 1% of the chord and elliptical sections withthe main axis diameter of c1.2 and the minor axis diameter of c0.4
(Fig. 12d and e). The lower and upper fences are placed at distances c4.1
and 5.6c, respectively, along the span from the foil bottom tip(Fig. 12c). Since the main purpose of the lower fence is to stop the aircoming from the top on the foil suction side, this fence is shifted slightlyupward with respect to the foil chord line. On the other hand, the upperfence is shifted slightly downward, since its main purpose is to restrictthe water spray that is more pronounced on the foil pressure side.
The numerical mesh built for computational simulations follows thesame approach as in validation cases considered above. Similar to thegrid damping technique (Peric and Abdel-Maksoud, 2015), an addi-tional block with coarsened mesh and damping was added near thedownstream boundary to avoid numerical divergence that can becaused by highly confused nonlinear flow (“rooster tail”) near thedownstream boundary at some conditions. A fine grid for the surface-piercing hydrofoil is illustrated in Figs. 13 and 14. Due to higher aspectratio of this foil, the domain size became larger, and the overall cellcount reached about 3.7 million.
The default operational condition, aiming at achieving high CL atreasonably low CD, is selected here with the foil attack angle = °15
(about the spanwise axis) and chord-based Froude number= =Fr U gc/ 3.5. Additional simulations were carried out at several
other angles of attack with fixed =Fr 3.5 and at two other Froudenumbers with fixed = °15 . The corresponding chord-based Reynoldsnumbers were in the range of 2.2–5.5·106. The same turbulence modeland other solver settings as in the main validation case described abovewere employed for simulating the surface-piercing inclined hydrofoil.
The steady-state numerical results for the lift and drag coefficientsobtained with the clean and fenced hydrofoils at variable angles ofattack are presented in Fig. 15, whereas images of water surfaces inseveral conditions are given in Figs. 16–20. At the attack angle = °15 ,
5 10 150.1
0.2
0.3
0.4
[deg]
CL
(a)
5 10 150
0.05
0.1
[deg]
CD
(b)
Fig. 10. (a) Lift coefficients and (b) drag coefficients of the V-shaped hydrofoil.Circles, experimental data. Crosses, computational results. is the trim angle.The foil apex submergence is two foil chords.
0 5 10 15 200
0.2
0.4
0.6
0.8
1
1.2
1.4
1.6
AOA [deg]
CL
Fig. 11. Lift coefficients for two-dimensional E603 airfoil. Circles, experimentaldata; crosses, numerical results obtained with realizable K-Epsilon model;squares, numerical results obtained with K-Omega model.
K.I. Matveev, et al. Ocean Engineering 175 (2019) 251–261
257

the fenced hydrofoil produces nearly 50% higher CL, and its lift-dragratio of 6.8 is about 25% higher than that of the clean foil. The cleanhydrofoil exhibits pronounced ventilation on the suction side (Fig. 16a).The air propagates from the atmosphere along the span and covers asubstantial portion of the foil submerged surface, thus not allowing it togenerate a high lift force. At the same time, the water spray on theclean-foil pressure side covers the entire foil surface above the water(Fig. 16b). In contrast, the application of the fences limits the foilsurface areas affected by ventilation and spray (Fig. 17). The fencesessentially block the downward propagation of the air on the suctionside and upward water motion on the pressure side. It should be kept inmind that the plotted water surfaces are isosurfaces with the waterfraction of 0.5. Some water exists (but not shown) above these surfaces,whereas some air is present below them, so these images would differfrom experimental photographs. Illustrations of numerical interfaces atdifferent threshold levels were previously presented by Matveev et al.(2018).
To illustrate several interesting features of a wave pattern behind asurface-piercing hydrofoil, a top view on the water surface is given inFig. 18. An upper portion of the hydrofoil is visible, and two pro-nounced sprays formed on both pressure and suction sides of the foilpropagate in the downstream direction, similar to observations withventilated surface-piercing struts (Young et al., 2017). Between thesesprays, one can see a depression in the water caused by the air-venti-lated cavity, which is located on the foil suction side under the nominalwater surface. At about 3–8 chords downstream of the submerged foilpart, a wave hollow is present, which is typical for shallow hydrofoils.Its shape becomes important when selecting a favorable position for therear foil in tandem hydrofoil systems (Matveev and Matveev, 2001).
At lower attack angle of 10⁰, the difference between the clean andfenced versions becomes smaller (Fig. 15), and it almost disappears at5⁰. Both ventilation and spray recede, and the submerged part of ahydrofoil transitions into regular wetted state similar to vertical strutsat small yaw angles (Harwood et al., 2016). The fences no longer play asignificant role at low flow incidence.
At higher attack angle of 20⁰, however, the difference in hydro-dynamic characteristics of the clean and fenced hydrofoils increases(Fig. 15). The lift coefficient of the clean foil drops further down (to thevalue similar to observation at = °5 ), while the fenced foil CL con-tinues to increase showing a saturation tendency. The drag coefficientof the fenced foil is only slightly higher than that of the clean foil(Fig. 15b). The lift-drag ratios monotonically decrease for both hydro-foils with increasing the angle of attack in the entire range studied. At
Fig. 12. (a,b) 3D views on hydrofoil (a) without fences and (b) with fences. (c)Front view with main system dimensions. c is the foil chord. (d,e) Cross-sec-tional views on (d) lower fence and (e) upper fence.
Fig. 13. Front view of the mesh in a vertical plane and on the hydrofoil surface.c is the foil chord. Distances are shown from the bottom tip of hydrofoil. Theundisturbed waterline is given by dashed blue line. Dense mesh regions arevisible around hydrofoil and near free surface level.
Fig. 14. Side view of the mesh in a vertical plane and on the port-side hydrofoilsurface. The undisturbed waterline is shown by dashed blue line. c is the foilchord.
K.I. Matveev, et al. Ocean Engineering 175 (2019) 251–261
258

high attack angles 15–20⁰, the lift-drag ratio of the fenced foil is sub-stantially larger than that of the clean foil.
The air-water interfaces on hydrofoils operating in the extremesetup with = °20 are shown in Figs. 19 and 20. The suction on theupper surface of the clean hydrofoil is now sufficient to bring air downclose to the bottom tip, so most part of the upper surface is ventilated
5 10 15 200.4
0.6
0.8
1
1.2
1.4
[deg]
CL
(a)
5 10 15 200
0.05
0.1
0.15
0.2
0.25
[deg]
CD
(b)
Fig. 15. (a) Lift coefficients and (b) drag coefficients of clean hydrofoil(squares) and fenced hydrofoil (circles) at variable attack angles and fixedFr = 3.5.
Fig. 16. Air-water interface around clean hydrofoil at =Fr 3.5 and = °15 . (a)Side view from suction side, (b) side view from pressure side. Vertical position Zis counted from the quarter-chord point on the foil chord line at the bottomsection.
Fig. 17. Air-water interface around fenced hydrofoil at =Fr 3.5 and = °15 .(a) Side view from suction side, (b) side view from pressure side. Vertical po-sition Z is counted from the quarter-chord point on the foil chord line at thebottom section.
Fig. 18. Top view on the wave pattern in the vicinity of clean hydrofoil at=Fr 3.5 and = °15 . Flow is from left to right. Vertical position Z is counted
from the quarter-chord point on the foil chord line at the bottom section.
Fig. 19. Air-water interface around clean hydrofoil at =Fr 3.5 and = °20 . (a)Side view from suction side, (b) side view from pressure side. Vertical position Zis counted from the quarter-chord point on the foil chord line at the bottomsection.
K.I. Matveev, et al. Ocean Engineering 175 (2019) 251–261
259
with air (Fig. 19a), resulting in a drop of the lift force (Fig. 15a). Thewater spray above the nominal water level is even more pronouncedthan in the previous case (Fig. 19b). Fences on the modified hydrofoil,still help limit air ventilation on the suction side and reduce spray onthe pressure side (Fig. 20). However, the pressure near the foil leadingedge drops below the vapor pressure, leading to the cavitation incep-tion (Fig. 20a). In order to simulate this early-stage cavitation, a cavi-tation module was activated in the flow solver that uses Schnerr-Sauercavitation model (Sauer, 2000), while the water vapor was treated withproperties of a real steam. Even the fenced hydrofoil version becomesnot that efficient at = °20 , when its lift-drag ratio drops down to 5.2(from 6.8 at °15 ). Hence, this regime is not recommended for practicaloperations. The intentional increase of the attack angle up to °20 wouldonly make sense for brief time periods when the maximum lift is neededand only if there is enough thrust available to overcome additionaldrag.
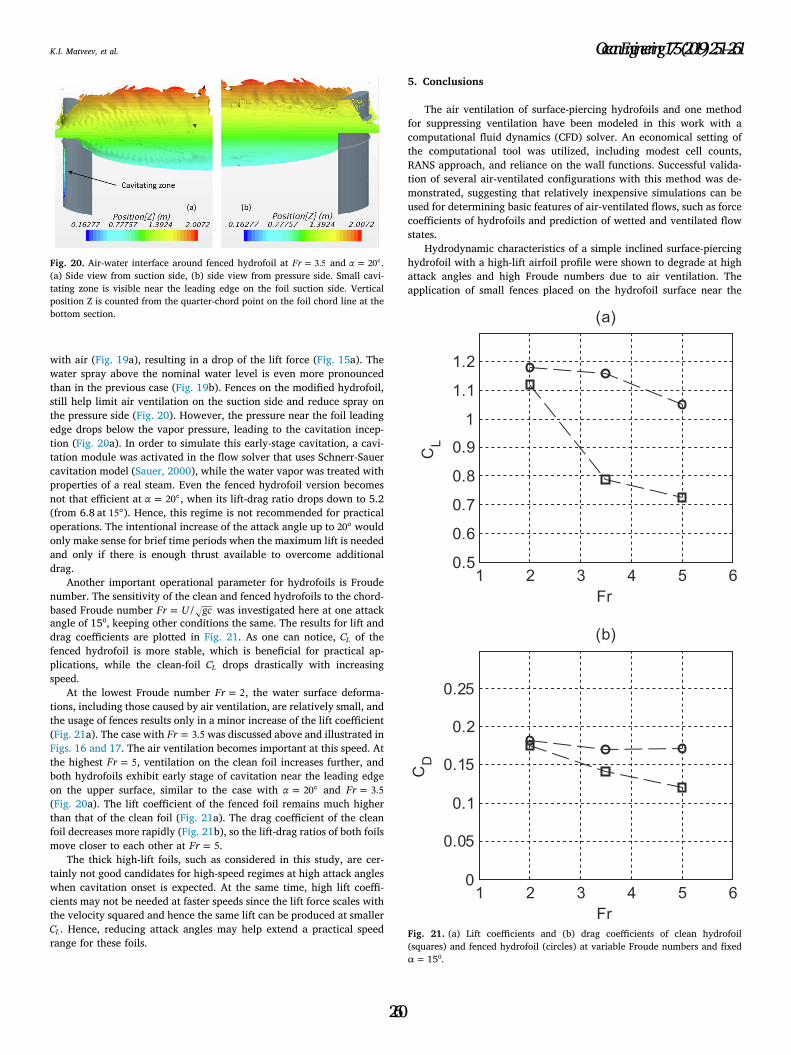
Another important operational parameter for hydrofoils is Froudenumber. The sensitivity of the clean and fenced hydrofoils to the chord-based Froude number =Fr U gc/ was investigated here at one attackangle of 15⁰, keeping other conditions the same. The results for lift anddrag coefficients are plotted in Fig. 21. As one can notice, CL of thefenced hydrofoil is more stable, which is beneficial for practical ap-plications, while the clean-foil CL drops drastically with increasingspeed.
At the lowest Froude number =Fr 2, the water surface deforma-tions, including those caused by air ventilation, are relatively small, andthe usage of fences results only in a minor increase of the lift coefficient(Fig. 21a). The case with =Fr 3.5 was discussed above and illustrated inFigs. 16 and 17. The air ventilation becomes important at this speed. Atthe highest =Fr 5, ventilation on the clean foil increases further, andboth hydrofoils exhibit early stage of cavitation near the leading edgeon the upper surface, similar to the case with = °20 and =Fr 3.5
(Fig. 20a). The lift coefficient of the fenced foil remains much higherthan that of the clean foil (Fig. 21a). The drag coefficient of the cleanfoil decreases more rapidly (Fig. 21b), so the lift-drag ratios of both foilsmove closer to each other at =Fr 5.
The thick high-lift foils, such as considered in this study, are cer-tainly not good candidates for high-speed regimes at high attack angleswhen cavitation onset is expected. At the same time, high lift coeffi-cients may not be needed at faster speeds since the lift force scales withthe velocity squared and hence the same lift can be produced at smallerCL. Hence, reducing attack angles may help extend a practical speedrange for these foils.
5. Conclusions
The air ventilation of surface-piercing hydrofoils and one methodfor suppressing ventilation have been modeled in this work with acomputational fluid dynamics (CFD) solver. An economical setting ofthe computational tool was utilized, including modest cell counts,RANS approach, and reliance on the wall functions. Successful valida-tion of several air-ventilated configurations with this method was de-monstrated, suggesting that relatively inexpensive simulations can beused for determining basic features of air-ventilated flows, such as forcecoefficients of hydrofoils and prediction of wetted and ventilated flowstates.
Hydrodynamic characteristics of a simple inclined surface-piercinghydrofoil with a high-lift airfoil profile were shown to degrade at highattack angles and high Froude numbers due to air ventilation. Theapplication of small fences placed on the hydrofoil surface near the
Fig. 20. Air-water interface around fenced hydrofoil at =Fr 3.5 and = °20 .(a) Side view from suction side, (b) side view from pressure side. Small cavi-tating zone is visible near the leading edge on the foil suction side. Verticalposition Z is counted from the quarter-chord point on the foil chord line at thebottom section.
1 2 3 4 5 60.5
0.6
0.7
0.8
0.9
1
1.1
1.2
Fr
CL
(a)
1 2 3 4 5 60
0.05
0.1
0.15
0.2
0.25
Fr
CD
(b)
Fig. 21. (a) Lift coefficients and (b) drag coefficients of clean hydrofoil(squares) and fenced hydrofoil (circles) at variable Froude numbers and fixedα = 15⁰.
K.I. Matveev, et al. Ocean Engineering 175 (2019) 251–261
260

nominal water level led to effective limitation of air ventilation, whichresulted in significant enhancement of the lift coefficient and in somecases of the lift-drag ratio. Hence, it is suggested that high-lift hydro-foils with fences can be considered for application on foil-assisted boatsintended for moderate Froude numbers.
Acknowledgements
This material is based upon research supported in part by the U. S.Office of Naval Research under Award No. N00014-17-1-2553 and inpart by the National Science Foundation under Grant No. 1800135.
References
Andrun, M., Saric, B., Basic, J., Blagojevic, B., 2016. CFD analysis of surface-piercinghydrofoil ventilation inception. In: Proceedings of the XXII Conference on Theory andPractice of Shipbuilding, Trogir, Croatia.
Breslin, J.P., Skalak, R., 1959. Exploratory Study of Ventilated Flows about YawedSurface-Piercing Struts. NASA Technical Memorandum, Washington, DC TechnicalReport No. 2-23-59W.
Brizzolara, S., Villa, D., 2012. Three phases RANSE calculations for surface-piercingsuper-cavitating hydrofoils. In: Proceedings of the 8th International Symposium onCavitation CAV2012, Singapore, Paper No. 90.
Califano, A., Steen, S., 2009. Analysis of different propeller ventilation mechanisms bymeans of RANS simulations. In: Proceedings of the 1st International Symposium onMarine Propulsors, Trondheim, Norway.
Coutier-Delgosha, O., Fortes-Patella, R., Reboud, J.L., 2003. Evaluation of the turbulencemodel influence on the numerical simulations of unsteady cavitation. J. Fluid Eng.125, 38–45.
Eppler, R., 1990. Airfoil Design and Data. Springer-Verlag, Berlin.Ferziger, J.H., Peric, M., 1999. Computational Methods for Fluid Dynamics. Springer,
Berlin.Fridsma, G., 1963. Ventilation Inception on a Surface Piercing Dihedral Hydrofoil with
Plane Surface Wedge Section. Davidson Laboratory, Stevens Institute of Technology,Hoboken, NJ Technical Report No. 952.
Harwood, C.M., 2016. The Hydrodynamic and Hydroelastic Responses of Rigid andFlexible Surface-Piercing Hydrofoils in Multi-phase Flows. PhD dissertation.University of Michigan, Ann Arbor, USA.
Harwood, C.M., Brucker, K.A., Montero, F.M., Young, Y.L., Ceccio, S.L., 2014.Experimental and numerical investigation of ventilation inception and washoutmechanisms of a surface-piercing hydrofoil. In: Proceedings of the 30th Symposiumon Naval Hydrodynamics. Hobart, Tasmania, Australia.
Harwood, C.M., Young, Y.L., Ceccio, S.L., 2016. Ventilated cavities on a surface-piercinghydrofoil at moderate Froude numbers: cavity formation, elimination and stability. J.Fluid Mech. 800, 5–56.
Hirt, C.W., Nichols, B.D., 1981. Volume of fluid (VOF) methods for the dynamics of freeboundaries. J. Comput. Phys. 39 (1), 201–225.
ITTC, 2011. Recommended Procedures and Guidelines Practical Guidelines for Ship CFDApplications. 7.5-03-02-03.
Ivanov, A.N., 1980. Hydrodynamics of Developed Cavitating Flows. Sudostroenie,Leningrad (in Russian).
Ji, B., Luo, X., Peng, X., Zhang, Y., Wu, Y., Xu, H., 2010. Numerical investigation of theventilated cavitating flow around an under-water vehicle based on a three-compo-nent cavitation model. J. Hydrodyn. 22 (6), 753–759.
Karn, A., Ellis, C.R., Milliren, C., Hong, J., Scott, D., Arndt, R.E.A., Gulliver, J.S., 2015.Bubble size characteristics in the wake of ventilated hydrofoils with two aerationconfigurations. International Journal of Fluid Machinery and Systems 8 (2), 73–84.
Keller, T., Henrichs, J., Hochkirch, K., Hochbaum, A.C., 2016. Numerical simulations of asurface piercing A-class catamaran hydrofoil and comparison against model tests. In:Proceedings of the 22nd Chesapeake Sailing Yacht Symposium. Annapolis, MD.
Kinnas, S.A., Young, Y.L., 2003. Modeling of cavitating or ventilated flows using BEM. Int.J. Numer. Methods Heat Fluid Flow 13 (6), 672–697.
Lasauskas, E., Naujokaitis, L., 2009. Analysis of three wing sections. Aviation 13 (1),3–10.
Matveev, K.I., 2011. Transom effect on properties of an air cavity under a flat-bottomhull. Ships Offshore Struct. 7 (2), 143–149.
Matveev, K.I., Matveev, I.I., 2001. Tandem hydrofoil system. Ocean Eng. 28 (2), 253–261.Matveev, K.I., Wheeler, M.P., Xing, T., 2018. Simulations of an air-ventilated strut
crossing water surface at variable yaw angles. In: Proceedings of the 5th Joint US-European Fluids Engineering Summer Conference. Canada, Montreal, Quebec ASMEpaper No. FEDSM2018-83092.
Mulvany, N., Tu, J.Y., Chen, L., Anderson, B., 2004. Assessment of two-equation modelingfor high Reynolds number hydrofoil flows. Int. J. Numer. Methods Fluids 45,275–299.
Nishiyama, T., 1959. Experimental investigation of the effect of submergence depth uponthe hydrofoil section characteristics. Journal of Zosen Kiokai 105, 7–21 (in Japanese).
Peric, R., Abdel-Maksoud, M., 2015. Assessment of uncertainty due to wave reflections inexperiments via numerical flow simulations. In: Proceedings of the 25th InternationalOcean and Polar Engineering Conference, Hawaii, USA.
Rodi, W., 1991. Experience with two-layer models combining the k-ɛ model with a one-equation model near the wall. In: Proceedings of the 29th Aerospace SciencesMeeting, Reno, NV, USA, AIAA paper 91-0216.
Rothblum, R.S., 1977. Investigation of Methods of Delaying or Controlling Ventilation ofSurface Piercing Struts. PhD Thesis. University of Leeds.
Salim, S.M., Cheah, S.C., 2009. Wall y+ strategy for dealing with wall-bounded turbulentflows. In: Proceedings of the International Multi-Conference of Engineers andComputer Scientists, Hong Kong.
Sauer, J., 2000. Instationaer kavitierende Stroemungen - Ein neues Modell, basierend aufFront Capturing VOF und Blasendynamik. Dissertation. Universitaet Kalrsruhe,Germany.
Shih, T.-H., Liou, W.W., Shabbir, A., Yang, Z., Zhu, J., 1995. A new k-ɛ eddy viscositymodel for high Reynolds number turbulent flows. Comput. Fluids 24 (3), 227–238.
Straub, L.G., Wetzel, J.M., 1957. Experimental Studies of Air Ventilation of Vertical,Semi-submerged Bodies. St. Anthony Falls Hydraulic Laboratory, University ofMinnesota Project Report No. 57.
Swales, P.D., Wright, A.J., McGregor, R.C., Rothblum, R., 1974. The mechanism of ven-tilation inception on surface piercing foils. J. Mech. Eng. Sci. 16 (1), 18–24.
Vinayan, V., Kinnas, S.A., 2010. A numerical nonlinear analysis of two-dimensionalventilating entry of surface-piercing hydrofoils with effects of gravity. J. Fluid Mech.658, 383–408.
Wang, Z., Huang, B., Wang, G., Zhang, M., Wang, F., 2015. Experimental and numericalinvestigation of ventilated cavitating flow with special emphasis on gas leakage be-havior and re-entrant jet dynamics. Ocean Eng. 108, 191–201.
Wilcox, D.C., 2006. Turbulence Modeling for CFD. DCW Industries.Xing, T., Stern, F., 2010. Factors of safety for Richardson extrapolation. ASME Journal of
Fluids Engineering 132 (6), 061403.Yang, D., Yu, A., Ji, B., Zhou, J., Luo, Z., 2018. Numerical analyses of ventilated cavi-
tation over a 2-D NACA0015 hydrofoil using two turbulence modeling methods. J.Hydrodyn. 30 (2), 345–356.
Young, Y.L., Harwood, C.M., Montero, F.M., Ward, J.C., Ceccio, S.L., 2017. Ventilation oflifting surfaces: review of the physics and scaling relations. Appl. Mech. Rev. 69,010801–010802.
K.I. Matveev, et al. Ocean Engineering 175 (2019) 251–261
261