simulation of ventilation effects on indoor radon in a ... · simulation of ventilation effects on...
TRANSCRIPT

Simulation of Ventilation Effects on Indoor Radon in a Detached
House KERAMATOLLAH AKBARI1, JAFAR MAHMOUDI2, ROBERT OMAN3
1TDI researcher at ACECR, Iran and Mälardalen University, PhD student, School of Sustainable Development of Society and Technology, Västeras, SWEDEN
2Mälardalen University, Adj Professor at School of Sustainable Development of Society and Technology, Västeras, SWEDEN
3Mälardalen University, Lecturer at School of Sustainable Development of Society and Technology, Västeras, SWEDEN
1 [email protected] ;2 [email protected] ;[email protected]
Abstract: CFD is widely used in indoor air quality, air flow pattern, indoor pollutant distribution and thermal comfort as a cost effective and powerful tool and it can be used to predict, estimate and visualize the indoor radon level. . The intention of this article is to use computational fluid dynamics (CFD), as a standalone tool to simulate indoor radon distribution and ventilation effects. This technique can be used to predict and visualize radon content and indoor air quality throughout a one family detached house in Stockholm. . In this study a mechanical balanced ventilation system and a continuous radon monitor (CRM) were also used to measure the indoor ventilation rate and radon levels. In numerical approach the FLUENT, CFD package was used to simulate radon entry into the building and ventilation effects. Results of numerical study indicated that indoor pressure made by means of ventilation systems and infiltration through door or window has significant effects on indoor radon content. It is observed that the location of vents can affect the indoor radon level, particularly in breathing (seating) zone. The analytic solution is used to validate numeric results at 3 distinct air change rates. The comparison amongst analytical, numerical and measurement results shows close agreement.
Keywords: Numerical modeling, Simulation, Radon mitigation, Balanced Ventilation, Residential buildings, CFD
Nomenclature and abbreviations k kinetic energy 퐸 radon exhalation rate(Bq푚 ℎ ) 휆 air change rate in the house K Thermal Conductivity(w/m-k) 휆 radon decay constant ( 푠 ) 퐺 radon generation rate (퐵푞푚 푠 ) Cp specific heat(j/kg-k) ε dissipation rate and soil porosity ν kinetic viscosity(kg/m-s) S source term 푢,푣,푤 velocity components in x, y, and V velocity vector (m/s) z- coordinates ρ density (kg/m3) A area, m2 D,퐷 radon diffusion coefficient(m2/s) MW Molecular weight(kg/kmol) T temperature °C, RH relative humidity Δp pressure difference,Pa C radon concentration ,bq/m3 V velocity(m/s), volume(m3) L characteristic length(m) Re Reynolds number 휌 density of the soil grain 퐴 radium activity (퐵푞퐾푔 ) 푓 radon emanation fraction Ach air change(1/h) CFD computational fluid dynamics CRM continuous radon monitor ATD alpha track detector
1 Introduction Radon exposure is an international problem. Attention to this problem and the associated health risks has been growing throughout the world and more than 50 countries now have ongoing projects
and have established mandatory regulation [1]. In most countries such as Scandinavian, the U.S., U.K., Hong Kong and etc., radon sometimes enters into the house through building materials. High insulation and tightness in buildings in order to increase energy efficiency and to lower energy
WSEAS TRANSACTIONS on FLUID MECHANICS Keramatollah Akbari, Jafar Mahmoudi, Robert Oman
E-ISSN: 2224-347X 146 Issue 4, Volume 7, October 2012
costs have led to indoor air quality problems. That’s way the study of radon problem is much important from view points of health and energy consumption.
Ventilation is a good method to control indoor radon and maintain indoor air quality in existing residential buildings. Pollutant concentrations are inversely proportional to ventilation rates [2]. The more fresh air is brought into the indoor environment, the better the indoor air quality can be achieved, if the fresh air comes from non polluted ambient source. Increasing the ventilation rate to control radon level is not permitted because of energy implications in the building sector. So the energy efficient solutions must be considered.
From the viewpoints of indoor air quality (IAQ) and energy savings, ventilation has two opposite functions; in the positive side enhances IAQ and establishment of thermal comfort and in the negative side increases energy consumption. As such, this paper is looking for a solution to cope with this contradiction.
Some studies have already been carried out on air flow in buildings and ventilation effects with employing CFD techniques and also about radon modeling in the soil and material building [3,4,5].
In this study, FLUENT, computational fluid dynamics (CFD) software is used for simulating and predicting radon levels and visualizing the effects of ventilation rates.
2 Materials and methods Radon entry into a one family detached house and ventilation effects are modeled using FLUENT package in three-dimensional steady state model. A heat recovery balanced ventilation system, a continuous radon monitor (CRM) and alpha track detectors (ATD) were also used to measure the indoor ventilation rate and indoor radon levels. 2.1 Measurement method Radon concentrations were measured constantly during the winter and spring, both with a continuous radon meter (CRM) and alpha track detector (ATD). Table 1 shows the results of these measurements. 2.2 Analytical analysis
Indoor radon content can be calculated as: 퐶 =
( ) (5)
Where 퐶(Bq푚 ) , indoor radon at steady state, 퐸(Bq푚 ℎ ), radon exhalation rate, 퐴(푚 ), radon exhalation surface (in this study the house floor), 푉(푚 ) , the volume of the house, 휆 , radon decay constant (2.1 × 10 푠 ) 휆 (ℎ ) , air change rate in the house.
Table 1 Measurements results of indoor radon levels (Bqm-3) Date and period ATD CRM ACH Ventilation Remedial action 2008-2 (2 weeks) 3580±380 ------ 0.25 Extract fan No action 2010-01(3months) 1280±160 1580±158 0.25 HRV Radon sump &sealing 2010-04 (3 weeks) 100 ±20 ------ 0.5 HRV 3connected sumps 2010-3-14 (2days) ------- 97± 10 0.5 HRV 3connected sumps 2010-3-18 (2days) ------- 65±6 0.5 HRV 3connected sumps 2010-4-22 2 days) ------- 36±4 1 HRV 3connected sumps
퐸 = 65 Bq푚 ℎ [6] and given data of the
case study house, then equation (5) gives indoor radon level for different ventilation rate; then 퐶 . = 3582 , 퐶 . = 106, 퐶 . = 53, 퐶 = 22 Bqm-3. Comparing these analytical data with measured data indicated close agreement. This analytic solution is used to confirm numeric results at 4 distinct air change rates. The comparison amongst analytical, numerical and measuring results is as shown in table 6. 3 Radon transport equation
Radon firstly migrates through the larger air-filled pores within the building material, so that a fraction of them reaches the building-air interface before decaying and then by the air flow enters indoor air. This transport is done by diffusion and advection (convection) mechanisms.
Radon gas, after entering to indoor air, may be induced due to a pressure or temperature gradient. This gradient could be created mainly by changes in environment conditions by means of natural or mechanical ventilation systems such as exhaust fans or suppliers, heating and air-conditioned systems in residential buildings [7].
WSEAS TRANSACTIONS on FLUID MECHANICS Keramatollah Akbari, Jafar Mahmoudi, Robert Oman
E-ISSN: 2224-347X 147 Issue 4, Volume 7, October 2012

In the FLUENT package, when the species transport model is selected and the individual species are defined in the model then the conservation equation including the convection and diffusion is solved for each species, 퐶, through the solution of a convection-diffusion equation for each species. Then mass fraction of the species is predicted by FLUENT and the conservation equation for species transport model is as the following general form [8]:
(휌푐) + (휌푢푐) + (휌푣푐) + (휌푤푐) =
퐷 + 퐷 + 퐷 + 푆 (1)
Since, in the steady state condition the radon (mixture of air and radon) is constant, this equation reduced to:
(휌푢푐) + (휌푣푐) + (휌푤푐) = 퐷 +
퐷 + 퐷 + 푆 (2)
푆 = 휀(퐺 − 휆퐶) (3) In this equation, G is defined as equation (4),
퐷 represents effective diffusion coefficient, 휌 is the mixture density, 푆 is the generation rate of concentration and 푐 is the- mean radon concentration (9).
The radon generation rate; G is a function of soil specifications and defined as:
퐺 = 푓휌 퐴 휆 (4) Where, 퐺 is the volumetric radon generation
rate in soil pores(퐵푞푚 푠 ), 푓 the emanation fraction; 휌 density of the soil grain; 퐴 (퐵푞퐾푔 ) the radium activity concentration in the soil grain; 휆 the radon decay constant; and 휀 the soil porosity.
4 Numerical modeling approach CFD programs are based on solving the Transport equations, is the general name for conservation of mass (continuity), momentum (Naviar-Stokes equations), thermal energy and concentration of species. In a room with ventilation and radon concentration is necessary to solve these partial differential equations. CFD programs are employed to solve equations about velocity, temperature and species transport numerically.
Indoor air flow with mechanical ventilation and in the presence of radon is a complicated problem. Despite new CFD packages and powerful computers, very often is necessary to use simplifications and approximations. This manner has been used by several research studies [10-13].
In this study, the 3 dimension model is taken as turbulent, because air flow in ventilated room even though with ventilation rate lower than 0.2 m/s has usually turbulence regime and solving governing equations, the turbulent k-ε model is necessary[14]. The standard, k-ε model is a popular method for numerical simulation of room airflow.
5 Turbulence modeling Generally, air flows in the ventilated room are turbulent. Since the Reynolds number is high enough (Re> 105), it is assumed that the air flow is turbulent, so turbulence modeling is valid for the case in this work.
In FLUENT software, of three kinds of k-ε turbulent models available for indoor air flow modeling, the standard k-ε turbulence model is applied in this work, since it is the most widely used because of its applicability to wide-ranging flow situations, stability during simulation time, good predictive accuracy to the flow and its lower computational demand than more complex models that are available [9,15].
Two-equation models are the simplest available means of calculating turbulent stresses in the recirculation flow where the length scale distribution cannot be calculated algebraically. The Standard k-ε model as a two-equation model is a semi empirical model based on model transport equations for the kinetic energy k and its dissipation rate ε. For using this model it is assumed that the flow is fully turbulent and that the effects of molecular viscosity are negligible [9].
6 Geometry and boundary conditions The case study is a one family detached house located in Stockholm, built on bedrock in 1975. The house volume is 12×9×2.4 m3. The radon level after some remediation techniques has reached to about 600 Bq/m3, main origination of the radon concentration is soil gas from the building foundation.
This house is in direct contact with the ground so that radon driven by two disturbance pressures, via routes and into the house. The house above ground level represents the living area of the house. The volume of soil ground included in the
computational domain is 30×30×3 m3. Such a volume has been proved to be enough to represent the soil block in radon entry modeling [16].
Simulation approach is repeated in three cases to show the influences of changing ventilation rates
WSEAS TRANSACTIONS on FLUID MECHANICS Keramatollah Akbari, Jafar Mahmoudi, Robert Oman
E-ISSN: 2224-347X 148 Issue 4, Volume 7, October 2012

and inlet and outlet locations. Figures 1 indicates the geometry of the house and soil with other boundary conditions.
6.1 Values and Constants
The tables below show the used quantity of constants in this study. These constants are used to indicate parametric values of variables in FLUENT.
Fig.1.The schematic of soil and house, grid system in the computational domain on the symmetric XZ-plane
Table 2 The radon properties Radon properties Usage Quantity
CP (J/Kg.K) Energy equation 96.35 K (W/m.K) Energy equation 0.00361
MW (Kg/kmol) Transport equation 222 Density(Kg/m3) Transport equation 7.13
Table 3 The constants used in boundary conditions
Variable Quantity Atmosphere pressure gage 0 Pa Air leakage from door 0- 0.2 m/s Air leakage from window 0 – 0.02 m/s Intake fan- pressure jump 0-20 Pa Exhaust fan- pressure jump -20-0 Pa Radon Source term 2.6e-17 Kg/m3s Permeability of Soil 10-10 m2 Porosity 0.4 ---
6.2. Boundary conditions Table 4 indicates all the boundaries in the model, their locations and physical description. The last column also lists the options of boundary conditions available in FLUENT.
In minimum speed of air inside room (0.5 m/s)
the Reynolds number reaches the transition values and the flow will become turbulent. So in this study k-e model is used to simulating the turbulence.
WSEAS TRANSACTIONS on FLUID MECHANICS Keramatollah Akbari, Jafar Mahmoudi, Robert Oman
E-ISSN: 2224-347X 149 Issue 4, Volume 7, October 2012

Table 4 Boundary conditions of the model Location Physical description Option in FLUENT
Door Mass and heat leakage Velocity inlet
Exhaust fan Pressure jump, no radon entry Exhaust fan
Floor No-flow, and vertical radon diffusion only Interior
Intake fan Pressure jump, no radon entry Intake fan
Roof No-flow boundary (including soil gas, radon) Wall
Room walls No-flow boundary (including soil gas, radon) Wall
Soil bottom Fixed temperature; no-flow Wall
Soil surface Fixed temperature; fixed concentration; fixed pressure Pressure inlet
Soil wall No-flow boundary (including soil gas, radon, and heat flux=0) Symmetry
Window Mass and heat leakage Velocity inlet 6.3 Simulation procedure
In order to model the soil and house, three individual runs are defined to solve the equations as shown in the following table: The initial condition is applied to the temperature field to calculate the buoyancy effect of the flow and disturbance pressure in the second run. Radon content in the case study house before applied remediation techniques was about 4000 Bq/m3 , this value is equal to only 5.25×10⁻¹⁶ kgm-3. 6.4 Grid refinement
The necessity of grid refinement is always given when the simulation grid cannot resolve the attributes accurately and is done to minimize the numerical diffusion.
Grid refinement must be continued until the solution to be reasonably grid independent. To reach the grid independency two aspects need to be considered: grid distribution, and the total number of grid cells in the computational domain.
A well-distributed grid, particularly with reasonable respect and aspect ratios ensures a rapidly convergent solution and the descretization error decreases when the cell number increases. However, the finer the grid system, the heavier the computing burden and the higher the computing cost [14].
The grids independency was checked by increasing the meshes 6 steps and the results of finer grids were approximately equal. Some of the grid systems tested and their numbers of cells are indicated in Table 5. The numbers of grids from step 4, with 40×32×10
grid cells increased the computational load rapidly. Therefore this step was used in all simulation modeling. The second reason behind this selection is that 3D modeling generally needs much more calculations, since the parametric studies needs a wide range of combination conditions. Table 5 Various grid systems of 3D models Grid 4 Grid 5 House 40×32×10 80×64×20 Soil 120×120×12 120×120×12 Total cells 185600 275200
Of course sometimes higher grid cells were used to get more accurate results. So based on accuracy and affordability the grid density was at the maximum size. 7 Results and Discussion
The air conditioning in houses and living areas is one of inevitable parts of design, operation and maintenance services. Because of their importance, study of their effect on radon distribution in house is very vital. But their complexity has closed the ways to study them. So in this study we considered a simple and most popular way of air conditioning and we studied its behavior and effects on radon concentration. Fan-coils or fans are the most used ranking of air conditioning systems in the world.
In this study we considered 3 intake fans and 3 exhaust fans in the room and set for them the conditions of fan-coils.
7.1 Exhaust fan
WSEAS TRANSACTIONS on FLUID MECHANICS Keramatollah Akbari, Jafar Mahmoudi, Robert Oman
E-ISSN: 2224-347X 150 Issue 4, Volume 7, October 2012
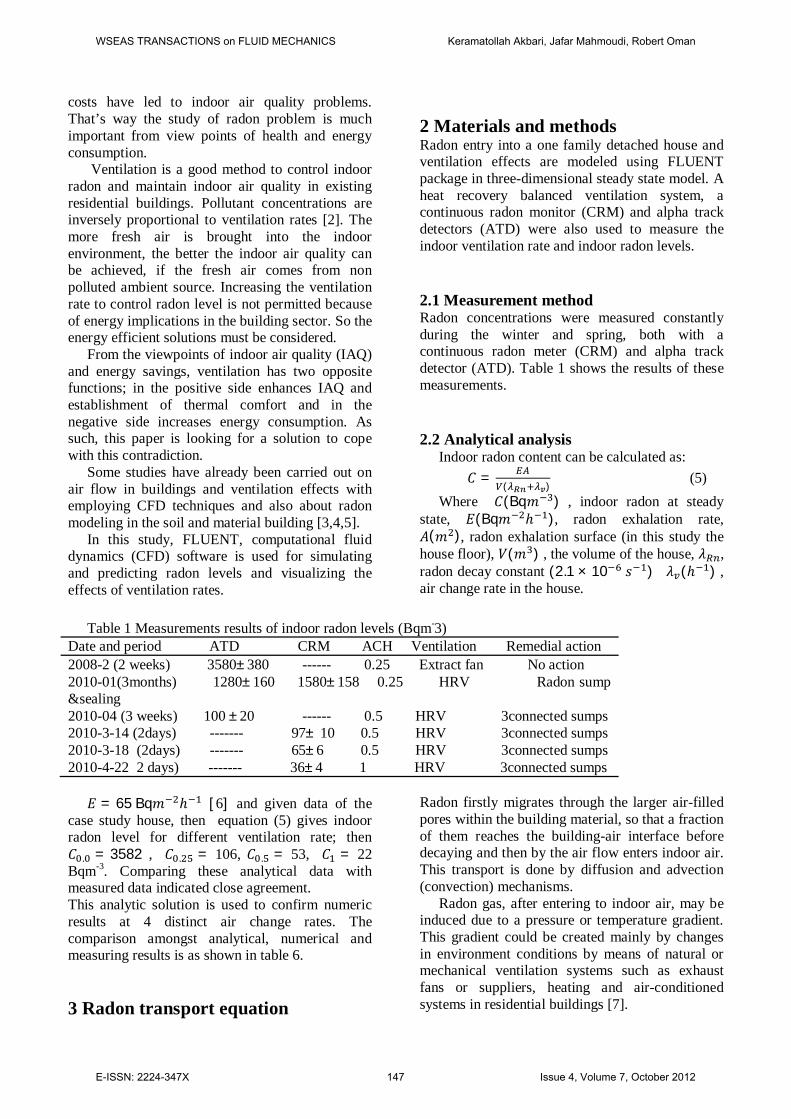
The figures below show the flow field in house for a case study of exhaust fan. In this case the pressure jump in exhaust fan is considered 10 Pa. These figures clearly illustrate the behavior of
mixture into the house for this condition. The indoor air velocity and temperature in the house are in the thermal comfort.
Fig.2 Velocity in the midpoint of the house, Case study of exhaust fan with pressure jump of 10 Pa
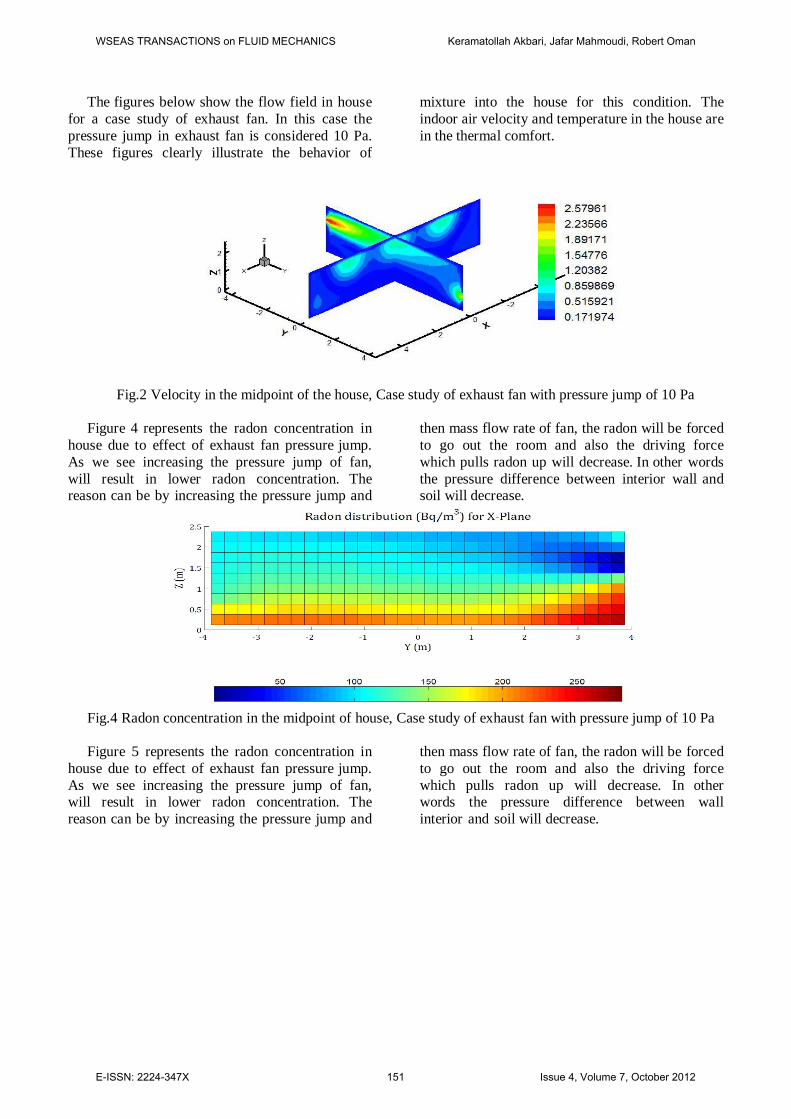
Figure 4 represents the radon concentration in
house due to effect of exhaust fan pressure jump. As we see increasing the pressure jump of fan, will result in lower radon concentration. The reason can be by increasing the pressure jump and
then mass flow rate of fan, the radon will be forced to go out the room and also the driving force which pulls radon up will decrease. In other words the pressure difference between interior wall and soil will decrease.
Fig.4 Radon concentration in the midpoint of house, Case study of exhaust fan with pressure jump of 10 Pa Figure 5 represents the radon concentration in
house due to effect of exhaust fan pressure jump. As we see increasing the pressure jump of fan, will result in lower radon concentration. The reason can be by increasing the pressure jump and
then mass flow rate of fan, the radon will be forced to go out the room and also the driving force which pulls radon up will decrease. In other words the pressure difference between wall interior and soil will decrease.
WSEAS TRANSACTIONS on FLUID MECHANICS Keramatollah Akbari, Jafar Mahmoudi, Robert Oman
E-ISSN: 2224-347X 151 Issue 4, Volume 7, October 2012

Fig.5 Radon concentration in the house versus pressure jump of exhaust fan
7.2 Intake fan
In some houses, the air conditioning operation is done with inlet fans other than exhaust fans. So in this part of study we considered a house with 3 intakes fans. The pressure jump in fans was considered to be 2-20 Pa. The contours below investigate the flow field (air) properties throughout the house. The status of velocity and radon distribution is presented in figures 6 and 7, respectively.
7.3 Door
As we see in above figures the intake fan which forces air into the house, causes the pressure raise into it. The effect of doors, windows, and inlet fan are clear in these figures.
Every house has some door and window. In air
conditioning calculation for design and operation the effect of each of them is considered. Doors and windows have some leakage of mass or heat or both. So in this part we studied the effect of doors on radon concentration and distribution in the house. Figure 8 represents the effect of door leakage velocity on the radon concentration in the house. As it is seen, increasing the velocity or mass flow rate leaking the door will decrease the radon content of the house. The main reason can be the increase in internal pressure of house and decrease in radon driving forces. The heating, ventilation and air conditioning systems, because of changing pressure or temperature make pressure-driven convective flow, which relates the apparent velocity of fluid flow through a cross-sectional area to the pressure gradient [7].
.
Fig.6 Velocity contour for two perpendicular planes crossing the midpoint of house, Case study of intake fan
with pressure jump of 10 Pa
WSEAS TRANSACTIONS on FLUID MECHANICS Keramatollah Akbari, Jafar Mahmoudi, Robert Oman
E-ISSN: 2224-347X 152 Issue 4, Volume 7, October 2012

Fig.7 Radon concentration contour for two perpendicular planes crossing the midpoint of house, Case study
of intake fan with pressure jump of 10 Pa 7.4 Indoor radon concentrations results
This analytic solution is used to validate numeric results at 3 distinct air change rates. The comparison amongst analytical, numerical and measuring results is as shown in table 6
Table 6 shows the radon concentrations of the house from measurement, analytical calculation and numerical simulation techniques. Comparing these analytical data with measured data indicated close agreement.
In spite of having some errors in all techniques, for instance, measurement technique by continuous radon monitor has 10% uncertainty; the results have a close agreement.
Table 6 Indoor radon concentrations results(Bq푚 ) Ach Measurement Analytic Numeric @ E = 65 0.25 120 106 100 0.5 60 53 65 1 30 22 30
In order to show impact of ventilation rate on radon level, radon concentrations were measured
with changing ventilation rate in three levels. Figure 9 shows the results of three different air change rates, by means of a continuous radon monitor (CRM).
Results of numerical study indicated that indoor pressure made by means of ventilation systems and infiltration through door or window has significant effects on indoor radon content. It is observed that the location of vents can affect the indoor radon level, particularly in breathing (seating) zone. This fact is observed from comparing figures 4 and 7. 8 Conclusion
The modeling method of radon in FLUENT software is the key factor for solving transports equations in turbulence modeling and enhancing accuracy of the results.
The models developed with FLUENT simulated radon entry through the soil into a one family house in 3D models. The results totally were indicated that indoor radon concentrations are dependent on radon production rate, ventilation specifications and indoor conditions.
The verification of the model and its performance proved that radon entry to the house and ventilation effects has defined perfectly physically and numerically.
WSEAS TRANSACTIONS on FLUID MECHANICS Keramatollah Akbari, Jafar Mahmoudi, Robert Oman
E-ISSN: 2224-347X 153 Issue 4, Volume 7, October 2012

Fig.8 Effect of air velocity leakage through the door on radon concentration
Fig.9 Radon level measurements versus ventilation rate
The performance and sensitivity of the model were confirmed with the changing of some input parameters and boundary conditions as well.
According to the simulation results, distribution of radon is homogeneous except for the places near exhaust or intake fan locations. The concentration of radon exponentially decreases with increasing indoor pressure and the ventilation rate. The results of simulation, analytical analysis and measurement agreed well with each other.
Discrepancies found here between CFD simulation, measurement and mathematical methods may have resulted from insufficiently detailed representation of other boundary conditions and initial conditions. It may be possible to further improve CFD results by using a more refined representation of grids and some boundary conditions, such as pressure and temperature difference between inside and outside. Meanwhile, the use of CFD for quantitative estimation of indoor radon concentration requires careful validation of CFD methods.
In conclusion, CFD is a powerful tool for exploring the factors that influence radon distributions in the residential building. However, the accuracy of indoor radon and indoor conditions
simulation results can only be confirmed for conditions that have been validated. This model also can be improved with considering some real situations in residential buildings; internal heating source and external situations. The problem can be modeled under integration of all or some combinations together as like as real weather or indoor conditions. Reference: [1] J. U. Ahmed, IAEA bulltin,2. 1994. [2] Y. Zhang, Indoor air quality engineerin . CRC press, 2004. [3] European Commission. Report No 23, Ventilation, Good Indoor Air Quality and Rational Use of Energy. European commission, 2005. [4] P. E. Nilsson, Achieving the desired indoor climate,. 2006. pp. 153,. [5] P. K. Amissah, Indoor Air Quality: Combining Air Humidity with Construction Moisture, . 2005. [6] Clavensjo, Bertil; Gustav, Akerblom. The Radon Book. 1994. [7] W. H. Spoel, Redon transport in sand (PhD Thesis). s.l. : Technische Universiteit Eindhoven, 1998. 90-386-0647-8.
WSEAS TRANSACTIONS on FLUID MECHANICS Keramatollah Akbari, Jafar Mahmoudi, Robert Oman
E-ISSN: 2224-347X 154 Issue 4, Volume 7, October 2012

[8] FLUENT Incorporation. FLUENT 6.3 User's Guide,. 2006. [9] H.B. Awbi, Ventilation of building, . s.l. : Spoon Press,, 2003. [10] J. Burnett, C.Thomas W. Tung Radon Measurement Protocol for Residences with Different Ventilation Rates,. 2004. [11] L. Mora, A. J. Gadgil,E. Wurtz,. Comparing zonal and CFD model predictions of isothermal indoor airflows to experimental data,. 2003, Vols. 13: 77–85. [12] H. Arvela, Residential Radon in Finland: Sources, Variation, Modelling and Dose Comparisons, Helsinki. 1995. [13] H. Kokotti, Dependence of Radon Level on Ventilation Systems in Residences,. Natural and Environmental Sciences . 1995.
[14] F. Wang and I. C. Ward,. The development of a radon entry model for a house with a cellar. Building and Environment . 2000, Vols. 35 (2000) 615-631 . [15] M. Cehlin and B. Moshfegh, Numerical and experimental investigations of air flow and temperature patterns of a low velocity diffuser. Division of Energy and Mechanical Engineering, Department of Technology, University of Gävle,Indoor Air, 2002. [16] CO. Loureiro “Simulation of the steady-state transport of radonfrom soil into houses with basement under constant negativepressure.”. Report no. LBL-24378. Lawrence Berkeley Laboratory, Berkeley, CA., 1987.
WSEAS TRANSACTIONS on FLUID MECHANICS Keramatollah Akbari, Jafar Mahmoudi, Robert Oman
E-ISSN: 2224-347X 155 Issue 4, Volume 7, October 2012