nureg/cr-7204, "applying ultrasonic testing in lieu of
TRANSCRIPT
Applying Ultrasonic Testing in Lieu of Radiography for Volumetric Examination of Carbon Steel Piping
Office of Nuclear Regulatory Research
NUREG/CR-7204 PNNL-24232
AVAILABILITY OF REFERENCE MATERIALSIN NRC PUBLICATIONS
NRC Reference Material
As of November 1999, you may electronically access NUREG-series publications and other NRC records at NRC’s Library at www.nrc.gov/reading-rm.html. Publicly released records include, to name a few, NUREG-series publications; Federal Register notices; applicant, licensee, and vendor documents and correspondence; NRC correspondence and internal memoranda; bulletins and information notices; inspection and investigative reports; licensee event reports; and Commission papers and their attachments.
NRC publications in the NUREG series, NRC regulations, and Title 10, “Energy,” in the Code of Federal Regulations may also be purchased from one of these two sources.
1. The Superintendent of Documents U.S. Government Publishing Office Mail Stop IDCC Washington, DC 20402-0001 Internet: bookstore.gpo.gov Telephone: (202) 512-1800 Fax: (202) 512-2104
2. The National Technical Information Service 5301 Shawnee Rd., Alexandria, VA 22312-0002 www.ntis.gov 1-800-553-6847 or, locally, (703) 605-6000
A single copy of each NRC draft report for comment isavailable free, to the extent of supply, upon writtenrequest as follows:
Address: U.S. Nuclear Regulatory Commission Office of Administration Publications Branch Washington, DC 20555-0001 E-mail: [email protected] Facsimile: (301) 415-2289
Some publications in the NUREG series that are posted at NRC’s Web site address www.nrc.gov/reading-rm/doc-collections/nuregs are updated periodically and may differ from the last printed version. Although references to material found on a Web site bear the date the material was accessed, the material available on the date cited may subsequently be removed from the site.
Non-NRC Reference Material
Documents available from public and special technical libraries include all open literature items, such as books, journal articles, transactions, Federal Register notices, Federal and State legislation, and congressional reports. Such documents as theses, dissertations, foreign reports and translations, and non-NRC conference proceedings may be purchased from their sponsoring organization.
Copies of industry codes and standards used in asubstantive manner in the NRC regulatory process are maintained at—
The NRC Technical LibraryTwo White Flint North11545 Rockville PikeRockville, MD 20852-2738
These standards are available in the library for reference use by the public. Codes and standards are usually copyrighted and may be purchased from the originating organization or, if they are American National Standards, from—
American National Standards Institute11 West 42nd StreetNew York, NY 10036-8002www.ansi.org(212) 642-4900
Legally binding regulatory requirements are stated only in laws; NRC regulations; licenses, including technical speci-fications; or orders, not in NUREG-series publications. The views expressed in contractorprepared publications in this series are not necessarily those of the NRC.
The NUREG series comprises (1) technical and adminis-trative reports and books prepared by the staff (NUREG–XXXX) or agency contractors (NUREG/CR–XXXX), (2) proceedings of conferences (NUREG/CP–XXXX), (3) reports resulting from international agreements (NUREG/IA–XXXX), (4) brochures (NUREG/BR–XXXX), and (5) compilations of legal decisions and orders of the Commission and Atomic and Safety Licensing Boards and of Directors’ decisions under Section 2.206 of NRC’s regulations (NUREG–0750).
DISCLAIMER: This report was prepared as an account of work sponsored by an agency of the U.S. Government. Neither the U.S. Government nor any agency thereof, nor any employee, makes any warranty, expressed or implied, or assumes any legal liability or responsibility for any third party’s use, or the results of such use, of any information, apparatus, product, or process disclosed in this publication, or represents that its use by such third party would not infringe privately owned rights.
Applying Ultrasonic Testing in Lieu of Radiography for Volumetric Examination of Carbon Steel Piping Manuscript Completed: May 2015 Date Published: September 2015 Prepared by: T. L. Moran, M. Prowant, C. A. Nove*, A. F. Pardini, S. L. Crawford, A. D. Cinson, and M. T. Anderson Pacific Northwest National Laboratory P.O. Box 999 Richland, WA 99352 *U.S. Nuclear Regulatory Commission C. A. Nove, NRC Project Manager NRC Job Code V6097 Office of Nuclear Regulatory Research
NUREG/CR-7204 PNNL-24232

iii
ABSTRACT
Confirmatory research is being conducted for the U.S. Nuclear Regulatory Commission at the Pacific Northwest National Laboratory to assess the effectiveness and reliability of advanced nondestructive examination methods as they are applied to pressure boundary components and other materials installed in light-water reactors. The work reported here provides an initial technical evaluation of the capabilities of phased-array ultrasonic testing to supplant traditional radiographic testing for detection and characterization of welding fabrication flaws in carbon steel welds. The work was performed on a limited set of piping girth welds and welded plates containing varied types and sizes of volumetric and planar fabrication flaws. Phased-array ultrasonic data were acquired using transmit-receive shear waves at 4.0 and 5.0 MHz, and compared to consensus evaluations and computed radiography in correlating detection and flaw characterization capabilities. The results show that, for carbon steel, phased-array ultrasonic testing is capable of detecting all but very small volumetric flaws, and is much more capable of detecting planar flaws than standard radiographic techniques. The study also shows that characterization of flaws using ultrasonic testing (i.e., determining whether a flaw is volumetric or planar in nature) can be highly subjective based on operator experience; thus, radiographic imaging may have an advantage over ultrasonic imaging in this regard. Finally, several technical knowledge gaps were discovered as a result of this work, including the lack of appropriate performance demonstration standards and robust acceptance criteria for fabrication weld inspection (i.e., fitness for service versus workmanship standards).

v
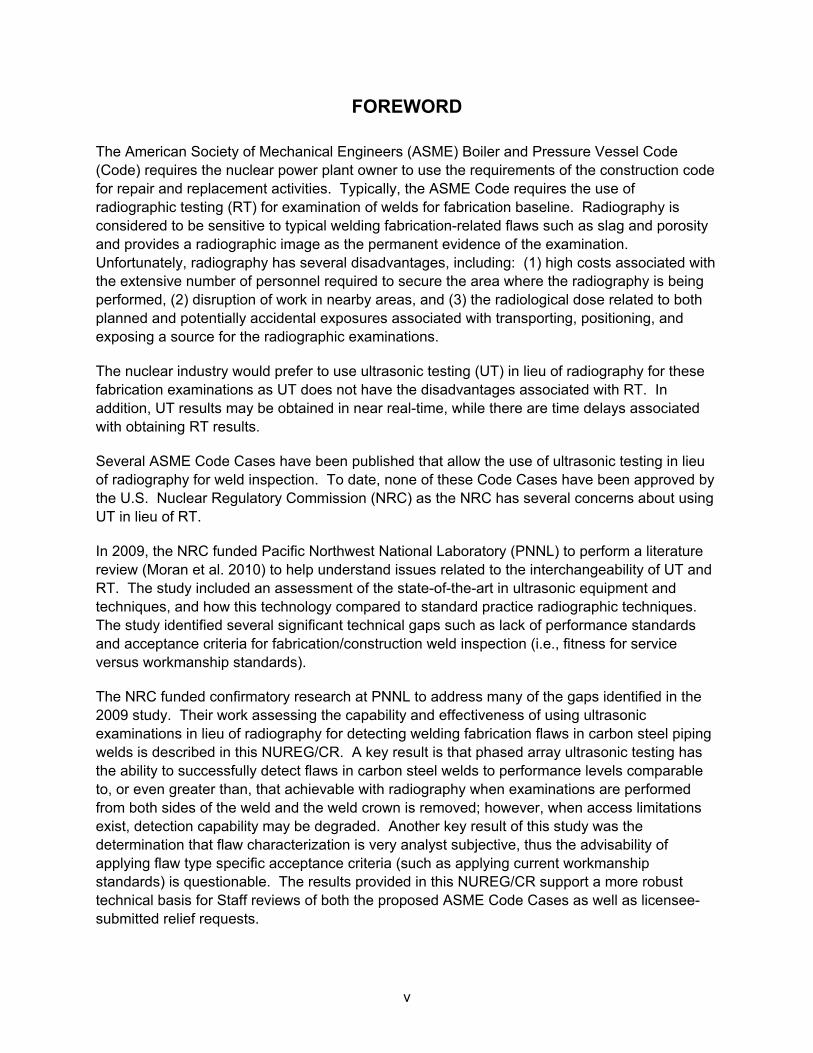
FOREWORD
The American Society of Mechanical Engineers (ASME) Boiler and Pressure Vessel Code (Code) requires the nuclear power plant owner to use the requirements of the construction code for repair and replacement activities. Typically, the ASME Code requires the use of radiographic testing (RT) for examination of welds for fabrication baseline. Radiography is considered to be sensitive to typical welding fabrication-related flaws such as slag and porosity and provides a radiographic image as the permanent evidence of the examination. Unfortunately, radiography has several disadvantages, including: (1) high costs associated with the extensive number of personnel required to secure the area where the radiography is being performed, (2) disruption of work in nearby areas, and (3) the radiological dose related to both planned and potentially accidental exposures associated with transporting, positioning, and exposing a source for the radiographic examinations.
The nuclear industry would prefer to use ultrasonic testing (UT) in lieu of radiography for these fabrication examinations as UT does not have the disadvantages associated with RT. In addition, UT results may be obtained in near real-time, while there are time delays associated with obtaining RT results.
Several ASME Code Cases have been published that allow the use of ultrasonic testing in lieu of radiography for weld inspection. To date, none of these Code Cases have been approved by the U.S. Nuclear Regulatory Commission (NRC) as the NRC has several concerns about using UT in lieu of RT.
In 2009, the NRC funded Pacific Northwest National Laboratory (PNNL) to perform a literature review (Moran et al. 2010) to help understand issues related to the interchangeability of UT and RT. The study included an assessment of the state-of-the-art in ultrasonic equipment and techniques, and how this technology compared to standard practice radiographic techniques. The study identified several significant technical gaps such as lack of performance standards and acceptance criteria for fabrication/construction weld inspection (i.e., fitness for service versus workmanship standards).
The NRC funded confirmatory research at PNNL to address many of the gaps identified in the 2009 study. Their work assessing the capability and effectiveness of using ultrasonic examinations in lieu of radiography for detecting welding fabrication flaws in carbon steel piping welds is described in this NUREG/CR. A key result is that phased array ultrasonic testing has the ability to successfully detect flaws in carbon steel welds to performance levels comparable to, or even greater than, that achievable with radiography when examinations are performed from both sides of the weld and the weld crown is removed; however, when access limitations exist, detection capability may be degraded. Another key result of this study was the determination that flaw characterization is very analyst subjective, thus the advisability of applying flaw type specific acceptance criteria (such as applying current workmanship standards) is questionable. The results provided in this NUREG/CR support a more robust technical basis for Staff reviews of both the proposed ASME Code Cases as well as licensee-submitted relief requests.

vii
CONTENTS
ABSTRACT ................................................................................................................................. iii FOREWORD ................................................................................................................................. v
FIGURES ..................................................................................................................................... ix
TABLES ..................................................................................................................................... xiii EXECUTIVE SUMMARY ............................................................................................................ xv
ACKNOWLEDGMENTS ............................................................................................................ xxi ACRONYMS AND ABBREVIATIONS .................................................................................... xxiii 1 INTRODUCTION ................................................................................................................ 1-1
2 BACKGROUND ................................................................................................................. 2-1
2.1 Motivation for Study .................................................................................................... 2-1
2.2 Summary of Previous Work – Worldwide ................................................................... 2-4
2.3 Overview of Applicable Weld Inspection Codes ......................................................... 2-5
2.4 Fundamental Differences Between UT and RT .......................................................... 2-6
2.5 Conventional UT versus Phased-Array UT ................................................................. 2-8
3 LABORATORY SPECIMENS AND FLAWS ..................................................................... 3-1
3.1 Carbon Steel Pipe Specimens and Flaws ................................................................... 3-1
3.2 Navy Plate Specimens and Flaws .............................................................................. 3-4
4 EQUIPMENT AND METHODS USED FOR PA-UT ........................................................... 4-1
4.1 Focal Laws .................................................................................................................. 4-1
4.2 Phased-Array Probes and Modeling ........................................................................... 4-2
4.2.1 4.0-MHz TRS Probe – Use of Existing Ultrasonic Phased Array ...................... 4-2
4.2.2 5.0-MHz TRS Probe – Development of Optimized Phased Array ..................... 4-6
5 EQUIPMENT AND METHODS USED FOR RT ................................................................. 5-1
5.1 X-ray Vault .................................................................................................................. 5-1
5.2 X-ray Machine ............................................................................................................. 5-2
5.3 X-ray Imaging Media ................................................................................................... 5-3
5.4 X-ray Imaging Hardware and Software ....................................................................... 5-4
5.5 X-ray Inspection Protocols .......................................................................................... 5-5
5.6 Interpretation of Flaw True State Results ................................................................... 5-7
5.7 PNNL RT Performed on the Navy Plates .................................................................... 5-8
6 LABORATORY ULTRASONIC RESEARCH VARIABLES ............................................... 6-1
6.1 PA-UT System ............................................................................................................ 6-1
6.2 Scanning Protocols ..................................................................................................... 6-3
6.2.1 Calibration for Carbon Steel Pipe...................................................................... 6-3
viii
6.2.2 Calibration for Navy Plates and Re-scan of Carbon Steel Pipe B1A ................ 6-3
6.2.3 Examination and Volume of Inspection ............................................................. 6-4
6.3 Indication Characterization ....................................................................................... 6-10
7 ANALYSIS OF INITIAL DATA ........................................................................................... 7-1
7.1 Piping Weld Assessment ............................................................................................ 7-1
7.1.1 Flaw Detection .................................................................................................. 7-1
7.1.2 Flaw Sizing ...................................................................................................... 7-23
7.2 Navy Plate Assessment ............................................................................................ 7-26
7.2.1 Navy Flaw Detection and Characterization Protocol ....................................... 7-27
7.2.2 PNNL UT Flaw Characterization Study ........................................................... 7-27
7.2.3 Comparison of Navy RT with PA-UT for Flaw Detection and Characterization .............................................................................................. 7-32
8 CONCLUSIONS AND RECOMMENDATIONS .................................................................. 8-1
9 REFERENCES ................................................................................................................... 9-1
APPENDIX A – ANALYSIS SUMMARY – FROM INDUSTRY QUESTIONNAIRE ................. A-1
APPENDIX B – RT AND UT DETECTION RESULTS FOR ALL IMPLANTED AND BONUS FABRICATION FLAWS IN THE CARBON STEEL PIPING ............ B-1
ix
FIGURES
3-1 Carbon Steel Pipe-to-Pipe (B1A, B2A, B3A, and B4A) Specimens Used for This Study; Various Fabrication Flaws Exist in Weld Regions ........................................ 3-2
3-2 Single Bevel Weld Configurations in the Carbon Steel Pipe Specimens: (a) Weld Crown Ground Flush, (b) Weld Crown Present ................................................. 3-3
3-3 Carbon Steel Navy Test Plate Numbers 10 (Upper Left), 18 (Upper Right), and 23 (Lower); Various Fabrication Flaws Exist in Weld Regions ........................................ 3-5
3-4 Double-V Butt Weld Configurations Used in the Navy Carbon Steel Plates .................... 3-5
4-1 The ZETEC Advanced Phased-Array Calculator is Useful for Generating Focal Laws (left) and Simulating the Sound Field for the Focal Law (right) to Determine Idealized Beam Characteristics ...................................................................... 4-2
4-2 4.0-MHz TRS Phased-Array Probe ................................................................................. 4-3
4-3 Phased-Array Directivity of the 4-MHz Array Steered to 15 Degrees from the Natural Refracted Angle of 60 Degrees. Off-axis grating lobe is present and indicated by the black arrow at approximately −34 degrees. ........................................... 4-4
4-4 Simulations of the Beams Created by the 4.0-MHz TRS Arrangement for 45, 60, and 70 Degrees in 25.4-mm (1.0-in.) Thick Carbon Steel Pipe ................................. 4-5
4-5 Simulations of the Beams Created by the 4.0-MHz TRS Arrangement 60 Degrees in 50.8-mm (2.0-in.) Thick Carbon Steel Plate ............................................. 4-5
4-6 5-MHz TRS Phased-Array Probe on Wedge Assembly .................................................. 4-6
4-7 5.0-MHz Probe Directivity Model Steered 15 Degrees (top) and 20 Degrees (bottom). The onset of a grating lobe is shown in the bottom image indicated by the black arrow. ........................................................................................................... 4-8
4-8 5.0-MHz Probe, 60-Degree Beam Simulation on 25.4-mm (1.0-in.) Thick Pipe Component. Target focus at 3/4T (T = wall thickness). .................................................. 4-9
4-9 5.0-MHz Probe, 60-Degree Beam Simulation on 50.8-mm (2.0-in.) Thick Plate Component. Target focus at 3/4T (T = wall thickness). .................................................. 4-9
5-1 PNNL Radiography Facility and X-ray Vault .................................................................... 5-2
5-2 X-ray Machine.................................................................................................................. 5-3
5-3 X-ray Controller ................................................................................................................ 5-3
5-4 RT Imaging Media and Placement .................................................................................. 5-4
5-5 Reader and Screen Shot of SENTINEL Vision HR Software Application ........................ 5-5
5-6 Penetrameter Image Quality Indicator ............................................................................. 5-5
5-7 Placement of Penetrameter on Pipe ................................................................................ 5-6
5-8 Typical Radiographs Displaying the Use of a Penetrameter ........................................... 5-7
5-9 (a) Example of the Specimen Set-up and Labeling for Plate 18 for CR Examination with the Radiographic Parameters. (b) Digital Image of a Section of Plate 18........................................................................................................................ 5-8
x
6-1 DYNARAY and Motor Control Drive Unit ......................................................................... 6-2
6-2 Automated Scanner and PA-UT Probes on Piping Specimen (top) and Navy Plate Specimen (bottom) ................................................................................................. 6-2
6-3 Flame Cut Edges of Plate 23 ........................................................................................... 6-3
6-4 (a) ASME Code, Section XI, Inservice Inspection Volume – Inner 1/3 Thickness and (b) Inspection Volume required for Repair/Replacement – Entire Thickness .............................................................................................................. 6-4
6-5 Axial Multi-line (a) and Raster (b) Scanning Looking for Circumferentially Oriented Flaws (parallel to weld centerline) ..................................................................... 6-6
6-6 Techniques for Scanning that Use ½-V (first leg of sound), Full-V (second leg of sound), and 1-1/2–V (third leg of sound) ..................................................................... 6-7
6-7 True Depth, Focusing at a Fixed Depth, and Half Path, Focusing at a Fixed Part Path, Focal Styles are Demonstrated ...................................................................... 6-8
6-8 “0” Stamp Shown for Navy Plate 23 (etched lines drawn over with marker for scanning) ......................................................................................................................... 6-9
6-9 PNNL’s Scanning Station 1 and Station 2 for Plate 10 .................................................... 6-9
7-1 Example of Near-Side and Far-Side Designation in UT Data Analysis ........................... 7-2
7-2 Description of a Typical PA-UT Analysis Screen Identifying Relevant Features and Locations of Weld Responses .................................................................................. 7-3
7-3 Weld Schematic for Lack of Fusion ................................................................................. 7-4
7-4 Radiographic Image of Lack of Fusion ............................................................................ 7-4
7-5 Ultrasonic Image of Lack of Fusion ................................................................................. 7-5
7-6 Weld Schematic of Lack of Penetration (incomplete penetration) ................................... 7-6
7-7 Photograph and Radiographic Image of Incomplete Penetration .................................... 7-6
7-8 Ultrasonic Image of LOP .................................................................................................. 7-7
7-9 Weld Schematic of Crack ................................................................................................ 7-8
7-10 Radiographic Image of a Crack. Note: This image has been magnified 2X to enhance the visibility of the flaw for the reader. ............................................................... 7-8
7-11 Ultrasonic Image of a Crack ............................................................................................ 7-9
7-12 Weld Schematic of Slag ................................................................................................... 7-9
7-13 Radiographic Image of Slag Inclusions. Note: This image has been magnified 6X to enhance the flaw visibility for the reader. ............................................................. 7-10
7-14 Ultrasonic Image of Slag ................................................................................................ 7-11
7-15 Weld Schematic of Porosity ........................................................................................... 7-11
7-16 Radiographic Image of Cluster Porosity. Note: This image has been magnified approximately 2X to enhance the visibility of the flaw for the reader. ........... 7-12
7-17 Ultrasonic Image of Porosity .......................................................................................... 7-13
7-18 Example of Bonus Flaws ............................................................................................... 7-14
xi
7-19 Example of a Radiograph Being Converted into a Flaw Map Which is Used to Aid in Interpretation of Detection Capability of UT (blue) and RT (red) ......................... 7-14
7-20 RT and UT Detection Results for All Implanted (intentional) Fabrication Flaws ............ 7-15
7-21 RT and UT Detection Results for All Bonus (unintentional) Fabrication Flaws .............. 7-16
7-22 Example of LOF that was Not Detected by RT .............................................................. 7-17
7-23 Schematic of LOF and Concave Weld Root as Shown in 7-22 PA-UT and 7-24 RT Images ..................................................................................................................... 7-17
7-24 RT Image of Concave Weld Root .................................................................................. 7-18
7-25 Bonus Flaws Missed by UT (38) or RT (32) .................................................................. 7-19
7-26 Adjacent Flaws Easily Discernible with RT .................................................................... 7-20
7-27 Example of Side Wall LOF (D-scan view on left and C-scan view on right) .................. 7-21
7-28 Schematic of a Phased-Array Multiple Angle Inspection ............................................... 7-22
7-29 Schematic of Phased-Array Inspection from Near and Far Side of the Weld ................ 7-22
7-30 Example Radiograph Showing Sizing Methods Using RT Software .............................. 7-24
7-31 Length Measurement of Incomplete Penetration Flaw .................................................. 7-24
7-32 Results of Independent Flaw Type Analysis .................................................................. 7-31
7-33 Flaw Map of Plate 18 Station 1, Axes Units are in mm .................................................. 7-33
7-34 Flaw Map of Plate 18 Station 2, Axes Units are in mm .................................................. 7-34
7-35 Flaw Map of Plate 10 Station 1, Axes Units are in mm .................................................. 7-35
7-36 Flaw Map of Plate 10 Station 2, Axes Units are in mm .................................................. 7-36
7-37 Flaw Map of Plate 23, Axes Units are in mm ................................................................. 7-37

xiii
TABLES
3-1 Range of Flaw Types and Sizes Contained in the Four Carbon Steel Pipe-to-Pipe Welded Specimens .................................................................................................. 3-4
3-2 Flaw Types and Range of Sizes Contained in the Navy Test Plates ............................... 3-6
4-1 Ultrasonic Array Physical Specifications .......................................................................... 4-7
6-1 Characteristics of Flaw and Geometric Indications ........................................................ 6-10
7-1 RMSE Length Sizing Summary: (-) indicates typically under sizing and (+) indicates typically over sizing ......................................................................................... 7-26
7-2 Flaw Type Decision Matrix ............................................................................................. 7-29
7-3 Flaw Detection/Characterization Analysis between Navy Consensus Calls, PNNL UT, and PNNL RT Calls ...................................................................................... 7-40

xv
EXECUTIVE SUMMARY
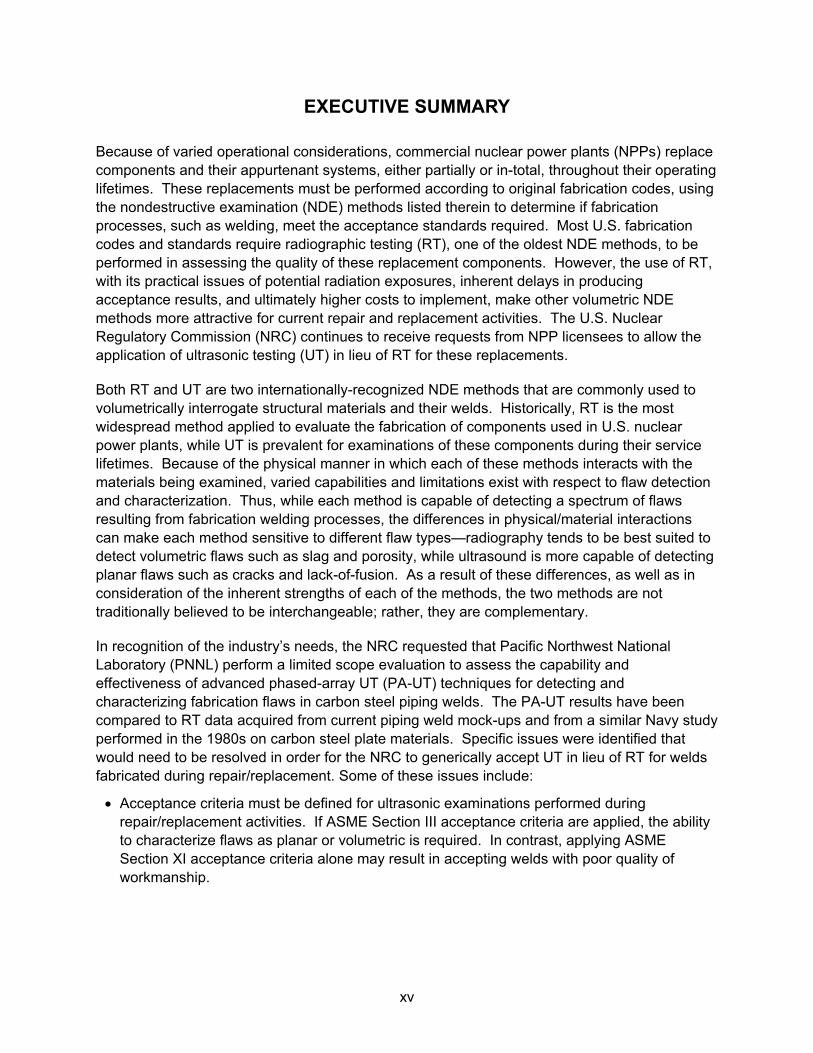
Because of varied operational considerations, commercial nuclear power plants (NPPs) replace components and their appurtenant systems, either partially or in-total, throughout their operating lifetimes. These replacements must be performed according to original fabrication codes, using the nondestructive examination (NDE) methods listed therein to determine if fabrication processes, such as welding, meet the acceptance standards required. Most U.S. fabrication codes and standards require radiographic testing (RT), one of the oldest NDE methods, to be performed in assessing the quality of these replacement components. However, the use of RT, with its practical issues of potential radiation exposures, inherent delays in producing acceptance results, and ultimately higher costs to implement, make other volumetric NDE methods more attractive for current repair and replacement activities. The U.S. Nuclear Regulatory Commission (NRC) continues to receive requests from NPP licensees to allow the application of ultrasonic testing (UT) in lieu of RT for these replacements.
Both RT and UT are two internationally-recognized NDE methods that are commonly used to volumetrically interrogate structural materials and their welds. Historically, RT is the most widespread method applied to evaluate the fabrication of components used in U.S. nuclear power plants, while UT is prevalent for examinations of these components during their service lifetimes. Because of the physical manner in which each of these methods interacts with the materials being examined, varied capabilities and limitations exist with respect to flaw detection and characterization. Thus, while each method is capable of detecting a spectrum of flaws resulting from fabrication welding processes, the differences in physical/material interactions can make each method sensitive to different flaw types—radiography tends to be best suited to detect volumetric flaws such as slag and porosity, while ultrasound is more capable of detecting planar flaws such as cracks and lack-of-fusion. As a result of these differences, as well as in consideration of the inherent strengths of each of the methods, the two methods are not traditionally believed to be interchangeable; rather, they are complementary.
In recognition of the industry’s needs, the NRC requested that Pacific Northwest National Laboratory (PNNL) perform a limited scope evaluation to assess the capability and effectiveness of advanced phased-array UT (PA-UT) techniques for detecting and characterizing fabrication flaws in carbon steel piping welds. The PA-UT results have been compared to RT data acquired from current piping weld mock-ups and from a similar Navy study performed in the 1980s on carbon steel plate materials. Specific issues were identified that would need to be resolved in order for the NRC to generically accept UT in lieu of RT for welds fabricated during repair/replacement. Some of these issues include:
• Acceptance criteria must be defined for ultrasonic examinations performed during repair/replacement activities. If ASME Section III acceptance criteria are applied, the ability to characterize flaws as planar or volumetric is required. In contrast, applying ASME Section XI acceptance criteria alone may result in accepting welds with poor quality of workmanship.
xvi
• Detection reliability of UT for fabrication flaws has not been well documented. Ultrasonic examination at NPPs is primarily used for inservice examinations, and the method is well-suited for detecting and sizing service-induced planar flaws (surface-connected). Fabrication examinations are aimed at finding surface and sub-surface flaws that result from the welding process including both planar and volumetric flaws.
• NPP materials, joint designs, welding methods, and expected flaw types are not typically represented by the few round-robin exercises performed during the 1980s and early 1990s. Additionally, these older studies used somewhat outdated NDE methods such as conventional manual UT and film-based RT, as opposed to today’s methods such as encoded PA-UT and digital RT.
• Performance demonstration is the current approach used to qualify UT examinations in the nuclear industry. Requirements for performance demonstration for equipment, procedures, and personnel used for UT examinations in lieu of RT as applied to repair/replace activities are yet to be determined. Some issues remaining to be addressed are the numbers and types of flaws/mock-ups needed to demonstrate robust UT applications and what level of statistically-based acceptance criteria are needed to provide appropriate screening for competent UT systems, given that fabrication variables are different than those for inservice inspection.
• Documentation requirements/recordkeeping remains to be assessed. RT provides a record of the inspection in the form of the radiographic image. It is unclear as to the minimum record requirements that should be maintained for UT; for example, format of data, content, etc.
An open literature review was conducted to determine if significant issues that needed to be resolved to replace RT with UT had previously been investigated. The review identified four key factors, including detection capabilities, false call rates, costs, and procedural aspects. Detection capabilities are generally described with probability of detection (POD) curves, often determined through round-robin exercises. Eight significant round robins, or similar studies, carried out in the past 30 years were reviewed.
The results of the round robins indicate that UT is superior to RT for detection of planar flaws; however, RT has been shown to be comparable or superior for detection of volumetric flaws. These results are strongly dependent on the particular UT techniques applied. Overall costs and procedural complexity appear to be comparable for both UT and RT. Sizing capability (closely linked to false call rates) has not been studied as extensively as detection, but the two techniques appear to be similar for flaw length sizing, while UT has an advantage for flaw (through-wall) depth sizing.
xvii
Conclusions from previous international work relevant to the current study include the following:
• POD comparisons are strongly dependent on the flaw type and orientation, and on evaluation criteria.
• RT is more sensitive to crack planes parallel to the RT beam, while UT is more sensitive to planes perpendicular to the UT beam direction.
• Both RT and UT show drops in sensitivity for misoriented cracks and for flaws smaller than 1 mm.
• Encoded UT is vastly superior to non-encoded UT in terms of visualization and analysis of images, recordkeeping, and overall POD.
Some additional considerations:
• New welding methods may reduce the incidence of fabrication flaws.
• High-sensitivity encoded UT examinations (such as PA-UT) are slightly more expensive than non-encoded conventional UT, but should reduce risk and down-time later in the operating lifetime of the plant, as recorded data images of examination weld volumes provide valuable baseline information used to characterize reflections detected during subsequent examinations.
• UT performance demonstration methods have been developed primarily for examinations aimed at detecting service degradation. These methods will likely need to be modified for volumetric fabrication examinations as fabrication flaw types are significantly different than those resulting from service degradation.
Empirical laboratory work to assess PA-UT capabilities and limitations in detecting and characterizing fabrication flaws was performed on several carbon steel welds. Four carbon steel pipe-to-pipe full penetration butt-welded specimens, three representing ASME Code, Section III, Class 2 piping welds and one representing ASME Code, B31.1 (Pressure Piping) welds, were obtained from various nuclear inspection vendors. These piping weld mock-ups had been fabricated by the inspection vendors in order to assess their own PA-UT procedures and provide limited demonstrations of capability for their clients. In addition, three HY-80 steel welded test plates, two fabricated with purposely induced discontinuities and one removed from a decommissioned submarine hull (all on loan to PNNL from the Naval Surface Warfare Center, Carderock Division) were examined. PNNL performed PA-UT and computed radiography to provide data for making the comparative assessments detailed in this report.
The results of the laboratory investigations show that PA-UT is capable of detecting all planar flaws in the piping specimens that were observed using digital radiography, except for two small lack of fusion flaws that were approximately 1.8 mm ( 0.07 in.) and 3.8 (0.14 in.) in length. PA-UT also detected five implanted and 32 bonus (non-intentional) planar flaws that went undetected using RT. Further, PA-UT was shown to be capable of detecting all but one of the intended volumetric flaws observed in radiographic images. As implemented, PA-UT did not detect 35 bonus (non-intentional) volumetric flaws imaged by RT; most (31 of 35) of these were
xviii
nominally less than 4 mm (0.15 in.) in size. This value is smaller than the theoretical focal spot size of the PA-UT probe at these metal paths. It is believed the non-detections may be the result of the amplitude threshold that was set to eliminate the need to analyze many very small reflectors.
In terms of flaw characterization, PNNL applied a decision protocol similar to what is being performed by industry analysts when determining whether the flaws are volumetric or planar in nature. The initial use of this protocol, or decision matrix, resulted in poor corroboration between three PNNL analysts when using limited weld volume data because of the presence of weld crowns. The OD weld crowns prevented full scans over the volumes of interest producing shortened, or restricted, amplitude and signal echo-dynamic responses for certain beam angles needed to inform the analysis process.
However, when full volume scans of specimens could be made where weld crowns had previously been removed (ground flush), results of analyst-defined volumetric or planar flaw characterizations appeared to markedly improve. This indicates that field weld crown removal may be necessary in order to assist in flaw characterization.
It was noted that certain ultrasonic responses do not display all of the “ideal” characteristics for each of the flaw attributes being assessed by a standard decision matrix; this requires analysts to choose which flaw attributes are more valued, or weighted, over others when characterizing flaws as being either volumetric or planar. The use of a weld cross-sectional profile over-laying the PA-UT images was helpful in locating a flaw within the weld volume, but there is analyst subjectivity in placement of this overlay, which could also affect flaw typing. Thus, the results illustrate the subjective, analyst-dependent nature of using PA-UT (even with a decision matrix) to differentiate varied fabrication flaw types. It is recommended that all performance-based methods and mock-ups developed to demonstrate personnel capability include sufficient variability of flaw types for assessing these characterization skills.
In the nuclear industry, radiography has historically been the primary NDE method for fabrication flaw acceptance, while UT has widely been the volumetric method of choice for detecting service-induced degradation. Fabrication examinations include the entire volume of the weld and adjacent base material, and are aimed at detecting welding flaws that may occur anywhere within this defined volume of interest. Conversely, inservice examinations are generally aimed at material volumes subject to service degradation, such as at the inner one-third of piping welds, including the heat-affected zone and limited adjacent base materials. Additionally, ultrasonic techniques for piping weld examinations have evolved to provide focused sound fields near the inside diameter for detection of surface-connected cracks, because this is where the preponderance of service degradation has occurred. As a result of these differences, as well as in consideration of the inherent strengths of each of the methods, UT and RT are not believed to be interchangeable, but complementary.
Issues remain to be addressed in order for the NRC to consider UT as a viable alternative to RT for repair and replacement activities in nuclear power plants. For instance, it is clear that PA-UT has the ability to successfully detect flaws in carbon steel welds at performance levels comparable to, or even greater than, that achievable with RT when examinations are performed
xix
from both sides of the weld and the weld crown is removed. However, PA-UT may result in degraded detection capability when only single-side weld access is available; even more so if weld crowns remain in place. Overall, PA-UT sizing of fabrication flaws in carbon steel piping welds fell within tolerances that may be considered acceptable for certain performance criteria, such as that found in ASME Section XI, Appendix VIII. However, the applicability of this acceptance standard, having been derived from performance demonstrations on planar crack-like flaws, to welding fabrication flaws, is questionable. Further, in terms of characterization required for the application of ASME Code, Section III-type flaw acceptance criteria, the results of this study indicate that the ability to adequately characterize flaws as either planar or volumetric is very analyst subjective. Thus, whether it is appropriate to apply current welding fabrication acceptance criteria, which is highly dependent on UT characterization, also remains questionable.
An area outside the scope of the work reported here is the industry-proposed application of established standards governing UT performance demonstrations for service-induced flaws (cracks) to UT performance demonstrations for full-volume weld examinations aimed at detecting welding fabrication flaws. It is unclear whether direct application of these existing standards will result in acceptable and reliable performance results. As such, a full assessment of appropriate performance demonstration requirements for fabrication UT remains to be performed.
Finally, because the PA-UT method is predominately being used in lieu of RT for piping replacements in limited systems at selected operating NPPs (e.g., for ASME B31.1 examinations), only PA-UT was assessed in this study. Whether conventional UT methods could be successfully applied for these applications remains unknown at the present time. Further, this work was limited to fine-grained, carbon steel piping butt welds. No conclusions should be drawn regarding the applicability of UT in lieu of RT for other nuclear power plant weld materials or configurations.

xxi
ACKNOWLEDGMENTS
The work reported here was sponsored by the U.S. Nuclear Regulatory Commission (NRC) and conducted under NRC Job Code Number V6097. Carol Nove was the NRC project manager for this work and provided valuable guidance, technical direction and input to this report.
The authors would like to express their gratitude to Jeff Devers and Todd Blechinger from LMT Inc., a business unit of Curtiss-Wright Flow Control Company, for professional expertise in assessing fabrication flaws and supplying materials used in laboratory tests. The authors also thank Gordon Forster at Ameren UE Callaway Plant for the use of three piping qualification specimens; and Dick Collins, Bruce Bandos, and Robert DeNale from the United States Navy, Naval Surface Warfare Center, Carderock Division, for the loan of three carbon steel Navy plate specimens, as well as access to a David Taylor Research Center Report, Ultrasonics as an Alternative to Radiography for Submarine Hull Weld Inspection, DTRC-SME-90/30, which is available only by request to the Commander, Naval Seas Systems Command (SEA 05M2).
PNNL thanks Mr. John Keve and Mr. Nick Furth, the AREVA Federal Services ASNT Level III and Level II inspectors, for conducting radiographic analyses on some of the pipe specimens.
At PNNL, the authors would like to thank Dr. Pradeep Ramuhalli for his technical contribution early in this project. The authors wish to thank Michael Larche for figure development in SolidWorks and Photoshop. Finally, the authors would like to express their gratitude to Kay Hass for preparing the manuscript, technical editing, and attention to detail in the production of this report.

xxiii
ACRONYMS AND ABBREVIATIONS
ASME Code ASME Boiler and Pressure Vessel Code ASME American Society of Mechanical Engineers CR computed radiography dB decibel FS far-side FSH full screen height ID inner/inside diameter ISI inservice inspection LOF lack of fusion LOP lack of penetration NDE nondestructive examination NPP nuclear power plant NRC U.S. Nuclear Regulatory Commission NS near-side OD outer/outside diameter PA phased array PA-UT phased-array ultrasonic testing PNNL Pacific Northwest National Laboratory POD probability of detection POR porosity PSI pre-service inspection RMSE root-mean-square error RT radiographic testing RRA repair and replacement activities SLG slag SNR signal-to-noise ratio T wall thickness TRS transmit-receive dual shear-wave UT ultrasonic testing

1-1
1 INTRODUCTION
The U.S. Nuclear Regulatory Commission (NRC) Office of Nuclear Reactor Regulation (NRR) requested the Office of Nuclear Regulatory Research to evaluate the interchangeability of radiographic testing (RT) and ultrasonic testing (UT) for welds fabricated during repair and replacement activities. NRR intends to use the research results to support regulatory decisions associated with examinations required by the American Society of Mechanical Engineers (ASME) Boiler and Pressure Vessel Code (Code), Section XI, “Rules for Inservice Inspection of Nuclear Power Plant Components.” Specifically, NRR intends to use the findings of this research to evaluate licensees’ requests for relief from ASME Code requirements, and proposed changes to the ASME Code, as well as Code Cases.
While RT and UT are both volumetric nondestructive examination (NDE) methods, the physics of these processes are substantially different. Radiography relies on transmission and absorption/attenuation of small wavelength electromagnetic energy (x-rays and gamma rays). Ultrasonic testing, on the other hand, relies on the interaction of acoustic wave energy with flaws in the inspected material. Differences in density or acoustic impedance result in reflection or scattering of the wave, which is recorded as evidence of a discontinuity in the material. Though each method is capable of detecting the spectrum of flaws that may result from welding processes, the differences in the physics make each method sensitive to a particular flaw type—radiography is suited to detect volumetric flaws such as slag and porosity, while ultrasound is more suited to detect planar flaws such as cracks and lack-of-fusion.
Historically, in the nuclear industry, RT examinations have been performed for fabrication acceptance examinations, and UT examinations have been conducted to detect service-induced degradation, which is typically manifested as surface-connected cracking or corrosion. Per ASME Code, fabrication examinations target the entire volume of the weldment and adjacent base material, and are aimed at detecting fabrication-related flaws that may occur anywhere within the defined volume of interest. Conversely, inservice examinations typically only interrogate material volumes subject to service degradation, such as the inner one-third of piping welds, including the heat-affected zone and limited adjacent base material. Ultrasonic techniques for piping weld examinations have generally evolved to focus on finding inner diameter (ID) surface-connected cracks because this is where the preponderance of service degradation has occurred. As a result of these differences, as well as in consideration of the inherent strengths of each of the methods, the two methods are not traditionally believed to be interchangeable; rather, they are complementary. Further, the NRC questions whether the application of current ASME Code, Section XI, Appendix VIII, requirements for performance demonstration of ultrasonic methods being used for inservice inspection (ISI) are appropriate to be used for performance demonstration for UT of weld fabrication examinations.
This report presents a study conducted at Pacific Northwest National Laboratory (PNNL) to assess the capability and effectiveness of using ultrasonic examinations in lieu of radiography for detecting welding fabrication flaws in carbon steel piping. Section 2 of this report describes the project background and technical decisions that led to this study on carbon steel piping welds. Section 3 describes the carbon steel pipe and plate specimens, including details on sizes and flaw types, and range of sizes, for the varied flaws evaluated. The design, modeling,
1-2
and implementation of the phased-array probes used in this study can be found in Section 4. Section 5 provides a description of the x-ray equipment and procedures used on the carbon steel pipes and Navy plate specimens. Section 6 details the use of the phased-array system and specific methods employed for the evaluation of the carbon steel specimens in this study. Section 7 includes an assessment and comparison of the capabilities of UT and RT on fabrication flaws in carbon steel piping and plate welds. Section 8 provides a summary of the study, with conclusions and recommendations. Section 9 is a list of references.
2-1
2 BACKGROUND
2.1 Motivation for Study
In 2009–2010, the NRC Office of Research funded PNNL to conduct a literature survey and perform an analysis to assess the technical gaps related to replacing radiographic examination with ultrasonic examination for newly fabricated welds. The results of the gap analysis were documented in PNNL-19086, Replacement of Radiography with Ultrasonics for the Nondestructive Inspection of Welds – Evaluation of Technical Gaps – An Interim Report (Moran et al. 2010). This assessment revealed that in order to use UT in lieu of RT, as proposed in several ASME Code Cases under development, there are many outstanding issues that must be resolved including:
• Assessing the flaw types, locations, sizes, and numbers expected with currently used welding fabrication methods;
• Establishing an appropriate “fitness for purpose” acceptance criteria for fabrication/ construction weld inspections, and assessing the ability of the UT method to discriminate between different types of relevant fabrication flaws;
• Determining the appropriate technique(s) to be specified (such as spatial encoding) within the UT method to be applied;
• Defining minimum performance demonstration requirements for construction/fabrication inspection in light of the fact that the inspection volumes and expected flaw types are very different than those related to ISI; and
• Addressing gaps in the ASME Code and providing a technical basis for making recommendations for improvements.
Following the gap analysis, the NRC funded a program entitled “Effectiveness and Reliability of UT and RT for NDE” at PNNL to begin to address the outstanding issues identified above. As work progressed on this program, the specific issues that would need to be resolved in order for the NRC to generically accept UT in lieu of RT for welds fabricated during repair and replacement activities began to come into focus. To provide clarification and communicate these issues, the NRC staff created a list of concerns and presented it to industry to illustrate that, although UT is used successfully for Code-required examinations via ISI, the use of UT in a repair/replacement scenario was not a matter of simply changing a few aspects of current inservice inspection UT procedures. The following are the NRC’s considerations for assessing UT for use in lieu of RT (not necessarily in order of relevance or priority):
• The NRC acknowledges that UT has great potential to be used in lieu of RT for repair and replacement activities. The benefits of reduced inspection time and occupational exposure are significant. However, history has shown that the combined use of RT for weld fabrication examinations followed by the use of UT for pre-service inspections (PSI) and ISI ensures that workmanship is maintained (with RT) while potentially critical, planar fabrication flaws are not put into service (with UT). Until studies are completed that demonstrate the ability of UT to replace RT for RRA, the NRC is not inclined to generically allow the substitution of UT in lieu of RT for weld fabrication examinations.
2-2
• Acceptance criteria: Acceptance criteria must be defined for ultrasonic examinations performed during repair/replacement activities. If Section III acceptance criteria are applied, the ability to characterize flaws as planar or volumetric is required. In contrast, applying Section XI acceptance criteria alone may result in accepting welds with poor workmanship.
• Performance demonstration requirements: What are the requirements for performance demonstration for UT equipment, procedures, and personnel used for examinations for repair/replace activities? Some issues to be addressed are: what are the required flaws/mock-ups and what are the acceptance criteria for length and depth sizing of fabrication flaws?
• Materials applicability: Round-robin studies comparing RT and UT performance with a view to replacing RT with UT are relatively scarce. Most studies took place in the 1980s and early 1990s using manual ultrasonics and film radiography. NPP materials, joint designs, welding methods, and expected flaw types are not typically represented by these studies. Thus, assessments must be conducted of UT in lieu of RT for NPP materials, using today’s UT and RT methods, with a focus on understanding UT applicability in the presence of high levels of acoustic noise such as that found in austenitic materials.
• Component applicability: Once a fundamental understanding of UT in lieu of RT is obtained via a study with limited scope (piping only), an assessment of the extent of applicability to components with complex geometries or other limitations is needed.
• Examination volume for fabrication: The repair/replacement examination volume is the full volume of the weld plus adjacent base material including the heat-affected zone. The ISI examination volume is the lower 1/3T plus ¼-in. on either side of weld toe for similar and dissimilar metal welds in piping (from ASME Section XI, Figure IWB-2500-8) (ASME 2008). Thus, issues such as whether weld crown removal is necessary and what wave modalities are required (or allowed) must be addressed to enable full-volume weld examinations. Scaling up qualified ISI examination procedures may work, but this must be demonstrated.
• Equipment requirements: Beyond the use of UT methods that encode position and amplitude, are there other minimum equipment requirements that must be identified/defined such as the use of pulse-echo/phased-array/pitch-catch probes, angle of inspections and scan directions, acoustic frequencies employed and the use of first leg only, or first and second leg of sound propagation?
• Documentation requirements/record keeping: RT provides a permanent record of the inspection in the form of the radiograph. What is required for UT (e.g., format, content, etc.)?
• Detection reliability: There is a need to establish that UT can reliably detect and characterize fabrication flaws. Ultrasonic examination at NPPs is used for PSI and ISI, and the method is well-suited to detecting and sizing service-induced type flaws (surface-connected). Fabrication examinations are aimed at finding surface and sub-surface flaws that result from the welding process. Additionally, the fabrication acceptance criteria require the discrimination of planar vs. volumetric flaws. Does UT provide an adequate ability to discriminate between planar and volumetric flaws?
2-3
• Sizing reliability: How do UT and RT compare in their ability to length-size flaws? Does UT oversize fabrication flaws? It is noted that UT has an advantage as depth-sizing and through-wall locations of flaws are readily determined with UT.
As illustrated by the list above, there are several issues that the NRC staff considers important to address before generically accepting the use of UT in lieu of RT for repair and replacement activities. When the NRC developed the program, the original plan was to look broadly at these issues as they applied to a variety of NPP piping materials (carbon steel, stainless steel, and dissimilar metal piping welds), welding methods, and sizes (diameters and thicknesses). It quickly became apparent that this broad range of applicability combined with the many issues that needed to be resolved (the listed items) were beyond the scope of what could be accomplished in this initial program. Additionally, feedback from industry suggested that, although there is broad desire to use UT in lieu of RT for all NPP welds, the majority of upcoming plant RRA would be conducted on carbon steel piping systems. As a result, a decision was made to focus the work on carbon steel piping welds.
Further confirming that this was the correct path for the PNNL project was that in the same timeframe, the ASME Code Task Group on Alternate NDE for Repair Replacement Activities (TG Alt NDE for RRA) made the decision to stop working on Revision 1 to Code Case N-713, “Ultrasonic Examination in Lieu of Radiography,” which applied generically to any material, and start work on a new, ferritic-only Code Case, N-831, “Ultrasonic Examination in Lieu of Radiography for Welds in Ferritic Pipe.” The TG Alt NDE for RRA members recognized that a Code Case focused on carbon steel would be more likely to gain NRC support while addressing the majority of repair/replace activities that licensees were implementing at NPPs.
Once the scope of the program was limited to carbon steel welds only, the NRC and PNNL wanted to ensure that a broad range of thicknesses of carbon steel welds representing the range of thicknesses found in NPPs were evaluated. Unfortunately, thick-section carbon steel mock-ups with implanted flaws were not readily available. However, several Navy “UT/RT” plates were still available. These plates were studied by the Navy in the late 1980s when the Navy evaluated UT in lieu of RT for submarine hull weld inspection. The Navy round robin compared the results of standard practice manual UT to radiography using three types of radiation sources and two types of film on 36 test plates (18 welded for the study and 18 cut from a decommissioned submarine). During the study, the Navy identified 212 “consensus” flaws in the plates and used the most sensitive technique that detected each of the flaws to classify them by type. Sectioning and metallography were performed on several of the plates to confirm whether the Navy’s classification protocol was accurate. Though the Navy work was conducted over two decades ago, several of the UT/RT test plates still existed, and three were made available by the Navy. The goals for including these three test plates in the PNNL study were to determine whether UT technology and examination techniques currently used in the nuclear industry would support the Navy’s conclusion that UT is a good alternative to RT for weld inspection (for thick-section carbon steel welds), and to expand the weld thickness range being evaluated under this program.

2-4
2.2 Summary of Previous Work – Worldwide
The topic of replacing radiography with ultrasonic evaluations has received significant attention in the past. This section highlights and summarizes information obtained from open literature reviews pursuant to this issue. Detailed information can be found in Moran et al. (2010).
The review identified four key factors, including detection capabilities, false call rate, costs, and procedural aspects. Detection capabilities are generally described with probability of detection (POD) curves, often determined through round-robin exercises. As described in Moran 2010, several round robin exercises (Forli 1979; Forli and Hansen 1982; Forli and Pettersen 1985; DeNale and Lebowitz 1989, 1990; Forli 1990),1 or similar studies (Ford and Hudgell 1987; Brast et al. 1998; Erhard and Ewert 1999; Neundorf et al. 2000; Neundorf et al. 2002; Light 2004; Spanner 2005), carried out in the past 30 years indicate that UT is superior to RT for planar flaws; however, the evidence appears to show that RT is comparable or superior to UT for volumetric flaws. These results are strongly dependent on the particular UT techniques applied. Overall costs and procedural aspects appear to be comparable for both UT and RT. Sizing capability (closely linked to false call rates) has not been studied as extensively as detection, but the two techniques appear to be similar for flaw length sizing, while UT has an advantage for flaw (through-wall) depth sizing.
Several ASME Code Cases have been developed that address the use of UT in lieu of RT for weld inspection. All require the application of spatially-encoded ultrasonic systems, formal demonstration of performance prior to field use, and specific flaw acceptance criteria. Several of the ASME Code Cases make use of fracture mechanics to supplant workmanship standards with probabilistic risk-based standards. There has been some case-by-case user experience with the Code Cases, but no reliability data has been provided.
Relevant conclusions from previous work include the following:
• POD comparisons are strongly dependent on the flaw type and orientation, and on evaluation criteria.
• RT is more sensitive to crack planes parallel to the RT beam, while UT is more sensitive to planes perpendicular to the UT beam direction.
• UT is affected adversely by coarse-grained microstructures, material anisotropy, surface conditions, and other factors associated with acoustic scattering and attenuation.
• Both RT and UT show reductions in sensitivity for misoriented cracks and for flaws smaller than 1 mm.
• Encoded UT is vastly superior to non-encoded UT in terms of visualization and analysis of images, recordkeeping, and overall POD.
1 DeNale R and C Lebowitz. 1990. Ultrasonics as an Alternative to Radiography for Submarine Hull Weld Inspection. DTRC-SME-90/30, Office of the Assistant Secretary of the Navy, Naval Sea System Command, David Taylor Research Center, Bethesda, Maryland. Available only by request to the Commander, Naval Seas Systems Command (SEA 05M2).
2-5
Some additional considerations:
• New welding methods have reduced the incidence of flaws.
• High-sensitivity encoded UT examinations (such as phased-array UT) may be more expensive than non-encoded conventional UT, but should reduce risk and down-time later in the operating lifetime of the plant, as recorded data images of examination weld volumes provide valuable baseline information used to characterize reflections detected during subsequent examinations.
• UT performance demonstration methods have been developed primarily for examinations aimed at detecting service-induced degradation. These methods will likely need to be modified for volumetric fabrication examinations as fabrication flaw types are significantly different than those resulting from service-induced degradation.
2.3 Overview of Applicable Weld Inspection Codes
Title 10 of the Code of Federal Regulations (CFR) Part 50.55a(b) requires that licensees of operating U.S. nuclear power plants apply ASME Code Section III, Rules for Construction of Nuclear Facility Components, and Section XI, Rules for In-service Inspection of Nuclear Power Plant Components. The use of NDE methods for welded components is specified by ASME Code, Sections III and XI. In order for a defense-in-depth approach to be successful and to facilitate timely corrective actions, NDE must reliably detect and accurately characterize degradation that may occur before it reaches a size that could challenge the structural integrity of components (Doctor 2007).
ASME Code, Section III (Division 1, Articles NB/NC/ND) defines the volumetric examination methods to be applied for fabrication/construction of welds in nuclear components. Specific NDE techniques found acceptable for use are described in ASME Code, Section V (Article 2 for Radiographic Examination and Article 4 for Ultrasonic Examination). PSI and ISI are defined in ASME Code, Section XI. Where volumetric examination methods (UT or RT) are specified, the examinations are required to be performed in accordance with Section V, Article 2 for RT or Section XI, Appendix I for UT.
As one would expect, acceptance criteria for fabrication/construction, and PSI/ISI, are also defined in the relevant ASME Code sections (Section III for fabrication and Section XI for PSI and ISI). Acceptance of fabrication flaws is based on welding workmanship standards and not on fitness-for-service, with flaw type and length being the primary variables used for accept/reject criteria. The through-wall size or though-wall location of the flaw does not factor into these acceptance criteria (Doctor 2007). Traditionally, RT has been used versus UT for weld fabrication examinations. In contrast, criteria for accepting flaws discovered during PSI and ISI are based on fitness-for-service structural considerations founded upon fracture mechanics evaluations. UT is the preferred choice for volumetric NDE during PSI/ISI.
Several other industry codes on nondestructive examination of welds are available. In the United States, examples include NAVSEA T9074-AS-GIB-010/271 (CHG NOTICE 1) and MIL-STD-2035A.
2-6
2.4 Fundamental Differences Between UT and RT
The objective of weld inspection is to detect construction/fabrication flaws, or service-induced degradation, that may impact the structural integrity of the welded component. Because UT and RT are the primary volumetric methods employed to inspect welds, an understanding of the underlying physics associated with these types of inspections is important for comparing the capabilities and limitations of each method.
RT relies on transmission and absorption/attenuation of short-wavelength, high-energy electromagnetic waves through the component under examination to essentially provide a direct, two-dimensional image of the component on a detector. UT uses high-frequency vibrational (acoustic) waves to transmit energy through a material and relies on reflection of these waves from internal structures (flaws, geometry, metallurgical interfaces) to provide indirect indications of potential defects. These important differences between RT and UT will either help or hinder the detection of specific types of anomalies.
One type of weld anomaly occurs when gas is caught within the weld as it solidifies. These small gas pockets are typically known as porosity, and may discretely occur throughout the weld or can be clustered together in close proximity. Electromagnetic radiation in the RT process passes directly through the welded material and is affected by density variations in the weld. The porosity is much less dense than the surrounding material; therefore, less attenuated, higher levels of radiation will be received by the detector (film, phosphor plate, etc.). This will result in the porosity being shown as a darkened shape on the image. The actual shape of the porosity has very little effect, if any, on whether it can be detected with RT. This type of anomaly is considered volumetric in that there is a three-dimensional quality, or volume, associated with the gas pocket. Inclusions are another type of volumetric indication where instead of being entrapped gas, they may contain foreign materials such as tungsten, or slag (flux) from the welding process. These types of indications tend to have shapes that include volumes with large density variations in contrast to the surrounding material; thus, they are readily imaged using the RT process. In contrast, ultrasonic examination is dependent on the reflection of acoustic waves from abrupt interfacial changes within material structures directly related to mismatches in acoustic impedance. While planar interfaces (such as cracks) may adequately reflect sufficient UT energy, rounded or volumetric indications tend to scatter the acoustic wave, causing a decrease in acoustic energy returning to the detector. This acoustic scattering can potentially de-sensitize UT for reliable detection and sizing of volumetric flaws.
Sound waves that reflect directly back into a receiving transducer, such as from correctly oriented planar flaws, carry important information that can be used to characterize the flaw type and its location. Cracks and lack of fusion (LOF) are considered planar-type flaws as there is very little open space between the crack faces or fusion surfaces, essentially producing two-dimensional planes. When these planar flaws are oriented properly (perpendicular to the acoustic wave propagation) as is normally the case within the fusion zones of welds, much of the sound energy is reflected back to the source, making the flaws easily detectable. Because of the lack of density difference at a planar flaw, RT is not well suited for detecting cracks unless they are oriented parallel with the penetrating radiation, which is rarely the orientation of cracks in welds. Therefore, based on the fundamental physics of these two inspection methods, RT
2-7
and UT have historically been considered to be complementary for detecting fabrication flaws typically found in welds; that is, RT is well suited for detecting volumetric flaws while UT is better for detecting planar flaws.
In the fabrication of a weld during construction, or when a repair/replacement activity is performed during service, varied types of weld anomalies will occur depending on the welding parameters applied. These anomalies are different from service-induced degradation that may occur in a welded component undergoing operating stresses or environmental exposures. Flaws resulting from operating plant stresses and/or environmental conditions that occur inservice are typically manifested as cracking or corrosion. As U.S. nuclear power plants continue to mature, the most prevalent forms of degradation experienced have been thermal and mechanical fatigue cracks, or stress corrosion cracks, although limited instances of material loss from pitting and flow-accelerated corrosion have also been experienced. Over the course of plant operation, UT has emerged as the preferred volumetric NDE method for inservice examinations because of the heightened sensitivity to crack detection, as well as economic and other factors.
As previously noted, ASME Code, Section XI provides requirements for PSI and ISI. Additionally, Section XI provides requirements for component repair and replacement activities during the operating life of the plant, and invokes the original construction Code; for example, ASME Section III, for fabrication acceptance for these activities. Therefore, RRA that involve welding typically prescribe radiography as the examination method because of the workmanship acceptance criteria described in the construction codes. The physics of crack detection are also relevant to fabrication flaw acceptance, as cracks have been shown to be highly detrimental to component structural integrity, notwithstanding that cracking is not prevalent when applying good welding techniques. During RT, a crack is only detectable if it is of sufficient opening width and aligned with the direction of the radiation beam. If oriented otherwise, the decrease in density can be spread out (projected) over an area wider than the actual crack opening width, and the level of contrast imaging (i.e., the signal-to-noise ratio; SNR) is significantly diminished. Because of the noise inherent to radiography of structural materials, a small misalignment angle can cause a significant decrease in projected density to a level below the inherent material noise, thus resulting in a loss of image contrast, making the crack undetectable. However, if weld cracking during fabrication were to occur, it is typically manifested as a surface effect, and can usually be detected by applying the appropriate surface examination method (e.g., liquid penetrant, magnetic particle, or eddy current). Most fabrication codes mandate these surface examinations in addition to the volumetric methods required.
Because UT has been shown to have good capabilities for crack detection, using this method for weld fabrication acceptance should be viable for these types of flaws. However, UT has yet to be shown to be equivalent to RT for detection and characterization of other planar and volumetric welding anomalies. Recent ASME Code Cases have been developed to extend the use of UT for repair and replacement activities and are undergoing review. In this regard, this report is intended to provide the NRC with information regarding the application of UT in lieu of RT for carbon steel piping welds.
2-8
2.5 Conventional UT versus Phased-Array UT
In performing laboratory activities to assess capabilities and limitations for detecting flaws in carbon steel welds, PNNL elected to use phased-array UT (PA-UT) instead of conventional, or traditional, UT methods. There were several factors that influenced this decision, including enhanced phased-array (PA) image analysis techniques, increased speed of data acquisition, and fundamental physical differences that allow advanced PA technology to out-perform conventional applications of UT. These differences will be described further below. However, at the onset of this work, it was known that PA-UT had been used at several facilities to examine welds in non-class carbon steel piping system replacements, so assessing the application of PA-UT was a logical choice needed to validate industry applications of UT in lieu of RT.
Recent advances in electronics miniaturization, computer processing capabilities, and fabrication methods for ultrasonic transducers have enabled PA-UT technology to become a viable approach for many field applications. The geometrical design of a PA transducer is typically a function of specific implementation variables; that is, geometries such as linear, annular, circular, or matrix-array designs are developed to address a particular ultrasonic application need (Poguet et al. 2001). However, the basic premise for all PA transducers involves a set of small, individual piezoelectric elements that are independently driven. Although these elements may be pulsed individually, or in groups, to simulate conventional transducer excitation, the real strength of this technique lies in the capability of the system to electronically delay each of these elements during both generation and reception of ultrasonic sound fields. The wavefronts produced by subsets of elements interfere within the inspected component to produce a resultant, phase-integrated ultrasonic wave. This is commonly referred to as beam forming. The PA system can, therefore, steer and focus the integrated ultrasonic beam within the component. Single-element (conventional) UT typically emits a beam in a fixed direction and is limited to only one angle of examination for a given scanning sequence.
New PA ultrasonic systems are computer-controlled, enabling software to define the groups and sequences of elements being electronically delayed. Parameters such as the number of individual elements in a virtual element, the delay sequence for firing (voltage excitation) of the virtual elements, element amplitudes, and the delays in reception are programmed into the system operating software. The setting of these generation and reception parameters for a particular response is called a focal law. Because practically all aspects of the sound beam are being controlled electronically, many iterations, or sequences of iterations, can be run in nearly real time. This allows a single array to examine a volume of material with variable inspection angles and focusing depths almost simultaneously. For instance, depending on the array design and the component thickness, a one-dimensional linear array, with major axis oriented normal to a pipe weld, may interrogate close to an entire planar cross section of the weld by sweeping through a series of inspection angles without having to mechanically move the transducer toward and away from the weld. Theoretically, an entire pipe weld can then be examined with a single circumferential scan motion called a line scan. Most PA systems capture, digitize, and store the ultrasonic data, which enhances repeatability and permits off-line analysis and imaging.
3-1
3 LABORATORY SPECIMENS AND FLAWS
This report addresses work at PNNL to assess the interchangeability of UT and RT on carbon steel piping and plate welds. Laboratory specimens employed in this study are described below in Sections 3.1 and 3.2 for the carbon steel pipe weld specimens and the Navy plate weld specimens, respectively.
3.1 Carbon Steel Pipe Specimens and Flaws
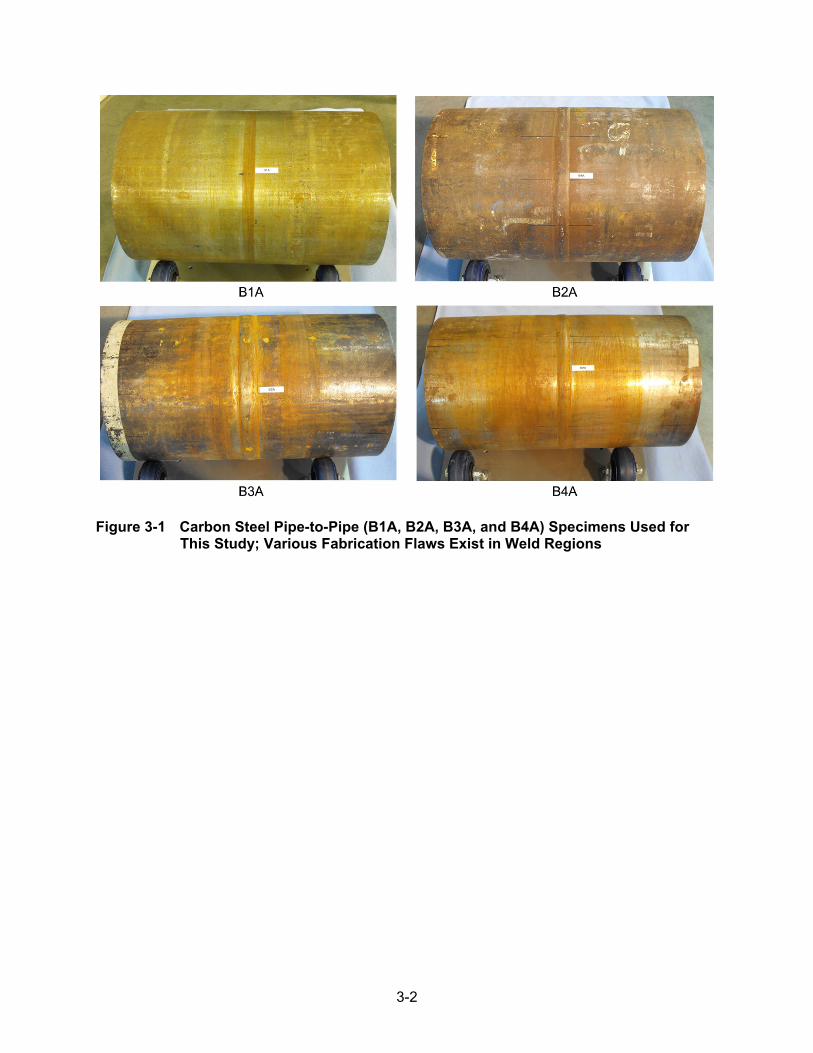
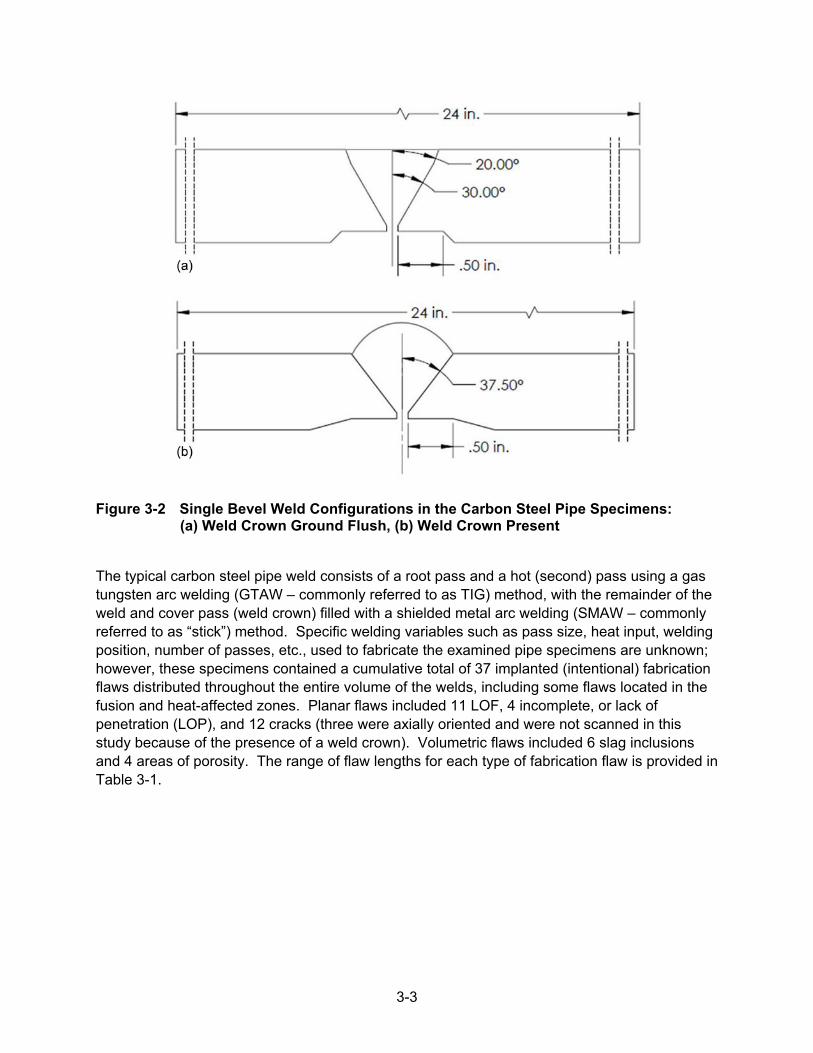
Four carbon steel pipe-to-pipe, full penetration butt-welded specimens, three representing ASME Code, Section III, Class 2 piping welds and one representing ASME Code, B31.1 (Pressure Piping) welds, were obtained from various nuclear inspection vendors. These piping weld mock-ups had been fabricated by the inspection vendors in order to assess their PA-UT procedures and provide limited demonstrations of capability for their clients. There were two 355.6-mm (14.0-in.) outside diameter (OD) welded pipe specimens that were approximately 610 mm (24 in.) in length. One of the specimens was Schedule 80 with a nominal thickness of 19.05 mm (0.75 in.) and the other was Schedule 120 having a 27.8-mm (1.094-in.) nominal thickness. The other two butt-welded specimens were 406.4-mm (16.0-in.) OD carbon steel piping, also approximately 610 mm (24 in.) in length. One of these was Schedule 80 pipe with a nominal thickness of 21.4 mm (0.844 in.), with the other specimen being Schedule 100 pipe having a 26.2-mm (1.031-in.) nominal thickness. All four carbon steel piping weld mock-up specimens are shown in Figure 3-1. All of the specimens contain a single bevel weld, one with 20-degree and 30-degree bevel angles with the weld crown ground flush, and three with a 37.5-degree bevel angle with the weld crown present [see Figure 3-2(a) and (b) for conceptual drawings].
3-2
Figure 3-1 Carbon Steel Pipe-to-Pipe (B1A, B2A, B3A, and B4A) Specimens Used for This Study; Various Fabrication Flaws Exist in Weld Regions
3-3
Figure 3-2 Single Bevel Weld Configurations in the Carbon Steel Pipe Specimens: (a) Weld Crown Ground Flush, (b) Weld Crown Present
The typical carbon steel pipe weld consists of a root pass and a hot (second) pass using a gas tungsten arc welding (GTAW – commonly referred to as TIG) method, with the remainder of the weld and cover pass (weld crown) filled with a shielded metal arc welding (SMAW – commonly referred to as “stick”) method. Specific welding variables such as pass size, heat input, welding position, number of passes, etc., used to fabricate the examined pipe specimens are unknown; however, these specimens contained a cumulative total of 37 implanted (intentional) fabrication flaws distributed throughout the entire volume of the welds, including some flaws located in the fusion and heat-affected zones. Planar flaws included 11 LOF, 4 incomplete, or lack of penetration (LOP), and 12 cracks (three were axially oriented and were not scanned in this study because of the presence of a weld crown). Volumetric flaws included 6 slag inclusions and 4 areas of porosity. The range of flaw lengths for each type of fabrication flaw is provided in Table 3-1.
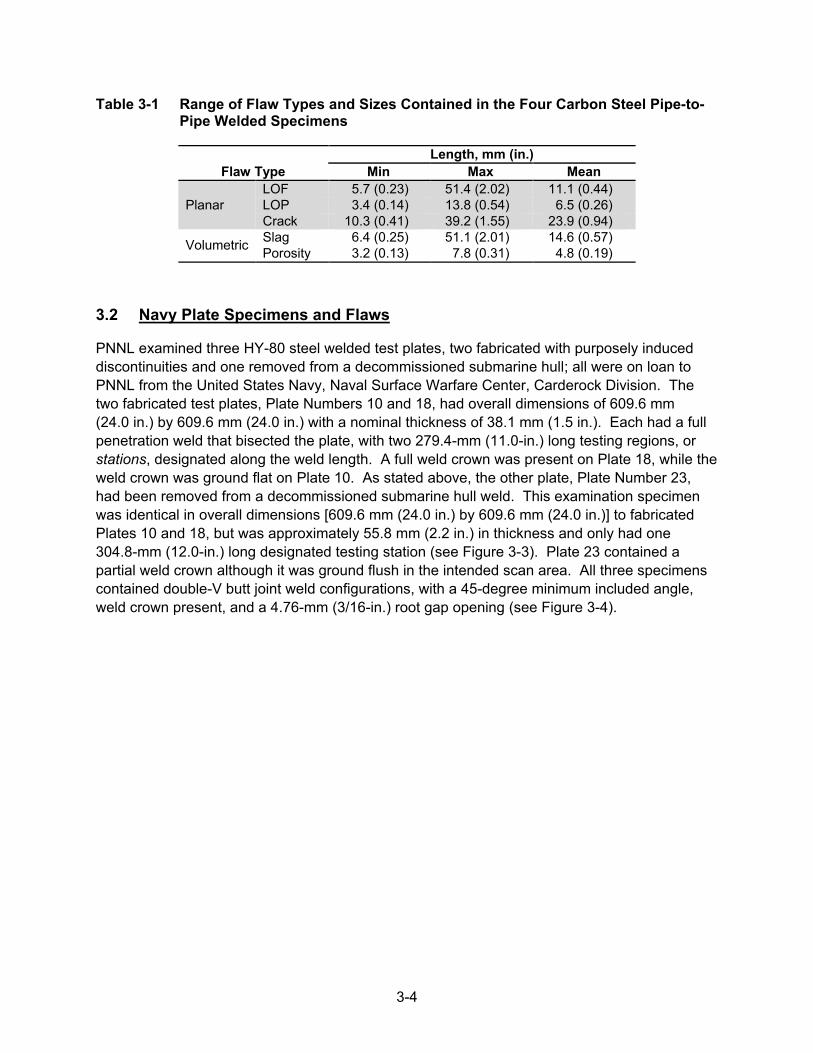
3-4
Table 3-1 Range of Flaw Types and Sizes Contained in the Four Carbon Steel Pipe-to-Pipe Welded Specimens
Flaw Type Length, mm (in.)
Min Max Mean
Planar LOF 5.7 (0.23) 51.4 (2.02) 11.1 (0.44) LOP 3.4 (0.14) 13.8 (0.54) 6.5 (0.26) Crack 10.3 (0.41) 39.2 (1.55) 23.9 (0.94)
Volumetric Slag 6.4 (0.25) 51.1 (2.01) 14.6 (0.57) Porosity 3.2 (0.13) 7.8 (0.31) 4.8 (0.19)
3.2 Navy Plate Specimens and Flaws
PNNL examined three HY-80 steel welded test plates, two fabricated with purposely induced discontinuities and one removed from a decommissioned submarine hull; all were on loan to PNNL from the United States Navy, Naval Surface Warfare Center, Carderock Division. The two fabricated test plates, Plate Numbers 10 and 18, had overall dimensions of 609.6 mm (24.0 in.) by 609.6 mm (24.0 in.) with a nominal thickness of 38.1 mm (1.5 in.). Each had a full penetration weld that bisected the plate, with two 279.4-mm (11.0-in.) long testing regions, or stations, designated along the weld length. A full weld crown was present on Plate 18, while the weld crown was ground flat on Plate 10. As stated above, the other plate, Plate Number 23, had been removed from a decommissioned submarine hull weld. This examination specimen was identical in overall dimensions [609.6 mm (24.0 in.) by 609.6 mm (24.0 in.)] to fabricated Plates 10 and 18, but was approximately 55.8 mm (2.2 in.) in thickness and only had one 304.8-mm (12.0-in.) long designated testing station (see Figure 3-3). Plate 23 contained a partial weld crown although it was ground flush in the intended scan area. All three specimens contained double-V butt joint weld configurations, with a 45-degree minimum included angle, weld crown present, and a 4.76-mm (3/16-in.) root gap opening (see Figure 3-4).
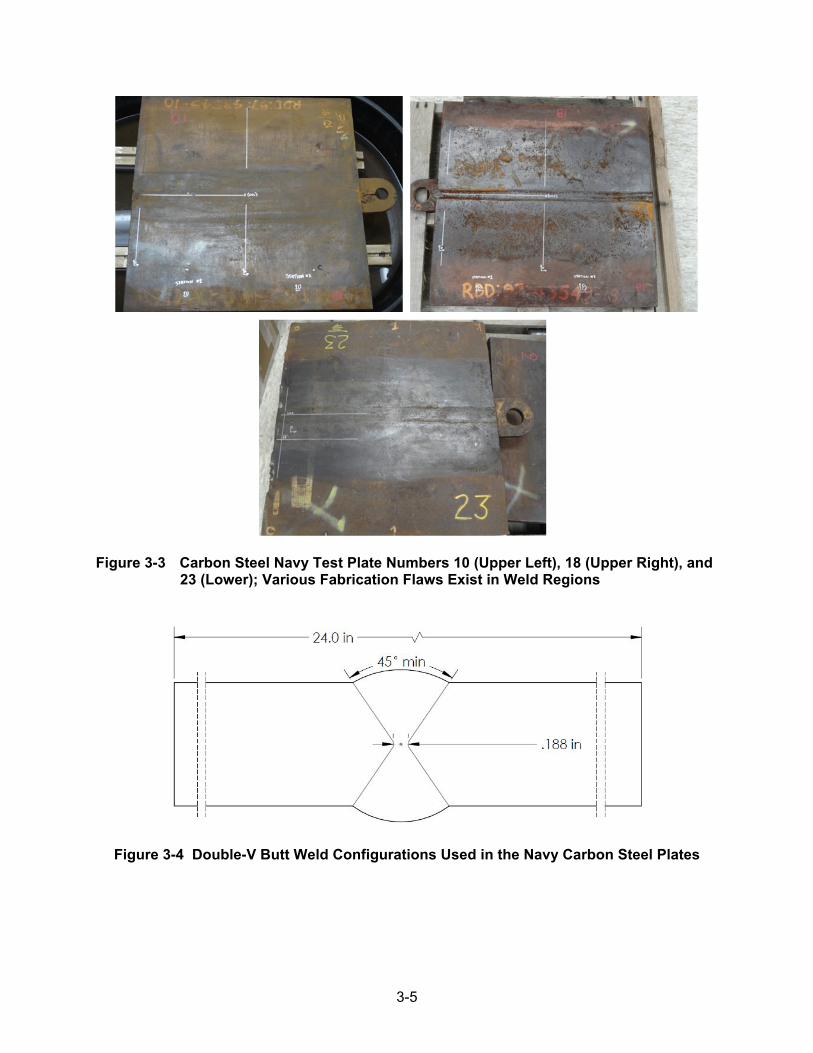
3-5
Figure 3-3 Carbon Steel Navy Test Plate Numbers 10 (Upper Left), 18 (Upper Right), and 23 (Lower); Various Fabrication Flaws Exist in Weld Regions
Figure 3-4 Double-V Butt Weld Configurations Used in the Navy Carbon Steel Plates
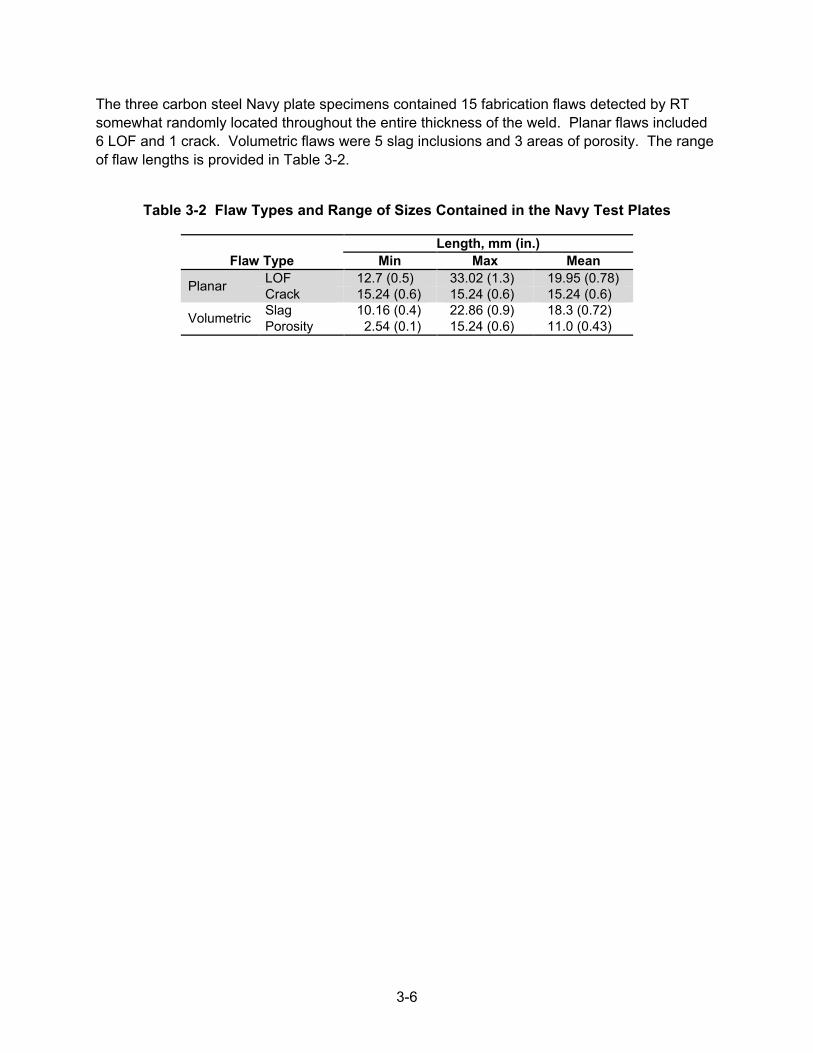
3-6
The three carbon steel Navy plate specimens contained 15 fabrication flaws detected by RT somewhat randomly located throughout the entire thickness of the weld. Planar flaws included 6 LOF and 1 crack. Volumetric flaws were 5 slag inclusions and 3 areas of porosity. The range of flaw lengths is provided in Table 3-2.
Table 3-2 Flaw Types and Range of Sizes Contained in the Navy Test Plates
Flaw Type Length, mm (in.)
Min Max Mean
Planar LOF 12.7 (0.5) 33.02 (1.3) 19.95 (0.78) Crack 15.24 (0.6) 15.24 (0.6) 15.24 (0.6)
Volumetric Slag 10.16 (0.4) 22.86 (0.9) 18.3 (0.72) Porosity 2.54 (0.1) 15.24 (0.6) 11.0 (0.43)
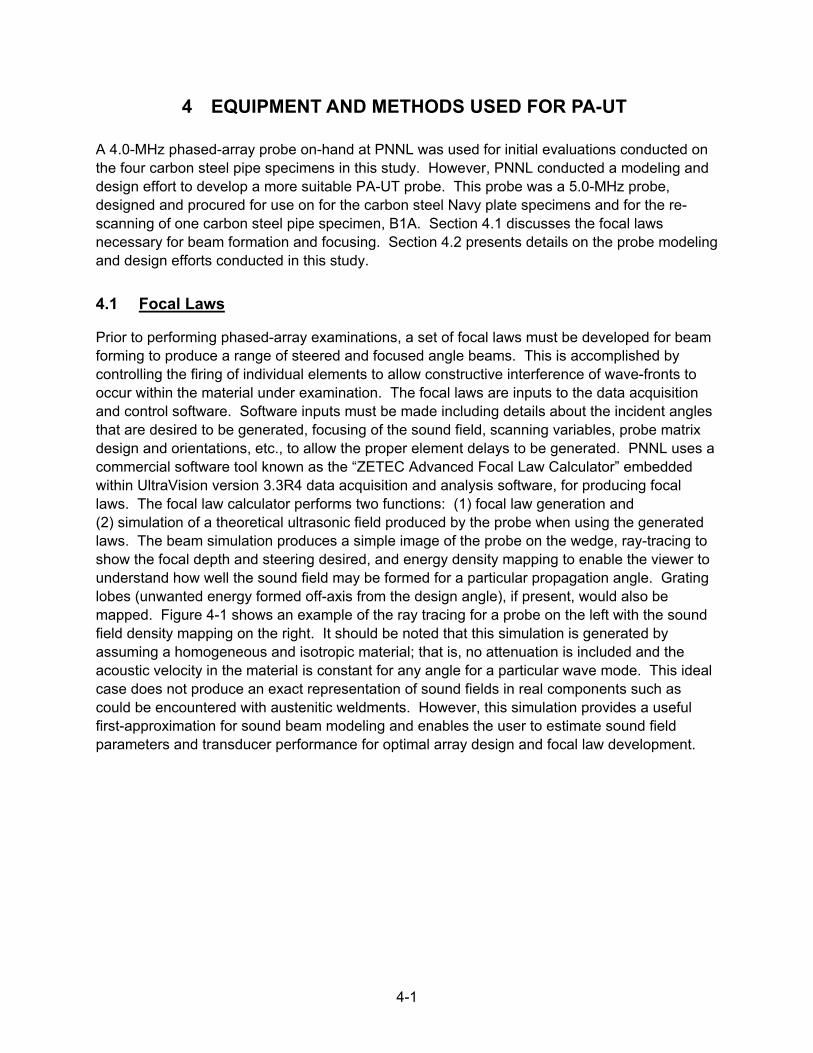
4-1
4 EQUIPMENT AND METHODS USED FOR PA-UT
A 4.0-MHz phased-array probe on-hand at PNNL was used for initial evaluations conducted on the four carbon steel pipe specimens in this study. However, PNNL conducted a modeling and design effort to develop a more suitable PA-UT probe. This probe was a 5.0-MHz probe, designed and procured for use on for the carbon steel Navy plate specimens and for the re-scanning of one carbon steel pipe specimen, B1A. Section 4.1 discusses the focal laws necessary for beam formation and focusing. Section 4.2 presents details on the probe modeling and design efforts conducted in this study.
4.1 Focal Laws
Prior to performing phased-array examinations, a set of focal laws must be developed for beam forming to produce a range of steered and focused angle beams. This is accomplished by controlling the firing of individual elements to allow constructive interference of wave-fronts to occur within the material under examination. The focal laws are inputs to the data acquisition and control software. Software inputs must be made including details about the incident angles that are desired to be generated, focusing of the sound field, scanning variables, probe matrix design and orientations, etc., to allow the proper element delays to be generated. PNNL uses a commercial software tool known as the “ZETEC Advanced Focal Law Calculator” embedded within UltraVision version 3.3R4 data acquisition and analysis software, for producing focal laws. The focal law calculator performs two functions: (1) focal law generation and (2) simulation of a theoretical ultrasonic field produced by the probe when using the generated laws. The beam simulation produces a simple image of the probe on the wedge, ray-tracing to show the focal depth and steering desired, and energy density mapping to enable the viewer to understand how well the sound field may be formed for a particular propagation angle. Grating lobes (unwanted energy formed off-axis from the design angle), if present, would also be mapped. Figure 4-1 shows an example of the ray tracing for a probe on the left with the sound field density mapping on the right. It should be noted that this simulation is generated by assuming a homogeneous and isotropic material; that is, no attenuation is included and the acoustic velocity in the material is constant for any angle for a particular wave mode. This ideal case does not produce an exact representation of sound fields in real components such as could be encountered with austenitic weldments. However, this simulation provides a useful first-approximation for sound beam modeling and enables the user to estimate sound field parameters and transducer performance for optimal array design and focal law development.
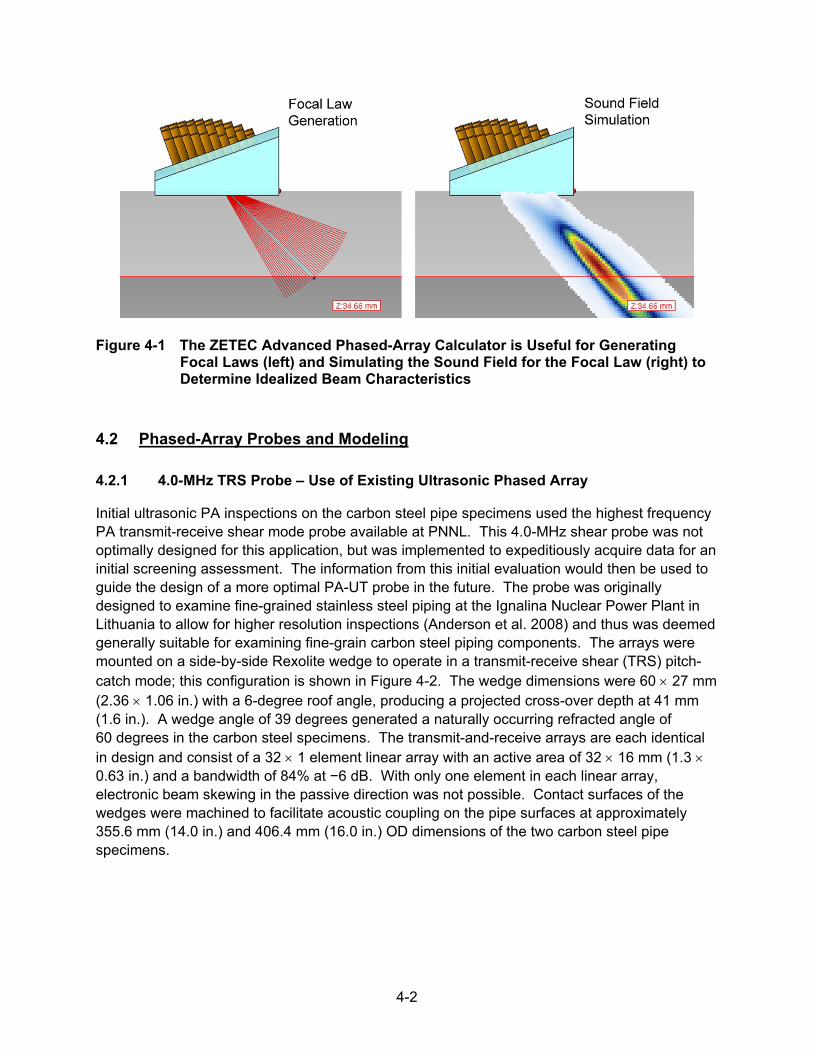
4-2
Figure 4-1 The ZETEC Advanced Phased-Array Calculator is Useful for Generating Focal Laws (left) and Simulating the Sound Field for the Focal Law (right) to Determine Idealized Beam Characteristics
4.2 Phased-Array Probes and Modeling
4.2.1 4.0-MHz TRS Probe – Use of Existing Ultrasonic Phased Array
Initial ultrasonic PA inspections on the carbon steel pipe specimens used the highest frequency PA transmit-receive shear mode probe available at PNNL. This 4.0-MHz shear probe was not optimally designed for this application, but was implemented to expeditiously acquire data for an initial screening assessment. The information from this initial evaluation would then be used to guide the design of a more optimal PA-UT probe in the future. The probe was originally designed to examine fine-grained stainless steel piping at the Ignalina Nuclear Power Plant in Lithuania to allow for higher resolution inspections (Anderson et al. 2008) and thus was deemed generally suitable for examining fine-grain carbon steel piping components. The arrays were mounted on a side-by-side Rexolite wedge to operate in a transmit-receive shear (TRS) pitch-catch mode; this configuration is shown in Figure 4-2. The wedge dimensions were 60 × 27 mm (2.36 × 1.06 in.) with a 6-degree roof angle, producing a projected cross-over depth at 41 mm (1.6 in.). A wedge angle of 39 degrees generated a naturally occurring refracted angle of 60 degrees in the carbon steel specimens. The transmit-and-receive arrays are each identical in design and consist of a 32 × 1 element linear array with an active area of 32 × 16 mm (1.3 × 0.63 in.) and a bandwidth of 84% at −6 dB. With only one element in each linear array, electronic beam skewing in the passive direction was not possible. Contact surfaces of the wedges were machined to facilitate acoustic coupling on the pipe surfaces at approximately 355.6 mm (14.0 in.) and 406.4 mm (16.0 in.) OD dimensions of the two carbon steel pipe specimens.

4-3
Figure 4-2 4.0-MHz TRS Phased-Array Probe
Subsequent modeling of the 4.0-MHz array was conducted using the UltraVision software suite in combination with a normalized Huygen’s Principle method for 2D acoustic pressure calculations (Wooh and Shi 1999). Representative carbon piping [~25.4 mm (1-in.) thick] and carbon plate [~50.8 mm (2-in.) thick] materials were chosen as the bases for the simulations using a shear mode velocity of 3230 m/s. The Huygen’s Principle calculation demonstrates the PA directivity capability of the probe to azimuthally steer angles in the component. When the array is designed with proper individual element sizes and matrix configurations for a particular material, a single peak with maximum acoustic pressure will be produced at the desired sweep angle. Additional peaks that are present near the primary lobe represent unwanted off-axis energy, known as grating lobes. These grating lobes provide an indication of inefficiencies for concentrating acoustic energy along the primary axis of the main lobe. If the grating lobes are significant, they detract from the ability of the probe to focus energy at the primary angle of insonification. They may also create noise in the data. Figure 4-3 graphically represents the acoustic pressure calculation when steered 15 degrees from the natural refracted angle of 60 degrees (as determined by the wedge angle) for the 4.0-MHz array. The figure therefore represents the acoustic pressure at a 75-degree refracted angle. The black arrow in the image points to the presence of an off-axis theoretical grating lobe generated for this array configuration.
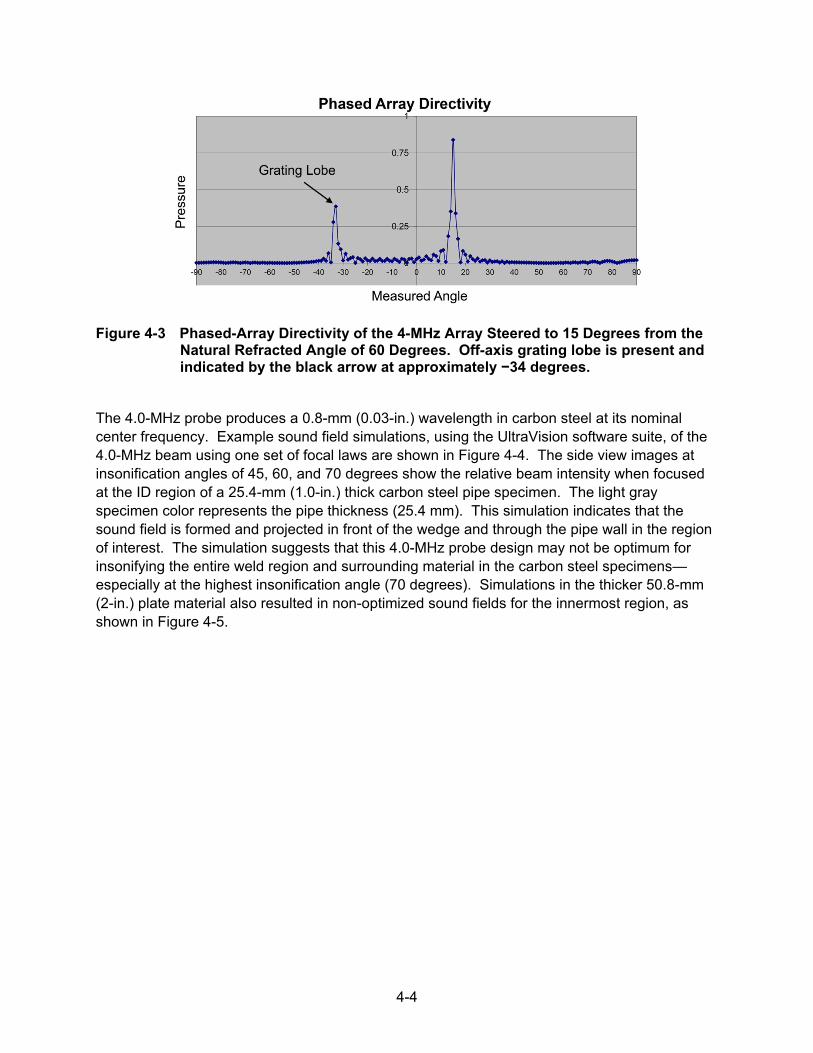
4-4
Figure 4-3 Phased-Array Directivity of the 4-MHz Array Steered to 15 Degrees from the Natural Refracted Angle of 60 Degrees. Off-axis grating lobe is present and indicated by the black arrow at approximately −34 degrees.
The 4.0-MHz probe produces a 0.8-mm (0.03-in.) wavelength in carbon steel at its nominal center frequency. Example sound field simulations, using the UltraVision software suite, of the 4.0-MHz beam using one set of focal laws are shown in Figure 4-4. The side view images at insonification angles of 45, 60, and 70 degrees show the relative beam intensity when focused at the ID region of a 25.4-mm (1.0-in.) thick carbon steel pipe specimen. The light gray specimen color represents the pipe thickness (25.4 mm). This simulation indicates that the sound field is formed and projected in front of the wedge and through the pipe wall in the region of interest. The simulation suggests that this 4.0-MHz probe design may not be optimum for insonifying the entire weld region and surrounding material in the carbon steel specimens—especially at the highest insonification angle (70 degrees). Simulations in the thicker 50.8-mm (2-in.) plate material also resulted in non-optimized sound fields for the innermost region, as shown in Figure 4-5.
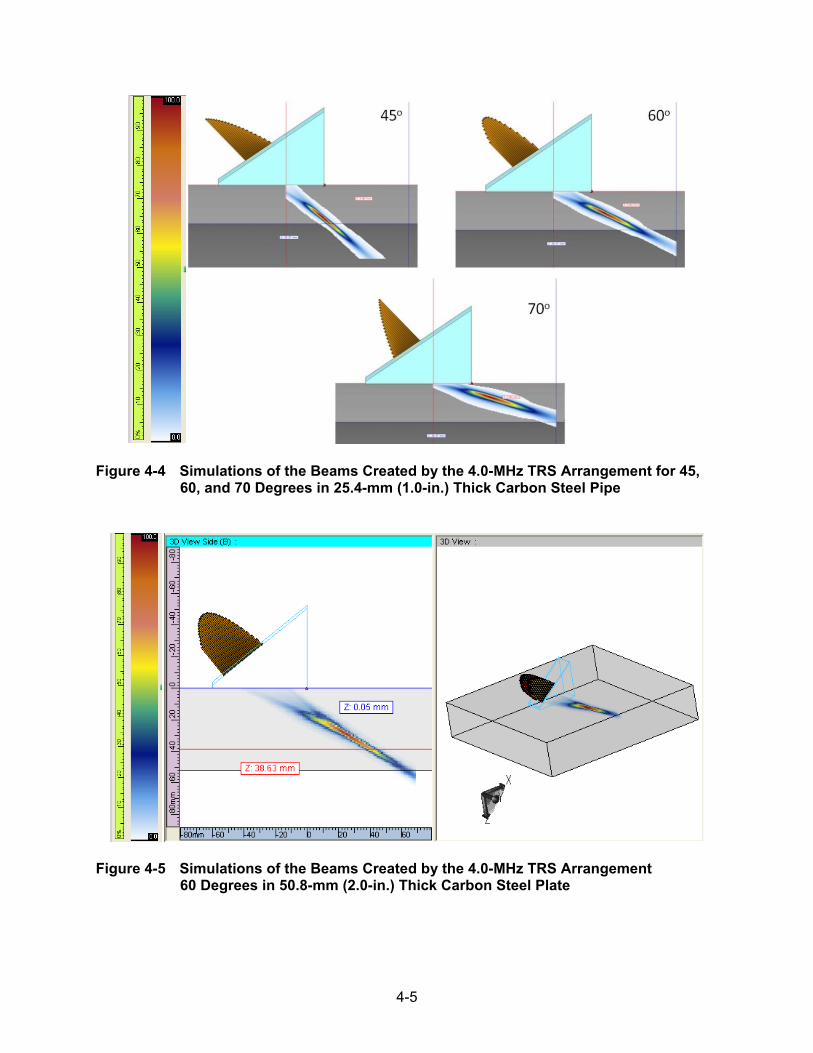
4-5
Figure 4-4 Simulations of the Beams Created by the 4.0-MHz TRS Arrangement for 45, 60, and 70 Degrees in 25.4-mm (1.0-in.) Thick Carbon Steel Pipe
Figure 4-5 Simulations of the Beams Created by the 4.0-MHz TRS Arrangement 60 Degrees in 50.8-mm (2.0-in.) Thick Carbon Steel Plate
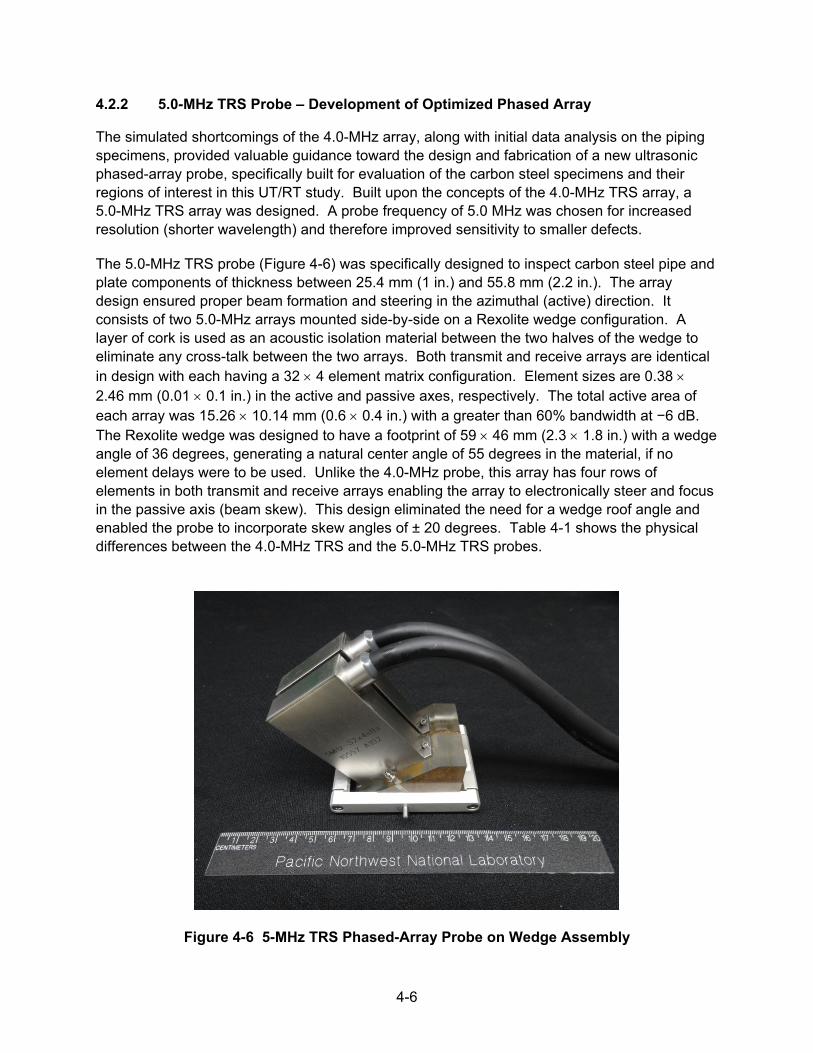
4-6
4.2.2 5.0-MHz TRS Probe – Development of Optimized Phased Array
The simulated shortcomings of the 4.0-MHz array, along with initial data analysis on the piping specimens, provided valuable guidance toward the design and fabrication of a new ultrasonic phased-array probe, specifically built for evaluation of the carbon steel specimens and their regions of interest in this UT/RT study. Built upon the concepts of the 4.0-MHz TRS array, a 5.0-MHz TRS array was designed. A probe frequency of 5.0 MHz was chosen for increased resolution (shorter wavelength) and therefore improved sensitivity to smaller defects.
The 5.0-MHz TRS probe (Figure 4-6) was specifically designed to inspect carbon steel pipe and plate components of thickness between 25.4 mm (1 in.) and 55.8 mm (2.2 in.). The array design ensured proper beam formation and steering in the azimuthal (active) direction. It consists of two 5.0-MHz arrays mounted side-by-side on a Rexolite wedge configuration. A layer of cork is used as an acoustic isolation material between the two halves of the wedge to eliminate any cross-talk between the two arrays. Both transmit and receive arrays are identical in design with each having a 32 × 4 element matrix configuration. Element sizes are 0.38 × 2.46 mm (0.01 × 0.1 in.) in the active and passive axes, respectively. The total active area of each array was 15.26 × 10.14 mm (0.6 × 0.4 in.) with a greater than 60% bandwidth at −6 dB. The Rexolite wedge was designed to have a footprint of 59 × 46 mm (2.3 × 1.8 in.) with a wedge angle of 36 degrees, generating a natural center angle of 55 degrees in the material, if no element delays were to be used. Unlike the 4.0-MHz probe, this array has four rows of elements in both transmit and receive arrays enabling the array to electronically steer and focus in the passive axis (beam skew). This design eliminated the need for a wedge roof angle and enabled the probe to incorporate skew angles of ± 20 degrees. Table 4-1 shows the physical differences between the 4.0-MHz TRS and the 5.0-MHz TRS probes.
Figure 4-6 5-MHz TRS Phased-Array Probe on Wedge Assembly
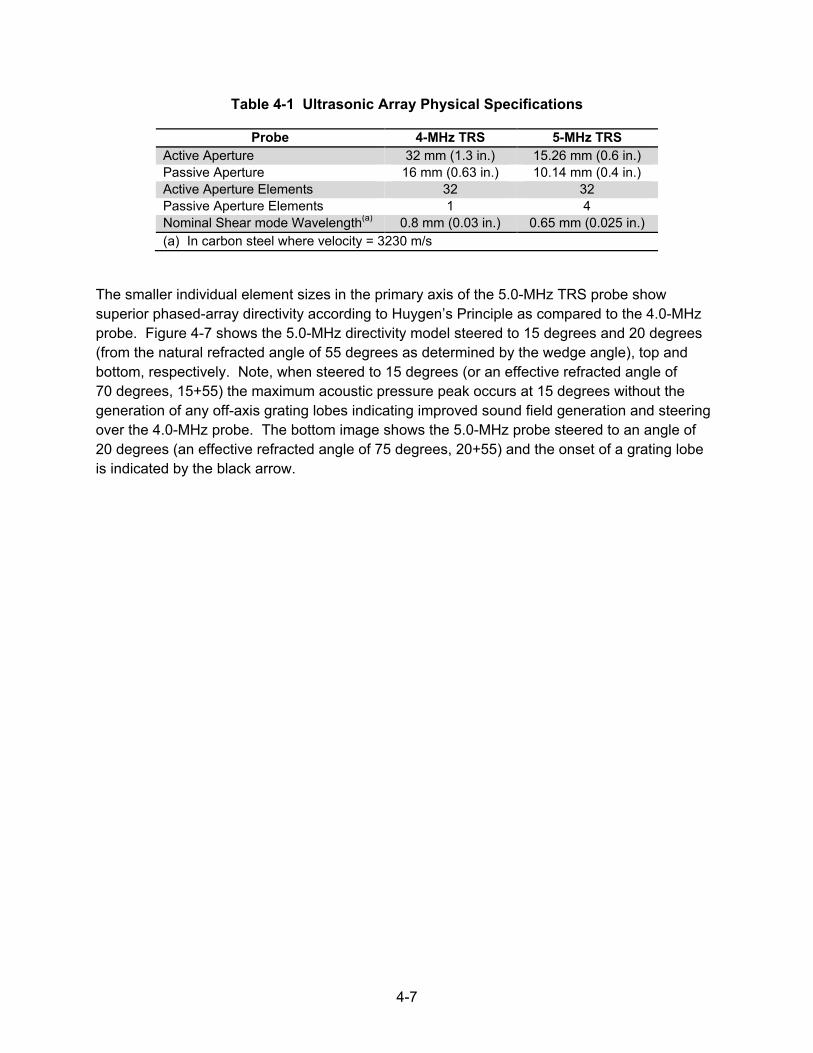
4-7
Table 4-1 Ultrasonic Array Physical Specifications
Probe 4-MHz TRS 5-MHz TRS Active Aperture 32 mm (1.3 in.) 15.26 mm (0.6 in.) Passive Aperture 16 mm (0.63 in.) 10.14 mm (0.4 in.) Active Aperture Elements 32 32 Passive Aperture Elements 1 4 Nominal Shear mode Wavelength(a) 0.8 mm (0.03 in.) 0.65 mm (0.025 in.) (a) In carbon steel where velocity = 3230 m/s
The smaller individual element sizes in the primary axis of the 5.0-MHz TRS probe show superior phased-array directivity according to Huygen’s Principle as compared to the 4.0-MHz probe. Figure 4-7 shows the 5.0-MHz directivity model steered to 15 degrees and 20 degrees (from the natural refracted angle of 55 degrees as determined by the wedge angle), top and bottom, respectively. Note, when steered to 15 degrees (or an effective refracted angle of 70 degrees, 15+55) the maximum acoustic pressure peak occurs at 15 degrees without the generation of any off-axis grating lobes indicating improved sound field generation and steering over the 4.0-MHz probe. The bottom image shows the 5.0-MHz probe steered to an angle of 20 degrees (an effective refracted angle of 75 degrees, 20+55) and the onset of a grating lobe is indicated by the black arrow.
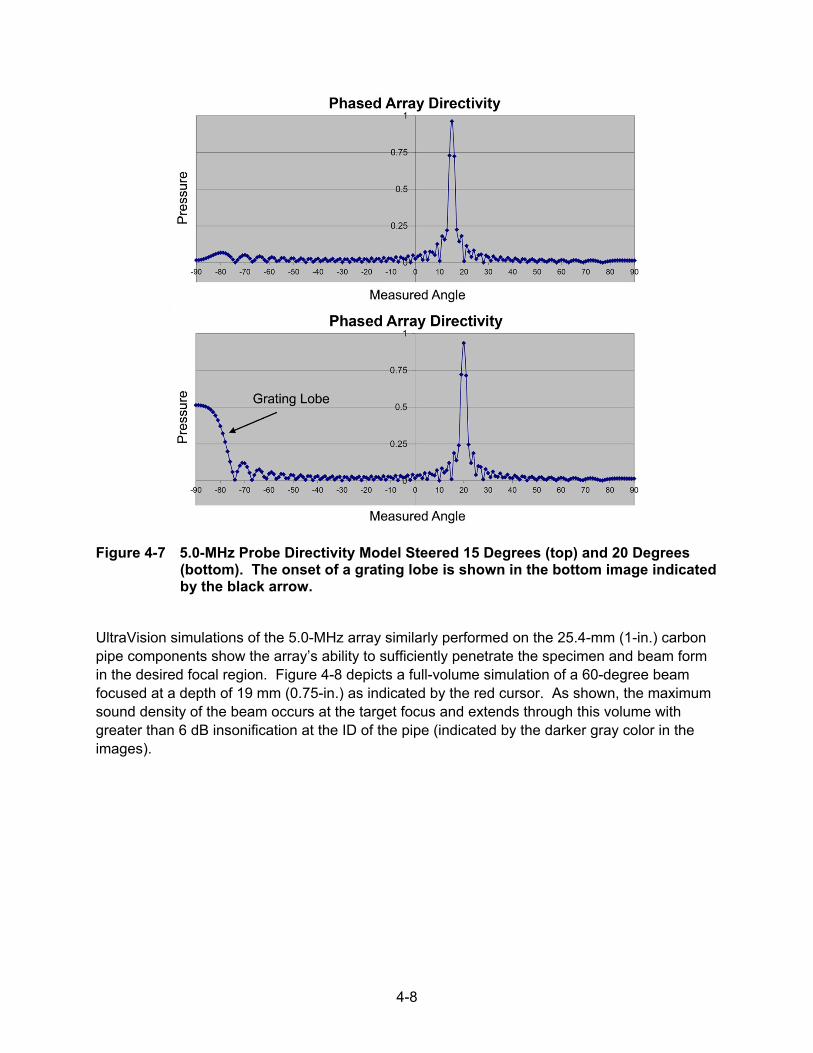
4-8
Figure 4-7 5.0-MHz Probe Directivity Model Steered 15 Degrees (top) and 20 Degrees (bottom). The onset of a grating lobe is shown in the bottom image indicated by the black arrow.
UltraVision simulations of the 5.0-MHz array similarly performed on the 25.4-mm (1-in.) carbon pipe components show the array’s ability to sufficiently penetrate the specimen and beam form in the desired focal region. Figure 4-8 depicts a full-volume simulation of a 60-degree beam focused at a depth of 19 mm (0.75-in.) as indicated by the red cursor. As shown, the maximum sound density of the beam occurs at the target focus and extends through this volume with greater than 6 dB insonification at the ID of the pipe (indicated by the darker gray color in the images).
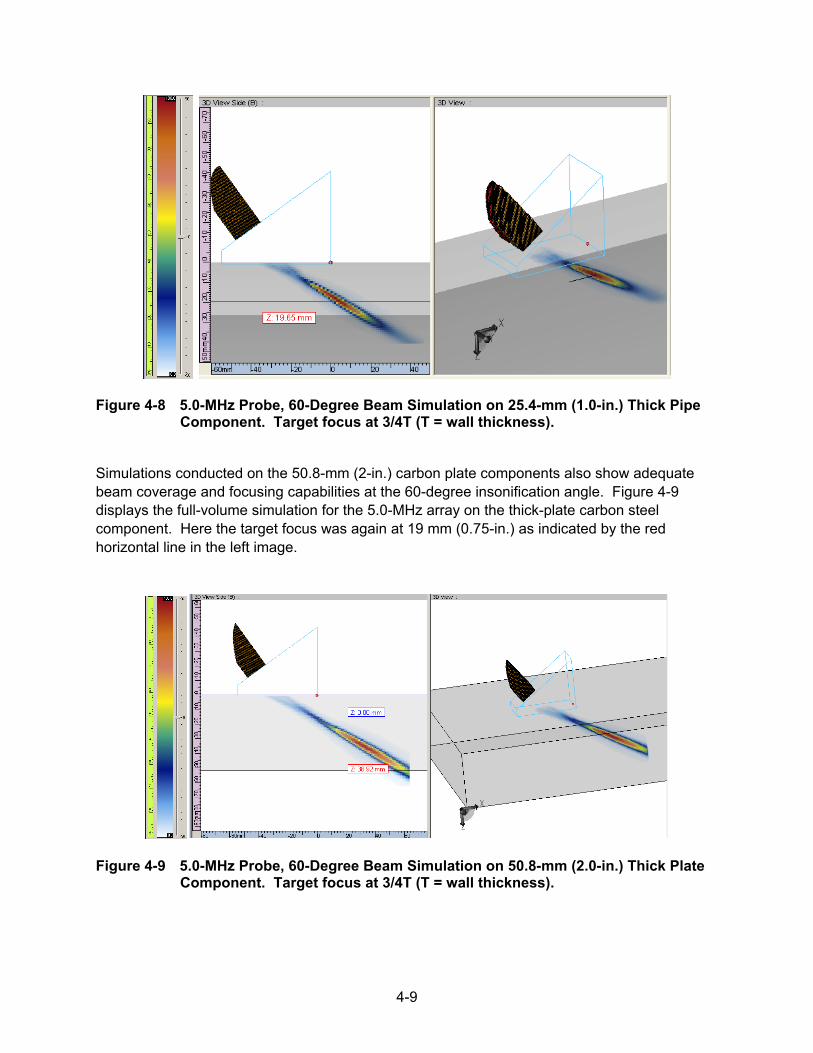
4-9
Figure 4-8 5.0-MHz Probe, 60-Degree Beam Simulation on 25.4-mm (1.0-in.) Thick Pipe Component. Target focus at 3/4T (T = wall thickness).
Simulations conducted on the 50.8-mm (2-in.) carbon plate components also show adequate beam coverage and focusing capabilities at the 60-degree insonification angle. Figure 4-9 displays the full-volume simulation for the 5.0-MHz array on the thick-plate carbon steel component. Here the target focus was again at 19 mm (0.75-in.) as indicated by the red horizontal line in the left image.
Figure 4-9 5.0-MHz Probe, 60-Degree Beam Simulation on 50.8-mm (2.0-in.) Thick Plate Component. Target focus at 3/4T (T = wall thickness).
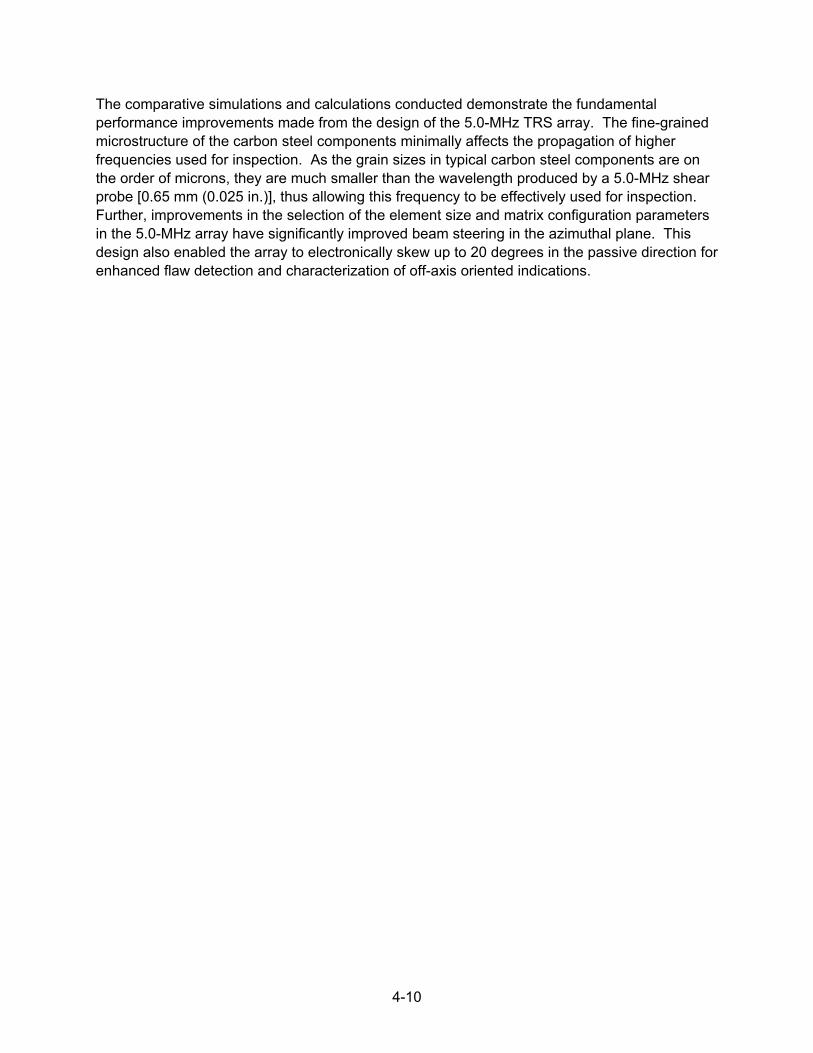
4-10
The comparative simulations and calculations conducted demonstrate the fundamental performance improvements made from the design of the 5.0-MHz TRS array. The fine-grained microstructure of the carbon steel components minimally affects the propagation of higher frequencies used for inspection. As the grain sizes in typical carbon steel components are on the order of microns, they are much smaller than the wavelength produced by a 5.0-MHz shear probe [0.65 mm (0.025 in.)], thus allowing this frequency to be effectively used for inspection. Further, improvements in the selection of the element size and matrix configuration parameters in the 5.0-MHz array have significantly improved beam steering in the azimuthal plane. This design also enabled the array to electronically skew up to 20 degrees in the passive direction for enhanced flaw detection and characterization of off-axis oriented indications.
5-1
5 EQUIPMENT AND METHODS USED FOR RT
The owners of the pipe specimens used in this study provided PNNL with general true-state information in the form of drawings, showing the location of the flaw in the pipe specimen and the approximate length and depth size as well as flaw type. However, because of the nature of this assessment, more exact locations and measurements of the flaws were needed, so PNNL used both film and computed RT techniques to validate the reported true-state information. The PNNL evaluation agreed with most of the information provided by the manufacturer, but some flaws were sized more accurately based on high-quality RT images. In addition, other “bonus” fabrication flaws were observed in the RT images that were not accounted for in the manufacturer’s drawings. The bonus flaws were evaluated using the same high-quality RT images, thereby providing a consistent sizing standard and reliable methodology for characterizing each flaw type.
For the Navy plates, consensus analytical information was provided to PNNL via test report forms that captured both the Navy-performed RT and UT results. In this study, PNNL used the Navy consensus data as a reported true state, except where only Navy UT detected a flaw. In this case, PNNL ignored the Navy UT-only data for the assessments performed and documented in this report. The test reports listed a reference marking on each plate to establish a zero point for scanner and index axes. However, of the three Navy test plates examined, a clearly marked zero reference point remained on Plate 23 only. Therefore, reference markings were created for Plates 10 and 18. As a result, notable differences were initially observed for reported flaw locations between PNNL UT and Navy RT data. PNNL subsequently performed digital RT on Plates 10 and 18 to assist in the data comparison. Position adjustments were made to align the PNNL and Navy RT indications and with similar adjustments being applied to the PNNL UT data.
The X-ray system used at PNNL is composed of the X-ray vault (shielded enclosure), X-ray machine, imaging media (whether film or digital), and the imaging software. These topics as well as the inspection protocols and data interpretation, are discussed below.
5.1 X-ray Vault
PNNL performed the radiography for this project at a facility located in Richland, Washington. The facility is equipped with a lead-lined X-ray shielded enclosure (vault). A large sliding door to the vault allows forklift access for handling heavy components. Figure 5-1 shows the interior of the PNNL 2410 facility and X-ray vault.
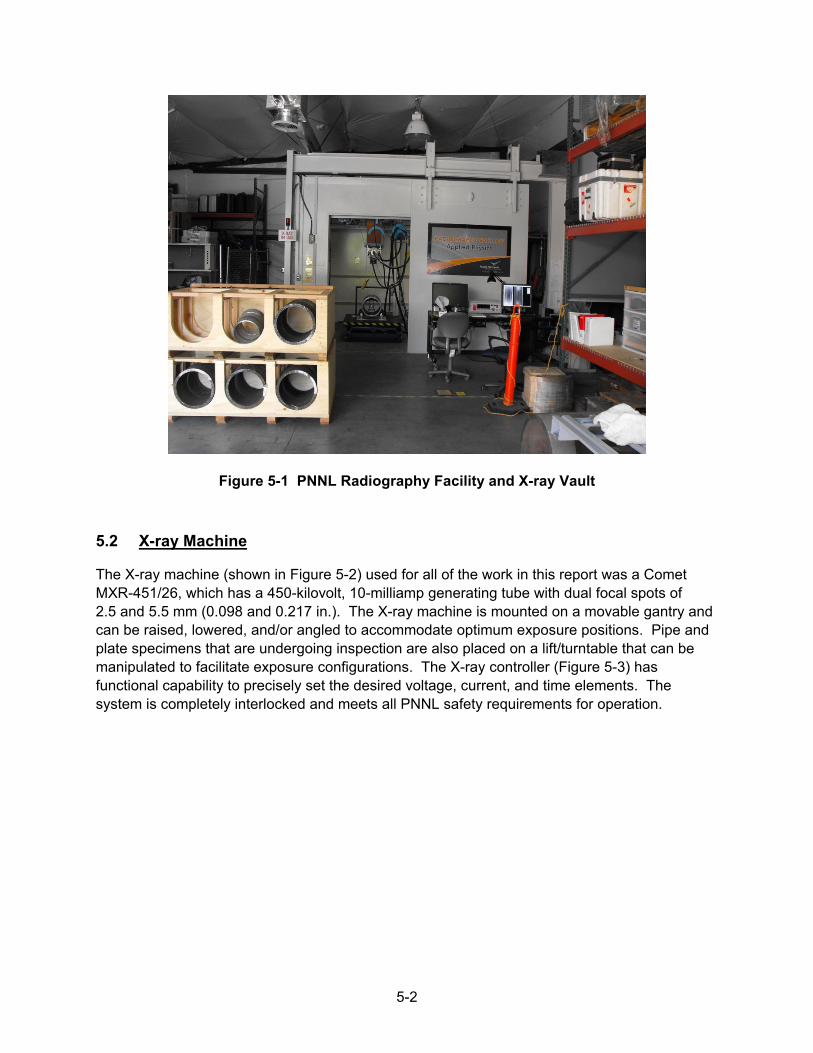
5-2
Figure 5-1 PNNL Radiography Facility and X-ray Vault
5.2 X-ray Machine
The X-ray machine (shown in Figure 5-2) used for all of the work in this report was a Comet MXR-451/26, which has a 450-kilovolt, 10-milliamp generating tube with dual focal spots of 2.5 and 5.5 mm (0.098 and 0.217 in.). The X-ray machine is mounted on a movable gantry and can be raised, lowered, and/or angled to accommodate optimum exposure positions. Pipe and plate specimens that are undergoing inspection are also placed on a lift/turntable that can be manipulated to facilitate exposure configurations. The X-ray controller (Figure 5-3) has functional capability to precisely set the desired voltage, current, and time elements. The system is completely interlocked and meets all PNNL safety requirements for operation.
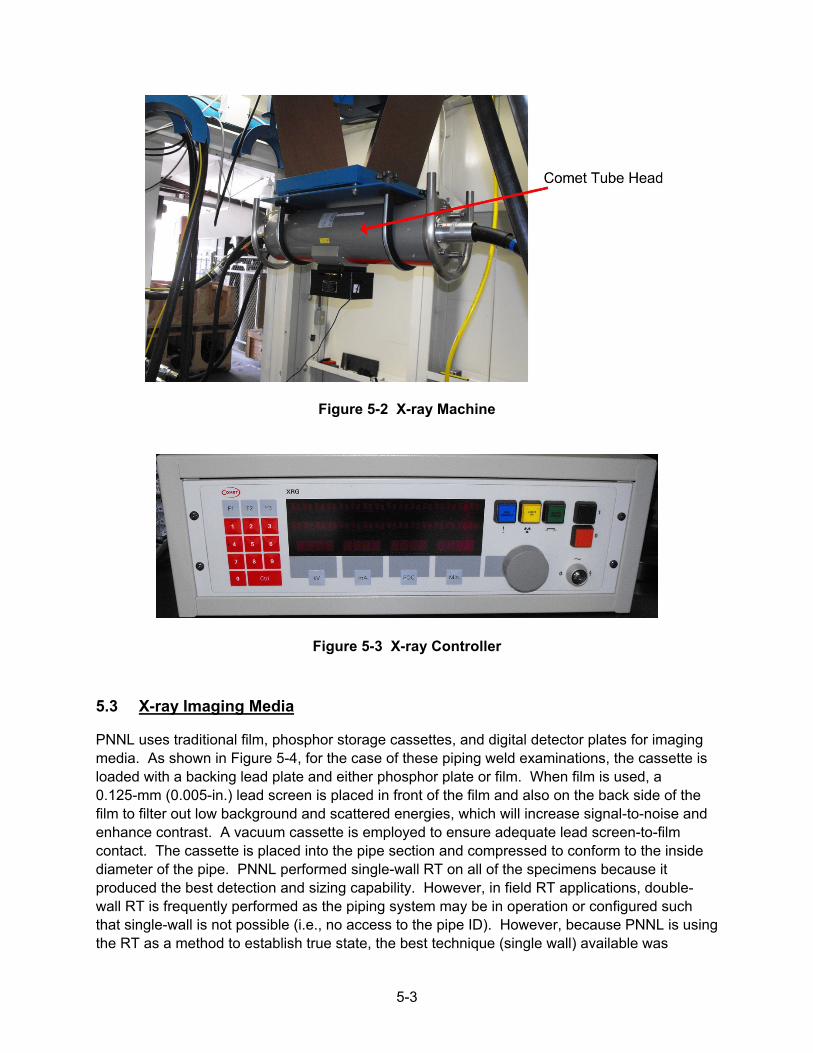
5-3
Figure 5-2 X-ray Machine
Figure 5-3 X-ray Controller
5.3 X-ray Imaging Media
PNNL uses traditional film, phosphor storage cassettes, and digital detector plates for imaging media. As shown in Figure 5-4, for the case of these piping weld examinations, the cassette is loaded with a backing lead plate and either phosphor plate or film. When film is used, a 0.125-mm (0.005-in.) lead screen is placed in front of the film and also on the back side of the film to filter out low background and scattered energies, which will increase signal-to-noise and enhance contrast. A vacuum cassette is employed to ensure adequate lead screen-to-film contact. The cassette is placed into the pipe section and compressed to conform to the inside diameter of the pipe. PNNL performed single-wall RT on all of the specimens because it produced the best detection and sizing capability. However, in field RT applications, double-wall RT is frequently performed as the piping system may be in operation or configured such that single-wall is not possible (i.e., no access to the pipe ID). However, because PNNL is using the RT as a method to establish true state, the best technique (single wall) available was
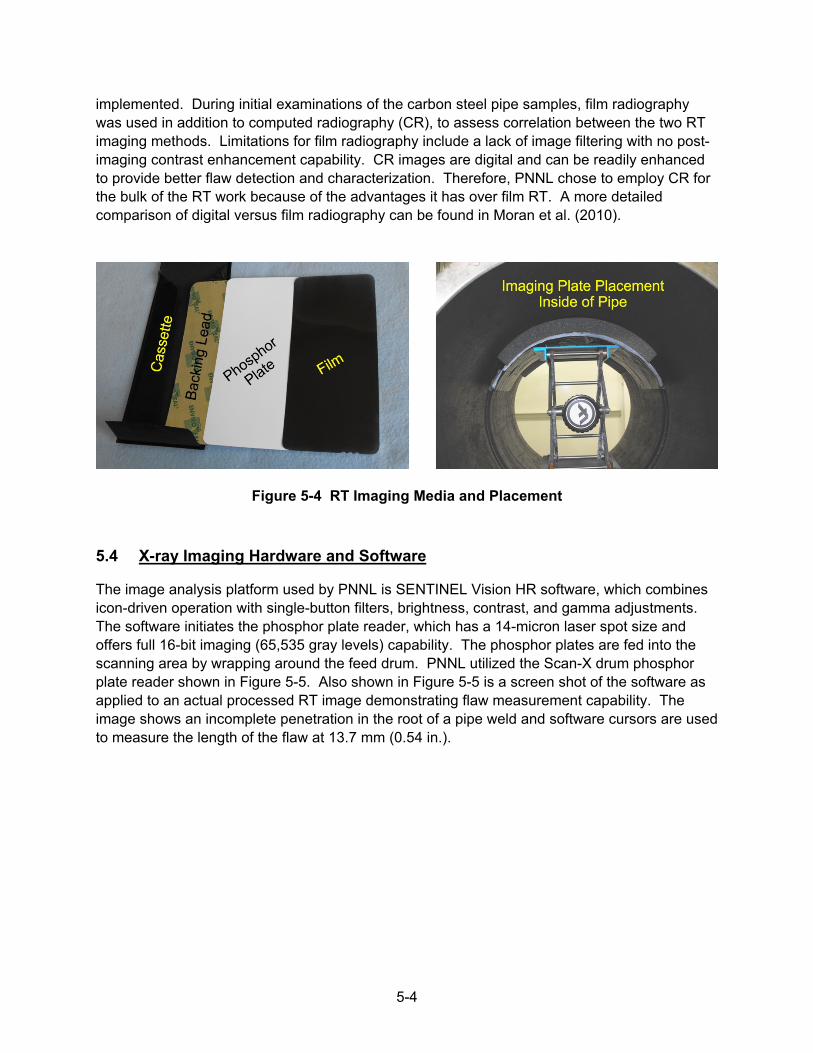
5-4
implemented. During initial examinations of the carbon steel pipe samples, film radiography was used in addition to computed radiography (CR), to assess correlation between the two RT imaging methods. Limitations for film radiography include a lack of image filtering with no post-imaging contrast enhancement capability. CR images are digital and can be readily enhanced to provide better flaw detection and characterization. Therefore, PNNL chose to employ CR for the bulk of the RT work because of the advantages it has over film RT. A more detailed comparison of digital versus film radiography can be found in Moran et al. (2010).
Figure 5-4 RT Imaging Media and Placement
5.4 X-ray Imaging Hardware and Software
The image analysis platform used by PNNL is SENTINEL Vision HR software, which combines icon-driven operation with single-button filters, brightness, contrast, and gamma adjustments. The software initiates the phosphor plate reader, which has a 14-micron laser spot size and offers full 16-bit imaging (65,535 gray levels) capability. The phosphor plates are fed into the scanning area by wrapping around the feed drum. PNNL utilized the Scan-X drum phosphor plate reader shown in Figure 5-5. Also shown in Figure 5-5 is a screen shot of the software as applied to an actual processed RT image demonstrating flaw measurement capability. The image shows an incomplete penetration in the root of a pipe weld and software cursors are used to measure the length of the flaw at 13.7 mm (0.54 in.).
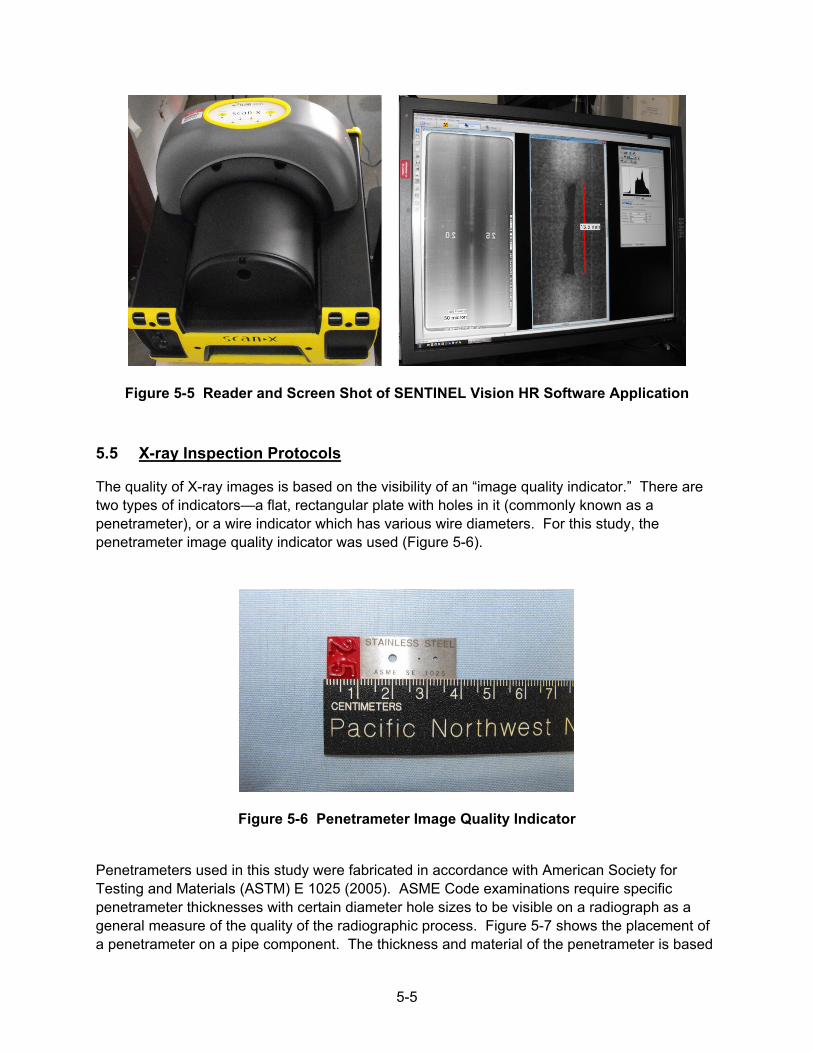
5-5
Figure 5-5 Reader and Screen Shot of SENTINEL Vision HR Software Application
5.5 X-ray Inspection Protocols
The quality of X-ray images is based on the visibility of an “image quality indicator.” There are two types of indicators—a flat, rectangular plate with holes in it (commonly known as a penetrameter), or a wire indicator which has various wire diameters. For this study, the penetrameter image quality indicator was used (Figure 5-6).
Figure 5-6 Penetrameter Image Quality Indicator
Penetrameters used in this study were fabricated in accordance with American Society for Testing and Materials (ASTM) E 1025 (2005). ASME Code examinations require specific penetrameter thicknesses with certain diameter hole sizes to be visible on a radiograph as a general measure of the quality of the radiographic process. Figure 5-7 shows the placement of a penetrameter on a pipe component. The thickness and material of the penetrameter is based
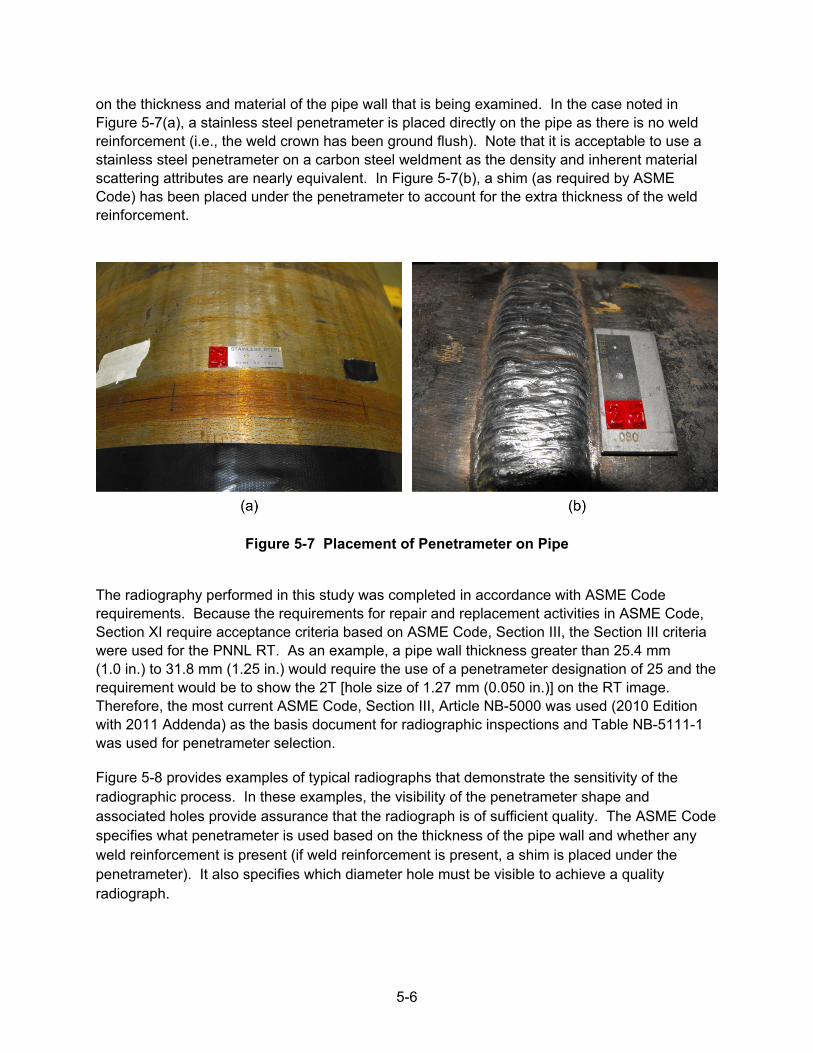
5-6
on the thickness and material of the pipe wall that is being examined. In the case noted in Figure 5-7(a), a stainless steel penetrameter is placed directly on the pipe as there is no weld reinforcement (i.e., the weld crown has been ground flush). Note that it is acceptable to use a stainless steel penetrameter on a carbon steel weldment as the density and inherent material scattering attributes are nearly equivalent. In Figure 5-7(b), a shim (as required by ASME Code) has been placed under the penetrameter to account for the extra thickness of the weld reinforcement.
Figure 5-7 Placement of Penetrameter on Pipe
The radiography performed in this study was completed in accordance with ASME Code requirements. Because the requirements for repair and replacement activities in ASME Code, Section XI require acceptance criteria based on ASME Code, Section III, the Section III criteria were used for the PNNL RT. As an example, a pipe wall thickness greater than 25.4 mm (1.0 in.) to 31.8 mm (1.25 in.) would require the use of a penetrameter designation of 25 and the requirement would be to show the 2T [hole size of 1.27 mm (0.050 in.)] on the RT image. Therefore, the most current ASME Code, Section III, Article NB-5000 was used (2010 Edition with 2011 Addenda) as the basis document for radiographic inspections and Table NB-5111-1 was used for penetrameter selection.
Figure 5-8 provides examples of typical radiographs that demonstrate the sensitivity of the radiographic process. In these examples, the visibility of the penetrameter shape and associated holes provide assurance that the radiograph is of sufficient quality. The ASME Code specifies what penetrameter is used based on the thickness of the pipe wall and whether any weld reinforcement is present (if weld reinforcement is present, a shim is placed under the penetrameter). It also specifies which diameter hole must be visible to achieve a quality radiograph.
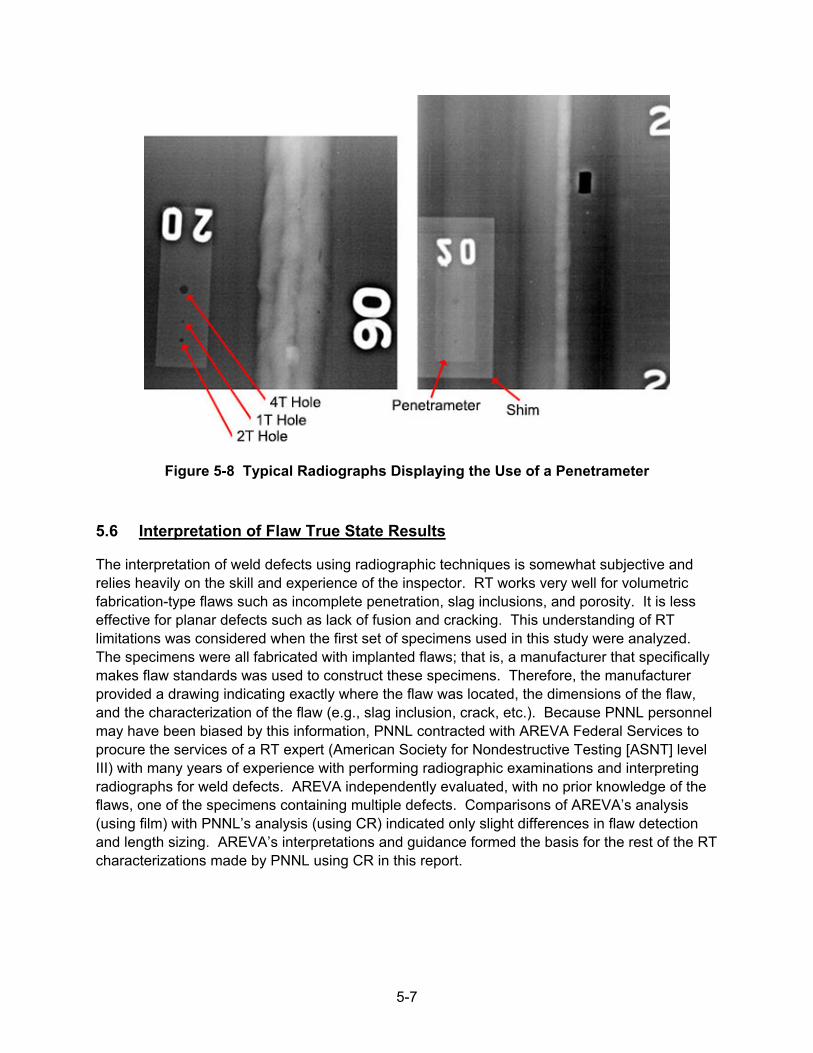
5-7
Figure 5-8 Typical Radiographs Displaying the Use of a Penetrameter
5.6 Interpretation of Flaw True State Results
The interpretation of weld defects using radiographic techniques is somewhat subjective and relies heavily on the skill and experience of the inspector. RT works very well for volumetric fabrication-type flaws such as incomplete penetration, slag inclusions, and porosity. It is less effective for planar defects such as lack of fusion and cracking. This understanding of RT limitations was considered when the first set of specimens used in this study were analyzed. The specimens were all fabricated with implanted flaws; that is, a manufacturer that specifically makes flaw standards was used to construct these specimens. Therefore, the manufacturer provided a drawing indicating exactly where the flaw was located, the dimensions of the flaw, and the characterization of the flaw (e.g., slag inclusion, crack, etc.). Because PNNL personnel may have been biased by this information, PNNL contracted with AREVA Federal Services to procure the services of a RT expert (American Society for Nondestructive Testing [ASNT] level III) with many years of experience with performing radiographic examinations and interpreting radiographs for weld defects. AREVA independently evaluated, with no prior knowledge of the flaws, one of the specimens containing multiple defects. Comparisons of AREVA’s analysis (using film) with PNNL’s analysis (using CR) indicated only slight differences in flaw detection and length sizing. AREVA’s interpretations and guidance formed the basis for the rest of the RT characterizations made by PNNL using CR in this report.
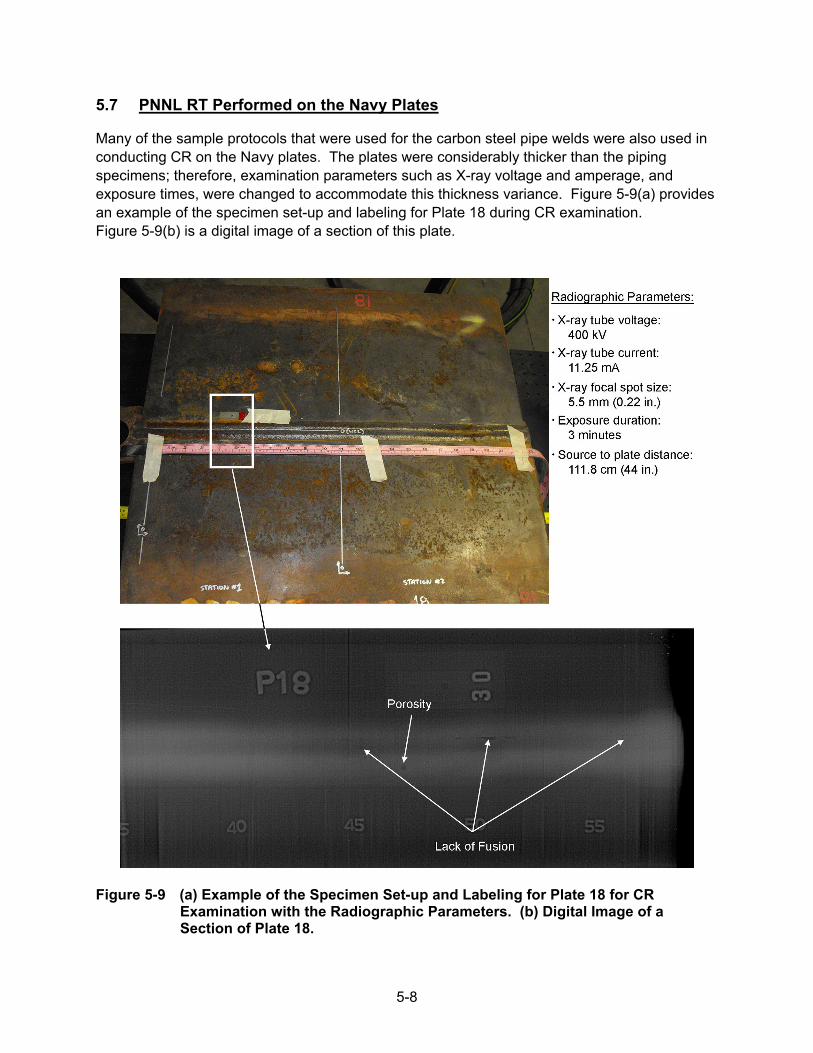
5-8
5.7 PNNL RT Performed on the Navy Plates
Many of the sample protocols that were used for the carbon steel pipe welds were also used in conducting CR on the Navy plates. The plates were considerably thicker than the piping specimens; therefore, examination parameters such as X-ray voltage and amperage, and exposure times, were changed to accommodate this thickness variance. Figure 5-9(a) provides an example of the specimen set-up and labeling for Plate 18 during CR examination. Figure 5-9(b) is a digital image of a section of this plate.
Figure 5-9 (a) Example of the Specimen Set-up and Labeling for Plate 18 for CR Examination with the Radiographic Parameters. (b) Digital Image of a Section of Plate 18.
6-1
6 LABORATORY ULTRASONIC RESEARCH VARIABLES
The general use of the PA system and specific methods employed for evaluation of the carbon steel specimens are presented in this section. Section 6.1 reviews the system electronics and scanner. Section 6.2 covers the scanning protocol and, lastly, Section 6.3 briefly presents flaw characterization guidelines and results of a limited blind exercise.
6.1 PA-UT System
Phased-array ultrasonic examinations of the four, carbon steel pipe-to-pipe specimens and three, carbon steel Navy plate specimens discussed in Section 3 were conducted using a ZETEC DYNARAY system. This commercially available system is equipped to accommodate a maximum of 256 channels from PA probes and requires the use of UltraVision software. Its frequency pulsing electronics will drive probes in the 0.2–20 MHz range. Each probe is driven with a square wave having an optimized pulse width. The pulse width is set to approximately half of the probe’s design frequency (F) (one-half F in nanoseconds).
Set-up and laboratory configuration for PA-UT data acquisition on the pipe-to-pipe specimens used an automated scanner device on an adjustable guide ring supported by a custom-designed floor-to-ceiling brace. The scanning fixture includes a translation slide providing additional control and freedom for adjusting the specimens in both horizontal and vertical directions. This provides easy manipulation for fine-tuning the guide-ring position, relative to the pipe specimens. The laboratory configuration for the Navy plates used the same automated scanner system on a flat guide track. The plates were supported by blocks and the entire set-up was placed in a basin to collect and recycle the water used for coupling the acoustic energy to the specimen.
The automated system consists of an ATCO dual-axis magnetic wheel scanner driven by a ZETEC motor control drive unit (MCDU-02). The scanning system linked directly to the DYNARAY unit via Ethernet and encoder cabling to allow control of scan motions by the UltraVision software package. Spatially encoded data were acquired in both the scan and index axes using this system. As with the Navy plates, acoustic coupling between the probe wedge and the piping specimen surface was performed using water pumped through nozzles embedded on both sides of the wedge harness. This set-up allowed water to flow evenly over the surface of the specimen. As the water couplant flowed off of the top of the specimen, it was collected in a tray, channeled back to the pump, and recycled. The DYNARAY data acquisition system and laboratory workstation are shown in Figure 6-1. The automated scanner and scanning fixtures for both piping and plate specimens are depicted in Figure 6-2.
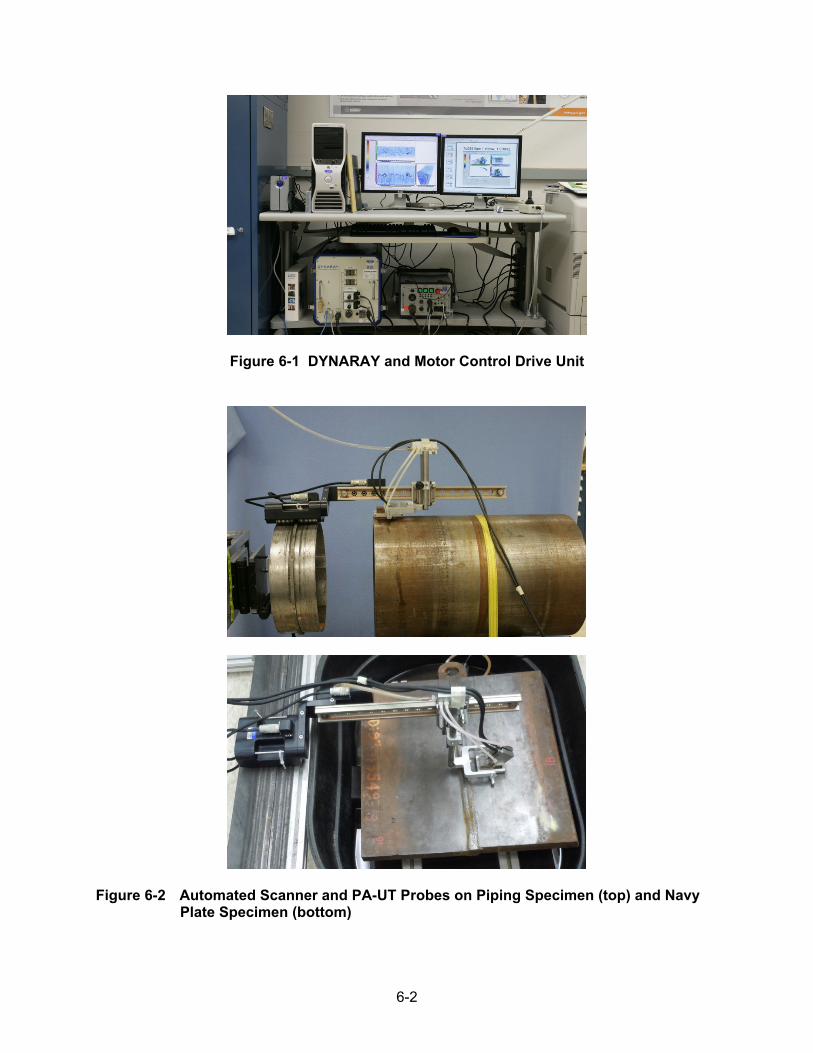
6-2
Figure 6-1 DYNARAY and Motor Control Drive Unit
Figure 6-2 Automated Scanner and PA-UT Probes on Piping Specimen (top) and Navy Plate Specimen (bottom)
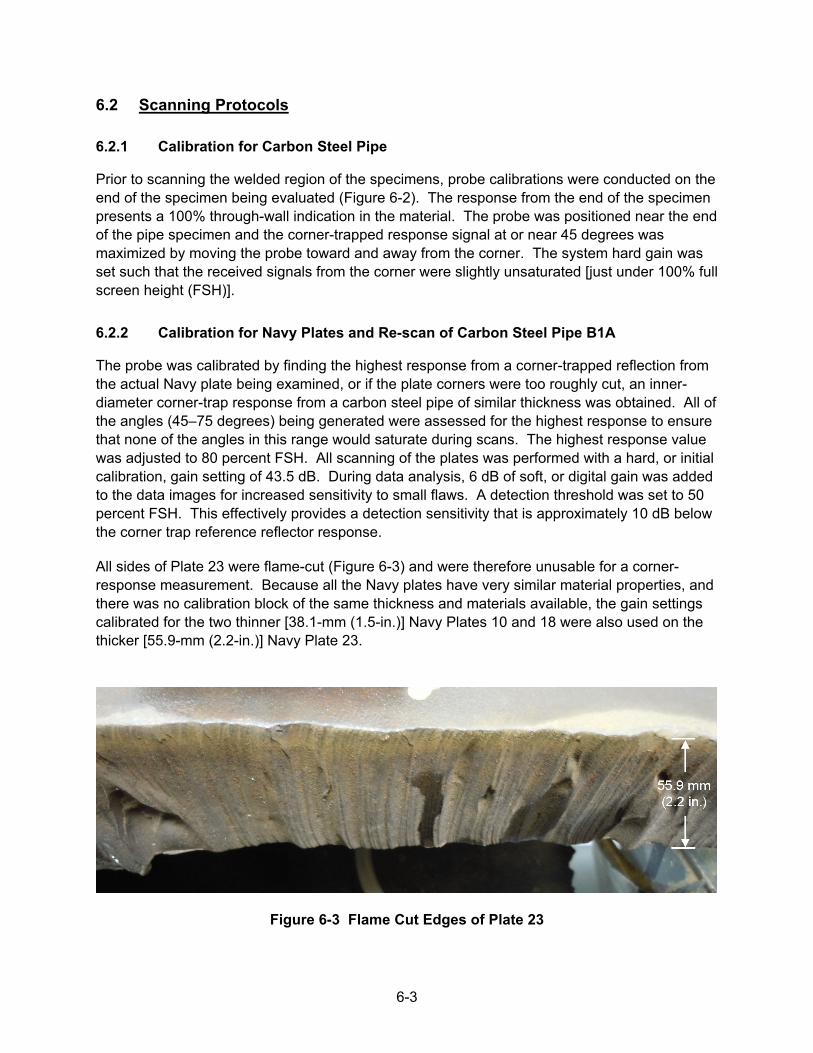
6-3
6.2 Scanning Protocols
6.2.1 Calibration for Carbon Steel Pipe
Prior to scanning the welded region of the specimens, probe calibrations were conducted on the end of the specimen being evaluated (Figure 6-2). The response from the end of the specimen presents a 100% through-wall indication in the material. The probe was positioned near the end of the pipe specimen and the corner-trapped response signal at or near 45 degrees was maximized by moving the probe toward and away from the corner. The system hard gain was set such that the received signals from the corner were slightly unsaturated [just under 100% full screen height (FSH)].
6.2.2 Calibration for Navy Plates and Re-scan of Carbon Steel Pipe B1A
The probe was calibrated by finding the highest response from a corner-trapped reflection from the actual Navy plate being examined, or if the plate corners were too roughly cut, an inner-diameter corner-trap response from a carbon steel pipe of similar thickness was obtained. All of the angles (45–75 degrees) being generated were assessed for the highest response to ensure that none of the angles in this range would saturate during scans. The highest response value was adjusted to 80 percent FSH. All scanning of the plates was performed with a hard, or initial calibration, gain setting of 43.5 dB. During data analysis, 6 dB of soft, or digital gain was added to the data images for increased sensitivity to small flaws. A detection threshold was set to 50 percent FSH. This effectively provides a detection sensitivity that is approximately 10 dB below the corner trap reference reflector response.
All sides of Plate 23 were flame-cut (Figure 6-3) and were therefore unusable for a corner-response measurement. Because all the Navy plates have very similar material properties, and there was no calibration block of the same thickness and materials available, the gain settings calibrated for the two thinner [38.1-mm (1.5-in.)] Navy Plates 10 and 18 were also used on the thicker [55.9-mm (2.2-in.)] Navy Plate 23.
Figure 6-3 Flame Cut Edges of Plate 23
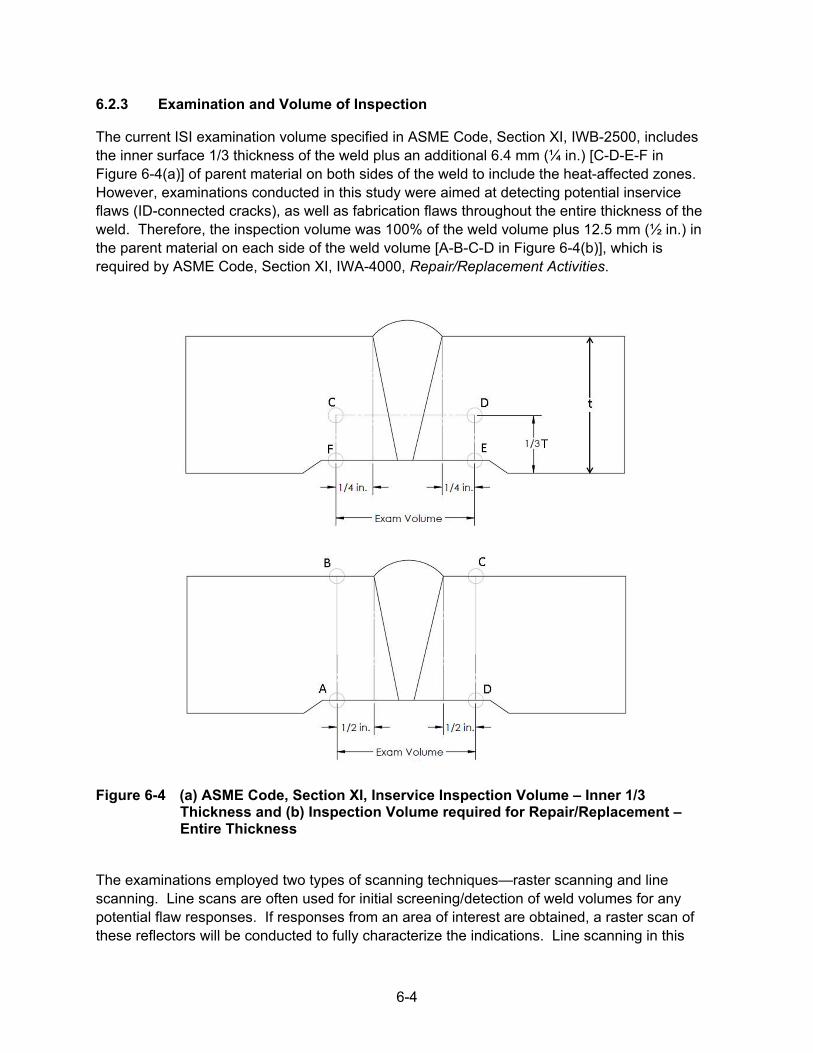
6-4
6.2.3 Examination and Volume of Inspection
The current ISI examination volume specified in ASME Code, Section XI, IWB-2500, includes the inner surface 1/3 thickness of the weld plus an additional 6.4 mm (¼ in.) [C-D-E-F in Figure 6-4(a)] of parent material on both sides of the weld to include the heat-affected zones. However, examinations conducted in this study were aimed at detecting potential inservice flaws (ID-connected cracks), as well as fabrication flaws throughout the entire thickness of the weld. Therefore, the inspection volume was 100% of the weld volume plus 12.5 mm (½ in.) in the parent material on each side of the weld volume [A-B-C-D in Figure 6-4(b)], which is required by ASME Code, Section XI, IWA-4000, Repair/Replacement Activities.
Figure 6-4 (a) ASME Code, Section XI, Inservice Inspection Volume – Inner 1/3
Thickness and (b) Inspection Volume required for Repair/Replacement – Entire Thickness
The examinations employed two types of scanning techniques—raster scanning and line scanning. Line scans are often used for initial screening/detection of weld volumes for any potential flaw responses. If responses from an area of interest are obtained, a raster scan of these reflectors will be conducted to fully characterize the indications. Line scanning in this
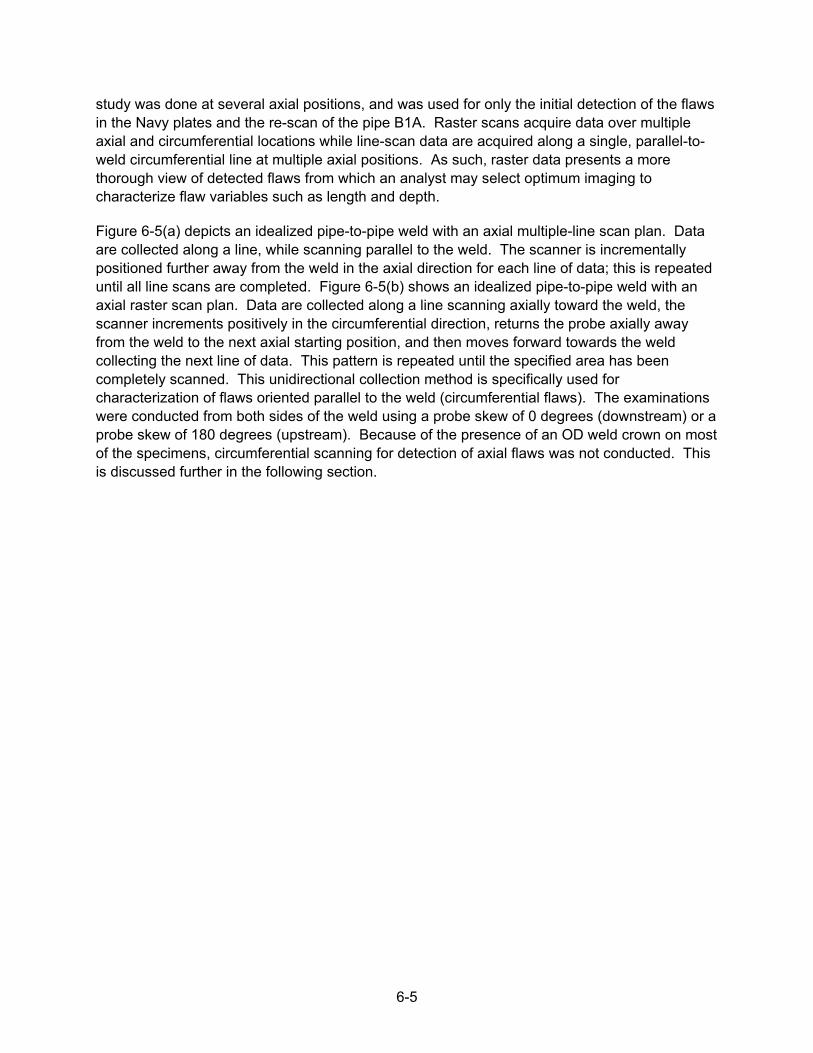
6-5
study was done at several axial positions, and was used for only the initial detection of the flaws in the Navy plates and the re-scan of the pipe B1A. Raster scans acquire data over multiple axial and circumferential locations while line-scan data are acquired along a single, parallel-to-weld circumferential line at multiple axial positions. As such, raster data presents a more thorough view of detected flaws from which an analyst may select optimum imaging to characterize flaw variables such as length and depth.
Figure 6-5(a) depicts an idealized pipe-to-pipe weld with an axial multiple-line scan plan. Data are collected along a line, while scanning parallel to the weld. The scanner is incrementally positioned further away from the weld in the axial direction for each line of data; this is repeated until all line scans are completed. Figure 6-5(b) shows an idealized pipe-to-pipe weld with an axial raster scan plan. Data are collected along a line scanning axially toward the weld, the scanner increments positively in the circumferential direction, returns the probe axially away from the weld to the next axial starting position, and then moves forward towards the weld collecting the next line of data. This pattern is repeated until the specified area has been completely scanned. This unidirectional collection method is specifically used for characterization of flaws oriented parallel to the weld (circumferential flaws). The examinations were conducted from both sides of the weld using a probe skew of 0 degrees (downstream) or a probe skew of 180 degrees (upstream). Because of the presence of an OD weld crown on most of the specimens, circumferential scanning for detection of axial flaws was not conducted. This is discussed further in the following section.
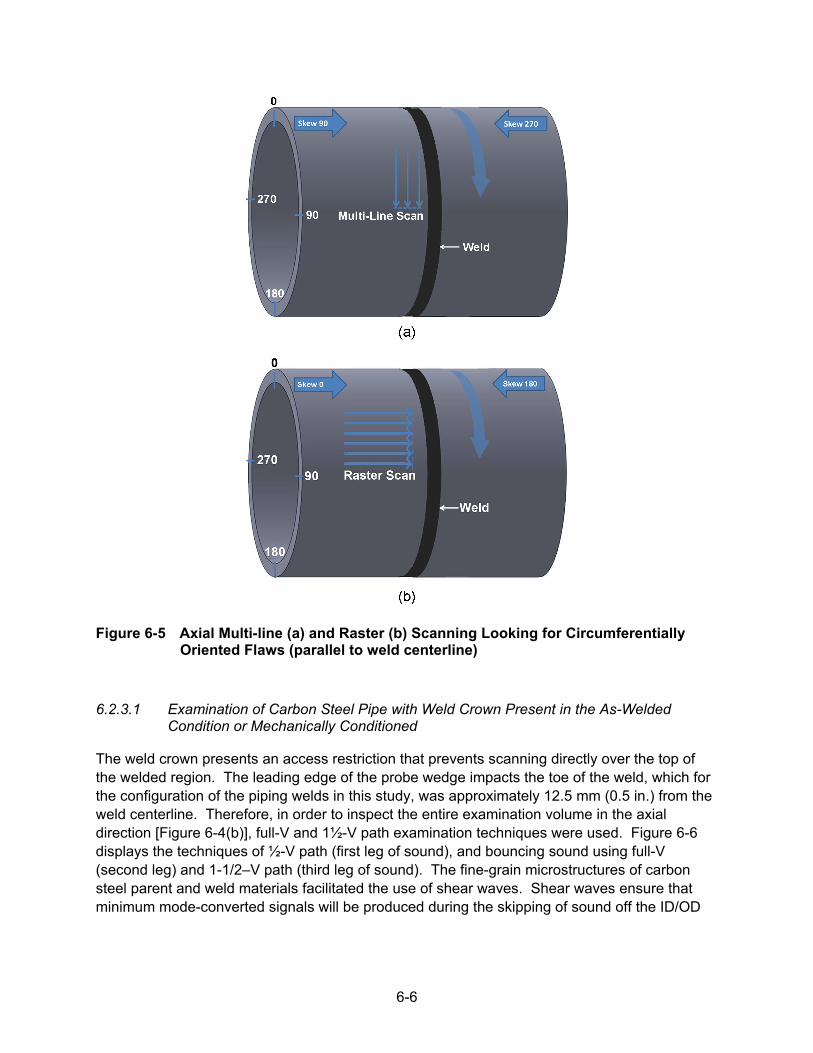
6-6
Figure 6-5 Axial Multi-line (a) and Raster (b) Scanning Looking for Circumferentially Oriented Flaws (parallel to weld centerline)
6.2.3.1 Examination of Carbon Steel Pipe with Weld Crown Present in the As-Welded Condition or Mechanically Conditioned
The weld crown presents an access restriction that prevents scanning directly over the top of the welded region. The leading edge of the probe wedge impacts the toe of the weld, which for the configuration of the piping welds in this study, was approximately 12.5 mm (0.5 in.) from the weld centerline. Therefore, in order to inspect the entire examination volume in the axial direction [Figure 6-4(b)], full-V and 1½-V path examination techniques were used. Figure 6-6 displays the techniques of ½-V path (first leg of sound), and bouncing sound using full-V (second leg) and 1-1/2–V path (third leg of sound). The fine-grain microstructures of carbon steel parent and weld materials facilitated the use of shear waves. Shear waves ensure that minimum mode-converted signals will be produced during the skipping of sound off the ID/OD
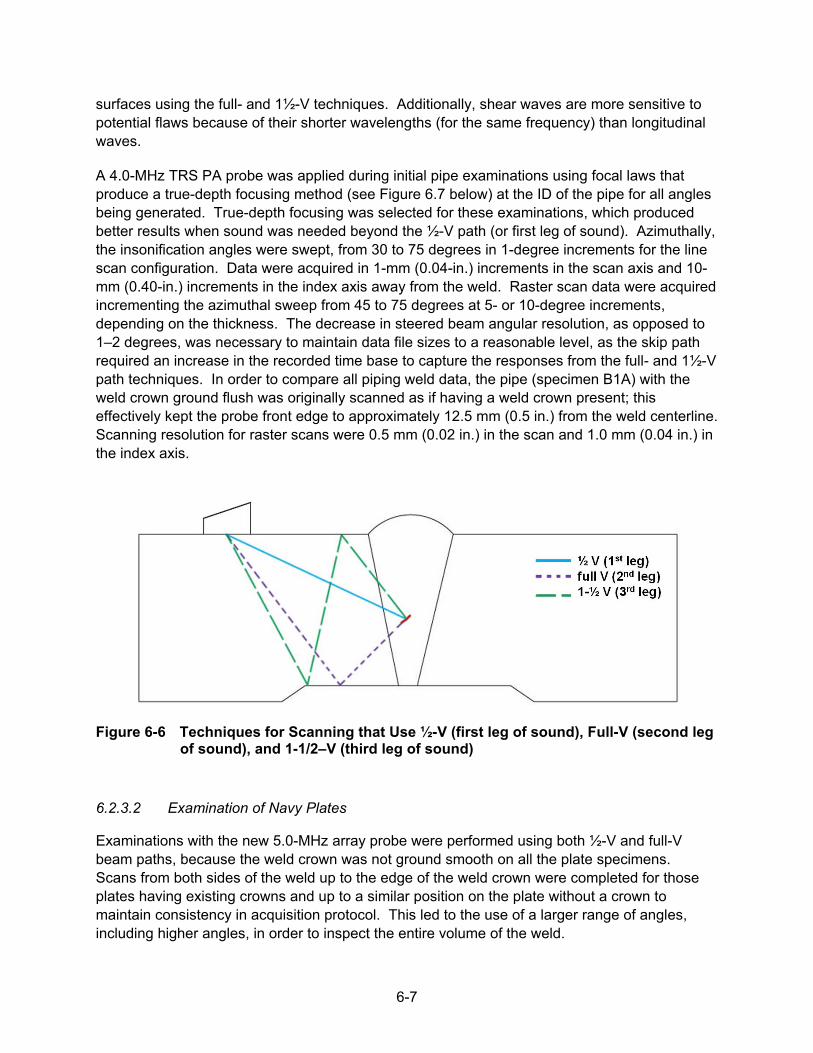
6-7
surfaces using the full- and 1½-V techniques. Additionally, shear waves are more sensitive to potential flaws because of their shorter wavelengths (for the same frequency) than longitudinal waves.
A 4.0-MHz TRS PA probe was applied during initial pipe examinations using focal laws that produce a true-depth focusing method (see Figure 6.7 below) at the ID of the pipe for all angles being generated. True-depth focusing was selected for these examinations, which produced better results when sound was needed beyond the ½-V path (or first leg of sound). Azimuthally, the insonification angles were swept, from 30 to 75 degrees in 1-degree increments for the line scan configuration. Data were acquired in 1-mm (0.04-in.) increments in the scan axis and 10-mm (0.40-in.) increments in the index axis away from the weld. Raster scan data were acquired incrementing the azimuthal sweep from 45 to 75 degrees at 5- or 10-degree increments, depending on the thickness. The decrease in steered beam angular resolution, as opposed to 1–2 degrees, was necessary to maintain data file sizes to a reasonable level, as the skip path required an increase in the recorded time base to capture the responses from the full- and 1½-V path techniques. In order to compare all piping weld data, the pipe (specimen B1A) with the weld crown ground flush was originally scanned as if having a weld crown present; this effectively kept the probe front edge to approximately 12.5 mm (0.5 in.) from the weld centerline. Scanning resolution for raster scans were 0.5 mm (0.02 in.) in the scan and 1.0 mm (0.04 in.) in the index axis.
Figure 6-6 Techniques for Scanning that Use ½-V (first leg of sound), Full-V (second leg of sound), and 1-1/2–V (third leg of sound)
6.2.3.2 Examination of Navy Plates
Examinations with the new 5.0-MHz array probe were performed using both ½-V and full-V beam paths, because the weld crown was not ground smooth on all the plate specimens. Scans from both sides of the weld up to the edge of the weld crown were completed for those plates having existing crowns and up to a similar position on the plate without a crown to maintain consistency in acquisition protocol. This led to the use of a larger range of angles, including higher angles, in order to inspect the entire volume of the weld.
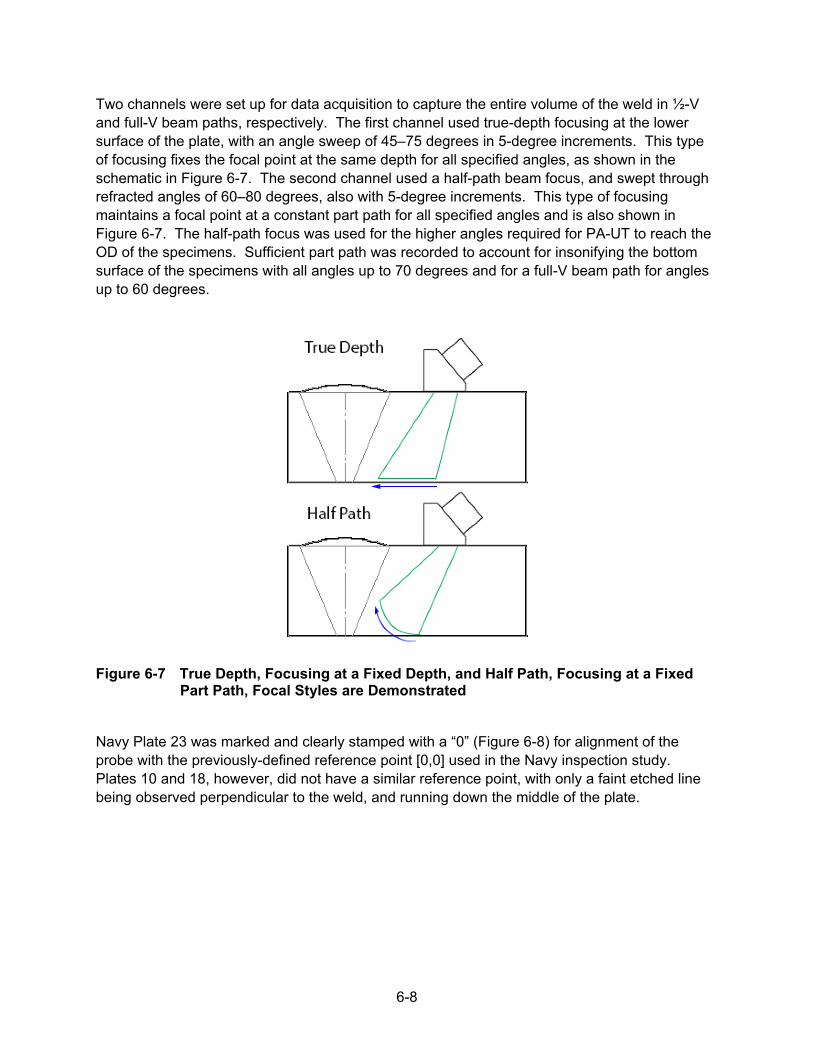
6-8
Two channels were set up for data acquisition to capture the entire volume of the weld in ½-V and full-V beam paths, respectively. The first channel used true-depth focusing at the lower surface of the plate, with an angle sweep of 45–75 degrees in 5-degree increments. This type of focusing fixes the focal point at the same depth for all specified angles, as shown in the schematic in Figure 6-7. The second channel used a half-path beam focus, and swept through refracted angles of 60–80 degrees, also with 5-degree increments. This type of focusing maintains a focal point at a constant part path for all specified angles and is also shown in Figure 6-7. The half-path focus was used for the higher angles required for PA-UT to reach the OD of the specimens. Sufficient part path was recorded to account for insonifying the bottom surface of the specimens with all angles up to 70 degrees and for a full-V beam path for angles up to 60 degrees.
Figure 6-7 True Depth, Focusing at a Fixed Depth, and Half Path, Focusing at a Fixed Part Path, Focal Styles are Demonstrated
Navy Plate 23 was marked and clearly stamped with a “0” (Figure 6-8) for alignment of the probe with the previously-defined reference point [0,0] used in the Navy inspection study. Plates 10 and 18, however, did not have a similar reference point, with only a faint etched line being observed perpendicular to the weld, and running down the middle of the plate.
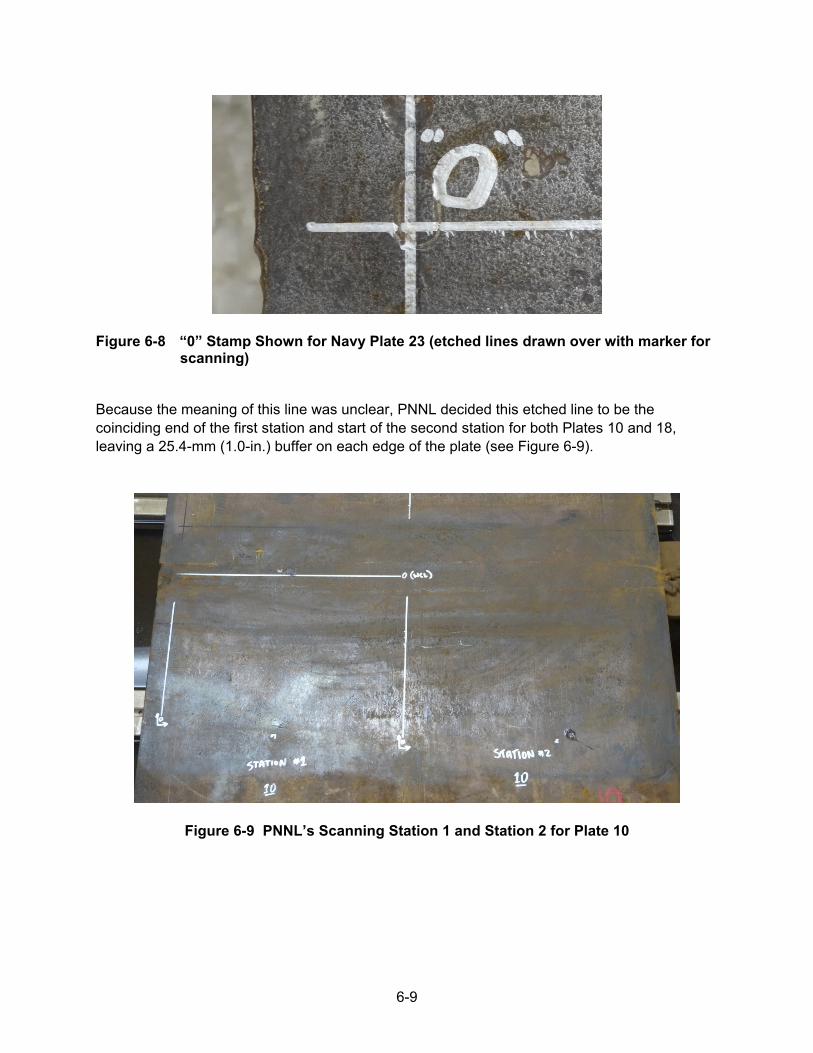
6-9
Figure 6-8 “0” Stamp Shown for Navy Plate 23 (etched lines drawn over with marker for scanning)
Because the meaning of this line was unclear, PNNL decided this etched line to be the coinciding end of the first station and start of the second station for both Plates 10 and 18, leaving a 25.4-mm (1.0-in.) buffer on each edge of the plate (see Figure 6-9).
Figure 6-9 PNNL’s Scanning Station 1 and Station 2 for Plate 10
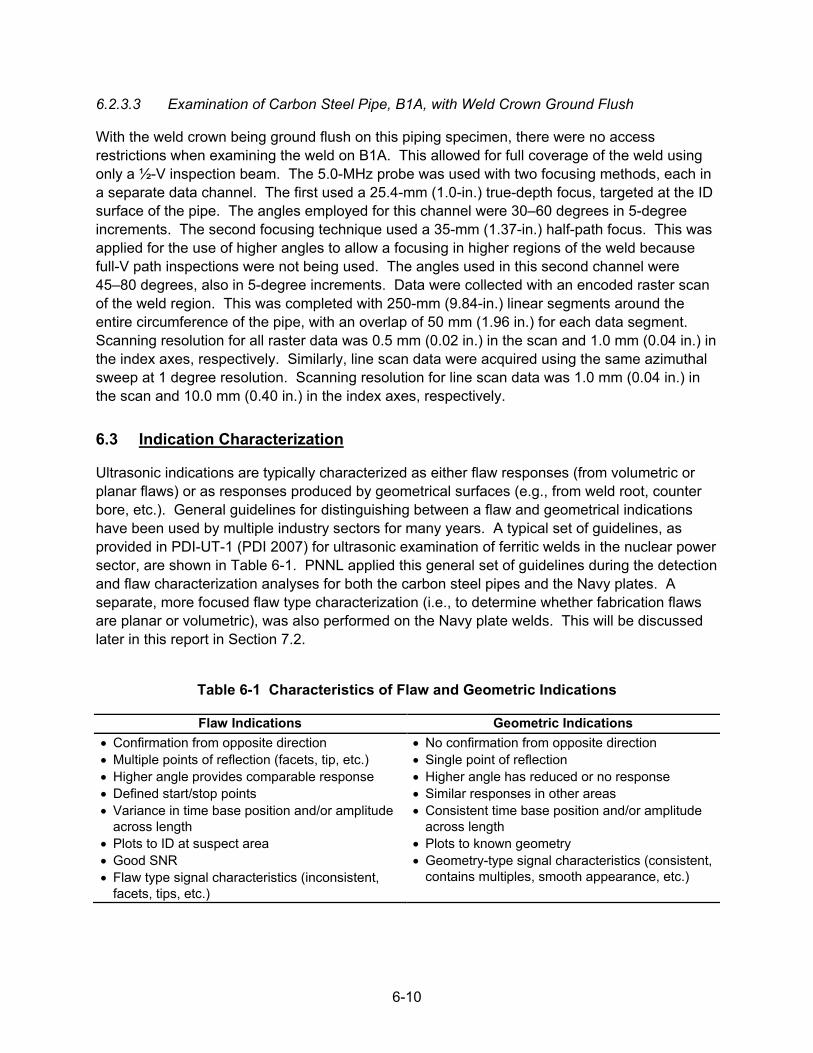
6-10
6.2.3.3 Examination of Carbon Steel Pipe, B1A, with Weld Crown Ground Flush
With the weld crown being ground flush on this piping specimen, there were no access restrictions when examining the weld on B1A. This allowed for full coverage of the weld using only a ½-V inspection beam. The 5.0-MHz probe was used with two focusing methods, each in a separate data channel. The first used a 25.4-mm (1.0-in.) true-depth focus, targeted at the ID surface of the pipe. The angles employed for this channel were 30–60 degrees in 5-degree increments. The second focusing technique used a 35-mm (1.37-in.) half-path focus. This was applied for the use of higher angles to allow a focusing in higher regions of the weld because full-V path inspections were not being used. The angles used in this second channel were 45–80 degrees, also in 5-degree increments. Data were collected with an encoded raster scan of the weld region. This was completed with 250-mm (9.84-in.) linear segments around the entire circumference of the pipe, with an overlap of 50 mm (1.96 in.) for each data segment. Scanning resolution for all raster data was 0.5 mm (0.02 in.) in the scan and 1.0 mm (0.04 in.) in the index axes, respectively. Similarly, line scan data were acquired using the same azimuthal sweep at 1 degree resolution. Scanning resolution for line scan data was 1.0 mm (0.04 in.) in the scan and 10.0 mm (0.40 in.) in the index axes, respectively.
6.3 Indication Characterization
Ultrasonic indications are typically characterized as either flaw responses (from volumetric or planar flaws) or as responses produced by geometrical surfaces (e.g., from weld root, counter bore, etc.). General guidelines for distinguishing between a flaw and geometrical indications have been used by multiple industry sectors for many years. A typical set of guidelines, as provided in PDI-UT-1 (PDI 2007) for ultrasonic examination of ferritic welds in the nuclear power sector, are shown in Table 6-1. PNNL applied this general set of guidelines during the detection and flaw characterization analyses for both the carbon steel pipes and the Navy plates. A separate, more focused flaw type characterization (i.e., to determine whether fabrication flaws are planar or volumetric), was also performed on the Navy plate welds. This will be discussed later in this report in Section 7.2.
Table 6-1 Characteristics of Flaw and Geometric Indications
Flaw Indications Geometric Indications • Confirmation from opposite direction • Multiple points of reflection (facets, tip, etc.) • Higher angle provides comparable response • Defined start/stop points • Variance in time base position and/or amplitude
across length • Plots to ID at suspect area • Good SNR • Flaw type signal characteristics (inconsistent,
facets, tips, etc.)
• No confirmation from opposite direction • Single point of reflection • Higher angle has reduced or no response • Similar responses in other areas • Consistent time base position and/or amplitude
across length • Plots to known geometry • Geometry-type signal characteristics (consistent,
contains multiples, smooth appearance, etc.)
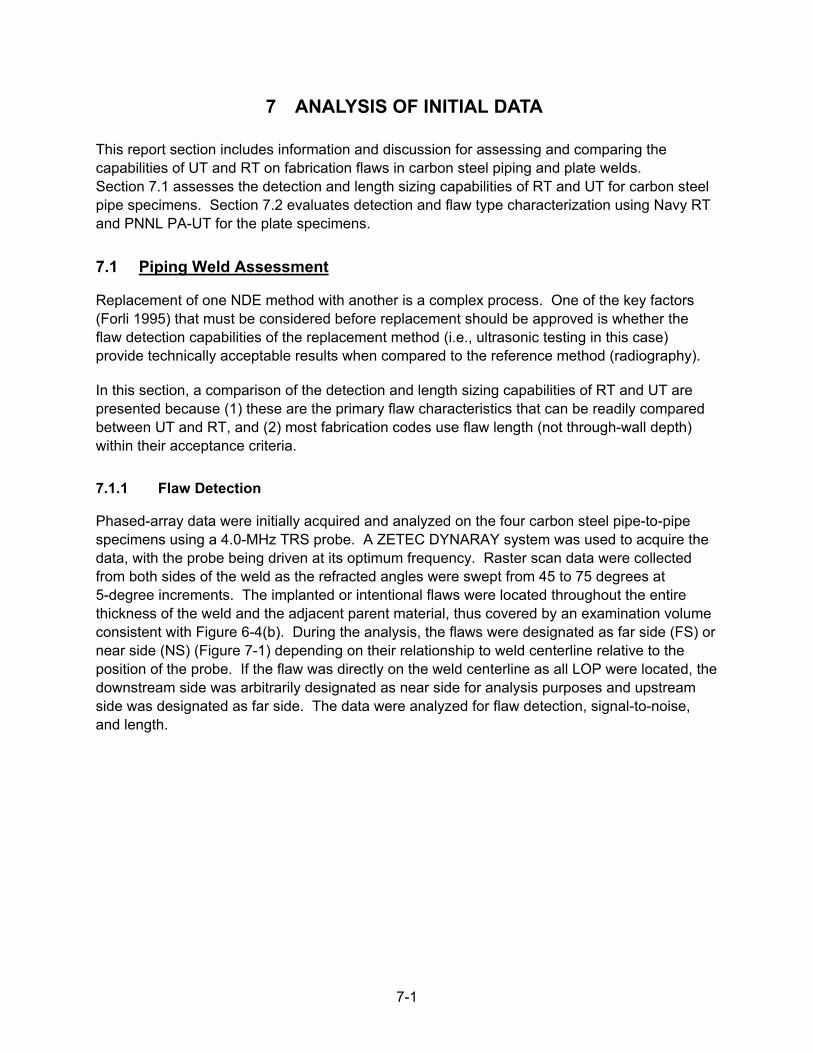
7-1
7 ANALYSIS OF INITIAL DATA
This report section includes information and discussion for assessing and comparing the capabilities of UT and RT on fabrication flaws in carbon steel piping and plate welds. Section 7.1 assesses the detection and length sizing capabilities of RT and UT for carbon steel pipe specimens. Section 7.2 evaluates detection and flaw type characterization using Navy RT and PNNL PA-UT for the plate specimens.
7.1 Piping Weld Assessment
Replacement of one NDE method with another is a complex process. One of the key factors (Forli 1995) that must be considered before replacement should be approved is whether the flaw detection capabilities of the replacement method (i.e., ultrasonic testing in this case) provide technically acceptable results when compared to the reference method (radiography).
In this section, a comparison of the detection and length sizing capabilities of RT and UT are presented because (1) these are the primary flaw characteristics that can be readily compared between UT and RT, and (2) most fabrication codes use flaw length (not through-wall depth) within their acceptance criteria.
7.1.1 Flaw Detection
Phased-array data were initially acquired and analyzed on the four carbon steel pipe-to-pipe specimens using a 4.0-MHz TRS probe. A ZETEC DYNARAY system was used to acquire the data, with the probe being driven at its optimum frequency. Raster scan data were collected from both sides of the weld as the refracted angles were swept from 45 to 75 degrees at 5-degree increments. The implanted or intentional flaws were located throughout the entire thickness of the weld and the adjacent parent material, thus covered by an examination volume consistent with Figure 6-4(b). During the analysis, the flaws were designated as far side (FS) or near side (NS) (Figure 7-1) depending on their relationship to weld centerline relative to the position of the probe. If the flaw was directly on the weld centerline as all LOP were located, the downstream side was arbitrarily designated as near side for analysis purposes and upstream side was designated as far side. The data were analyzed for flaw detection, signal-to-noise, and length.
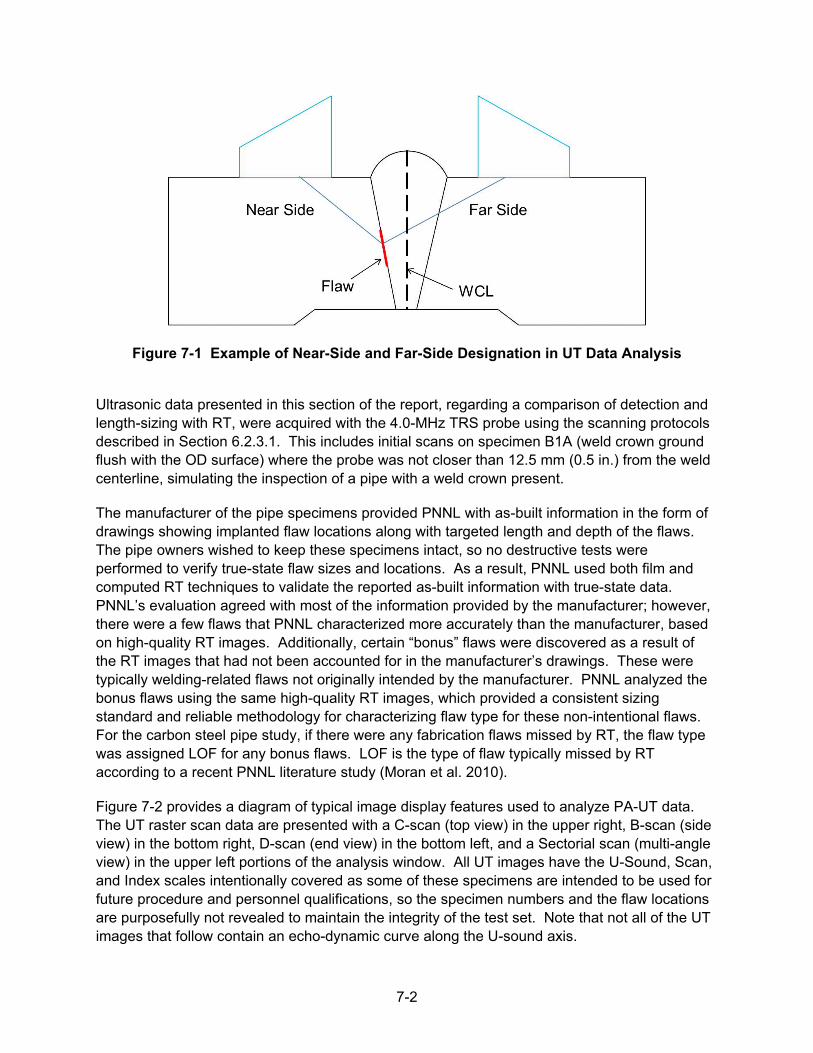
7-2
Figure 7-1 Example of Near-Side and Far-Side Designation in UT Data Analysis
Ultrasonic data presented in this section of the report, regarding a comparison of detection and length-sizing with RT, were acquired with the 4.0-MHz TRS probe using the scanning protocols described in Section 6.2.3.1. This includes initial scans on specimen B1A (weld crown ground flush with the OD surface) where the probe was not closer than 12.5 mm (0.5 in.) from the weld centerline, simulating the inspection of a pipe with a weld crown present.
The manufacturer of the pipe specimens provided PNNL with as-built information in the form of drawings showing implanted flaw locations along with targeted length and depth of the flaws. The pipe owners wished to keep these specimens intact, so no destructive tests were performed to verify true-state flaw sizes and locations. As a result, PNNL used both film and computed RT techniques to validate the reported as-built information with true-state data. PNNL’s evaluation agreed with most of the information provided by the manufacturer; however, there were a few flaws that PNNL characterized more accurately than the manufacturer, based on high-quality RT images. Additionally, certain “bonus” flaws were discovered as a result of the RT images that had not been accounted for in the manufacturer’s drawings. These were typically welding-related flaws not originally intended by the manufacturer. PNNL analyzed the bonus flaws using the same high-quality RT images, which provided a consistent sizing standard and reliable methodology for characterizing flaw type for these non-intentional flaws. For the carbon steel pipe study, if there were any fabrication flaws missed by RT, the flaw type was assigned LOF for any bonus flaws. LOF is the type of flaw typically missed by RT according to a recent PNNL literature study (Moran et al. 2010).
Figure 7-2 provides a diagram of typical image display features used to analyze PA-UT data. The UT raster scan data are presented with a C-scan (top view) in the upper right, B-scan (side view) in the bottom right, D-scan (end view) in the bottom left, and a Sectorial scan (multi-angle view) in the upper left portions of the analysis window. All UT images have the U-Sound, Scan, and Index scales intentionally covered as some of these specimens are intended to be used for future procedure and personnel qualifications, so the specimen numbers and the flaw locations are purposefully not revealed to maintain the integrity of the test set. Note that not all of the UT images that follow contain an echo-dynamic curve along the U-sound axis.
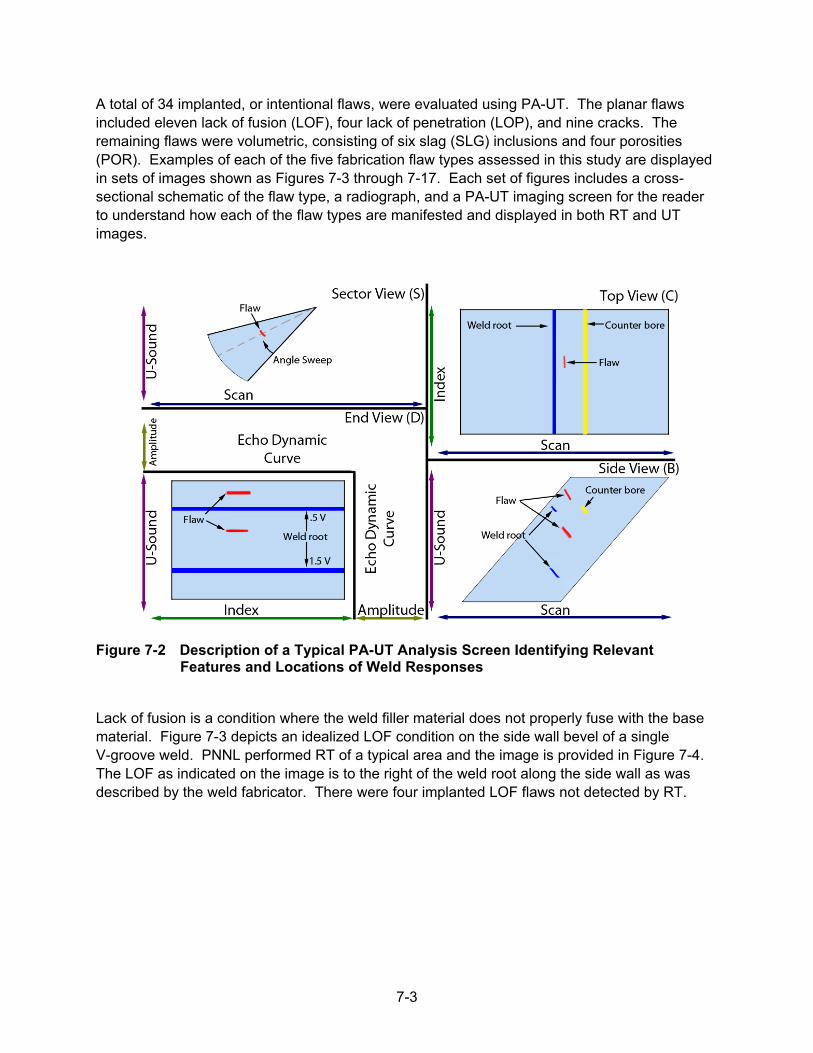
7-3
A total of 34 implanted, or intentional flaws, were evaluated using PA-UT. The planar flaws included eleven lack of fusion (LOF), four lack of penetration (LOP), and nine cracks. The remaining flaws were volumetric, consisting of six slag (SLG) inclusions and four porosities (POR). Examples of each of the five fabrication flaw types assessed in this study are displayed in sets of images shown as Figures 7-3 through 7-17. Each set of figures includes a cross-sectional schematic of the flaw type, a radiograph, and a PA-UT imaging screen for the reader to understand how each of the flaw types are manifested and displayed in both RT and UT images.
Figure 7-2 Description of a Typical PA-UT Analysis Screen Identifying Relevant Features and Locations of Weld Responses
Lack of fusion is a condition where the weld filler material does not properly fuse with the base material. Figure 7-3 depicts an idealized LOF condition on the side wall bevel of a single V-groove weld. PNNL performed RT of a typical area and the image is provided in Figure 7-4. The LOF as indicated on the image is to the right of the weld root along the side wall as was described by the weld fabricator. There were four implanted LOF flaws not detected by RT.
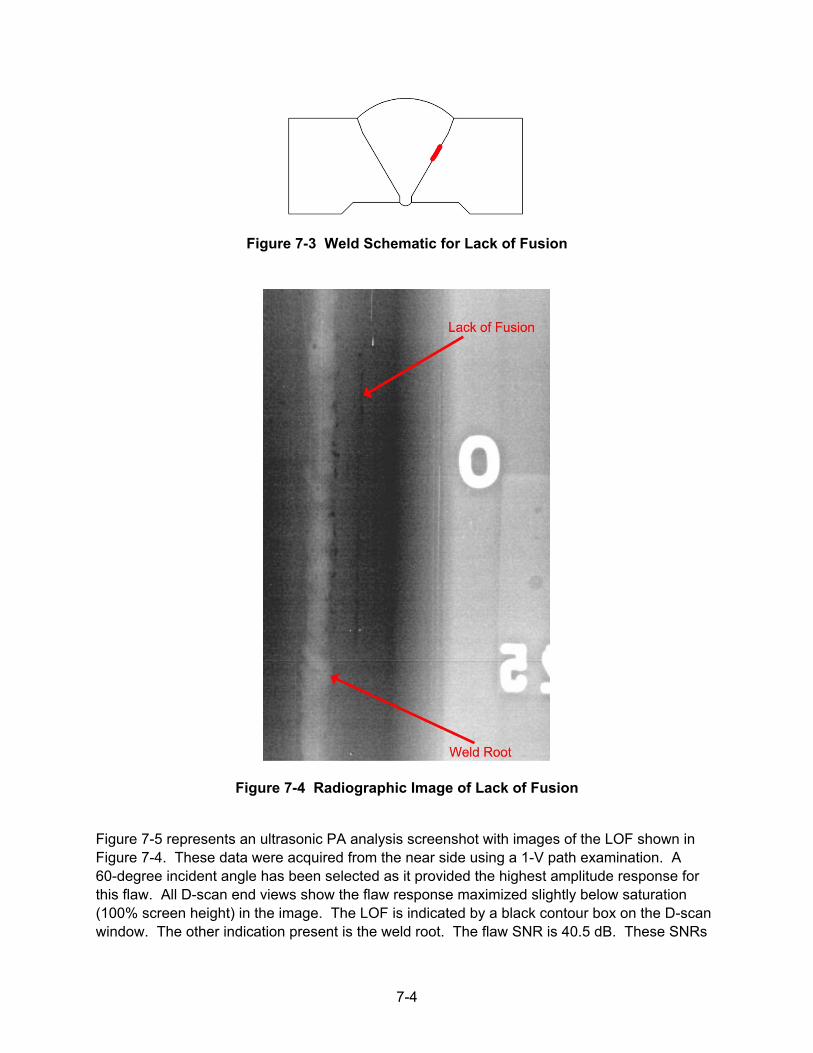
7-4
Figure 7-3 Weld Schematic for Lack of Fusion
Figure 7-4 Radiographic Image of Lack of Fusion
Figure 7-5 represents an ultrasonic PA analysis screenshot with images of the LOF shown in Figure 7-4. These data were acquired from the near side using a 1-V path examination. A 60-degree incident angle has been selected as it provided the highest amplitude response for this flaw. All D-scan end views show the flaw response maximized slightly below saturation (100% screen height) in the image. The LOF is indicated by a black contour box on the D-scan window. The other indication present is the weld root. The flaw SNR is 40.5 dB. These SNRs
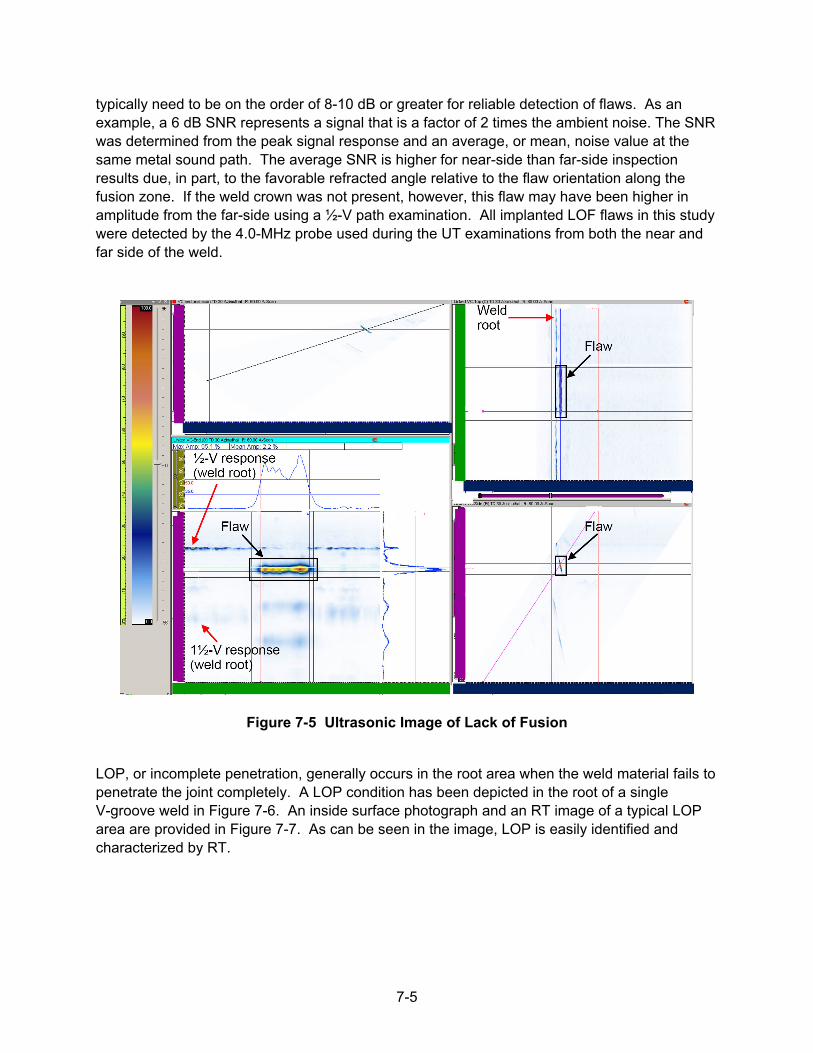
7-5
typically need to be on the order of 8-10 dB or greater for reliable detection of flaws. As an example, a 6 dB SNR represents a signal that is a factor of 2 times the ambient noise. The SNR was determined from the peak signal response and an average, or mean, noise value at the same metal sound path. The average SNR is higher for near-side than far-side inspection results due, in part, to the favorable refracted angle relative to the flaw orientation along the fusion zone. If the weld crown was not present, however, this flaw may have been higher in amplitude from the far-side using a ½-V path examination. All implanted LOF flaws in this study were detected by the 4.0-MHz probe used during the UT examinations from both the near and far side of the weld.
Figure 7-5 Ultrasonic Image of Lack of Fusion
LOP, or incomplete penetration, generally occurs in the root area when the weld material fails to penetrate the joint completely. A LOP condition has been depicted in the root of a single V-groove weld in Figure 7-6. An inside surface photograph and an RT image of a typical LOP area are provided in Figure 7-7. As can be seen in the image, LOP is easily identified and characterized by RT.
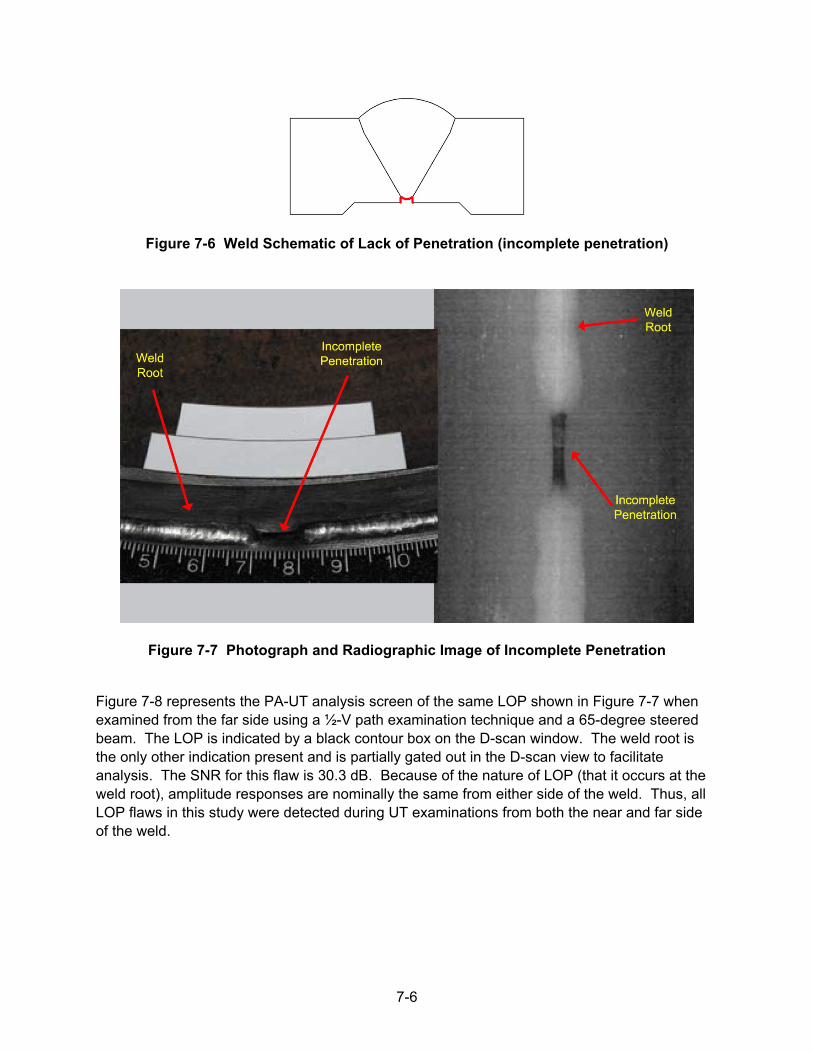
7-6
Figure 7-6 Weld Schematic of Lack of Penetration (incomplete penetration)
Figure 7-7 Photograph and Radiographic Image of Incomplete Penetration
Figure 7-8 represents the PA-UT analysis screen of the same LOP shown in Figure 7-7 when examined from the far side using a ½-V path examination technique and a 65-degree steered beam. The LOP is indicated by a black contour box on the D-scan window. The weld root is the only other indication present and is partially gated out in the D-scan view to facilitate analysis. The SNR for this flaw is 30.3 dB. Because of the nature of LOP (that it occurs at the weld root), amplitude responses are nominally the same from either side of the weld. Thus, all LOP flaws in this study were detected during UT examinations from both the near and far side of the weld.
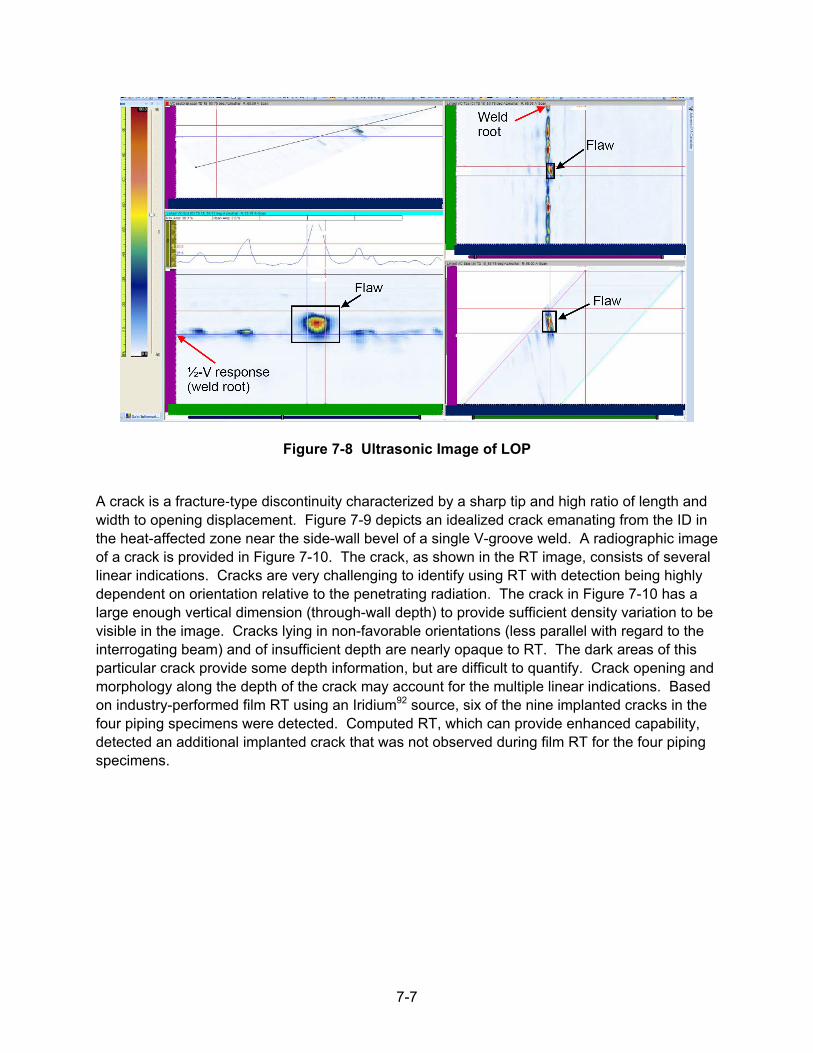
7-7
Figure 7-8 Ultrasonic Image of LOP
A crack is a fracture‐type discontinuity characterized by a sharp tip and high ratio of length and width to opening displacement. Figure 7-9 depicts an idealized crack emanating from the ID in the heat-affected zone near the side-wall bevel of a single V-groove weld. A radiographic image of a crack is provided in Figure 7-10. The crack, as shown in the RT image, consists of several linear indications. Cracks are very challenging to identify using RT with detection being highly dependent on orientation relative to the penetrating radiation. The crack in Figure 7-10 has a large enough vertical dimension (through-wall depth) to provide sufficient density variation to be visible in the image. Cracks lying in non-favorable orientations (less parallel with regard to the interrogating beam) and of insufficient depth are nearly opaque to RT. The dark areas of this particular crack provide some depth information, but are difficult to quantify. Crack opening and morphology along the depth of the crack may account for the multiple linear indications. Based on industry-performed film RT using an Iridium92 source, six of the nine implanted cracks in the four piping specimens were detected. Computed RT, which can provide enhanced capability, detected an additional implanted crack that was not observed during film RT for the four piping specimens.
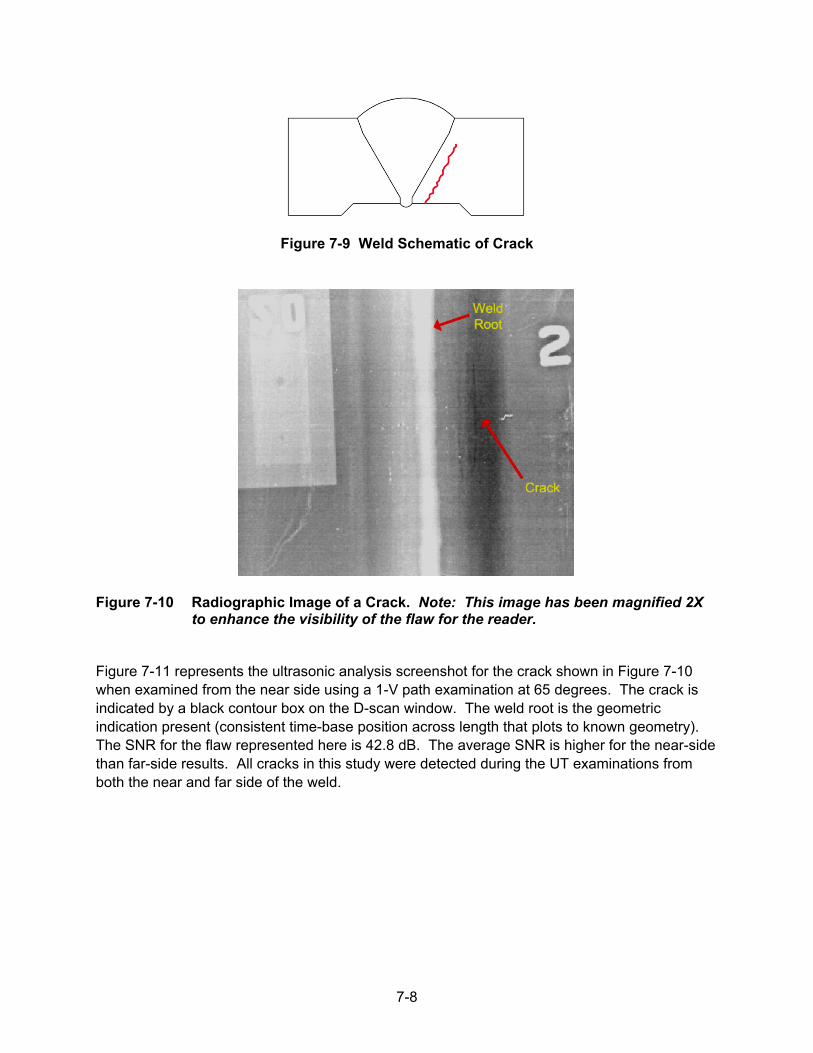
7-8
Figure 7-9 Weld Schematic of Crack
Figure 7-10 Radiographic Image of a Crack. Note: This image has been magnified 2X to enhance the visibility of the flaw for the reader.
Figure 7-11 represents the ultrasonic analysis screenshot for the crack shown in Figure 7-10 when examined from the near side using a 1-V path examination at 65 degrees. The crack is indicated by a black contour box on the D-scan window. The weld root is the geometric indication present (consistent time-base position across length that plots to known geometry). The SNR for the flaw represented here is 42.8 dB. The average SNR is higher for the near-side than far-side results. All cracks in this study were detected during the UT examinations from both the near and far side of the weld.
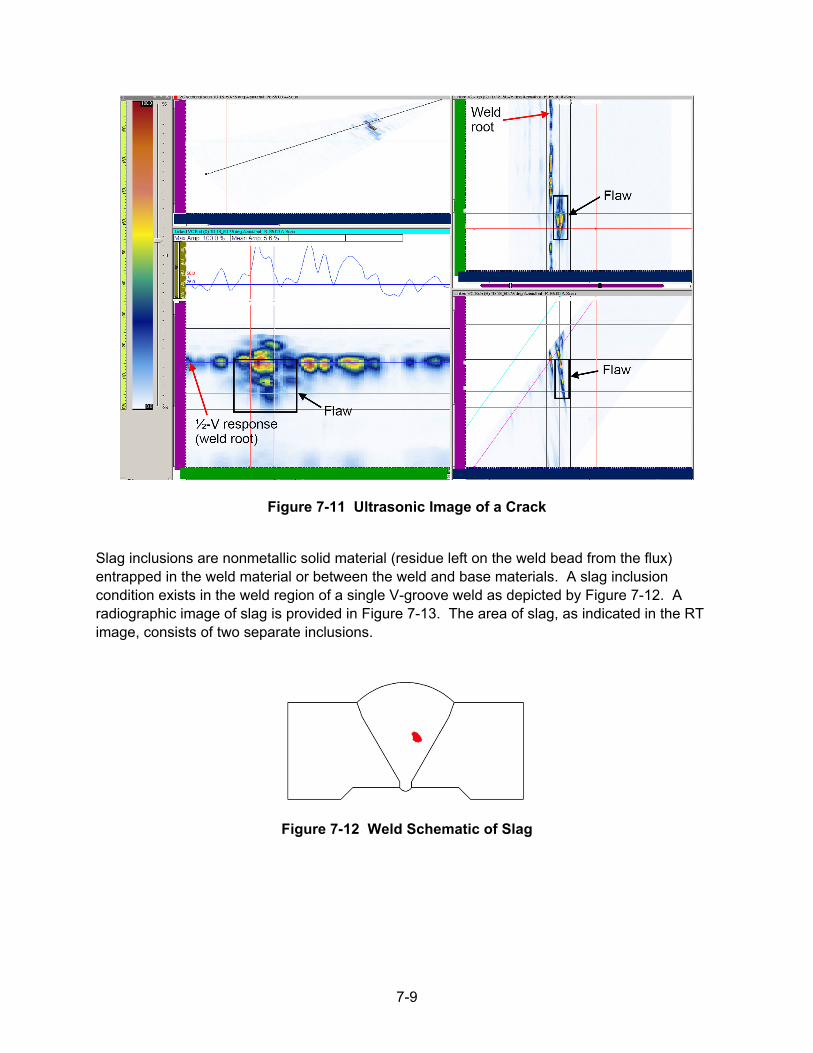
7-9
Figure 7-11 Ultrasonic Image of a Crack
Slag inclusions are nonmetallic solid material (residue left on the weld bead from the flux) entrapped in the weld material or between the weld and base materials. A slag inclusion condition exists in the weld region of a single V-groove weld as depicted by Figure 7-12. A radiographic image of slag is provided in Figure 7-13. The area of slag, as indicated in the RT image, consists of two separate inclusions.
Figure 7-12 Weld Schematic of Slag
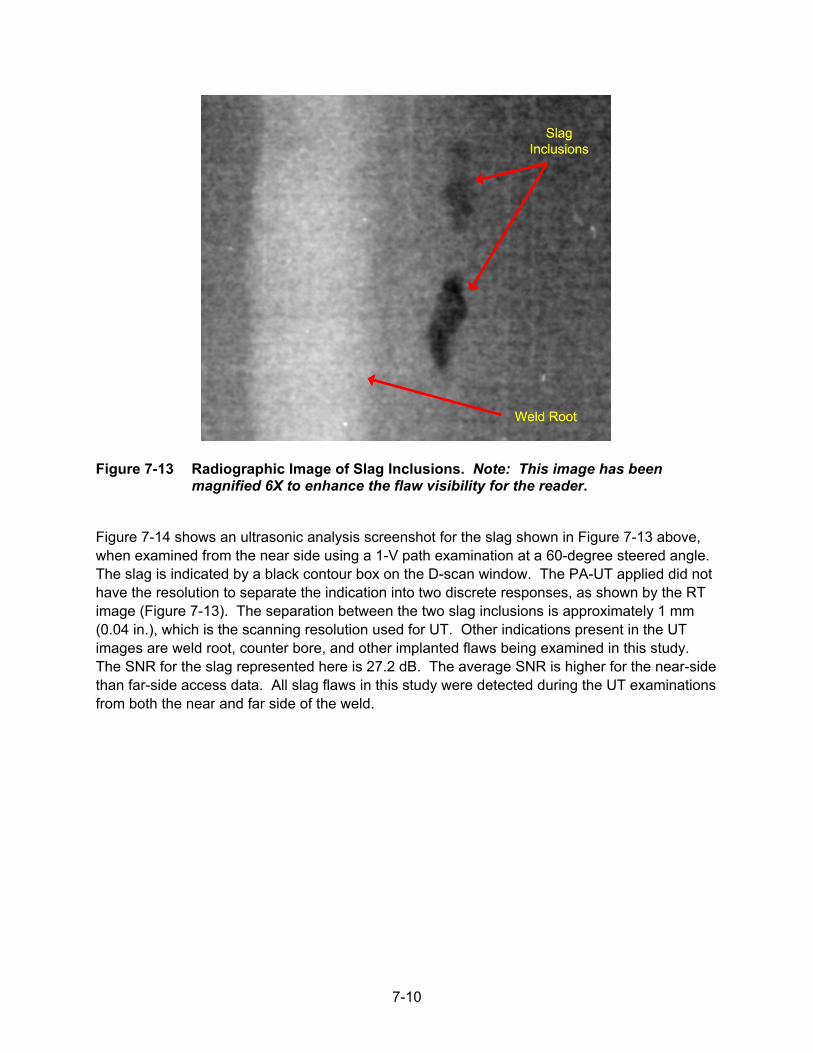
7-10
Figure 7-13 Radiographic Image of Slag Inclusions. Note: This image has been magnified 6X to enhance the flaw visibility for the reader.
Figure 7-14 shows an ultrasonic analysis screenshot for the slag shown in Figure 7-13 above, when examined from the near side using a 1-V path examination at a 60-degree steered angle. The slag is indicated by a black contour box on the D-scan window. The PA-UT applied did not have the resolution to separate the indication into two discrete responses, as shown by the RT image (Figure 7-13). The separation between the two slag inclusions is approximately 1 mm (0.04 in.), which is the scanning resolution used for UT. Other indications present in the UT images are weld root, counter bore, and other implanted flaws being examined in this study. The SNR for the slag represented here is 27.2 dB. The average SNR is higher for the near-side than far-side access data. All slag flaws in this study were detected during the UT examinations from both the near and far side of the weld.
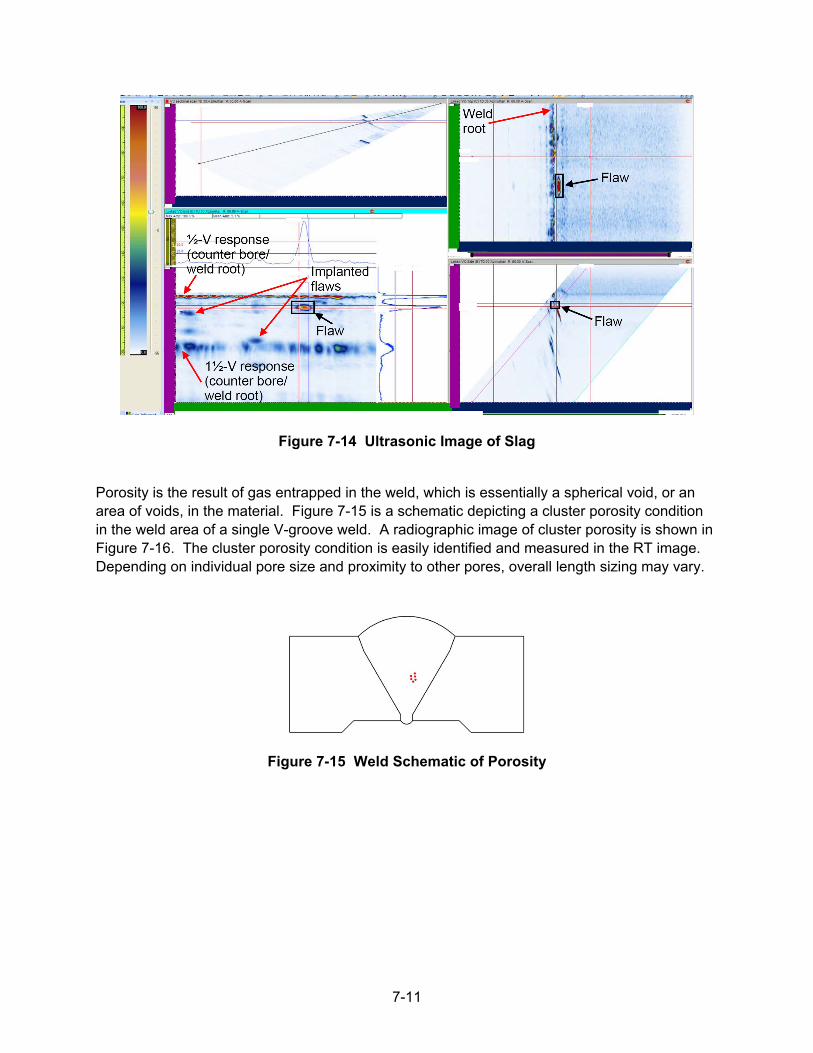
7-11
Figure 7-14 Ultrasonic Image of Slag
Porosity is the result of gas entrapped in the weld, which is essentially a spherical void, or an area of voids, in the material. Figure 7-15 is a schematic depicting a cluster porosity condition in the weld area of a single V-groove weld. A radiographic image of cluster porosity is shown in Figure 7-16. The cluster porosity condition is easily identified and measured in the RT image. Depending on individual pore size and proximity to other pores, overall length sizing may vary.
Figure 7-15 Weld Schematic of Porosity
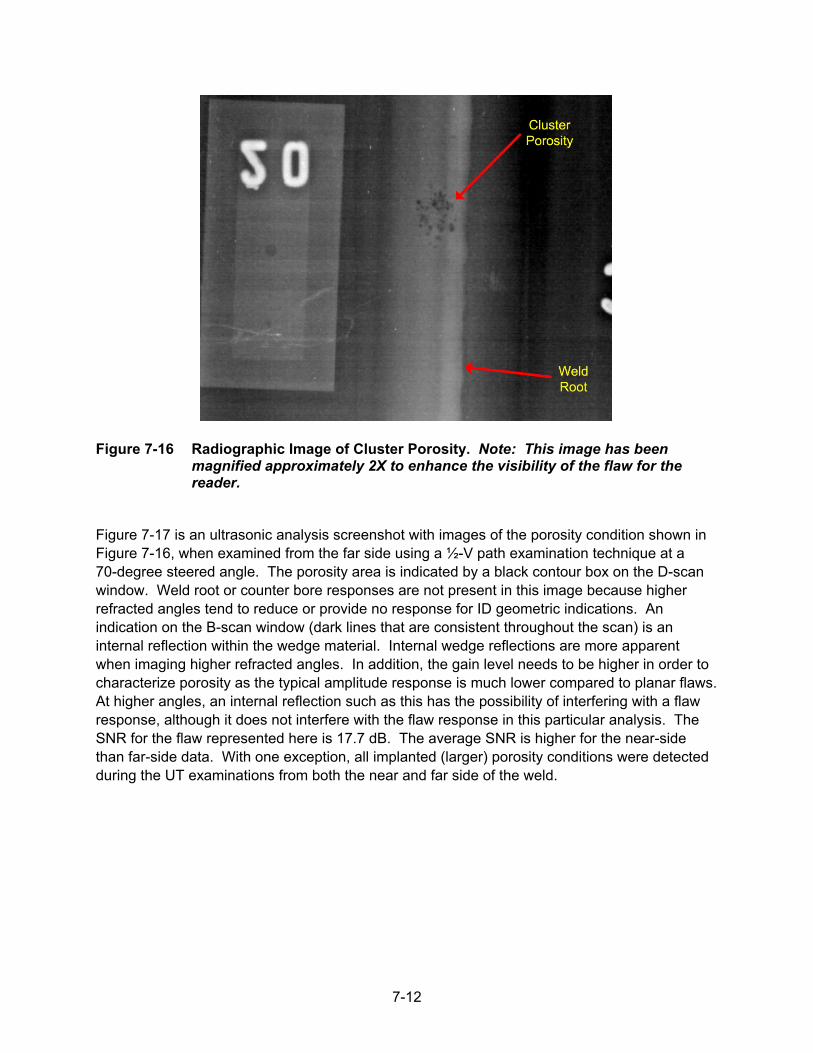
7-12
Figure 7-16 Radiographic Image of Cluster Porosity. Note: This image has been magnified approximately 2X to enhance the visibility of the flaw for the reader.
Figure 7-17 is an ultrasonic analysis screenshot with images of the porosity condition shown in Figure 7-16, when examined from the far side using a ½-V path examination technique at a 70-degree steered angle. The porosity area is indicated by a black contour box on the D-scan window. Weld root or counter bore responses are not present in this image because higher refracted angles tend to reduce or provide no response for ID geometric indications. An indication on the B-scan window (dark lines that are consistent throughout the scan) is an internal reflection within the wedge material. Internal wedge reflections are more apparent when imaging higher refracted angles. In addition, the gain level needs to be higher in order to characterize porosity as the typical amplitude response is much lower compared to planar flaws. At higher angles, an internal reflection such as this has the possibility of interfering with a flaw response, although it does not interfere with the flaw response in this particular analysis. The SNR for the flaw represented here is 17.7 dB. The average SNR is higher for the near-side than far-side data. With one exception, all implanted (larger) porosity conditions were detected during the UT examinations from both the near and far side of the weld.
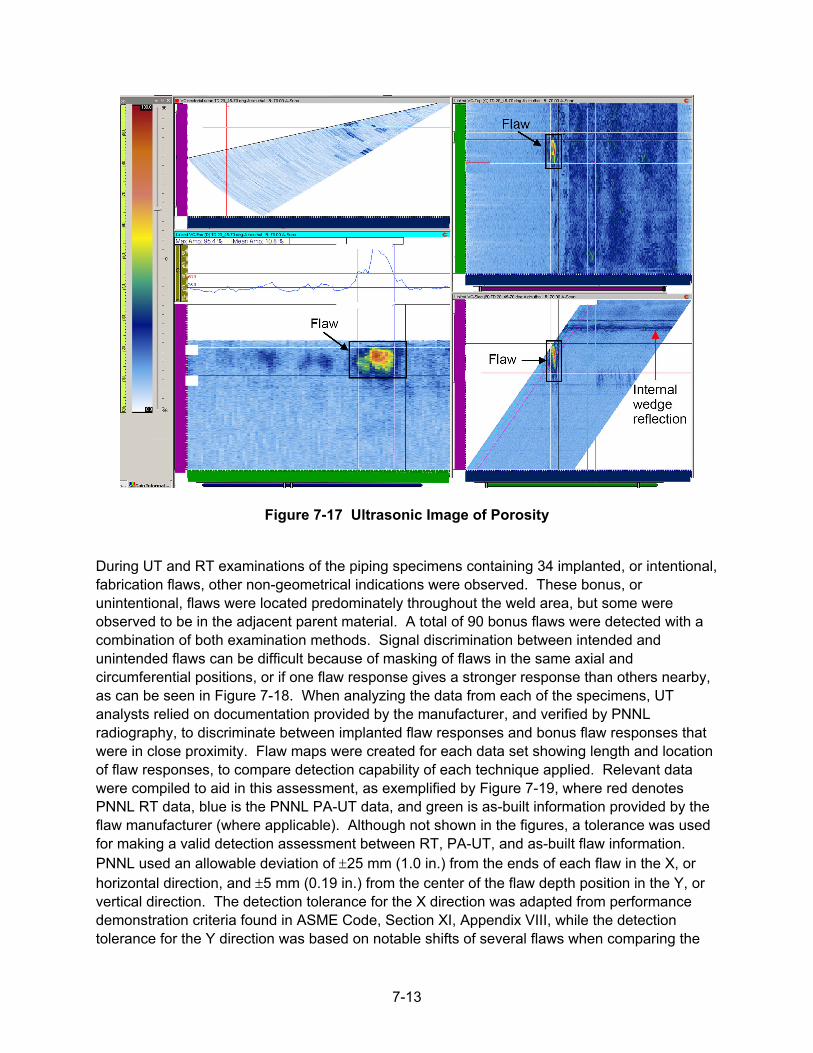
7-13
Figure 7-17 Ultrasonic Image of Porosity
During UT and RT examinations of the piping specimens containing 34 implanted, or intentional, fabrication flaws, other non-geometrical indications were observed. These bonus, or unintentional, flaws were located predominately throughout the weld area, but some were observed to be in the adjacent parent material. A total of 90 bonus flaws were detected with a combination of both examination methods. Signal discrimination between intended and unintended flaws can be difficult because of masking of flaws in the same axial and circumferential positions, or if one flaw response gives a stronger response than others nearby, as can be seen in Figure 7-18. When analyzing the data from each of the specimens, UT analysts relied on documentation provided by the manufacturer, and verified by PNNL radiography, to discriminate between implanted flaw responses and bonus flaw responses that were in close proximity. Flaw maps were created for each data set showing length and location of flaw responses, to compare detection capability of each technique applied. Relevant data were compiled to aid in this assessment, as exemplified by Figure 7-19, where red denotes PNNL RT data, blue is the PNNL PA-UT data, and green is as-built information provided by the flaw manufacturer (where applicable). Although not shown in the figures, a tolerance was used for making a valid detection assessment between RT, PA-UT, and as-built flaw information. PNNL used an allowable deviation of ±25 mm (1.0 in.) from the ends of each flaw in the X, or horizontal direction, and ±5 mm (0.19 in.) from the center of the flaw depth position in the Y, or vertical direction. The detection tolerance for the X direction was adapted from performance demonstration criteria found in ASME Code, Section XI, Appendix VIII, while the detection tolerance for the Y direction was based on notable shifts of several flaws when comparing the
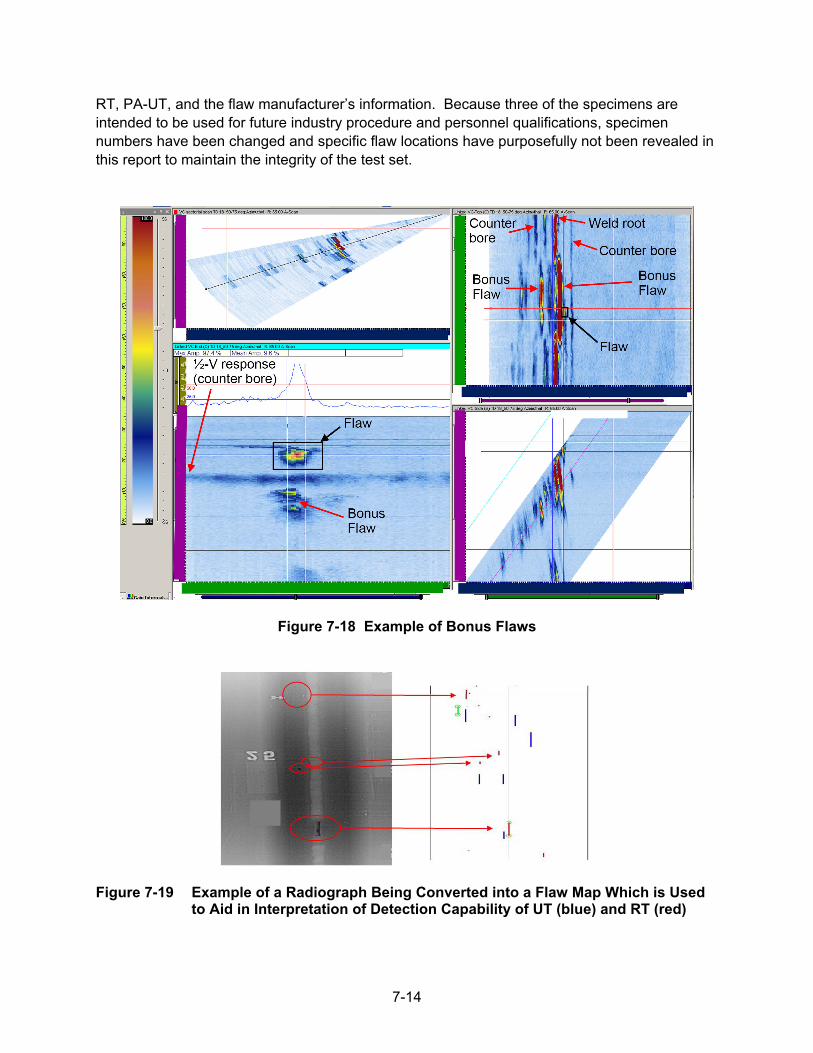
7-14
RT, PA-UT, and the flaw manufacturer’s information. Because three of the specimens are intended to be used for future industry procedure and personnel qualifications, specimen numbers have been changed and specific flaw locations have purposefully not been revealed in this report to maintain the integrity of the test set.
Figure 7-18 Example of Bonus Flaws
Figure 7-19 Example of a Radiograph Being Converted into a Flaw Map Which is Used to Aid in Interpretation of Detection Capability of UT (blue) and RT (red)
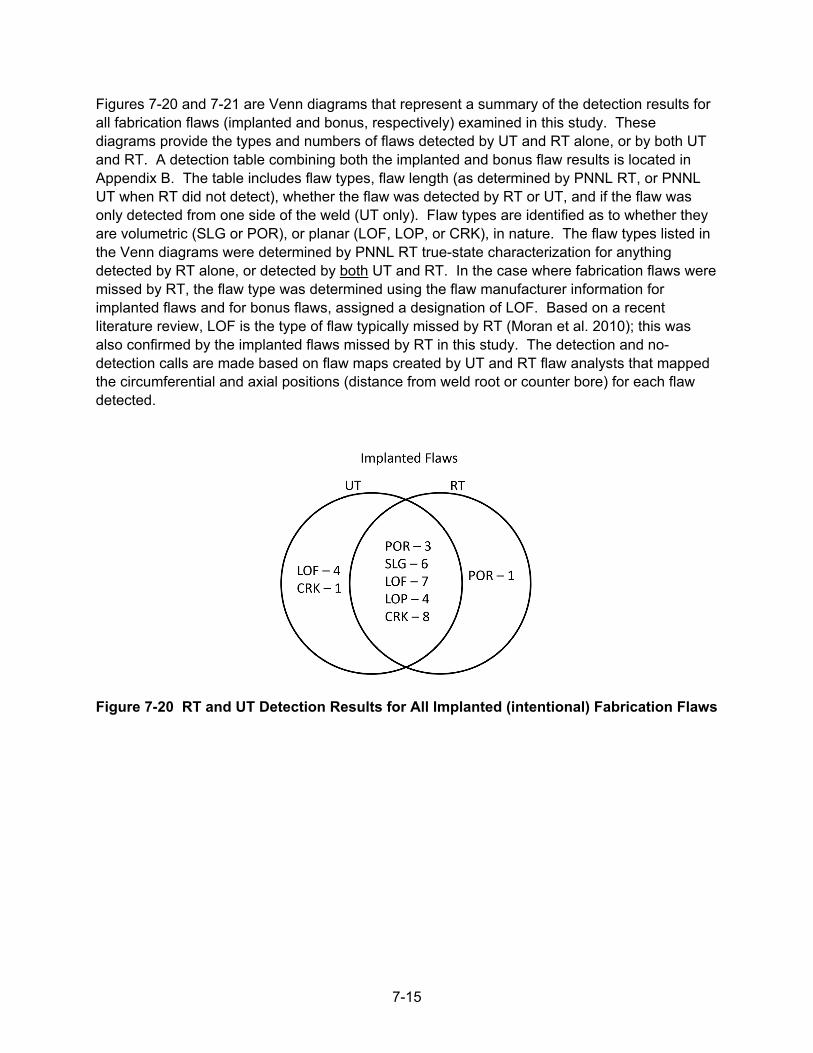
7-15
Figures 7-20 and 7-21 are Venn diagrams that represent a summary of the detection results for all fabrication flaws (implanted and bonus, respectively) examined in this study. These diagrams provide the types and numbers of flaws detected by UT and RT alone, or by both UT and RT. A detection table combining both the implanted and bonus flaw results is located in Appendix B. The table includes flaw types, flaw length (as determined by PNNL RT, or PNNL UT when RT did not detect), whether the flaw was detected by RT or UT, and if the flaw was only detected from one side of the weld (UT only). Flaw types are identified as to whether they are volumetric (SLG or POR), or planar (LOF, LOP, or CRK), in nature. The flaw types listed in the Venn diagrams were determined by PNNL RT true-state characterization for anything detected by RT alone, or detected by both UT and RT. In the case where fabrication flaws were missed by RT, the flaw type was determined using the flaw manufacturer information for implanted flaws and for bonus flaws, assigned a designation of LOF. Based on a recent literature review, LOF is the type of flaw typically missed by RT (Moran et al. 2010); this was also confirmed by the implanted flaws missed by RT in this study. The detection and no-detection calls are made based on flaw maps created by UT and RT flaw analysts that mapped the circumferential and axial positions (distance from weld root or counter bore) for each flaw detected.
Figure 7-20 RT and UT Detection Results for All Implanted (intentional) Fabrication Flaws
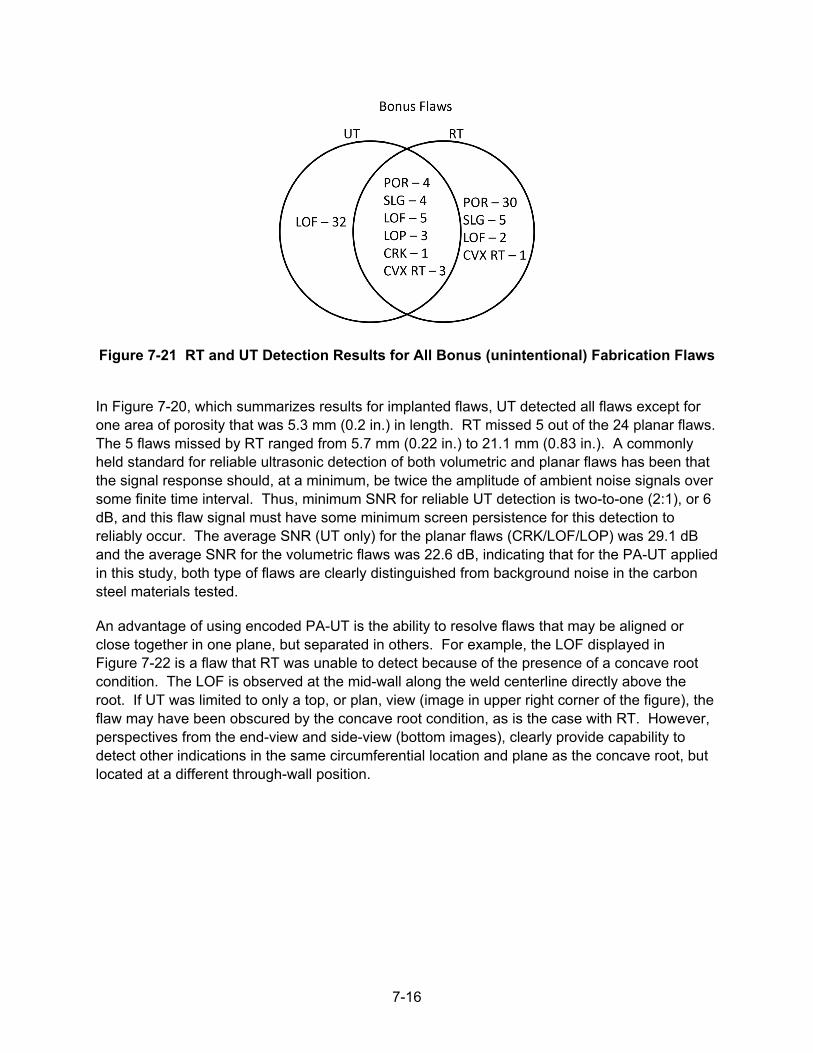
7-16
Figure 7-21 RT and UT Detection Results for All Bonus (unintentional) Fabrication Flaws
In Figure 7-20, which summarizes results for implanted flaws, UT detected all flaws except for one area of porosity that was 5.3 mm (0.2 in.) in length. RT missed 5 out of the 24 planar flaws. The 5 flaws missed by RT ranged from 5.7 mm (0.22 in.) to 21.1 mm (0.83 in.). A commonly held standard for reliable ultrasonic detection of both volumetric and planar flaws has been that the signal response should, at a minimum, be twice the amplitude of ambient noise signals over some finite time interval. Thus, minimum SNR for reliable UT detection is two-to-one (2:1), or 6 dB, and this flaw signal must have some minimum screen persistence for this detection to reliably occur. The average SNR (UT only) for the planar flaws (CRK/LOF/LOP) was 29.1 dB and the average SNR for the volumetric flaws was 22.6 dB, indicating that for the PA-UT applied in this study, both type of flaws are clearly distinguished from background noise in the carbon steel materials tested.
An advantage of using encoded PA-UT is the ability to resolve flaws that may be aligned or close together in one plane, but separated in others. For example, the LOF displayed in Figure 7-22 is a flaw that RT was unable to detect because of the presence of a concave root condition. The LOF is observed at the mid-wall along the weld centerline directly above the root. If UT was limited to only a top, or plan, view (image in upper right corner of the figure), the flaw may have been obscured by the concave root condition, as is the case with RT. However, perspectives from the end-view and side-view (bottom images), clearly provide capability to detect other indications in the same circumferential location and plane as the concave root, but located at a different through-wall position.
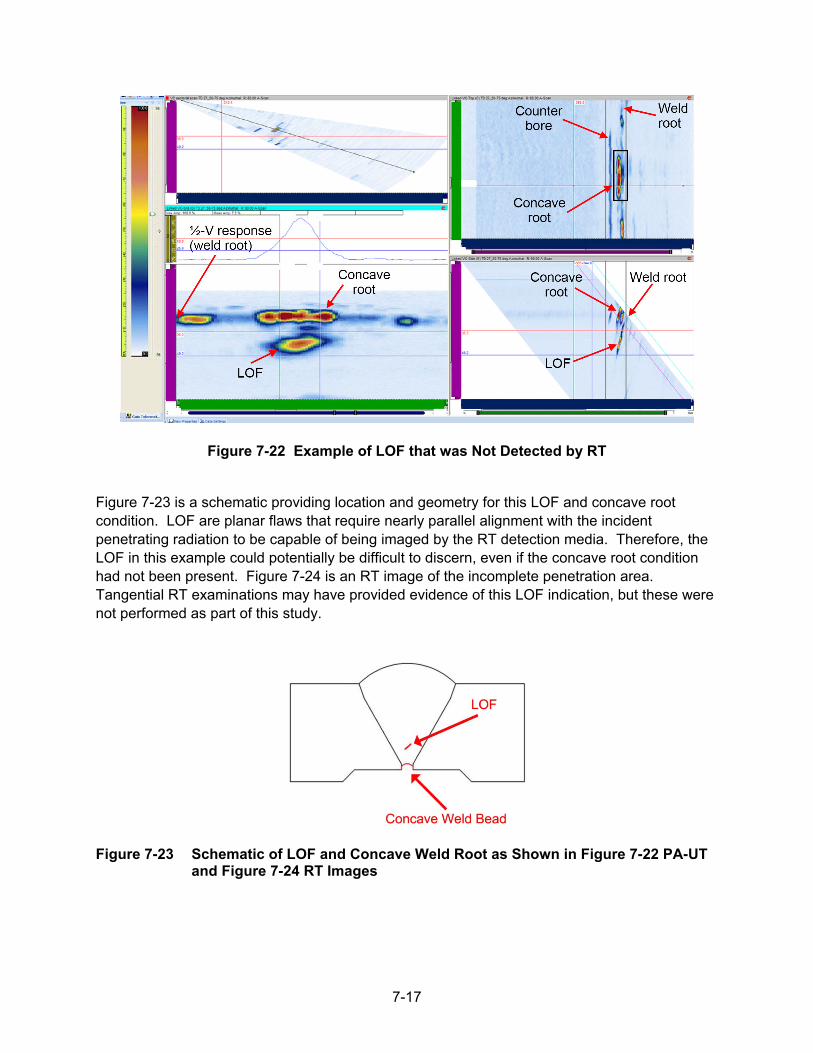
7-17
Figure 7-22 Example of LOF that was Not Detected by RT
Figure 7-23 is a schematic providing location and geometry for this LOF and concave root condition. LOF are planar flaws that require nearly parallel alignment with the incident penetrating radiation to be capable of being imaged by the RT detection media. Therefore, the LOF in this example could potentially be difficult to discern, even if the concave root condition had not been present. Figure 7-24 is an RT image of the incomplete penetration area. Tangential RT examinations may have provided evidence of this LOF indication, but these were not performed as part of this study.
Figure 7-23 Schematic of LOF and Concave Weld Root as Shown in Figure 7-22 PA-UT and Figure 7-24 RT Images
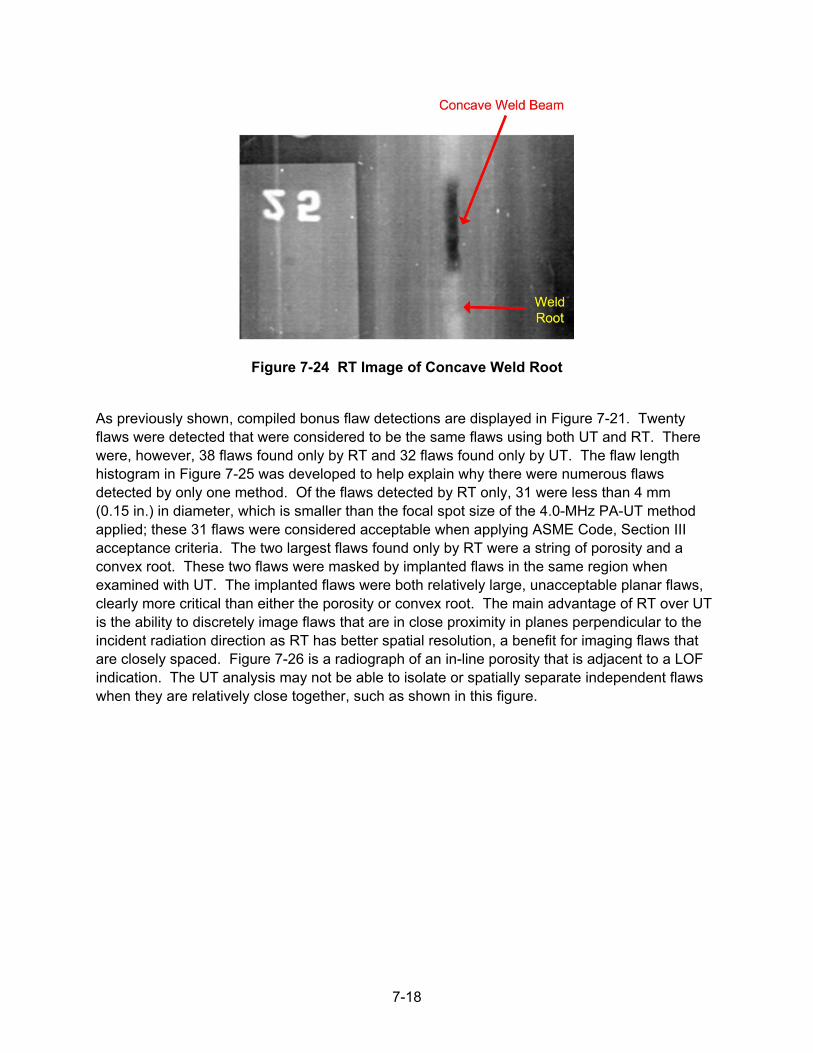
7-18
Figure 7-24 RT Image of Concave Weld Root
As previously shown, compiled bonus flaw detections are displayed in Figure 7-21. Twenty flaws were detected that were considered to be the same flaws using both UT and RT. There were, however, 38 flaws found only by RT and 32 flaws found only by UT. The flaw length histogram in Figure 7-25 was developed to help explain why there were numerous flaws detected by only one method. Of the flaws detected by RT only, 31 were less than 4 mm (0.15 in.) in diameter, which is smaller than the focal spot size of the 4.0-MHz PA-UT method applied; these 31 flaws were considered acceptable when applying ASME Code, Section III acceptance criteria. The two largest flaws found only by RT were a string of porosity and a convex root. These two flaws were masked by implanted flaws in the same region when examined with UT. The implanted flaws were both relatively large, unacceptable planar flaws, clearly more critical than either the porosity or convex root. The main advantage of RT over UT is the ability to discretely image flaws that are in close proximity in planes perpendicular to the incident radiation direction as RT has better spatial resolution, a benefit for imaging flaws that are closely spaced. Figure 7-26 is a radiograph of an in-line porosity that is adjacent to a LOF indication. The UT analysis may not be able to isolate or spatially separate independent flaws when they are relatively close together, such as shown in this figure.
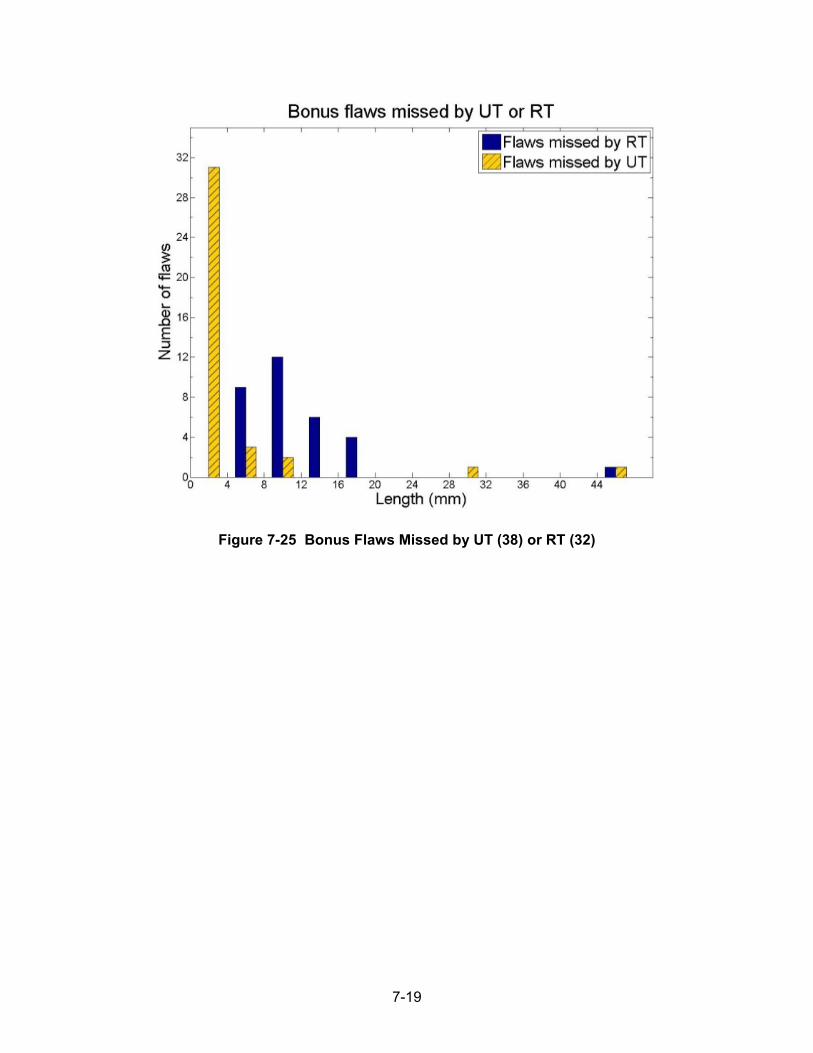
7-19
Figure 7-25 Bonus Flaws Missed by UT (38) or RT (32)
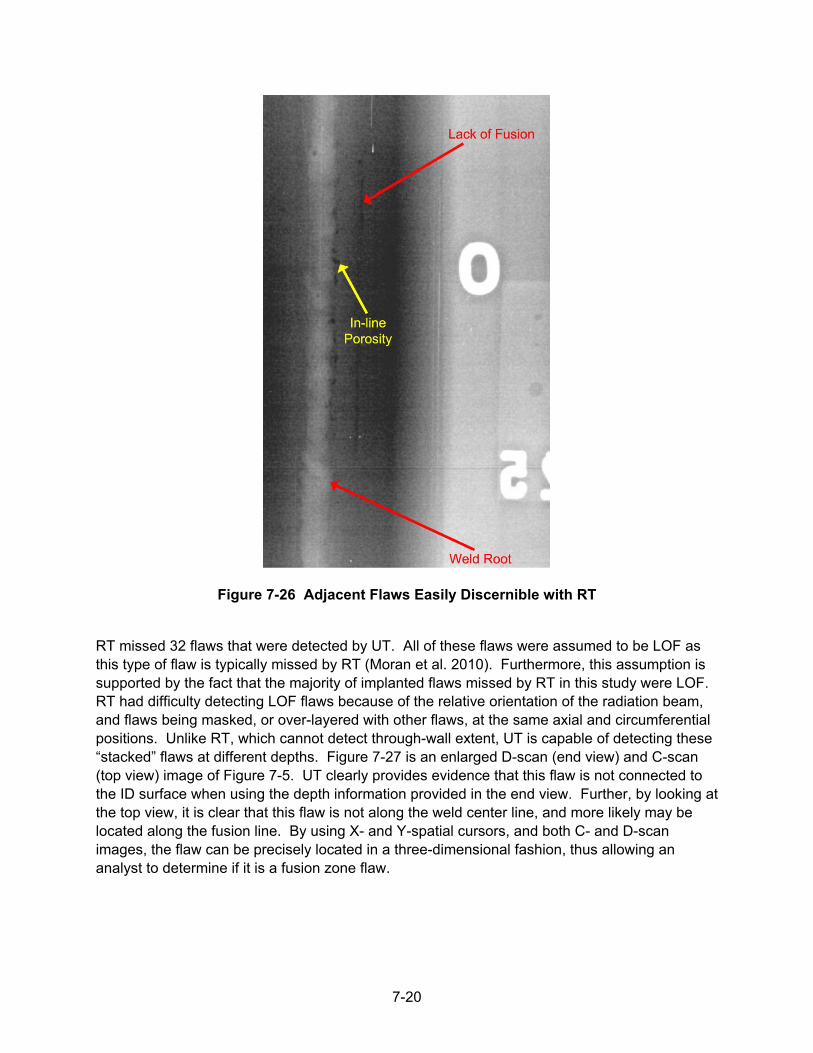
7-20
Figure 7-26 Adjacent Flaws Easily Discernible with RT
RT missed 32 flaws that were detected by UT. All of these flaws were assumed to be LOF as this type of flaw is typically missed by RT (Moran et al. 2010). Furthermore, this assumption is supported by the fact that the majority of implanted flaws missed by RT in this study were LOF. RT had difficulty detecting LOF flaws because of the relative orientation of the radiation beam, and flaws being masked, or over-layered with other flaws, at the same axial and circumferential positions. Unlike RT, which cannot detect through-wall extent, UT is capable of detecting these “stacked” flaws at different depths. Figure 7-27 is an enlarged D-scan (end view) and C-scan (top view) image of Figure 7-5. UT clearly provides evidence that this flaw is not connected to the ID surface when using the depth information provided in the end view. Further, by looking at the top view, it is clear that this flaw is not along the weld center line, and more likely may be located along the fusion line. By using X- and Y-spatial cursors, and both C- and D-scan images, the flaw can be precisely located in a three-dimensional fashion, thus allowing an analyst to determine if it is a fusion zone flaw.
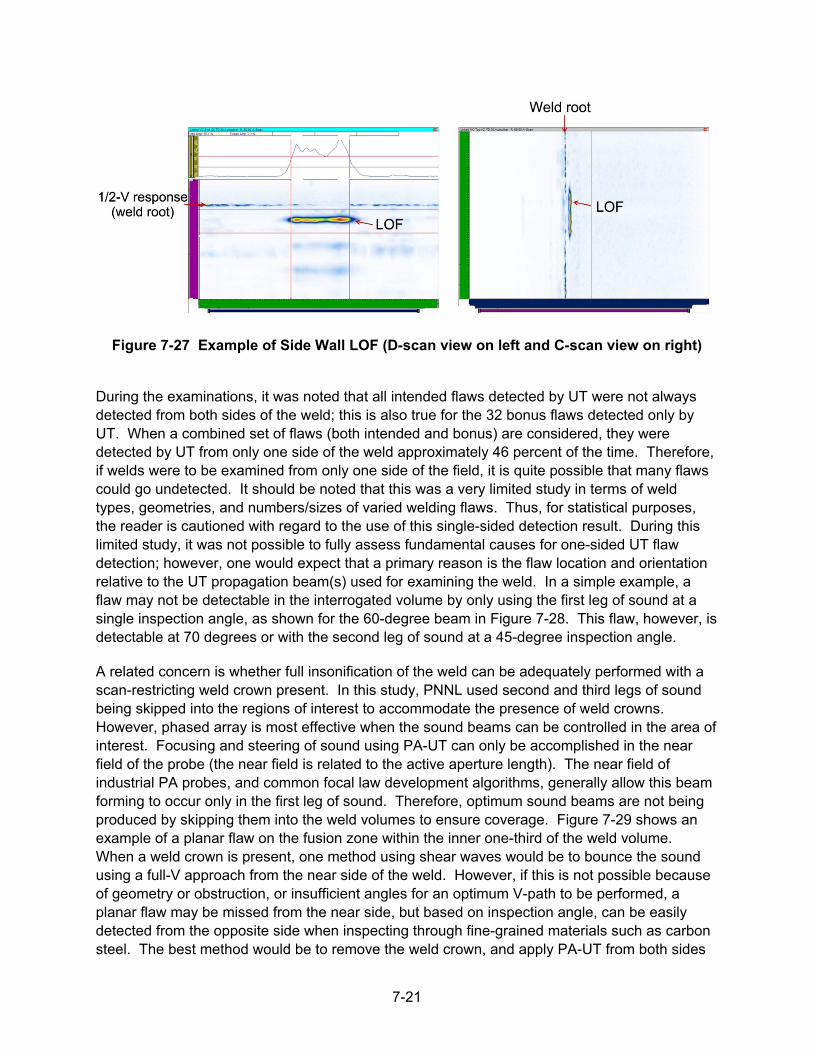
7-21
Figure 7-27 Example of Side Wall LOF (D-scan view on left and C-scan view on right)
During the examinations, it was noted that all intended flaws detected by UT were not always detected from both sides of the weld; this is also true for the 32 bonus flaws detected only by UT. When a combined set of flaws (both intended and bonus) are considered, they were detected by UT from only one side of the weld approximately 46 percent of the time. Therefore, if welds were to be examined from only one side of the field, it is quite possible that many flaws could go undetected. It should be noted that this was a very limited study in terms of weld types, geometries, and numbers/sizes of varied welding flaws. Thus, for statistical purposes, the reader is cautioned with regard to the use of this single-sided detection result. During this limited study, it was not possible to fully assess fundamental causes for one-sided UT flaw detection; however, one would expect that a primary reason is the flaw location and orientation relative to the UT propagation beam(s) used for examining the weld. In a simple example, a flaw may not be detectable in the interrogated volume by only using the first leg of sound at a single inspection angle, as shown for the 60-degree beam in Figure 7-28. This flaw, however, is detectable at 70 degrees or with the second leg of sound at a 45-degree inspection angle.
A related concern is whether full insonification of the weld can be adequately performed with a scan-restricting weld crown present. In this study, PNNL used second and third legs of sound being skipped into the regions of interest to accommodate the presence of weld crowns. However, phased array is most effective when the sound beams can be controlled in the area of interest. Focusing and steering of sound using PA-UT can only be accomplished in the near field of the probe (the near field is related to the active aperture length). The near field of industrial PA probes, and common focal law development algorithms, generally allow this beam forming to occur only in the first leg of sound. Therefore, optimum sound beams are not being produced by skipping them into the weld volumes to ensure coverage. Figure 7-29 shows an example of a planar flaw on the fusion zone within the inner one-third of the weld volume. When a weld crown is present, one method using shear waves would be to bounce the sound using a full-V approach from the near side of the weld. However, if this is not possible because of geometry or obstruction, or insufficient angles for an optimum V-path to be performed, a planar flaw may be missed from the near side, but based on inspection angle, can be easily detected from the opposite side when inspecting through fine-grained materials such as carbon steel. The best method would be to remove the weld crown, and apply PA-UT from both sides
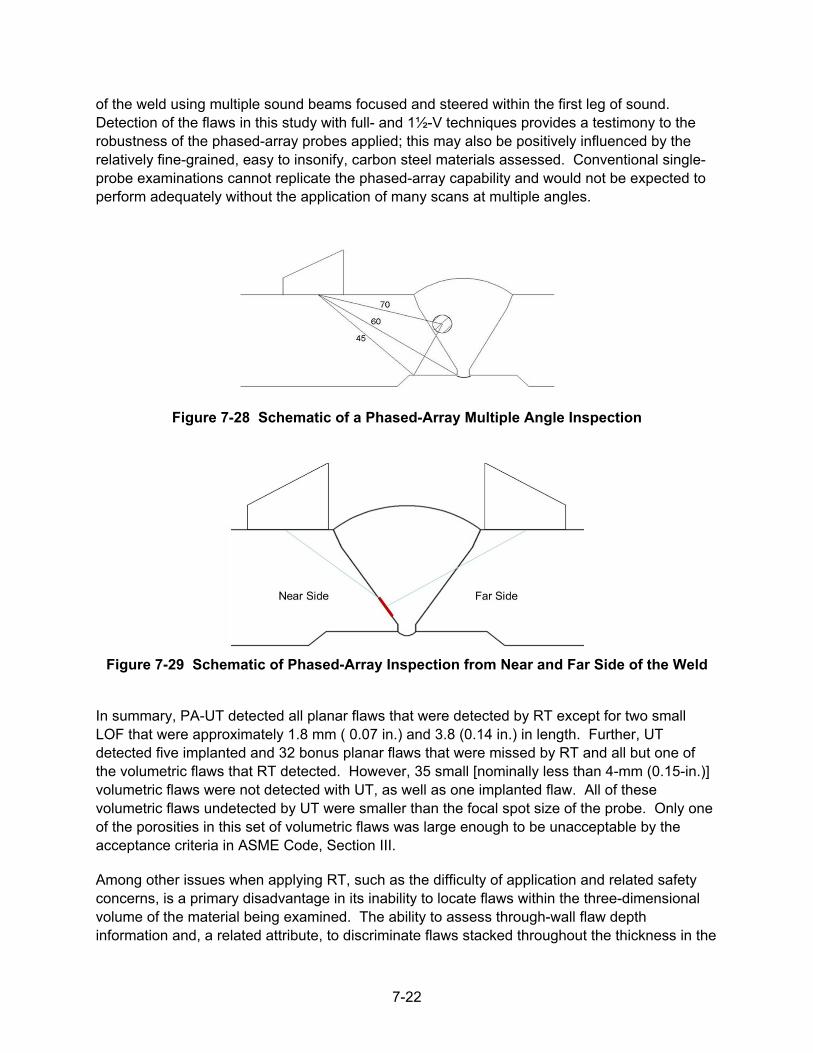
7-22
of the weld using multiple sound beams focused and steered within the first leg of sound. Detection of the flaws in this study with full- and 1½-V techniques provides a testimony to the robustness of the phased-array probes applied; this may also be positively influenced by the relatively fine-grained, easy to insonify, carbon steel materials assessed. Conventional single-probe examinations cannot replicate the phased-array capability and would not be expected to perform adequately without the application of many scans at multiple angles.
Figure 7-28 Schematic of a Phased-Array Multiple Angle Inspection
Figure 7-29 Schematic of Phased-Array Inspection from Near and Far Side of the Weld
In summary, PA-UT detected all planar flaws that were detected by RT except for two small LOF that were approximately 1.8 mm ( 0.07 in.) and 3.8 (0.14 in.) in length. Further, UT detected five implanted and 32 bonus planar flaws that were missed by RT and all but one of the volumetric flaws that RT detected. However, 35 small [nominally less than 4-mm (0.15-in.)] volumetric flaws were not detected with UT, as well as one implanted flaw. All of these volumetric flaws undetected by UT were smaller than the focal spot size of the probe. Only one of the porosities in this set of volumetric flaws was large enough to be unacceptable by the acceptance criteria in ASME Code, Section III.
Among other issues when applying RT, such as the difficulty of application and related safety concerns, is a primary disadvantage in its inability to locate flaws within the three-dimensional volume of the material being examined. The ability to assess through-wall flaw depth information and, a related attribute, to discriminate flaws stacked throughout the thickness in the
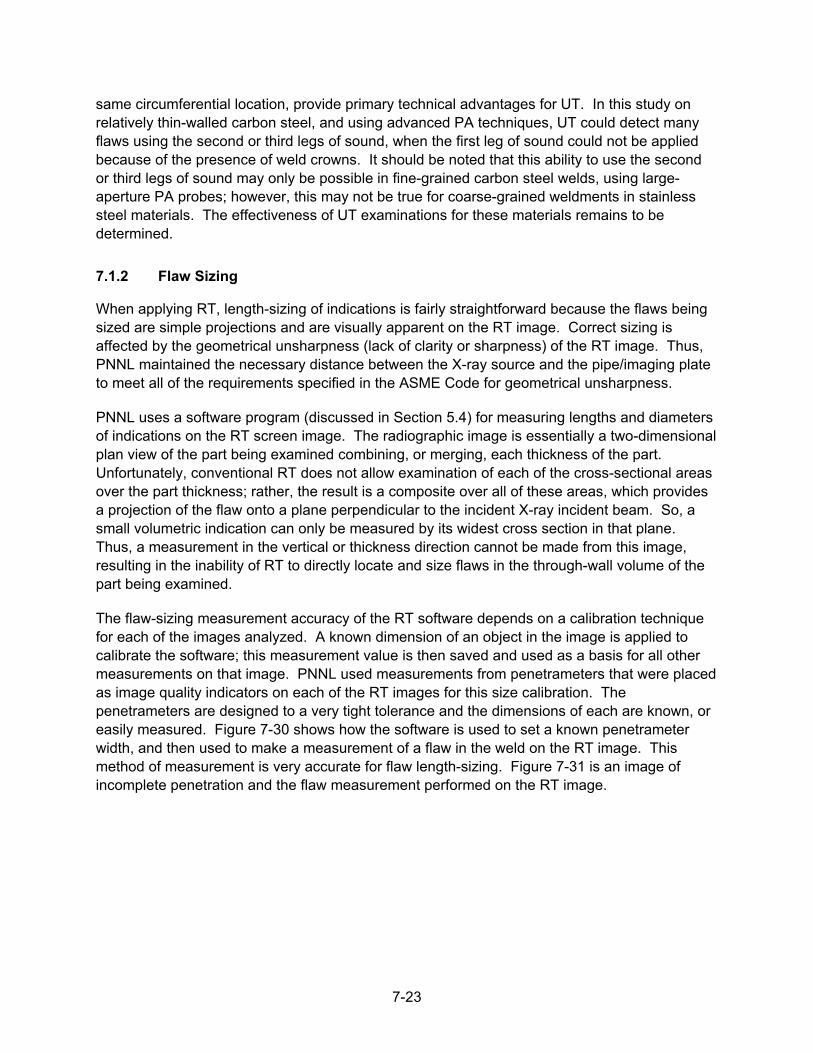
7-23
same circumferential location, provide primary technical advantages for UT. In this study on relatively thin-walled carbon steel, and using advanced PA techniques, UT could detect many flaws using the second or third legs of sound, when the first leg of sound could not be applied because of the presence of weld crowns. It should be noted that this ability to use the second or third legs of sound may only be possible in fine-grained carbon steel welds, using large-aperture PA probes; however, this may not be true for coarse-grained weldments in stainless steel materials. The effectiveness of UT examinations for these materials remains to be determined.
7.1.2 Flaw Sizing
When applying RT, length-sizing of indications is fairly straightforward because the flaws being sized are simple projections and are visually apparent on the RT image. Correct sizing is affected by the geometrical unsharpness (lack of clarity or sharpness) of the RT image. Thus, PNNL maintained the necessary distance between the X-ray source and the pipe/imaging plate to meet all of the requirements specified in the ASME Code for geometrical unsharpness.
PNNL uses a software program (discussed in Section 5.4) for measuring lengths and diameters of indications on the RT screen image. The radiographic image is essentially a two-dimensional plan view of the part being examined combining, or merging, each thickness of the part. Unfortunately, conventional RT does not allow examination of each of the cross-sectional areas over the part thickness; rather, the result is a composite over all of these areas, which provides a projection of the flaw onto a plane perpendicular to the incident X-ray incident beam. So, a small volumetric indication can only be measured by its widest cross section in that plane. Thus, a measurement in the vertical or thickness direction cannot be made from this image, resulting in the inability of RT to directly locate and size flaws in the through-wall volume of the part being examined.
The flaw-sizing measurement accuracy of the RT software depends on a calibration technique for each of the images analyzed. A known dimension of an object in the image is applied to calibrate the software; this measurement value is then saved and used as a basis for all other measurements on that image. PNNL used measurements from penetrameters that were placed as image quality indicators on each of the RT images for this size calibration. The penetrameters are designed to a very tight tolerance and the dimensions of each are known, or easily measured. Figure 7-30 shows how the software is used to set a known penetrameter width, and then used to make a measurement of a flaw in the weld on the RT image. This method of measurement is very accurate for flaw length-sizing. Figure 7-31 is an image of incomplete penetration and the flaw measurement performed on the RT image.
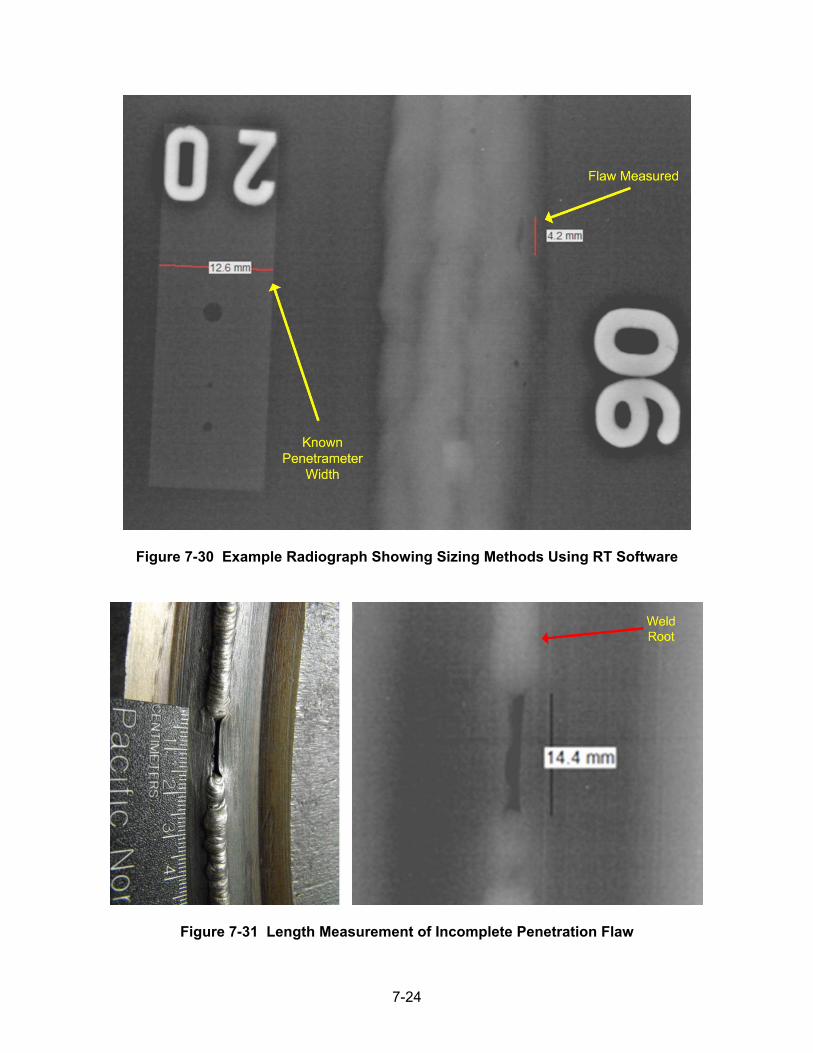
7-24
Figure 7-30 Example Radiograph Showing Sizing Methods Using RT Software
Figure 7-31 Length Measurement of Incomplete Penetration Flaw
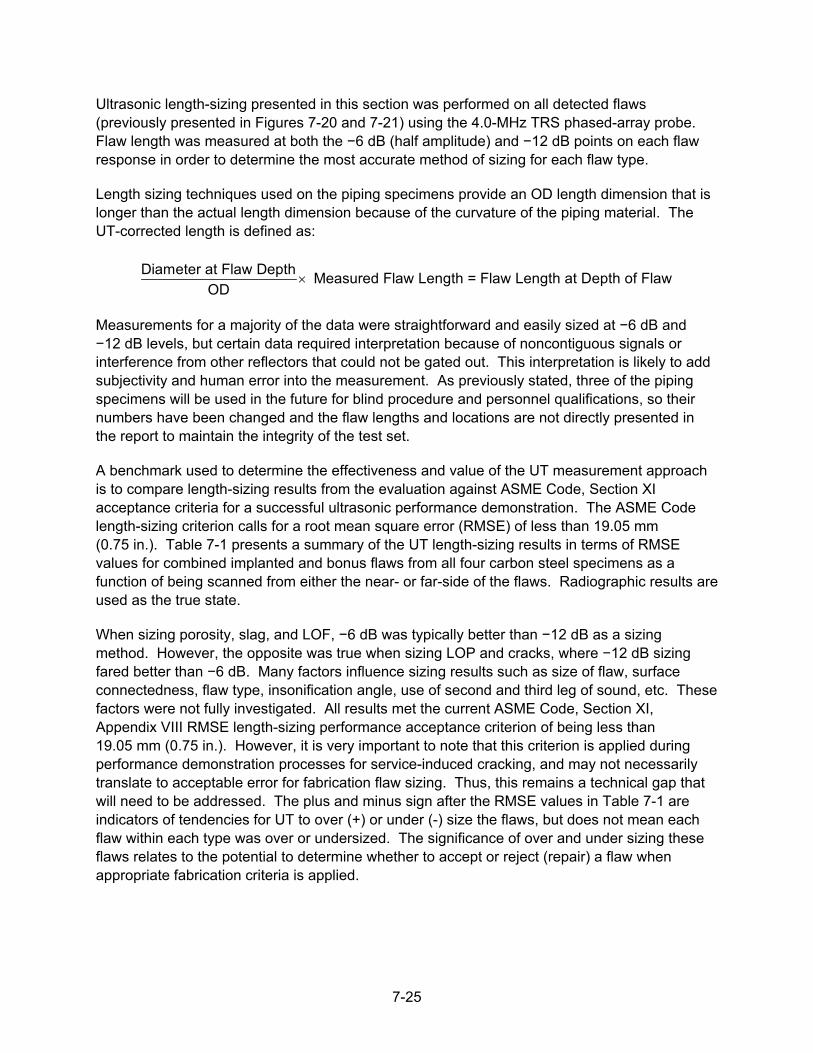
7-25
Ultrasonic length-sizing presented in this section was performed on all detected flaws (previously presented in Figures 7-20 and 7-21) using the 4.0-MHz TRS phased-array probe. Flaw length was measured at both the −6 dB (half amplitude) and −12 dB points on each flaw response in order to determine the most accurate method of sizing for each flaw type.
Length sizing techniques used on the piping specimens provide an OD length dimension that is longer than the actual length dimension because of the curvature of the piping material. The UT-corrected length is defined as:
Diameter at Flaw Depth Measured Flaw Length = Flaw Length at Depth of FlawOD
×
Measurements for a majority of the data were straightforward and easily sized at −6 dB and −12 dB levels, but certain data required interpretation because of noncontiguous signals or interference from other reflectors that could not be gated out. This interpretation is likely to add subjectivity and human error into the measurement. As previously stated, three of the piping specimens will be used in the future for blind procedure and personnel qualifications, so their numbers have been changed and the flaw lengths and locations are not directly presented in the report to maintain the integrity of the test set.
A benchmark used to determine the effectiveness and value of the UT measurement approach is to compare length-sizing results from the evaluation against ASME Code, Section XI acceptance criteria for a successful ultrasonic performance demonstration. The ASME Code length-sizing criterion calls for a root mean square error (RMSE) of less than 19.05 mm (0.75 in.). Table 7-1 presents a summary of the UT length-sizing results in terms of RMSE values for combined implanted and bonus flaws from all four carbon steel specimens as a function of being scanned from either the near- or far-side of the flaws. Radiographic results are used as the true state.
When sizing porosity, slag, and LOF, −6 dB was typically better than −12 dB as a sizing method. However, the opposite was true when sizing LOP and cracks, where −12 dB sizing fared better than −6 dB. Many factors influence sizing results such as size of flaw, surface connectedness, flaw type, insonification angle, use of second and third leg of sound, etc. These factors were not fully investigated. All results met the current ASME Code, Section XI, Appendix VIII RMSE length-sizing performance acceptance criterion of being less than 19.05 mm (0.75 in.). However, it is very important to note that this criterion is applied during performance demonstration processes for service-induced cracking, and may not necessarily translate to acceptable error for fabrication flaw sizing. Thus, this remains a technical gap that will need to be addressed. The plus and minus sign after the RMSE values in Table 7-1 are indicators of tendencies for UT to over (+) or under (-) size the flaws, but does not mean each flaw within each type was over or undersized. The significance of over and under sizing these flaws relates to the potential to determine whether to accept or reject (repair) a flaw when appropriate fabrication criteria is applied.
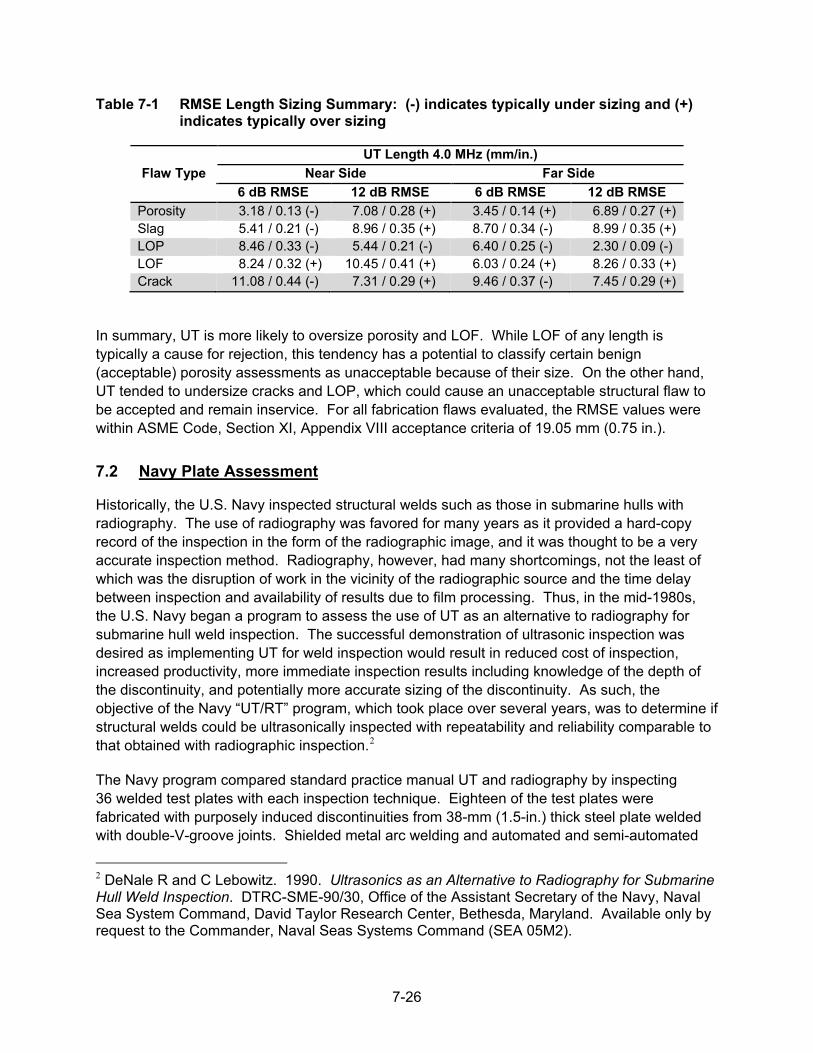
7-26
Table 7-1 RMSE Length Sizing Summary: (-) indicates typically under sizing and (+) indicates typically over sizing
UT Length 4.0 MHz (mm/in.) Flaw Type Near Side Far Side
6 dB RMSE 12 dB RMSE 6 dB RMSE 12 dB RMSE Porosity 3.18 / 0.13 (-) 7.08 / 0.28 (+) 3.45 / 0.14 (+) 6.89 / 0.27 (+) Slag 5.41 / 0.21 (-) 8.96 / 0.35 (+) 8.70 / 0.34 (-) 8.99 / 0.35 (+) LOP 8.46 / 0.33 (-) 5.44 / 0.21 (-) 6.40 / 0.25 (-) 2.30 / 0.09 (-) LOF 8.24 / 0.32 (+) 10.45 / 0.41 (+) 6.03 / 0.24 (+) 8.26 / 0.33 (+) Crack 11.08 / 0.44 (-) 7.31 / 0.29 (+) 9.46 / 0.37 (-) 7.45 / 0.29 (+)
In summary, UT is more likely to oversize porosity and LOF. While LOF of any length is typically a cause for rejection, this tendency has a potential to classify certain benign (acceptable) porosity assessments as unacceptable because of their size. On the other hand, UT tended to undersize cracks and LOP, which could cause an unacceptable structural flaw to be accepted and remain inservice. For all fabrication flaws evaluated, the RMSE values were within ASME Code, Section XI, Appendix VIII acceptance criteria of 19.05 mm (0.75 in.).
7.2 Navy Plate Assessment
Historically, the U.S. Navy inspected structural welds such as those in submarine hulls with radiography. The use of radiography was favored for many years as it provided a hard-copy record of the inspection in the form of the radiographic image, and it was thought to be a very accurate inspection method. Radiography, however, had many shortcomings, not the least of which was the disruption of work in the vicinity of the radiographic source and the time delay between inspection and availability of results due to film processing. Thus, in the mid-1980s, the U.S. Navy began a program to assess the use of UT as an alternative to radiography for submarine hull weld inspection. The successful demonstration of ultrasonic inspection was desired as implementing UT for weld inspection would result in reduced cost of inspection, increased productivity, more immediate inspection results including knowledge of the depth of the discontinuity, and potentially more accurate sizing of the discontinuity. As such, the objective of the Navy “UT/RT” program, which took place over several years, was to determine if structural welds could be ultrasonically inspected with repeatability and reliability comparable to that obtained with radiographic inspection.2
The Navy program compared standard practice manual UT and radiography by inspecting 36 welded test plates with each inspection technique. Eighteen of the test plates were fabricated with purposely induced discontinuities from 38-mm (1.5-in.) thick steel plate welded with double-V-groove joints. Shielded metal arc welding and automated and semi-automated
2 DeNale R and C Lebowitz. 1990. Ultrasonics as an Alternative to Radiography for Submarine Hull Weld Inspection. DTRC-SME-90/30, Office of the Assistant Secretary of the Navy, Naval Sea System Command, David Taylor Research Center, Bethesda, Maryland. Available only by request to the Commander, Naval Seas Systems Command (SEA 05M2).
7-27
gas metal arc welding processes were used to fabricate these plates. The other 18 welds were removed from service. The 36 test plates contained a total of 212 discontinuities including slag, lack of fusion, incomplete penetration, cracks, slugs, clustered porosity, and scattered porosity (Lebowitz and DeNale 1991).
The Navy’s conclusions included: “a) Ultrasonics has a higher probability than radiography of detecting and consistently rejecting planar discontinuities. A review of literature has shown that planar flaws are considered to be more detrimental to weld quality than volumetric flaws, b) Ultrasonics and radiography have comparable capacities for detecting and rejecting volumetric discontinuities, and c) Ultrasonics is an acceptable alternative to radiography for weld inspection”.3
PNNL examined three of the remaining Navy “UT/RT” test plates to determine if today’s PA-UT examination methods would support the Navy’s conclusions, and to expand the weld thickness range performed for carbon steel on piping specimens under the current NRC project. Another objective was to confirm industry assertions that individual flaw types (e.g., cracks, LOF, LOP, slag, porosity) can be differentiated using phased-array UT methods. In this section, a comparison of the detection and flaw typing characterization on the Navy plate specimens will be presented.
7.2.1 Navy Flaw Detection and Characterization Protocol
In terms of the Navy inspections, eight shipyard inspectors, with qualifications equivalent to ASNT Level II, performed manual UT, and eight radiographic interpreters, with qualifications equivalent to Level II, reviewed all of the radiographs. The manual ultrasonic inspections were performed with a Krautkramer-Branson USL-48 ultrasonic flaw detector using a 2.25-MHz transducer mounted on a wedge that produced a 60-degree effective angle in steel. The radiography was performed with three different sources (X-ray, cobalt-60, and iridium-192) and two types of film (Kodak types AA and M). Consensus discontinuities, or those that were detected by a majority of inspectors or interpreters using at least one of the inspection methods, were identified by reviewing all of the inspection results, classified as to type, and a sample set verified by sectioning and metallography. Discontinuities were given one of four labels: crack (CRK), lack of fusion (LOF), slag (SLG), or porosity (POR). For purposes of the PNNL study, the Navy consensus detection and flaw typing results were used, but if a discontinuity was only detected by Navy UT, the discontinuity is not reported here.
7.2.2 PNNL UT Flaw Characterization Study
With amplitude and image analyses being more straightforward than sizing and characterization, PNNL UT detection data was recorded by only one analyst; however, because of the level of subjectivity inherent to this process, the flaw typing characterization study was performed by 3 DeNale R and C Lebowitz. 1990. Ultrasonics as an Alternative to Radiography for Submarine Hull Weld Inspection. DTRC-SME-90/30, Office of the Assistant Secretary of the Navy, Naval Sea System Command, David Taylor Research Center, Bethesda, Maryland. Available only by request to the Commander, Naval Seas Systems Command (SEA 05M2).

7-28
three independent personnel designated as Analysts A, B, and C. First, phased-array line scan data was used to detect and locate indications on Navy Plates 10, 18, and 23. Line scans are used mainly for initial detection purposes as they can be performed in a fraction of the time needed for raster scanning, and line scan file sizes are much smaller than raster scan data. Merged line scan images are a much more efficient method of detecting, or screening, responses within large areas of examined materials. Indications were recorded into an Excel worksheet if the amplitude of the signal exceeded the established detection threshold, described in Section 6.2.2. After the initial detection was recorded, raster scan data was acquired for each flaw location in order to allow a more thorough characterization of the indications. Analysts A, B, and C were provided with the −6 dB start and stop positions (length) and the depth location for each of the detected indications. From this information only, all three analysts reviewed the raster scan data to evaluate and characterize the flaw type using a flaw-type decision matrix.
The flaw-type decision matrix (Table 7-2) was created from materials presented at an industry workshop on Phased Array UT Analysis in Breezy Point, Minnesota, during the summer of 2012. Discussions at the workshop centered around the idea that ultrasonic testing could consistently and reliably detect and characterize embedded fabrication flaws as seen with carbon (low-alloy) steel weld configurations where typically RT had been the NDE method of choice. Presentations were given for part of the workshop, with the other portion of the workshop aimed at hands-on data analysis methods focusing on understanding of field techniques used to identify and characterize a variety of flaw types using PA-UT imaging (B, C, and D views), and various A-scan parameters.
The “echo-dynamic travel” and the “rise and fall response” columns in the flaw type decision matrix (Table 7-2) were based on A-scan methodologies. While examining an A-scan signal, if a quick rise and fall of the indication is observed, along with short echo-dynamic travel time, the matrix would characterize the flaw to be more volumetric (SLG/POR) in nature. When multiple peaks are observed with longer echo-dynamic travel time, the indication is characterized to be more planar (CRK/LOF). Echo-dynamic travel increases with increasing refracted angle, making this characteristic of the matrix more subjective than some of the other signal variables.
Amplitude-based characteristics are used in matrix columns labeled “amplitude from same side,” “detection angle effect on signal response,” “amplitude from opposite side of the weld,” and “relative amplitude from other flaw types.” Signal amplitude tends to be higher for planar flaws (CRK/LOF/LOP) than volumetric flaws (SLG/POR). Volumetric (SLG/POR) flaws and LOP display similar amplitude responses from either side of the weld. Lack of fusion and certain cracks (depending on orientation) generally display a higher amplitude response when scanning from the opposite side of the weld, and a lower, or non-existent, response when scanning from the same side of the weld using ½-V (first leg of sound) examinations. This applies to single-V or the upper half of double-V welds (Navy Plates 10, 18, and 23). If an indication is located on the lower half of a double-V weld, then the opposite amplitude response conditions would be true. The key factor is whether the beam is hitting the planar flaw broadside (good response) or at a glancing angle (poor response).
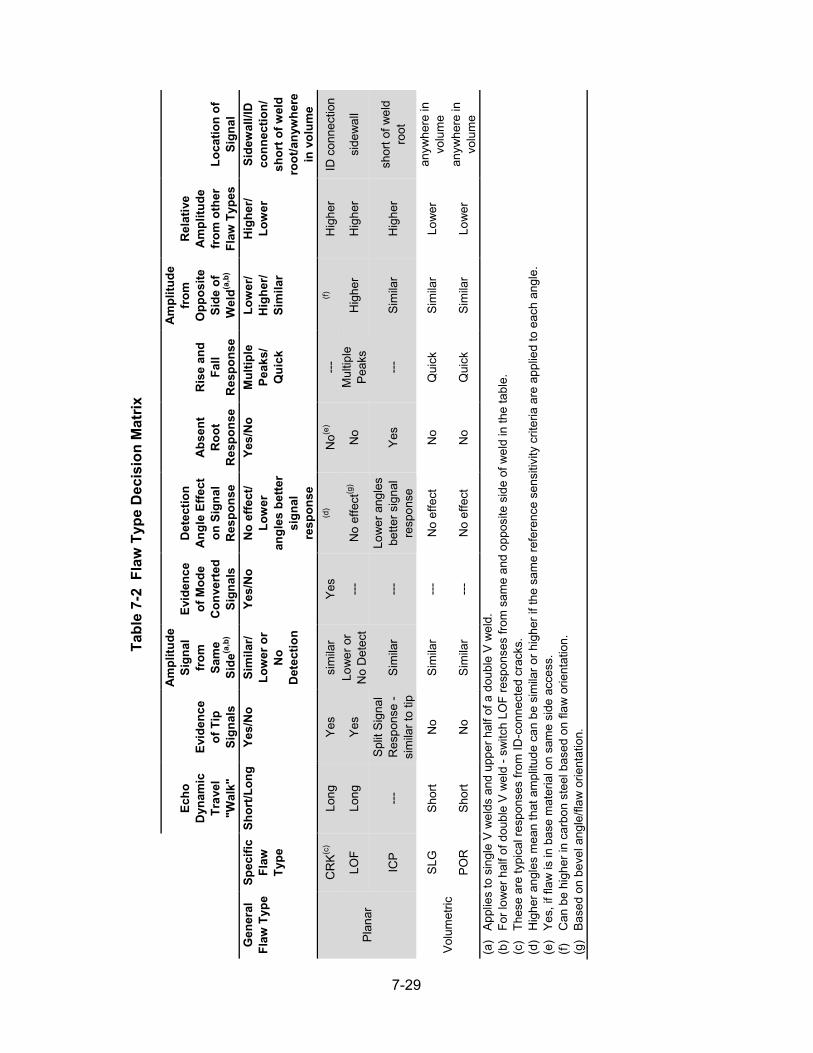
7-29
Tabl
e 7-
2 F
law
Typ
e D
ecis
ion
Mat
rix
Echo
D
ynam
ic
Trav
el
"Wal
k"
Evid
ence
of
Tip
Si
gnal
s
Am
plitu
de
Sign
al
from
Sa
me
Side
(a,b
)
Evid
ence
of
Mod
e C
onve
rted
Si
gnal
s
Det
ectio
n A
ngle
Effe
ct
on S
igna
l R
espo
nse
Abs
ent
Roo
t R
espo
nse
Ris
e an
d Fa
ll R
espo
nse
Am
plitu
de
from
O
ppos
ite
Side
of
Wel
d(a,b
)
Rel
ativ
e A
mpl
itude
fr
om o
ther
Fl
aw T
ypes
Lo
catio
n of
Si
gnal
G
ener
al
Flaw
Typ
e Sp
ecifi
c Fl
aw
Type
Shor
t/Lon
g Ye
s/N
o Si
mila
r/ Lo
wer
or
No
Det
ectio
n
Yes/
No
No
effe
ct/
Low
er
angl
es b
ette
r si
gnal
re
spon
se
Yes/
No
Mul
tiple
Pe
aks/
Q
uick
Low
er/
Hig
her/
Sim
ilar
Hig
her/
Low
er
Side
wal
l/ID
co
nnec
tion/
sh
ort o
f wel
d ro
ot/a
nyw
here
in
vol
ume
Pla
nar
CR
K(c
) Lo
ng
Yes
si
mila
r Y
es
(d)
No(e
) --
- (f)
H
ighe
r ID
con
nect
ion
LOF
Long
Y
es
Low
er o
r N
o D
etec
t --
- N
o ef
fect
(g)
No
Mul
tiple
P
eaks
H
ighe
r H
ighe
r si
dew
all
ICP
--
- S
plit
Sig
nal
Res
pons
e -
sim
ilar t
o tip
S
imila
r --
- Lo
wer
ang
les
bette
r sig
nal
resp
onse
Y
es
---
Sim
ilar
Hig
her
shor
t of w
eld
root
Vol
umet
ric
SLG
S
hort
No
Sim
ilar
---
No
effe
ct
No
Qui
ck
Sim
ilar
Low
er
anyw
here
in
volu
me
PO
R
Sho
rt N
o S
imila
r --
- N
o ef
fect
N
o Q
uick
S
imila
r Lo
wer
an
ywhe
re in
vo
lum
e (a
) A
pplie
s to
sin
gle
V w
elds
and
upp
er h
alf o
f a d
oubl
e V
wel
d.
(b)
For l
ower
hal
f of d
oubl
e V
wel
d - s
witc
h LO
F re
spon
ses
from
sam
e an
d op
posi
te s
ide
of w
eld
in th
e ta
ble.
(c
) Th
ese
are
typi
cal r
espo
nses
from
ID-c
onne
cted
cra
cks.
(d
) H
ighe
r ang
les
mea
n th
at a
mpl
itude
can
be
sim
ilar o
r hig
her i
f the
sam
e re
fere
nce
sens
itivi
ty c
riter
ia a
re a
pplie
d to
eac
h an
gle.
(e
) Y
es, i
f fla
w is
in b
ase
mat
eria
l on
sam
e si
de a
cces
s.
(f)
Can
be
high
er in
car
bon
stee
l bas
ed o
n fla
w o
rient
atio
n.
(g)
Bas
ed o
n be
vel a
ngle
/flaw
orie
ntat
ion.
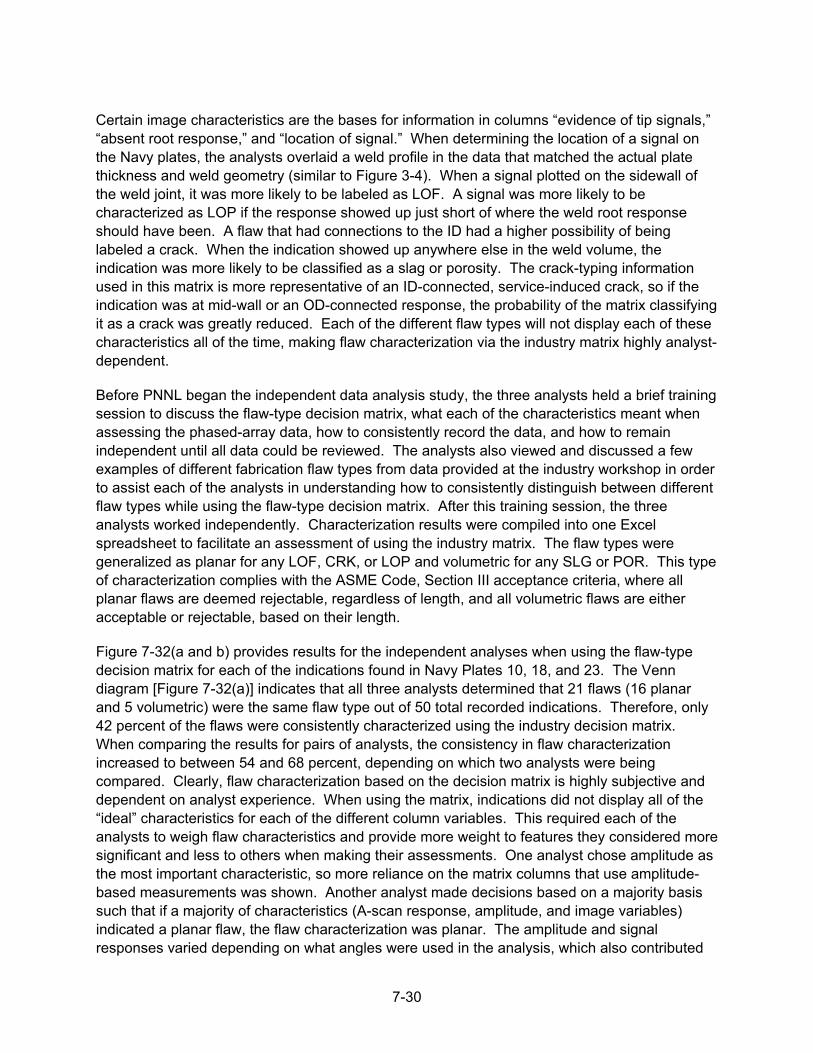
7-30
Certain image characteristics are the bases for information in columns “evidence of tip signals,” “absent root response,” and “location of signal.” When determining the location of a signal on the Navy plates, the analysts overlaid a weld profile in the data that matched the actual plate thickness and weld geometry (similar to Figure 3-4). When a signal plotted on the sidewall of the weld joint, it was more likely to be labeled as LOF. A signal was more likely to be characterized as LOP if the response showed up just short of where the weld root response should have been. A flaw that had connections to the ID had a higher possibility of being labeled a crack. When the indication showed up anywhere else in the weld volume, the indication was more likely to be classified as a slag or porosity. The crack-typing information used in this matrix is more representative of an ID-connected, service-induced crack, so if the indication was at mid-wall or an OD-connected response, the probability of the matrix classifying it as a crack was greatly reduced. Each of the different flaw types will not display each of these characteristics all of the time, making flaw characterization via the industry matrix highly analyst-dependent.
Before PNNL began the independent data analysis study, the three analysts held a brief training session to discuss the flaw-type decision matrix, what each of the characteristics meant when assessing the phased-array data, how to consistently record the data, and how to remain independent until all data could be reviewed. The analysts also viewed and discussed a few examples of different fabrication flaw types from data provided at the industry workshop in order to assist each of the analysts in understanding how to consistently distinguish between different flaw types while using the flaw-type decision matrix. After this training session, the three analysts worked independently. Characterization results were compiled into one Excel spreadsheet to facilitate an assessment of using the industry matrix. The flaw types were generalized as planar for any LOF, CRK, or LOP and volumetric for any SLG or POR. This type of characterization complies with the ASME Code, Section III acceptance criteria, where all planar flaws are deemed rejectable, regardless of length, and all volumetric flaws are either acceptable or rejectable, based on their length.
Figure 7-32(a and b) provides results for the independent analyses when using the flaw-type decision matrix for each of the indications found in Navy Plates 10, 18, and 23. The Venn diagram [Figure 7-32(a)] indicates that all three analysts determined that 21 flaws (16 planar and 5 volumetric) were the same flaw type out of 50 total recorded indications. Therefore, only 42 percent of the flaws were consistently characterized using the industry decision matrix. When comparing the results for pairs of analysts, the consistency in flaw characterization increased to between 54 and 68 percent, depending on which two analysts were being compared. Clearly, flaw characterization based on the decision matrix is highly subjective and dependent on analyst experience. When using the matrix, indications did not display all of the “ideal” characteristics for each of the different column variables. This required each of the analysts to weigh flaw characteristics and provide more weight to features they considered more significant and less to others when making their assessments. One analyst chose amplitude as the most important characteristic, so more reliance on the matrix columns that use amplitude-based measurements was shown. Another analyst made decisions based on a majority basis such that if a majority of characteristics (A-scan response, amplitude, and image variables) indicated a planar flaw, the flaw characterization was planar. The amplitude and signal responses varied depending on what angles were used in the analysis, which also contributed

7-31
to flaw characterization discrepancies. The use of the weld profile overlay in the data was helpful in locating the flaw within the weld volume, but there was analyst subjectivity in placement of the weld overlay, which may also affect the flaw typing.
Figure 7-32 Results of Independent Flaw Type Analysis
7-32
7.2.3 Comparison of Navy RT with PA-UT for Flaw Detection and Characterization
PNNL compared the indications found by PA-UT to the Navy consensus data. Flaw maps were created in MATLAB for each examination station on Plates 10, 18, and 23. As mentioned previously, unlike Plate 23, which had a low stress stamp marking a zero reference, no clearly identifiable zero position existed on Plates 10 and 18. Therefore, PNNL created a new reference point for these plates. However, a notable shift in locations of flaws was observed between the PA-UT data and the Navy data during the initial comparison. PNNL performed computed radiography on Plates 10 and 18, specifically targeted for resolving disagreements between locations of flaw responses between PA-UT and Navy consensus data, and to identify all indications that could be clearly detected in these digital images. The PNNL RT information (position, length, and flaw type) was recorded in a spreadsheet and added to the flaw maps for Plates 10 and 18. When comparing PA-UT, PNNL RT, and Navy data, it was evident that the PA-UT data had been scanned from the opposite side of the weld than the original Navy reference point. This information was used to reverse the PA-UT about the horizontal axis for Plates 10 and 18, thus bringing the Navy and PNNL results into better alignment.
Final flaw maps are shown in Figures 7-33 through 7-37. As noted in the legend, green indications correspond to PA-UT data, blue to Navy RT data, and red to PNNL digital RT data (for Plates 10 and 18 only). A blue box outline has been generated to represent the tolerance used for making a valid detection assessment. PNNL used an allowable deviation of ±25 mm (1.0 in.) from the ends of each flaw in the X, or horizontal direction, and ±7 mm (0.28 in.) from the center of the flaw position in the Y, or vertical direction. The detection tolerance for the X direction was adapted from performance demonstration criteria found in ASME Code, Section XI, Appendix VIII, while the detection tolerance for the Y direction was based on notable shifts of specific flaws in the PNNL digital RT and phased-array UT data as compared to the Navy consensus flaws. The figures provide information pertaining to scans performed from either side of the weld (labeled skew 0 and skew 180). Other important symbols on the flaw maps are dashed lines that represent volumetric flaws, and solid lines with circle endpoints denoting planar flaws. The flaw characterizations made by PNNL PA-UT are simple majority calls, meaning two or more of the analysts made the same interpretation on a particular flaw. The numbers listed in the boxes represent PNNL’s calculations of the detection percentages for each of the Navy RT-called flaws based on information provided to NRC/PNNL by the Navy. The percentage is calculated from number of interpreters that called the flaw out of the possible 48 calls (48 possible calls from 8 radiographic interpreters and 6 radiographic methods). These percentages are presented here to represent the level of radiographic detection that resulted during the Navy study.
The PNNL analysts considered a flaw to be detected, compared to the Navy RT results, when it fell within the tolerance “box” as described above. When the PA-UT only detected the flaw from one side of the weld, the flaw was still considered to be detected. When there were multiple flaws located within the tolerance box, only the closest UT indication to the Navy RT indication was called the flaw (the others indications were listed as additional findings by PNNL UT).
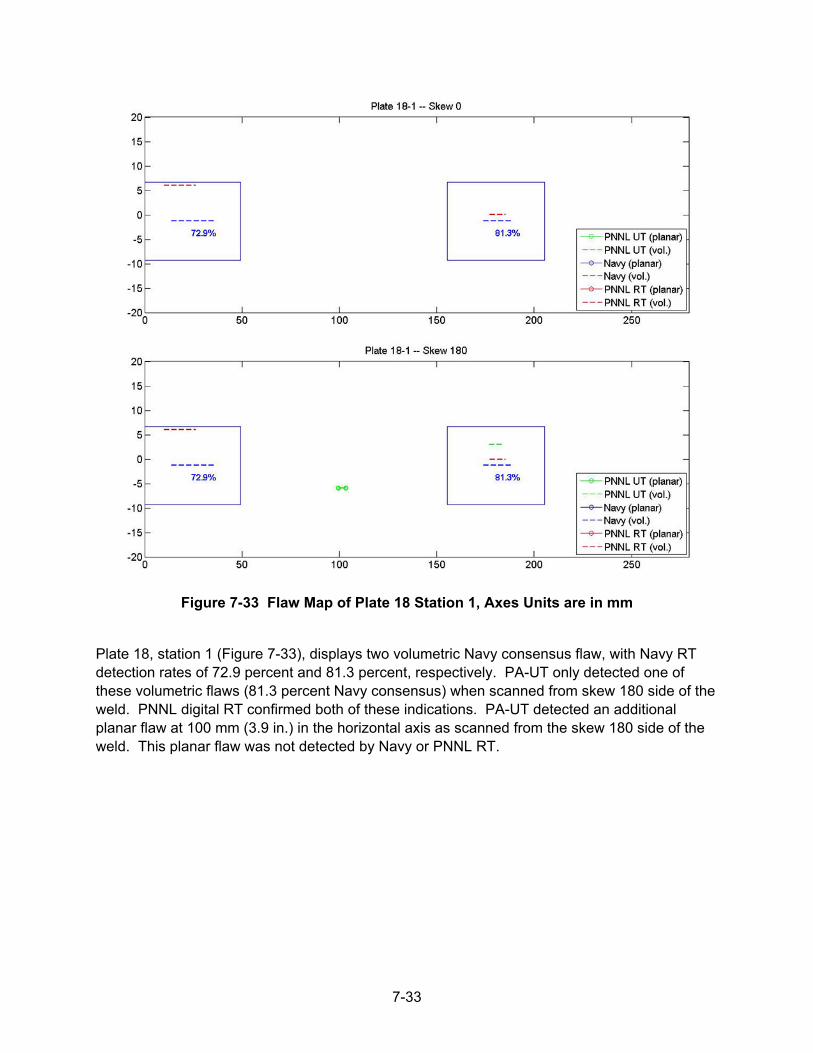
7-33
Figure 7-33 Flaw Map of Plate 18 Station 1, Axes Units are in mm
Plate 18, station 1 (Figure 7-33), displays two volumetric Navy consensus flaw, with Navy RT detection rates of 72.9 percent and 81.3 percent, respectively. PA-UT only detected one of these volumetric flaws (81.3 percent Navy consensus) when scanned from skew 180 side of the weld. PNNL digital RT confirmed both of these indications. PA-UT detected an additional planar flaw at 100 mm (3.9 in.) in the horizontal axis as scanned from the skew 180 side of the weld. This planar flaw was not detected by Navy or PNNL RT.
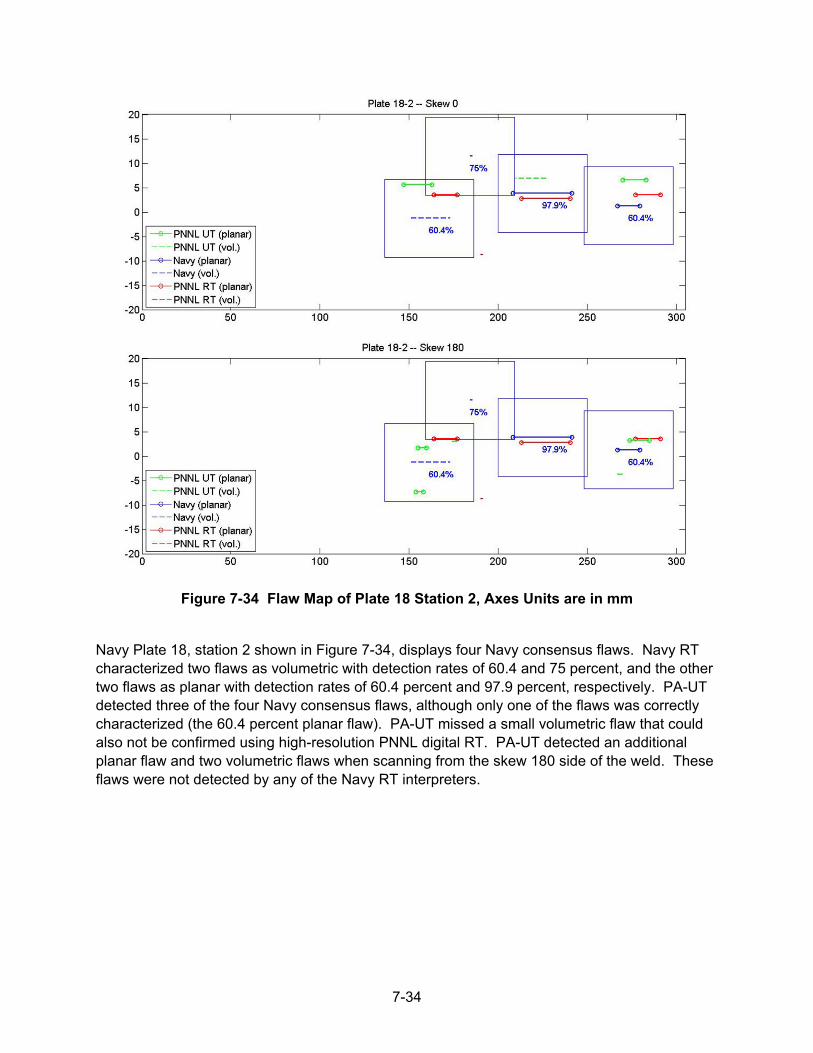
7-34
Figure 7-34 Flaw Map of Plate 18 Station 2, Axes Units are in mm
Navy Plate 18, station 2 shown in Figure 7-34, displays four Navy consensus flaws. Navy RT characterized two flaws as volumetric with detection rates of 60.4 and 75 percent, and the other two flaws as planar with detection rates of 60.4 percent and 97.9 percent, respectively. PA-UT detected three of the four Navy consensus flaws, although only one of the flaws was correctly characterized (the 60.4 percent planar flaw). PA-UT missed a small volumetric flaw that could also not be confirmed using high-resolution PNNL digital RT. PA-UT detected an additional planar flaw and two volumetric flaws when scanning from the skew 180 side of the weld. These flaws were not detected by any of the Navy RT interpreters.
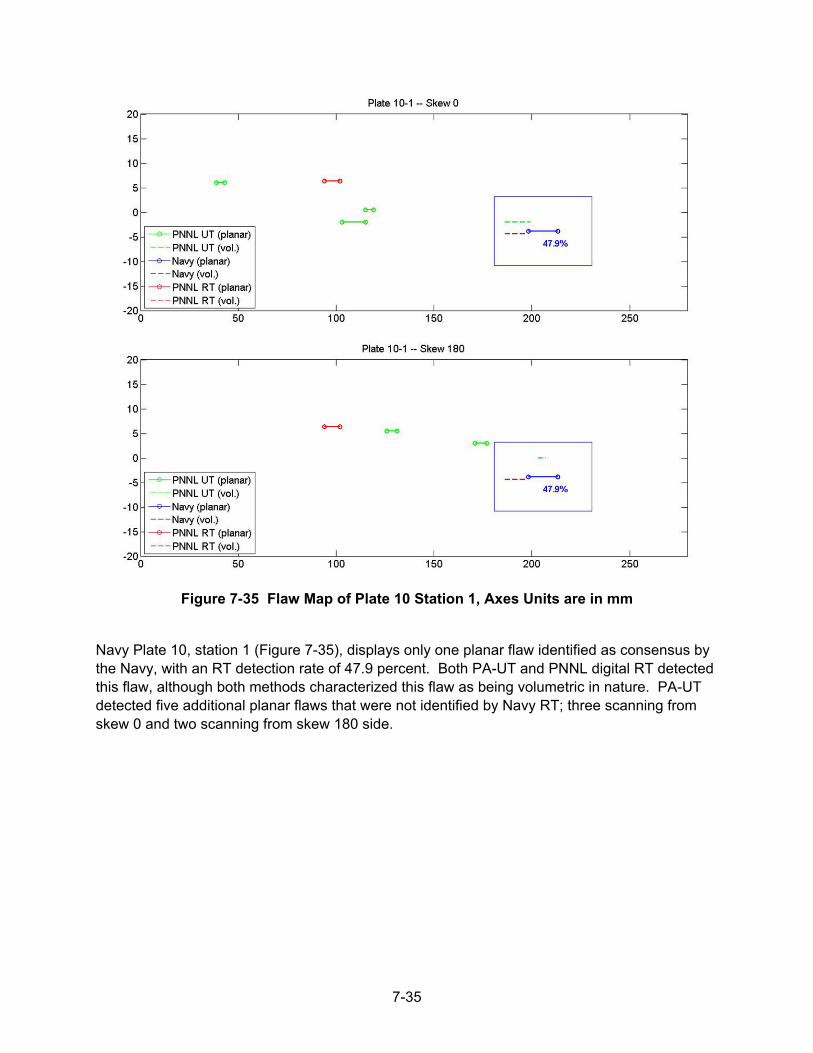
7-35
Figure 7-35 Flaw Map of Plate 10 Station 1, Axes Units are in mm
Navy Plate 10, station 1 (Figure 7-35), displays only one planar flaw identified as consensus by the Navy, with an RT detection rate of 47.9 percent. Both PA-UT and PNNL digital RT detected this flaw, although both methods characterized this flaw as being volumetric in nature. PA-UT detected five additional planar flaws that were not identified by Navy RT; three scanning from skew 0 and two scanning from skew 180 side.
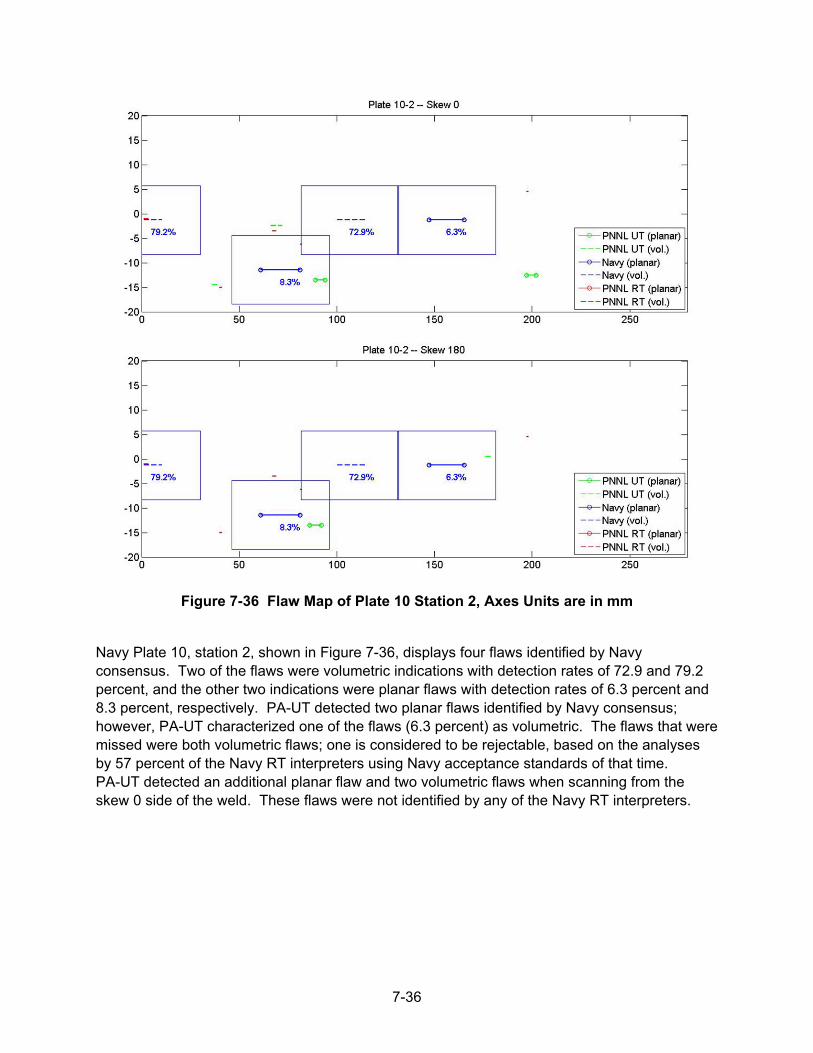
7-36
Figure 7-36 Flaw Map of Plate 10 Station 2, Axes Units are in mm
Navy Plate 10, station 2, shown in Figure 7-36, displays four flaws identified by Navy consensus. Two of the flaws were volumetric indications with detection rates of 72.9 and 79.2 percent, and the other two indications were planar flaws with detection rates of 6.3 percent and 8.3 percent, respectively. PA-UT detected two planar flaws identified by Navy consensus; however, PA-UT characterized one of the flaws (6.3 percent) as volumetric. The flaws that were missed were both volumetric flaws; one is considered to be rejectable, based on the analyses by 57 percent of the Navy RT interpreters using Navy acceptance standards of that time. PA-UT detected an additional planar flaw and two volumetric flaws when scanning from the skew 0 side of the weld. These flaws were not identified by any of the Navy RT interpreters.
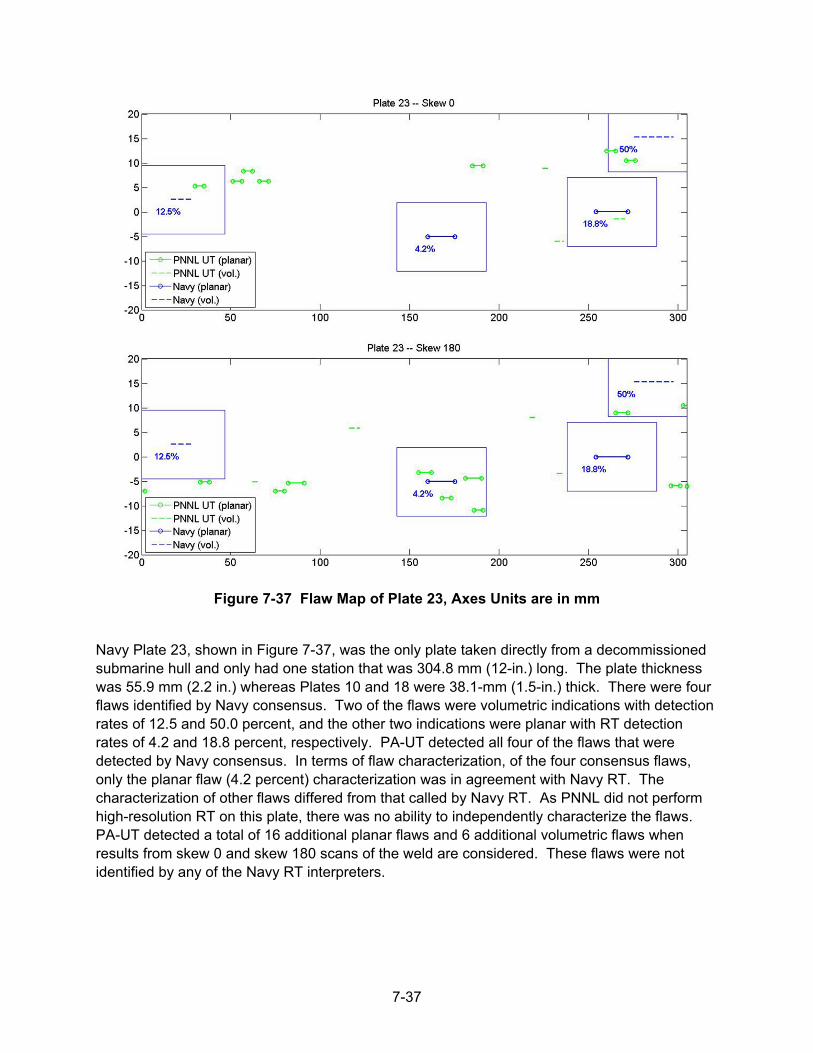
7-37
Figure 7-37 Flaw Map of Plate 23, Axes Units are in mm
Navy Plate 23, shown in Figure 7-37, was the only plate taken directly from a decommissioned submarine hull and only had one station that was 304.8 mm (12-in.) long. The plate thickness was 55.9 mm (2.2 in.) whereas Plates 10 and 18 were 38.1-mm (1.5-in.) thick. There were four flaws identified by Navy consensus. Two of the flaws were volumetric indications with detection rates of 12.5 and 50.0 percent, and the other two indications were planar with RT detection rates of 4.2 and 18.8 percent, respectively. PA-UT detected all four of the flaws that were detected by Navy consensus. In terms of flaw characterization, of the four consensus flaws, only the planar flaw (4.2 percent) characterization was in agreement with Navy RT. The characterization of other flaws differed from that called by Navy RT. As PNNL did not perform high-resolution RT on this plate, there was no ability to independently characterize the flaws. PA-UT detected a total of 16 additional planar flaws and 6 additional volumetric flaws when results from skew 0 and skew 180 scans of the weld are considered. These flaws were not identified by any of the Navy RT interpreters.
7-38
In summary, PA-UT detected only 11 of 15 (or 73 percent) of the Navy RT consensus indications existing in Plates 10, 18, and 23. All four indications missed by UT were volumetric flaws, of which two were reported as being rejectable by only 57 and 40 percent consensus, respectively, of Navy RT film interpreters using Navy acceptance standards. However, PA-UT detected 34 flaws that were not detected by Navy RT.
During this analysis, the UT detection threshold was set at 50 percent of the full screen height, as described in Section 6.2.2. This allowed for an efficient screening method that resulted in many small, typically irrelevant, indications to be eliminated from being analyzed, but could have also allowed a small, potentially relevant flaw, such as LOF or a crack, to remain undetected. The 34 flaws missed by Navy RT were classified as 10 volumetric and 24 planar flaws by PA-UT. This result is comparable to that observed in the carbon steel piping results discussed previously, in which UT tends to miss small volumetric flaws while RT tends to miss planar-type flaws.
One observation during this study was that PA-UT does not always provide a readily detectable response for all flaws when scanning from both sides of the weld. Thus, single-sided examination would not be expected to detect all potentially significant flaws, depending on flaw location and orientation. In addition, to improve flaw detection, the weld crown should be ground flush with surfaces of adjacent parent materials allowing PA-UT scans to be performed over the weld from four orthogonal directions. This approach would also allow zero-degree, longitudinal wave scans to be acquired over the area of interest for enhancing flaw detection and characterization. More importantly, weld crown removal would result in enhanced scan area coverage and optimization of flaw responses using ½-V (first leg of sound) PA-UT methods.
The flaw detection and characterization (volumetric versus planar) results comparing Navy RT and PA-UT on Plates 10, 18, and 23 are summarized in Table 7-3. A review of this data shows that PA-UT and Navy RT called only four out of the fifteen indications as being the same flaw type (volumetric or planar). The Navy flaw typing information was provided by the Navy to NRC and can be found in Appendix B of the report provided to PNNL by the Navy.4 The Navy RT flaw characterizations were consensus data, meaning not all interpreters called each flaw as the same type, nor did all interpreters detect all of the flaws, as can be seen in the detection percentages presented in Table 7-3. The flaw characterizations made by PA-UT are based on two or more of the analysts making the same interpretation (volumetric or planar) on a particular flaw. The PNNL RT flaw characterizations were made by one ASNT Level III RT analyst.
The results from the PNNL independent characterization analysis, as mentioned earlier in this section, exhibited only 42 percent consistency among three analysts using the same decision matrix to make flaw type calls. It was noted that, when using the matrix, indications did not display all of the “ideal” characteristics for each of the different column variables. This required each of the analysts to consider varied flaw characteristics and provide more weight to features they considered more significant and less to others when making their assessments. These
4 DeNale R and C Lebowitz. 1990. Ultrasonics as an Alternative to Radiography for Submarine Hull Weld Inspection. DTRC-SME-90/30, Office of the Assistant Secretary of the Navy, Naval Sea System Command, David Taylor Research Center, Bethesda, Maryland. Available only by request to the Commander, Naval Seas Systems Command (SEA 05M2).
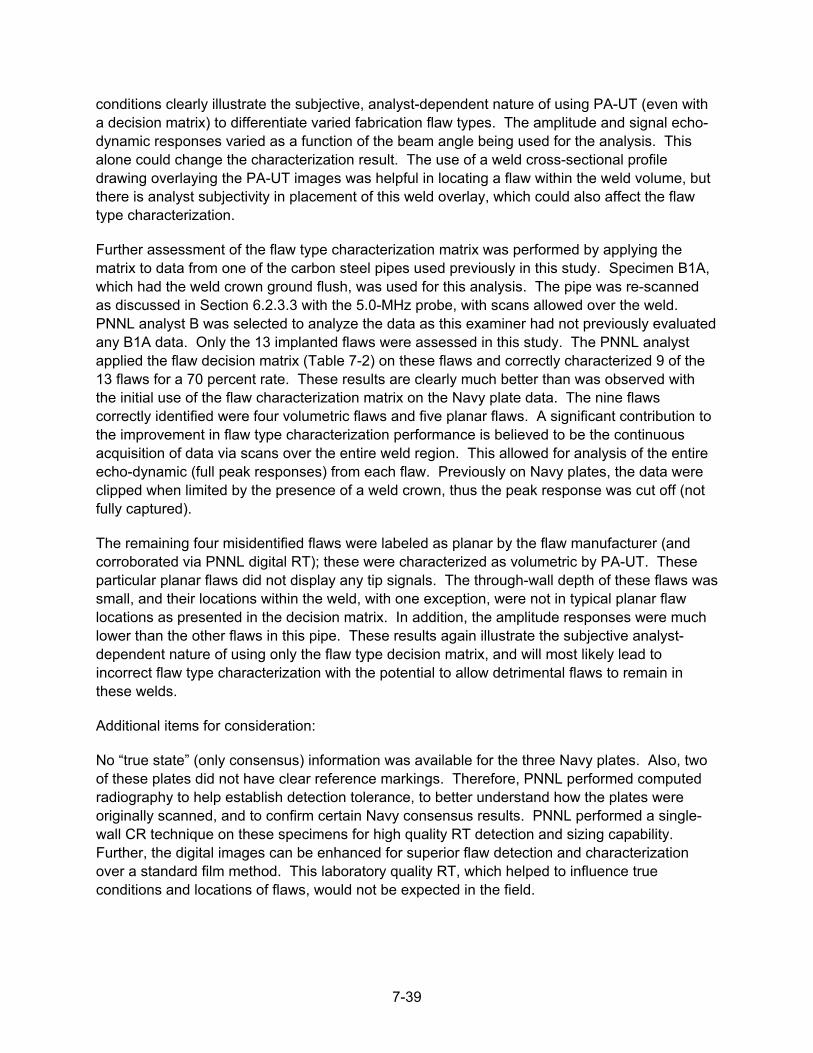
7-39
conditions clearly illustrate the subjective, analyst-dependent nature of using PA-UT (even with a decision matrix) to differentiate varied fabrication flaw types. The amplitude and signal echo-dynamic responses varied as a function of the beam angle being used for the analysis. This alone could change the characterization result. The use of a weld cross-sectional profile drawing overlaying the PA-UT images was helpful in locating a flaw within the weld volume, but there is analyst subjectivity in placement of this weld overlay, which could also affect the flaw type characterization.
Further assessment of the flaw type characterization matrix was performed by applying the matrix to data from one of the carbon steel pipes used previously in this study. Specimen B1A, which had the weld crown ground flush, was used for this analysis. The pipe was re-scanned as discussed in Section 6.2.3.3 with the 5.0-MHz probe, with scans allowed over the weld. PNNL analyst B was selected to analyze the data as this examiner had not previously evaluated any B1A data. Only the 13 implanted flaws were assessed in this study. The PNNL analyst applied the flaw decision matrix (Table 7-2) on these flaws and correctly characterized 9 of the 13 flaws for a 70 percent rate. These results are clearly much better than was observed with the initial use of the flaw characterization matrix on the Navy plate data. The nine flaws correctly identified were four volumetric flaws and five planar flaws. A significant contribution to the improvement in flaw type characterization performance is believed to be the continuous acquisition of data via scans over the entire weld region. This allowed for analysis of the entire echo-dynamic (full peak responses) from each flaw. Previously on Navy plates, the data were clipped when limited by the presence of a weld crown, thus the peak response was cut off (not fully captured).
The remaining four misidentified flaws were labeled as planar by the flaw manufacturer (and corroborated via PNNL digital RT); these were characterized as volumetric by PA-UT. These particular planar flaws did not display any tip signals. The through-wall depth of these flaws was small, and their locations within the weld, with one exception, were not in typical planar flaw locations as presented in the decision matrix. In addition, the amplitude responses were much lower than the other flaws in this pipe. These results again illustrate the subjective analyst-dependent nature of using only the flaw type decision matrix, and will most likely lead to incorrect flaw type characterization with the potential to allow detrimental flaws to remain in these welds.
Additional items for consideration:
No “true state” (only consensus) information was available for the three Navy plates. Also, two of these plates did not have clear reference markings. Therefore, PNNL performed computed radiography to help establish detection tolerance, to better understand how the plates were originally scanned, and to confirm certain Navy consensus results. PNNL performed a single-wall CR technique on these specimens for high quality RT detection and sizing capability. Further, the digital images can be enhanced for superior flaw detection and characterization over a standard film method. This laboratory quality RT, which helped to influence true conditions and locations of flaws, would not be expected in the field.
7-40
Finally, in order to make PA-UT data analysis more efficient, a detection threshold was established to primarily assess the targeted, or intended, flaws of this study while minimizing responses from very small welding anomalies (bonus indications) deemed of less importance. This type of detection threshold eliminates analyses of typically irrelevant indications, but could potentially allow a small, albeit significant, flaw to remain undetected if applied in the field. The detection threshold could have been set lower, which would have enabled very small reflectors to be analyzed while allowing more of the targeted Navy consensus flaws to be detected.
Table 7-3 Flaw Detection/Characterization Analysis between Navy Consensus Calls, PNNL UT, and PNNL RT Calls
Plate ID
Navy Flaw
Number
Navy RT Detection
Percentage
Detection/Flaw Type (ND/Volumetric/Planar) Navy
Consensus PNNL UT(a) PNNL RT(b) Plate 10-1 1 47.9% Planar Volumetric Volumetric
Plate 10-2
1 79.2% Volumetric ND Volumetric 2 72.9% Volumetric ND Volumetric 3 8.3% Planar Planar ND 4 6.3% Planar Volumetric ND
Plate 18-1 1 72.9% Volumetric ND Volumetric 2 81.3% Volumetric Volumetric Volumetric
Plate 18-2
1 60.4% Volumetric Planar Planar 2 97.9% Planar Volumetric Planar 3 75.0% Volumetric ND ND 4 60.4% Planar Planar Planar
Plate 23
1 50.0% Volumetric Planar Not Examined 2 12.5% Volumetric Planar Not Examined 3 18.8% Planar Volumetric Not Examined 4 4.2% Planar Planar Not Examined
(a) Based on ≥ 2 of 3 PNNL PA-UT analysts. (b) Based on 1 PNNL Level III RT interpreter.
8-1
8 CONCLUSIONS AND RECOMMENDATIONS
This report is intended to provide an objective technical evaluation of the capabilities for advanced ultrasonic testing to detect and characterize flaws in carbon steel piping and plate welds when compared to radiographic techniques. A set of four carbon steel pipe-to-pipe specimens containing a number of implanted fabrication and simulated service flaws (cracks) distributed throughout the volume of the welds was examined using both phased-array UT and digital RT techniques. In addition, three carbon steel plates on loan from the Navy containing multiple fabrication flaws, as determined by consensus radiographic interpretation, were similarly examined using PA-UT. Five different types of fabrication conditions have been evaluated, including planar (LOF, LOP, and cracks) and volumetric (POR and SLG) flaws. This assessment provides a comparison of PA-UT and RT flaw detection, length-sizing, and flaw type characterization. Based on the results of this analysis, the following conclusions and observations can be made for carbon steel piping and plate welds in a range from 19.1 mm (0.75 in.) to 55.8 mm (2.2 in.) in thickness:
Flaw Detection: Phased-array UT detected all planar flaws in the piping specimens that were observed using digital radiography, except for two small LOF that were approximately 1.8 mm (0.07 in.) and 3.8 (0.14 in.) in length. PA-UT also detected five implanted and 32 bonus (non-intentional) planar flaws that went undetected using RT. Further, UT was shown to be capable of detecting all but one of the intended volumetric flaws observed in radiographic images. However, UT did not provide adequately detectable responses for 35 bonus (non-intentional) volumetric flaws imaged by RT; most (31 of 35) of these were nominally less than 4 mm (0.15 in.) in size. This value is smaller than the theoretical focal spot size of the probe at these metal paths and the non-detections may be a result of the amplitude threshold set to eliminate many very small reflectors. Only one of the porosities was large enough to be unacceptable per ASME Section III criteria, which states that any group of aligned indications having an aggregate length greater than t (26.1 mm [1.03 in.]) in a length of 12t (313.9 mm [12.36 in.]) unless the distance between successive indications exceeds 6L in which case the aggregate length is unlimited, L being the length of the largest indication.
Phased-array UT detected all planar flaws identified by the Navy and an additional 24 planar flaws that had not been identified by the Navy RT on the plates examined in this study. PA-UT failed to detect four of the volumetric flaws identified by Navy, of which two were determined to be unacceptable by 57 and 40 percent, respectively, of Navy radiographic interpreters, based on Navy acceptance criteria at that time. However, PA-UT detected ten volumetric flaws that were not identified by the Navy.
During plate weld analysis, a detection threshold was set. This level of amplitude was established to primarily assess the targeted, or intended, flaws in this study while minimizing responses from very small welding anomalies (bonus indications) deemed less important. This type of detection threshold eliminates analyses of typically irrelevant indications, but could potentially allow a small, but significant, flaw to remain undetected if applied in the field.
8-2
Considering overall detections/non-detections for the piping specimens, as well as the Navy plates, it appears that PA-UT, based on the techniques applied in this study, provides an equally effective examination for identifying the presence of fabrication flaws in carbon steel welds. The PA-UT parameters applied were shown to be more effective for planar flaws, but slightly less effective for small volumetric flaws, than RT. This is most likely a function of the acoustic wavelength (based on the frequencies applied) and focal limitations from the sound V paths employed.
An important capability for UT, as opposed to RT, is an ability to identify through-wall depth and volumetric location information for detected flaws. This can be a significant advantage when one considers that UT can assess and discriminate the presence of over-laying, or stacked, flaws located through the thickness of a weld. In carbon steel, PA-UT was found to detect flaws using the second (full-V) or third leg (1½-V) of sound when the first leg (½-V) could not insonify the entire weld volume because of the presence of a weld crown. It should be noted that the use of second or third legs of sound was made possible in carbon steel because of the fine-grained, essentially isotropic, nature of the material; this may not be effective for application on coarse-grained materials such as austenitic stainless steels. More importantly, this “skipping of sound” is not a best practice for PA-UT, which is most effective when optimal beam forming can be accomplished to properly focus and steer the acoustic energy; this is only available within the near field of the probe, generally in the first leg of sound.
During this study, it was observed that UT does not always provide a detectable response when insonifying flaws from both sides (opposing propagation directions). Therefore, single-sided examinations would not be expected to detect all potentially significant flaws, depending on flaw location and orientation. In order to improve flaw detection, it is recommended that all weld crowns be ground flush with surfaces of adjacent parent materials allowing UT scans to be performed over the weld. This approach will increase the probability of detecting flaws along all fusion zones and throughout the weld volume by enabling scanning to be accomplished from opposing parallel and perpendicular directions to the weld, as well as allowing zero-degree data to be collected for assisting flaw characterization. Weld crown removal will result in enhanced scan area coverage and optimization of PA-UT flaw responses using the first legs of sound, thus improving overall flaw detection and characterization.
Flaw Sizing: Phased-array UT has been found to be more likely to oversize porosity and LOF. Because volumetric flaws are assessed based on length, or diameter, as applicable, this could mislead evaluations of detected porosity by making these flaws appear larger than they are in reality, thus causing fabrication acceptance criteria (such as found in ASME Code, Section III) to be falsely exceeded. Furthermore, this study indicates that PA-UT tends to undersize cracks and LOP, which, in opposition to the above, could cause a potentially structurally significant flaw to be found acceptable when repair is warranted, if one is applying fitness-for-service acceptance criteria as would be found in ASME Code, Section XI. However, this tendency to undersize planar flaws is not as important when applying fabrication acceptance criteria because all of these type flaws (LOP, LOF, and cracks) are unacceptable regardless of length. While the cumulative sizing error for all fabrication flaws evaluated in this study did not exceed the length-sizing values required for ASME Code, Section XI UT performance demonstration, this criterion is typically meant for service-induced cracking, so this level of sizing capability may not be applicable to fabrication flaws. PA-UT sizing error, or capability, for fabrication flaws
8-3
remains as a technical gap. It should be noted that the length-sizing analysis conducted during this study included only those flaws detected in the carbon steel piping specimens.
Flaw Type Characterization: PNNL performed a flaw characterization study using three independent UT analysts. When using a flaw-typing decision matrix founded upon industry protocols, only 42 percent of the flaws were consistently characterized by all PNNL UT analysts. Further, when comparing PNNL UT characterizations to the Navy consensus calls, only 4 out of the 15 indications in the Navy plates were similarly characterized for flaw type. During use of the decision matrix (Table 7-2), it was determined that few indications would display all of the “ideal” characteristics for each of the flaw attributes being assessed; this required the analysts to choose which flaw attributes were more valued, or weighted, over others when characterizing flaws. In addition, amplitude and signal echo-dynamic responses varied as a function of the beam angle being used for analysis. The use of a weld cross-sectional profile drawing over-laying the UT images was helpful in locating a flaw within the weld volume, but there is analyst subjectivity in placement of this overlay, which could also affect flaw typing. These conditions clearly illustrate the subjective, analyst-dependent nature of using PA-UT (even with a decision matrix) to differentiate varied fabrication flaw types. It is recommended that all performance-based methods developed to demonstrate personnel capability include sufficient variability of flaw types for assessing these characterization skills.
PNNL applied the flaw decision matrix on 13 implanted flaws in one of the carbon steel piping welds with a weld crown that had been ground flush. The UT analyst in this case was able to correctly identify flaw types for 9 of the 13 (~ 70 percent) flaws, which displays improvement from initial use of the matrix on Navy plate data. A significant contribution to this improved characterization performance was continuous acquisition of data via scans over the weld, allowing analysis of the entire echo-dynamic (full peak responses) from each flaw. This full flaw response is typically not available when scans are limited by the presence of a weld crown, causing a peak response to be clipped (not captured) in the data. This result provides further evidence to support weld crown removal to support UT methods that examine over the weld area, thereby greatly improving not only detection, but flaw type characterization as well.
As was previously discussed, in the nuclear industry, radiography has historically been the primary NDE method for fabrication flaw acceptance, while UT has widely been the volumetric method of choice for detecting service-induced degradation. Per ASME Code, fabrication examinations must include the entire volume of the weld and adjacent base material, and are aimed at detecting welding flaws that may occur anywhere within this defined volume of interest. Conversely, inservice examinations typically only interrogate material volumes subject to service degradation, such as at the inner one-third of piping welds, including the heat-affected zone and limited adjacent base material surrounding this area. Ultrasonic techniques for piping weld examinations have evolved to provide sound fields that focus near the ID for detection of surface-connected cracks, because this is where the preponderance of service-induced degradation has occurred. As a result of these differences, as well as in consideration of the inherent strengths of each of the methods, the two methods are not considered to be interchangeable, rather they are complementary.

8-4
Thus, in order for the NRC to consider UT as a viable alternative to RT for repair and replacement activities in nuclear power plants, many issues remain to be addressed. These were identified in Section 2 of this report, and several were addressed by this work. For instance, it is clear that PA-UT has the ability to successfully detect flaws in carbon steel welds to performance levels comparable to, or even greater than, that achievable with RT when examinations are performed from both sides of the weld and the weld crown is removed. However, the PA-UT detection capability is degraded when only single-side weld access is available; even more so if weld crowns remain in place. In terms of sizing capability, PA-UT both under-sizes and over-sizes, depending on flaw type. Overall, sizing of the fabrication type flaws in carbon steel piping welds fell within the acceptance standards of ASME Code, Section XI, Appendix VIII. However, the applicability of this acceptance standard, having been derived from performance demonstrations on planar crack-like flaws, to welding fabrication flaws is questionable. Further, in terms of characterization of flaws required for the application of ASME Code, Section III-type acceptance criteria, the results of this study indicate that the ability to adequately characterize flaws as either planar or volumetric is very analyst subjective. Thus, whether it be may appropriate to apply current welding fabrication acceptance criteria, which is highly dependent on UT characterization, also remains questionable.
An area outside the scope of the work reported here is the industry-proposed use of established standards for UT performance demonstrations for service-induced flaws (cracks) to UT performance demonstrations for full-volume weld examinations aimed at detecting welding fabrication flaws. It is unclear whether direct application of these existing standards will result in acceptable and reliable performance results. As such, an assessment of appropriate performance demonstration requirements for fabrication UT remains to be performed.
Additionally, because the PA-UT method is being used in lieu of RT applied for piping replacements in limited systems at operating nuclear power plants (i.e., ASME B31.1 examinations), only PA-UT was assessed in this study. Whether conventional UT methods could be successfully applied for these applications remains unknown at the present time. Finally, this work was limited to fine-grained, carbon steel butt welds. No conclusions should be drawn regarding the applicability of UT in lieu of RT for other nuclear power plant weld materials or configurations.
9-1
9 REFERENCES
Anderson MT, SE Cumblidge and SL Crawford. 2008. Technical Letter Report - Analysis of Ultrasonic Data on Piping Cracks at Ignalina Nuclear Power Plant Before and After Applying a Mechanical Stress Improvement Process, JCN-N6319, Task 2. PNNL-17367, Pacific Northwest National Laboratory, Richland, Washington.
ASME. 2008. "Section XI, Rules for Inservice Inspection of Nuclear Power Plant Components; An International Code." In 2007 ASME Boiler and Pressure Vessel Code – An International Code. American Society of Mechanical Engineers, New York. 2008a Addenda, July 1, 2008.
ASTM E1025. 2005. Standard Practice for Design, Manufacture, and Material Grouping Classification of Hole-Type Image Quality Indicators (IQI) Used for Radiology. ASTM International, West Conshohocken, Pennsylvania, www.astm.org.
Brast G, HJ Maier, P Knoch and U Mletzko. 1998. Proceedings of the 23rd MPA Seminar, Vol. 2, pp. 42.1-42.16. October 1-2, 1997, Stuttgart, Germany. http://www.osti.gov/src/servlets/purl/667748-bxlRyX/webviewable/.
DeNale R and C Lebowitz. 1989. "A Comparison of Ultrasonics and Radiographys for Weld Inspection." In Review of Progress in Quantitative Nondestructive Evaluation (QNDE), Volume 8B, pp. 2003-2010. July 31-August 5, 1988, La Jolla, California. Plenum, New York.
DeNale R and C Lebowitz. 1990. "Detection and Disposition Reliability of Ultrasonics and Radiography for Weld Inspection." In 16th Annual Review of Progress in Quantitative Nondestructive Evaluation, Volume 9B, pp. 1371-1378. July 24-28, 1989, Brunswick, Maine.
Doctor SR. 2007. "Nuclear Power Plant NDE Challenges - Past, Present, and Future." In 33rd Annual Review of Quantitative Nondestructive Evaluation, Volume 26, pp. 17-31. July 30-August 4, 2006, Portland, Oregon. DOI 10.1063/1.2717950. American Institute of Physics, Melville, New York.
Erhard A and U Ewert. 1999. "The TOFD Method - Between Radiography and Ultrasonic in Weld Testing " Journal of Nondestructive Evaluation and Ultrasonics 4(9).
Ford J and RJ Hudgell. 1987. Final Report on the Performance Achieved by Non-Destructive Testing of Defective Butt Welds in 50mm Thick Type 316 Stainless Steel. IEE ND-R-1427(R), UKAEA, Risley, United Kingdom.
Forli O. 1979. "Reliability of Ultrasonic and Radiographic Weld Testing." In Ninth World Conference on Non-Destructive Testing, Melbourne, Australia.
Forli O. 1990. "Development and Optimization of NDT for Practical Use: Reliability of Radiography and Ultrasonic Testing." In 5th Nordic NDT Symposium. August 24, 1990, Helsinki, Finland.
Forli O. 1995. Guidelines for Replacing NDE Techniques with One Another. NT TECHN REPORT 300, Det Norske Veritas, Finland.
9-2
Forli O and B Hansen. 1982. "Comparison of Ultrasonic and Radiografic Examination." In Tenth World Conference on Non-Destructive Testing, pp. 221-225. August 26, 1982, Moscow, USSR.
Forli O and B Pettersen. 1985. "Performance of Conventional Ultrasonic and Radiographic Weld Examination." British Journal of Non-destructive Testing 27(6):364-366.
Lebowitz CA and R DeNale. 1991. "Evaluation of A Computer-Assisted Ultrasonic Inspection System (P-scan) for Structural Weld Inspection." In Proceedings for the 4th Canadian Forces/CRAD Meeting on Research in Fabrication and Inspection of Submarine Pressure Hulls, pp. 116-129. June 4-6, 1991, Halifax, Nova Scotia, Canada.
Light GM. 2004. Comparison of Imaging Capabilities Between Ultrasonics and Radiography. SwRI Project 14.07558, Southwest Research Institute, San Antonio, Texas.
Moran TL, P Ramuhalli, AF Pardini, MT Anderson and SR Doctor. 2010. Replacement of Radiography with Ultrasonics for the Nondestructive Inspection of Welds - Evaluation of Technical Gaps - An Interim Report. PNNL-19086, Pacific Northwest National Laboratory, Richland, Washington. NRC ADAMS #ML101031254.
Neundorf B, HJ Maier, U Mletzko and T Just. 2000. 2nd International Conference on NDE in Relation to Structural Integrity for Nuclear and Pressurized Components, pp. 78-80. May 24-26, 2000, New Orleans. http://www.ndt.net/v05n08.htm.
Neundorf B, HJ Maier, U Mletzko and T Just. 2002. "Results of a Round Robin Test on NDT Methods for Austenitic Pipe Welds." VGB PowerTech 82(2):78-80.
PDI. 2007. PDI General Procedure for the Ultrasonic Examination of Ferritic Pipe Welds. PDI-UT-1, Revision D, 4/12/2007, Performance Demonstration Initiative.
Poguet J, J Marguet, F Pichonnat and L Chupin. 2001. "Phased Array Technology: Concepts, Probes and Applications." In 3rd International Conference of NDE in Relation to Structural Integrity for Nuclear and Pressurized Components. November 14-16, 2001, Seville, Spain.
Spanner J. 2005. "Effectiveness of Substituting Ultrasonic Testing for Radiographic Testing for Repair/Replacement." In Proceedings of the 2005 ASME Pressure Vessels and Piping Conference, Vol. 1 Codes and Standards, pp. 33-41. July 17-21, 2005, Denver, Colorado. American Society of Mechanical Engineers, New York.
Wooh S-C and Y Shi. 1999. "Three-Dimensional Beam Directivity of Phase-Steered Ultrasonic." Journal of the Acoustical Society of America 105(6):3275-3282.
APPENDIX A
ANALYSIS SUMMARY – FROM INDUSTRY QUESTIONNAIRE

A-1
A-2
A-3


APPENDIX B
RT AND UT DETECTION RESULTS FOR ALL IMPLANTED AND BONUS FABRICATION FLAWS
IN THE CARBON STEEL PIPING

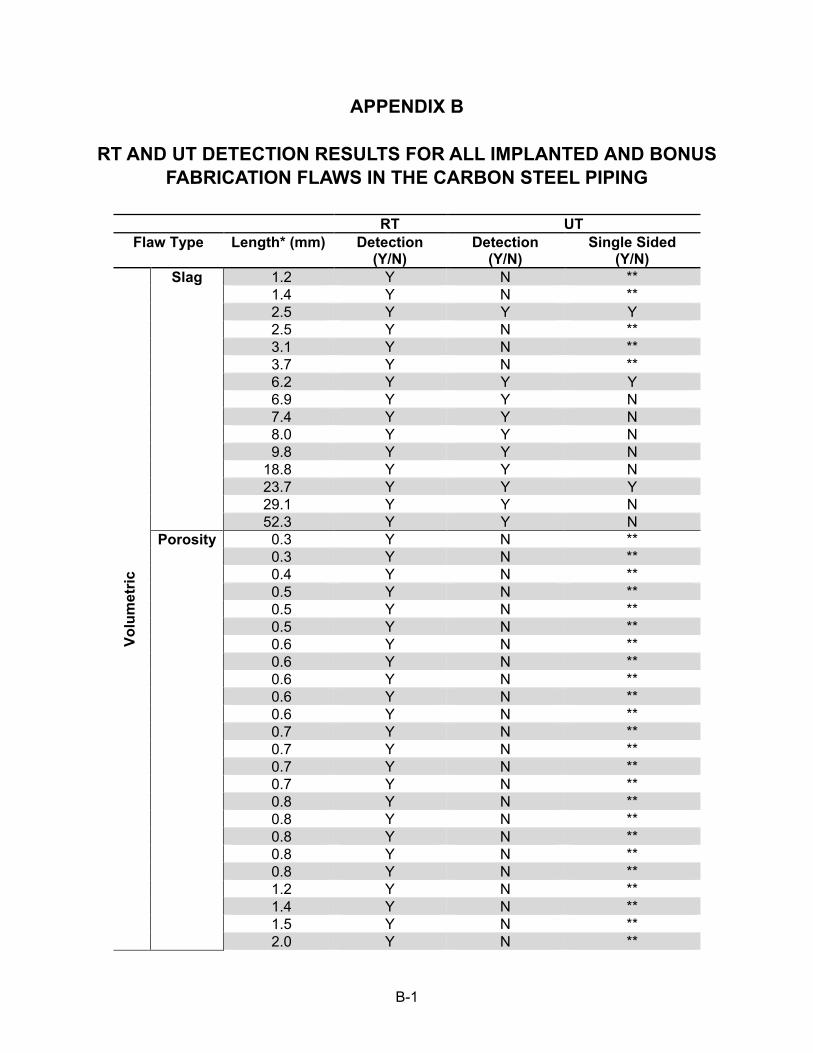
B-1
APPENDIX B
RT AND UT DETECTION RESULTS FOR ALL IMPLANTED AND BONUS FABRICATION FLAWS IN THE CARBON STEEL PIPING
RT UT Flaw Type Length* (mm) Detection
(Y/N) Detection
(Y/N) Single Sided
(Y/N)
Volu
met
ric
Slag 1.2 Y N ** 1.4 Y N ** 2.5 Y Y Y 2.5 Y N ** 3.1 Y N ** 3.7 Y N ** 6.2 Y Y Y 6.9 Y Y N 7.4 Y Y N 8.0 Y Y N 9.8 Y Y N
18.8 Y Y N 23.7 Y Y Y 29.1 Y Y N 52.3 Y Y N
Porosity 0.3 Y N ** 0.3 Y N ** 0.4 Y N ** 0.5 Y N ** 0.5 Y N ** 0.5 Y N ** 0.6 Y N ** 0.6 Y N ** 0.6 Y N ** 0.6 Y N ** 0.6 Y N ** 0.7 Y N ** 0.7 Y N ** 0.7 Y N ** 0.7 Y N ** 0.8 Y N ** 0.8 Y N ** 0.8 Y N ** 0.8 Y N ** 0.8 Y N ** 1.2 Y N ** 1.4 Y N ** 1.5 Y N ** 2.0 Y N **
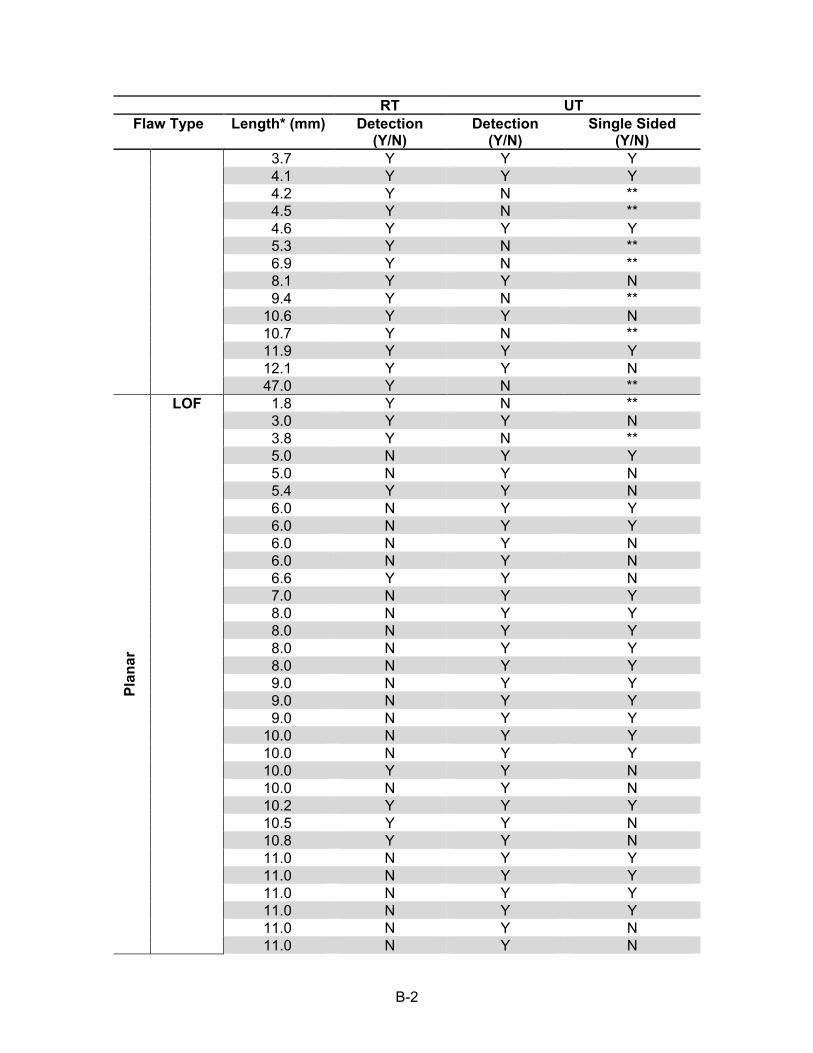
B-2
RT UT Flaw Type Length* (mm) Detection
(Y/N) Detection
(Y/N) Single Sided
(Y/N) 3.7 Y Y Y 4.1 Y Y Y 4.2 Y N ** 4.5 Y N ** 4.6 Y Y Y 5.3 Y N ** 6.9 Y N ** 8.1 Y Y N 9.4 Y N **
10.6 Y Y N 10.7 Y N ** 11.9 Y Y Y 12.1 Y Y N 47.0 Y N **
Plan
ar
LOF 1.8 Y N ** 3.0 Y Y N 3.8 Y N ** 5.0 N Y Y 5.0 N Y N 5.4 Y Y N 6.0 N Y Y 6.0 N Y Y 6.0 N Y N 6.0 N Y N 6.6 Y Y N 7.0 N Y Y 8.0 N Y Y 8.0 N Y Y 8.0 N Y Y 8.0 N Y Y 9.0 N Y Y 9.0 N Y Y 9.0 N Y Y
10.0 N Y Y 10.0 N Y Y 10.0 Y Y N 10.0 N Y N 10.2 Y Y Y 10.5 Y Y N 10.8 Y Y N 11.0 N Y Y 11.0 N Y Y 11.0 N Y Y 11.0 N Y Y 11.0 N Y N 11.0 N Y N
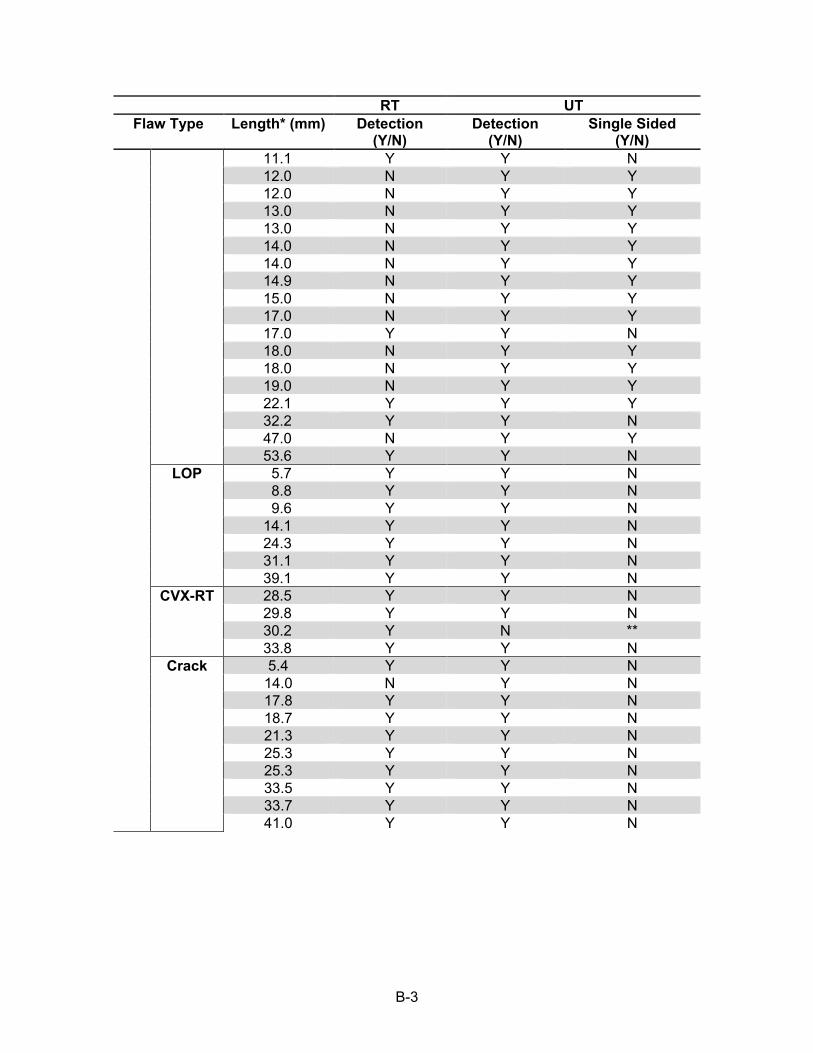
B-3
RT UT Flaw Type Length* (mm) Detection
(Y/N) Detection
(Y/N) Single Sided
(Y/N) 11.1 Y Y N 12.0 N Y Y 12.0 N Y Y 13.0 N Y Y 13.0 N Y Y 14.0 N Y Y 14.0 N Y Y 14.9 N Y Y 15.0 N Y Y 17.0 N Y Y 17.0 Y Y N 18.0 N Y Y 18.0 N Y Y 19.0 N Y Y 22.1 Y Y Y 32.2 Y Y N 47.0 N Y Y 53.6 Y Y N
LOP 5.7 Y Y N 8.8 Y Y N 9.6 Y Y N
14.1 Y Y N 24.3 Y Y N 31.1 Y Y N 39.1 Y Y N
CVX-RT 28.5 Y Y N 29.8 Y Y N 30.2 Y N ** 33.8 Y Y N
Crack 5.4 Y Y N 14.0 N Y N 17.8 Y Y N 18.7 Y Y N 21.3 Y Y N 25.3 Y Y N 25.3 Y Y N 33.5 Y Y N 33.7 Y Y N 41.0 Y Y N
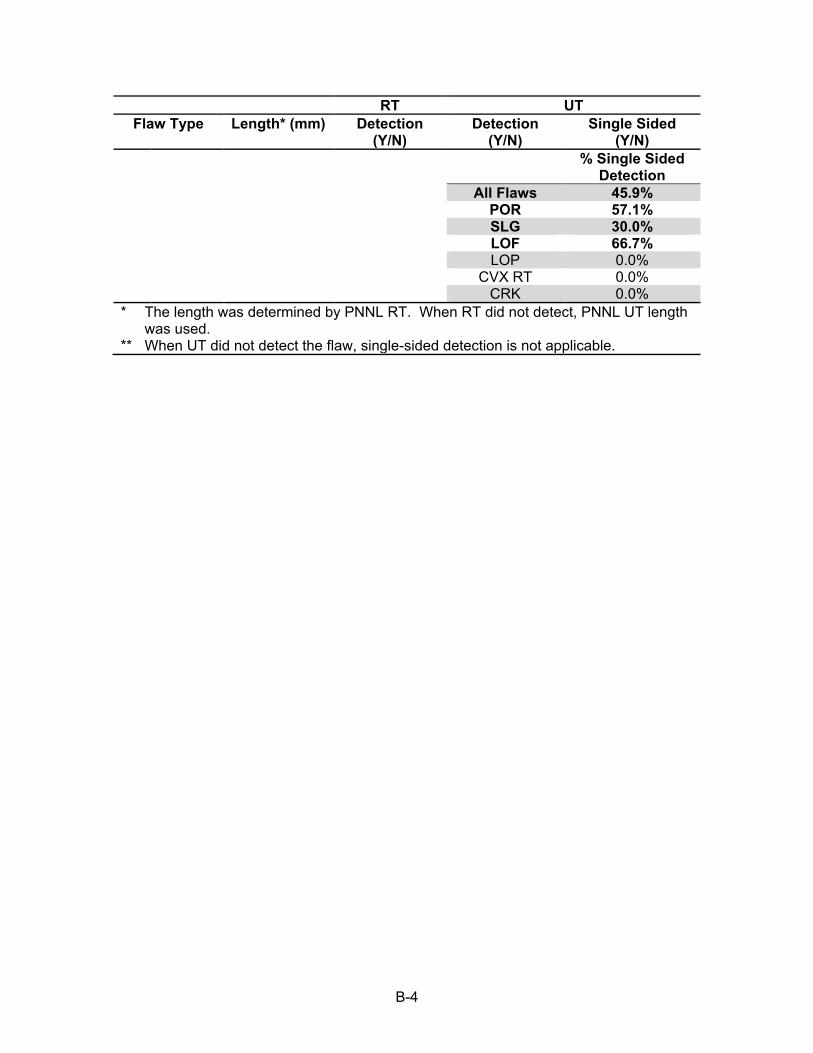
B-4
RT UT Flaw Type Length* (mm) Detection
(Y/N) Detection
(Y/N) Single Sided
(Y/N) % Single Sided
Detection All Flaws 45.9% POR 57.1% SLG 30.0% LOF 66.7% LOP 0.0% CVX RT 0.0% CRK 0.0%
* The length was determined by PNNL RT. When RT did not detect, PNNL UT length was used.
** When UT did not detect the flaw, single-sided detection is not applicable.
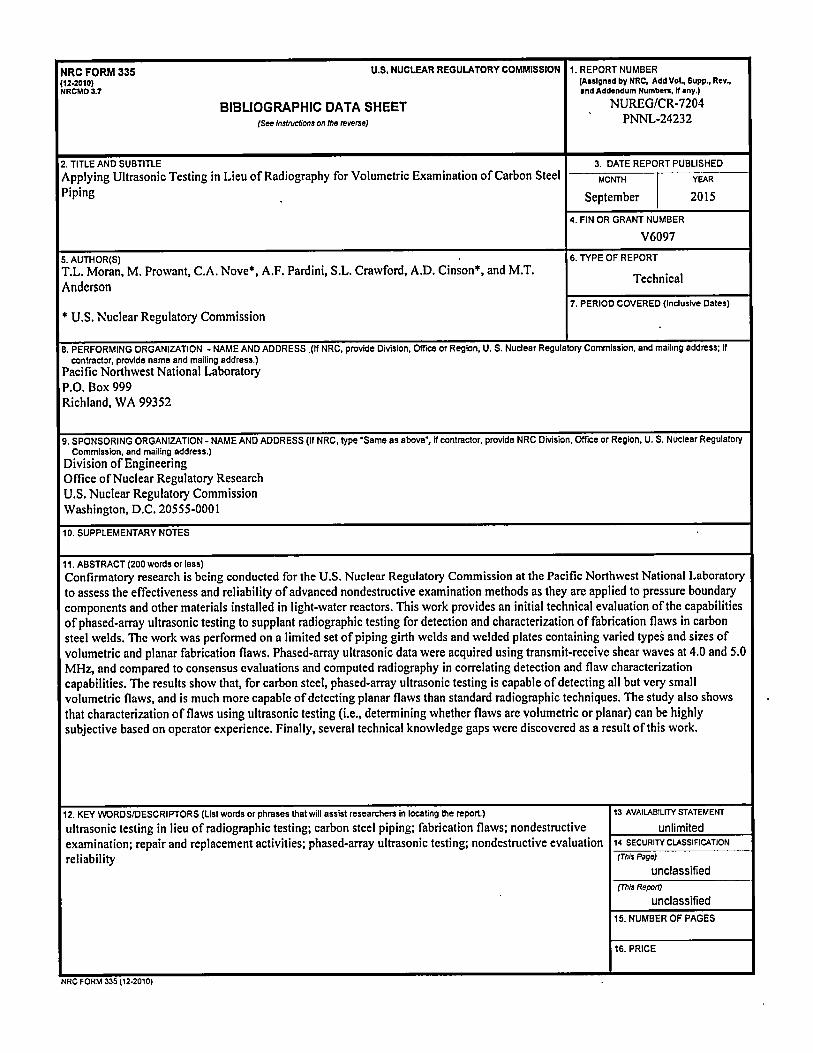


NU
REG
/CR
-7204
Applying Ultrasonic Testing in Lieu of R
adiography for Volumetric
Examination of C
arbon Steel Piping Septem
ber 2015