nutrient disorders of sweet potato - aciaraciar.gov.au/files/node/2150/mn048 part 1.pdf · nutrient...
TRANSCRIPT
NUTRIENT DISORDERS OF SWEET POTATO
J.N. O'Sullivan, C.J.Asher and F.P'C. Blarney
Department of Agriculture The University of Queensland
Australian Centre for International Agricultural Research
Canberra 1997

The Australian Centre for International Agricultural Research (AClAR) was established
in June 1982 by an Act of the Australian Parliament. Its mandate is to help identify
agricultural problems in developing countries and to commission collaborative research
between Australian and developing country researchers in fields where Australia has a
special research competence.
Where trade names are used this constitutes neither endorsement of nor discrimination
against any product by the Centre.
ACIAR MONOGRAPH SERIES
This peer-reviewed series contains the results of original research supported by
AClAR, or material deemed relevant to ACIAR's research objectives. The series
is distributed internationally, with an emphasis on developing countries.
© Australian Centre for International Agricultural Research
GPO Box 1571, Canberra ACT 2601, Australia.
O'Sullivan, J.N., Asher, C.J. and Blamey, F.P.C. 1997. Nutrient disorders of sweet
potato. ACIAR Monograph No 48, 136p.
ISBN 1 863202102
Technical editing, design and layout by Arawang, Canberra
Cover illustrations: a sweet potato field in east Java, Indonesia; marketplace at Rabaul.
Papua New Guinea.

Foreword
Farmers in developing countries grow sweet potato for a variety of uses. In China sweet
potato is grown in large quantities as an animal feed and an industrial crop. In the Pacific,
the crop is a major staple food needed in greater quantities as the population of the region
expands. Importantly, the intensification of cropping caused by population growth is
depleting the native soil fertility and exacerbating the nutrient disorders that are the focus
of this book.
The Australian Centre for International Agricultural Research (ACIAR) had no hesitation
in supporting the research that led to this publication. The geographic focus on the Asia
and the Pacific is important to ACIAR and partner scientists in Papua New Guinea, Tonga
and Samoa were keen to participate. The scientists from the University of Queensland
have a proven track record in research on the diagnosis of plant nutrient disorders. These
are the successful ingredients of ACIAR projects.
This publication is based on a systematic approach to research involving controlled
experiments and field surveys in the collaborating Pacific Island nations. The book is a
credit to the research partners and the ACIAR Publications Unit that helped produce it. I
congratulate them all. I hope that the publication is made available to field practitioners who
can use it to diagnose nutrient disorders in farmers' fields and recommend appropriate
remedies to correct the problems. Such widespread use of the publication will be ample
reward for the authors and should greatly benefit farmers producing sweet potatoes.
Eric T. Craswell Director-General
International Board for Soil Research and Management
Bangkok, Thailand
3

About the Authors
Jane O'Sullivan is Research Officer in Plant Nutrition in the Department of Agriculture,
The University of Queensland. She holds a Bachelor of Agricultural Science degree and a
PhD from The University of Melbourne. Much of the information contained in this
volume is the result of her research over the past five years on nutrient disorders in sweet
potato and taro, and their management in the Pacific region.
Colin Asher is Professor of Agriculture at The University of Queensland, and Director of
Research for the Faculty of Natural Resources, Agriculture and Veterinary Science at the
same university. He has a long-standing involvement in soil fertility assessment,
particularly in the Asia-Pacific region, and in improved methods for diagnosing nutrient
disorders in some of the less-studied crop plants. He has been involved in the development
of visual symptom descriptions and critical tissue concentrations for nutrient deficiency
and excess in sweet potato and various other crops.
Pax Blarney is Reader in Crop Agronomy in the Department of Agriculture, The
University of Queensland. He holds Bachelor and Master of Agricultural Science degrees
and a PhD from the University of Natal, South Africa. His research on acid soil infertility
has concentrated on the role of aluminium in reducing plant root growth, focusing on the
tolerance mechanisms of plant genotypes to soluble aluminium in the root environment.
This work has emphasised the importance of aluminium reactions in plant cell walls.
4

Contents
Foreword ............................................................................................................................... 3
About the Authors ................................................................................................................. 4
Acknowledgments ................................................................................................................ 8
Introduction .......................................................................................................................... 9
Managing Sweet Potato Nutrition .................... .................................................................. 13
Causes of nutrient disorders .................................................................................... 13
Diagnosing nutrient disorders ................................................................................. 14
Correcting nutrient disorders ................................................................................... 18
Nutrient requirements of sweet potato .................................................................... 19
Disorders Producing Symptoms Mainly on the Older Leaves ........................................... 21
Phosphorus deficiency ............................................................................................ 21
Potassium deficiency ............................................................................................... 27
Magnesium deficiency ............................................................................................ 32
Boron toxicity ............................................................................ .......... ..... ..... .......... 39
Manganese toxicity ................................................................................................. 43
Salinity .................................................................................................................... 47
Disorders Producing Symptoms on Leaves of Any Age .................................................... 53
Nitrogen deficiency .................................................... .......... ..... .............................. 53
Sulfur deficiency ..................................................................................................... 60
Manganese deficiency ............................................................................................. 64
Copper deficiency .................................. ..... ..... ....................................................... 69
Molybdenum deficiency .......................................................................................... 75
Zinc toxicity ............................................................................................................ 78
Copper toxicity .................................. .......... ................................. ..... ..... ..... ..... ....... 82
5

Disorders Producing Symptoms Mainly on the Younger Leaves ................ ....................... 87
Calcium deficiency .................................................................................................. 87
Iron deficiency ........................................................................................................ 93
Boron deficiency ..................................................................................................... 97
Zinc deficiency ...................................................................................................... 102
Disorders Producing No Specific Leaf Symptoms .............. .......................... .......... ......... 109
Aluminium toxicity ...................................... ................................. .... .. ....... ... ..... ... 109
Foliar Symptoms Produced by Pathogens and Pests ................................ .. .... .................. 113
References ............... ... .. ........................... ........... .... .... ................... ....... ...... ...... ................ 121
Appendix 1. Glossary, Scientific Names, Abbreviations, Conversions, and Symbols ..... 129
Appendix 2. Key to Nutrient Disorders ............. .......... ... ....... ........ ..... ..... ............. ... ......... 133
Table 1.
Table 2.
Table 3.
Table 4.
Tables Total production, production per capita and yield of sweet potato in 1993,
and the percentage change from 1985 to 1995, by region (derived from
FAD, 1996) .......................................................... ................................ ... ....... 9
Edible energy yield, and approximate composition per MJ edible portion,
of sweet potato and other major tropical staple crops .. ............................... 10
Critical nutrient concentrations for deficiency and toxicity, and the
adequate concentration ranges for sweet potato, measured in the 7th to
9th open leaf blades from the shoot tip, sampled at 28 days from planting.
Data were obtained from experiments in solution culture using
cv. Wanmun. ........... ............ ........ ............... ..... ......... ... .. .. ................. ..... ........ 17
Estimated removal of nutrients from the soil by sweet potato crops of
12 t/ha (average) and 50 tlha (high), for situations where only storage
roots are harvested, and where both roots and vines are removed. ............. 19
6
Figure 1.
Plate 1.
Plate 2.
Plate 3.
Plate 4.
Plate 5.
Plate 6.
Plate 7.
Plate 8.
Plate 9.
Plate 10.
Plate 11.
Plate 12.
Plate 13.
Plate 14.
Plate 15.
Plate 16.
Plate 17.
Plate 18.
Plate 19.
Figure Schematic relationship between nutrient concentration in the plant tissue
and dry matter yield relative to the maximum possible yield ...................... 16
Plates Phosphorus deficiency ........................... ....................................... ............... 22
Potassium deficiency .............. ..... ..... ......... ......... ............. ....... ..................... 27
Magnesium deficiency ................................................................................. 32
Boron toxicity .............................................................................................. 40
Manganese toxicity .. ......... ...... ........... ......... .............. ...... ......... ............ ........ 44
Salinity .............. .. ......................................... ................................................ 47
Nitrogen deficiency ...................................... .... ... ......................................... 55
Sulfur deficiency .. ....... ..... ............... ... .... .......... ....... ............ ... ..................... . 61
Manganese deficiency .................................................................................. 65
Copper deficiency ............ ...................................... ...................................... 69
Molybdenum deficiency .............................. ..... ........... ....... ......... ........... ..... 76
Zinc toxicity ......... ................... ............................................ ..... .................... 79
Copper toxicity ............................................. .. ... ......... ......... ..... .............. ..... 82
Calcium deficiency ...... ................................. .. ............................................. 88
Iron deficiency ... .......................................................................................... 93
Boron deficiency ................................... ............... .......... ... .............. .......... ... 98
Zinc deficiency ........................................................................... ............... 103
Aluminium toxicity ..................... ................................................................ 110
Foliar symptoms produced by pathogens ................................................... U5
7

Acknowledgments
This book is a product of Project No. 9101 of the Australian Centre for
International Agricultural Research (ACIAR). The project is entitled "Diagnosis
and correction of mineral nutrient disorders of root crops in the Pacific".
Numerous people have contributed to the production of this work. Collaborating
researchers on the project include Mr S. Halavatau of the Ministry of Agriculture
and Forestry, Kingdom of Tonga; Dr A.1. Dowling, Dr M. Johnston, Mr v.P.
Ila' ava and Mr A. Hartemink of the Papua New Guinea University of
Technology, Lae, Papua New Guinea; Mr W.D. Humphrey and Ms S. Ivahupa of
the Papua New Guinea Department of Agriculture and Livestock; and Mr L.
Loader of the Department of Primary Industries, Queensland, Australia. The
authors gratefully acknowledge the help of Mrs J. Mercer, Mr G. Walters, Mrs D.
Browne, Mr D. Appleton and Mr 1. Oweczkin, for their contributions to the
research conducted at The University of Queensland.
8
Grateful thanks are due to Dr R.M. Bourke of the Australian National University,
Canberra, who contributed some photographs and compiled literature on sweet
potato production and research in Papua New Guinea. Also thanks are expressed
to Ms 1. Low of the International Potato Center (CIP), Nairobi, Kenya, for the
use of photographs from Uganda. The manuscript has been translated into
Mandarin with the assistance of Dr Song Bofu of the Chinese Academy of
Agricultural Sciences, Beijing, People's Republic of China.
The following people are acknowledged for their contribution of photographic
plates:
R.M. Bourke:
A. Braun:
AJ. Dowling:
S. Halavatau:
v.p. Ila'ava:
L. Loader:
1. Low:
2h, 3e, l5a, 16i
19d, 19f, 19i
l6g
17h
14h, l8a
1ge
3b,3f, 7c, l8b, l8c
Sweet potato (Ipomoea hatatas (L.) Lam.) is a
hardy and nutritious staple food crop, which is
grown throughout the humid tropical and
subtropical regions of the world. It is a perennial
plant of the family Convolvulaceae, with long
trailing vines and leaves which vary in shape from
simple to deeply lobed. The edible roots, often
referred to as tubers, are formed by secondary
thickening of the upper part of some feeder roots.
Among the great diversity of cultivars grown, two
types are commonly recognised. The staple types,
grown throughout the tropics, are usually white, red
or purple, although yellow-fleshed types are popular
in Africa. The orange-fleshed types, preferred in the
USA, typically have a higher sugar and lower dry
matter content, and are usually eaten only as a
supplementary or dessert vegetable.
Originally domesticated in tropical America,
sweet potato spread to the South Pacific in
prehistoric times. However, in the countries where
sweet potato now has greatest importance, it is a
relatively recent migrant. European traders and
colonists brought the crop to Africa, Asia and the
western Pacific. It reached China in 1594 (Kochhar
1981) and Papua New Guinea (PNG) between 300
and 400 years ago (Yen 1974). Rwanda, now one
of the highest per capita consumers of sweet
Introduction
potato, began cultivating it only in the 18th century
(IITA 1992).
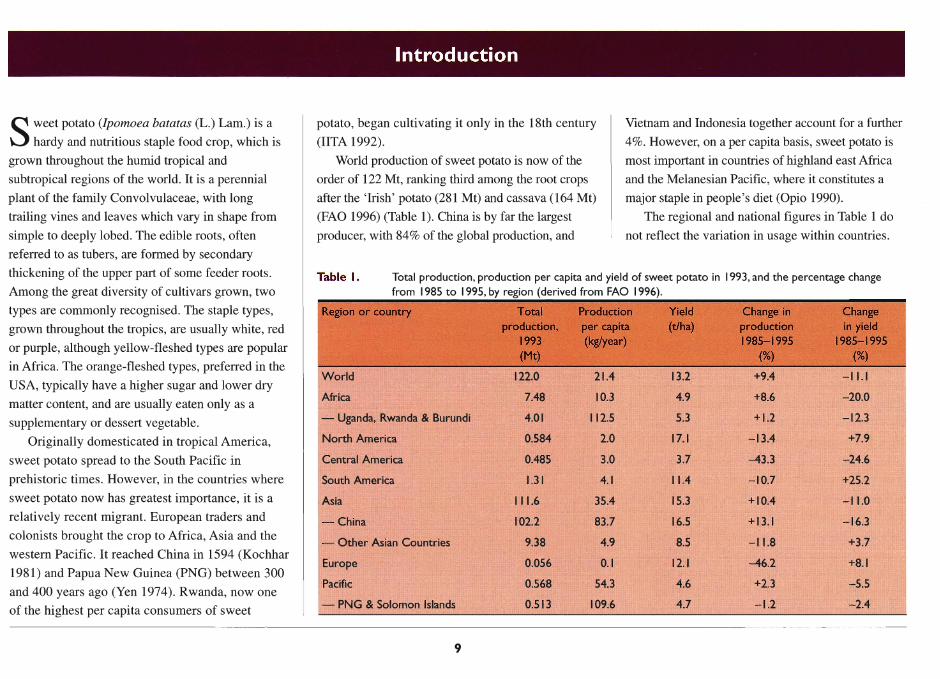
World production of sweet potato is now of the
order of 122 Mt, ranking third among the root crops
after the 'Irish' potato (281 Mt) and cassava (164 Mt)
(FAO 1996) (Table 1). China is by far the largest
producer, with 84% of the global production, and
Vietnam and Indonesia together account for a further
4%. However, on a per capita basis, sweet potato is
most important in countries of highland east Africa
and the Melanesian Pacific, where it constitutes a
major staple in people's diet (Opio 1990).
The regional and national figures in Table 1 do
not reflect the variation in usage within countries.
Table I. Total production, production per capita and yield of sweet potato in 1993, and the percentage change from 1985 to 1995, by region (derived from FAO 1996).
Region or country T oc:aI Production ptodUcdon, per capita
1993 (kgIyear) ' . (Me) .;', ....
World 122.0 21.4
Africa 7.48 10.3
- Uganda, Rwanda & Burundi 4.01 112.5
North America 0.584 2.0
Central America 0.485 3.0
South America 1.31 4.1
Asia 111.6 35.4
-China 102.2 83.7
- Other Asian Countries 9.38 4.9
Europe 0.056 0.1
Pacific 0.568 54.3
- PNG & Solomon Islands 0.5 13 109.6
9
rteld (tIha)
13.2
4.9
5.3
17.1
3.7
11.4
15.3
16.5
8.5
12.1
4.6
4.7
Change in production 1985--1995
(%)
+9.4
+8.6
+ 1.2
- 13.4
-43.3
-10.7
+ 10.4
+ 13.1
- 11.8
-46.2
+2.3
- 1.2
Change in yield
1985-1995 (%)
-I Ll
-20.0
-12.3
+7.9
-24.6
+25.2
- 11.0
-16.3
+3.7
+8.1
-5.5
- 2.4

In fact, sweet potato is the main staple food for
many communities. For example, a 1986 survey in
Rwanda found per capita sweet potato consumption
in the north-central region to be over 300 kg/year,
representing 40% of the food consumed (Woolfe
1992). Earlier studies in PNG villages recorded
adult consumption of 1.2-1.7 kg/day (approx.
400-600 kg/year), contributing over 90% by weight
of the food consumed (Sinnett 1975). Access to
imported foods in recent times has reduced this
percentage in many communities, but many PNG
Highlanders still rely on sweet potato for over half
of their dietary energy and over 30% of their protein
intake (Harvey and Heywood 1983).
Sweet potato is typically produced for food,
eaten by the grower's family or locally marketed in
an unprocessed form. However, an increasing
volume is being processed into industrial starch,
alcohol, noodles and other products, especially in
China. In some regions, sweet potato is also the
mainstay of livestock production, utilising both the
vines and undersized roots. In PNG, pigs raised on
sweet potato have traditionally been the main item of
trade and a measure of wealth, and may consume up
to 60% of the crop harvested (Harvey and Heywood
1983). In the Cafiete Valley in Peru, sweet potato
supports a modem dairy industry (Woolfe 1992).
Sweet potato is grown in a wide range of
environments, from the humid tropics to mild
temperate zones, and from sea level to 2700 m
altitude (Bourke 1985a). Like cassava, it can be
grown in semi-arid conditions, but it has greater
tolerance than cassava to the low temperatures
encountered at high altitude, and to heavy soils.
However, it is intolerant of waterlogging, and is
usually grown on ridges or mounds. Under
favourable conditions, the vines grow quickly to
cover the soil, eliminating weeds and hence
minimising the labour required after planting.
Clarke (1973) identified a number of factors
contributing to the rapid rise of sweet potato to
dominance in the agriculture of PNG, supplanting
the traditional taro and yam. Importantly, sweet
potato has a wider tolerance of soil conditions,
allowing extended rotations and cultivation of
previously marginal areas, and it requires less
labour, produces yield earlier, can be harvested over
an extended period as required for consumption, and
does not require cooking before feeding to animals.
Increasing population pressure, and the use of land
and labour for cash cropping, continue to promote
the shift to sweet potato production. Many of these
factors playa role in other countries which have
adopted sweet potato as a subsistence crop.
Sweet potato's short growth period (average
140 days) and the high edible proportion of the
harvested product contribute to a very high edible
energy yield compared with other staple crops
(Table 2). The data in Table 2 are based on average
Table 2. Edible energy yield, and approximate composition per MJ edible portion, of sweet potato and other major tropical staple crops.
Edible Proteinb CaJciumb lronb Jkarotene Thiaminea Riboflavin Niacin" Ascorbic energy yield (g) (mg) (mg) equiv.b,c (mg) (mg) (mg) (mg) acid"c
MJlhalday" (mg)
Sweet potato 201 3.6 67 1.5 0-42d 0.22 0.08 1.5 62
Cassava 146 1.7 66 1.9 0-0.25 1.10 0.05 1.1 48
Potato 205 5.9 25 2.3 Trace 0.31 0.11 3.4 85
Banana 184 3.3 20 1.5 1.0-2.6 0.09 0.09 1.3 38
Rice 138 4.1 14 0.3 0 0.04 0.02 0.7 0
Wheat 142 7.5 21 1.1 0 0.21 0.06 1.4 0
Maize 155 5.7 13 1.9 0.3 0.23 0.09 1.3 0
Sorghum 100 7.6 II 4.7 0 0.33 0.08 2.3 0
Sources: a de Vries et al. (1967), derived from Platt (1965); b Woolfe (1992) C Losses of 18-78% of ascorbic acid (vitamin C) and 20-25% of carotenoids are incurred during boiling.
d Higher carotenoid content is found in orange-fleshed cultivars.
10
I

yields in tropical countries, and do not take into
account differences in growth conditions. For
instance, sweet potato, cassava and sorghum are
more likely to be grown as traditional cultivars on
poor soils, without irrigation or fertilizer, than are
rice, potato or wheat. These considerations further
emphasise the high yield potential of sweet potato.
Root crops are often considered to be
nutritionally inferior to cereals (de Vries et al.
1967). However, when compared on an equal
energy basis (Table 2), sweet potato has an average
protein concentration comparable with that of rice.
Furthermore, the protein concentration in sweet
potato is highly variable, and there is potential for
significantly improving the average through both
genetic and management factors. A survey of South
Pacific crops found protein concentrations from
0.46-2.93%, equivalent to 1.0-6.1 g/MJ (Bradbury
and Holloway 1988).
Sweet potato is also a good source of calcium,
ascorbic acid (vitamin C) and ~-carotene
(provitamin A). The yellow- to orange-fleshed
cultivars contain particularly high levels of
carotenoids, and are equalled only by carrot as a
source of provitamin A (Woolfe 1992). Vitamin A
deficiency is a common and serious health problem
in many countries with rice-based diets, being the
main cause of blindness in children. Less acute
deficiency decreases children's resistance to
infectious diseases, contributing to infant mortality.
In response to this problem, efforts are being made
in some Asian countries to promote the use of
yellow-fleshed cultivars of sweet potato. There is
scope for breeding yellow-fleshed sweet potatoes
with higher dry matter and lower sugar content,
which are more acceptable to users of traditional
staple varieties.
The young leafy shoots, which are eaten as a
green vegetable in some countries, particularly in
Asia, are high in protein (approximately 20% of dry
weight), and are also a good source of ~-carotene,
thiamine (vitamin B1), riboflavin (B2), folic acid and
ascorbic acid (Villareal et a1. 1985; Woolfe 1992).
In many countries, sweet potato is viewed as a
poor man's food, with lower per capita consumption
in higher income brackets (Woolfe 1992). This view
has probably contributed to the relatively small
research effort which has been applied to the
development of sweet potato, compared with other
crops of similar importance. A large proportion of
the research effort has been directed towards
selection and breeding of improved cultivars. This
attention is justified, given both the high potential
for crop improvement and the great diversity of
cultivars available to the breeder. In PNG alone,
about 1200 accessions are maintained, and the total
number of indigenous cultivars may be as high as
5000 (Bourke 1985a). However, relatively little
attention has been given to improvements in crop
management, particularly in crop nutrition, despite
large potential gains in the short term.
II
The potential yield for sweet potato under ideal
conditions is approximately 80-100 t1ha. While
such yields are unrealistic in most practical
conditions, in intensive, high-input systems such as
are found in east Java, the best farmers consistently
produce yields of 30-50 t1ha within four months of
planting (E. van de Fliert, pers. comm. 1996). Even
in subsistence gardens, yields recorded in PNG vary
from less than 1 t1ha (Floyd et a1. 1988) to as much
as 50 t1ha (Conroy and Bridgland 1950, cited in
Bourke 1982). Yet the global average yield is only
about l3 t1ha (Table 1), and that in semi-subsistence
economies appears to average only 4-6 tlha.
This yield gap represents an enormous potential for
improving food production. This is especially true
in Africa, the Pacific and Central America, where
high pressure on land resources, through population
growth and expansion of cash cropping, necessitates
such an improvement. Yet it is disturbing to note
that yields in these areas are either declining or
almost static (Table 1).
Whilst many factors contribute to low yield
under farming conditions, nutritional problems are
worthy of attention, firstly because of their
prevalence, and secondly because of the large gains
that can be made by alleviating them.
Nutrient deficiencies almost invariably limit yields
of subsistence crops, and are common even in
fertilized crops. Mineral toxicities, particularly
those associated with acid soils, affect many areas
and may cause complete crop failure, but the

problem is often not correctly diagnosed. The
decline in yield following continuous cropping of
the same land is often largely due to depletion of
soil nutrients, as can be seen by the response of
sweet potato crops in old gardens to nutrient
additions, either in the form of organic mulches or
inorganic fertilizers (e.g. Bourke 1985b; D'Souza
and Bourke 1986a, b; Floyd et al. 1988). However,
the traditional fallow practices relied upon to renew
fertility are being compromised due to increasing
pressure on land resources (Bourke 1977a;
Halavatau et al. 1996). The challenge is to restore
sustainability in those areas where intensification
has reduced yield, and to improve yield where land
resources are limited for the expansion of
production.
Accurate diagnosis of nutritional problems is a
vital and indispensable first step to finding solutions
to them that are technically sound, affordable, and
friendly to the environment. Correction of a
nutritional disorder does not necessarily require the
use of inorganic fertilizers. In some cases, solutions
may be available using local resources and
improved management practices, including the use
of leguminous plants in the cropping cycle. Many
traditional practices add or conserve soil nutrients
(e.g. D'Souza and Bourke 1986b), and new
techniques are continually being developed.
However, expanding trade and income opportunities
make the use of fertilizers a desirable option for an
increasing number of producers. For maximum
benefit to producers, amendments will need to be
applied on the basis of an understanding of the
crop's requirements, and a recognition of which
factor or factors are most limiting to production at a
particular site.
This book is intended to aid those involved in
sweet potato production (producers, advisers and
researchers) in the diagnosis of nutritional
problems, and to provide guidance towards
correcting them. We have attempted to provide a
comprehensive coverage of the current knowledge
on sweet potato nutrition, although it is appreciated
that such detail may make the information difficult
for some farmers to access. It is hoped that this
book will provide a resource from which farm
advisers can extract information appropriate for the
environment, culture and resource availability of
local sweet potato growers.
12
The structure and use of this book
This book provides detailed, illustrated
descriptions of all nutritional disorders of sweet
potato which are likely to occur under field
conditions. With each description, some information
is given on the occurrence and management of the
disorder. Mention is also made of other disorders
which may present similar symptoms, and of
diagnostic tests which may be applied to confirm a
tentative diagnosis based on visible symptoms. The
section on managing sweet potato nutrition may
help in interpreting symptoms and in deciding what
further steps to take. A glossary of specialist terms
has also been included (Appendix 1).
To help the reader to locate relevant information
quickly, disorders have been grouped according to
where on the plant the symptoms are most likely to
be seen. At the back of the book (Appendix 2) is a
key to nutritional disorders based on their visible
symptoms, which serves as a quick reference to the
information on each disorder. The reader may wish
to consult the key first.

Plant nutrients are the chemical elements which
are essential components of plant tissue. For
healthy growth, plants require an adequate supply of
each of these elements. The most abundant elements
in plants, carbon (C), oxygen (0) and hydrogen (H),
are obtained from the air and water. The others,
referred to as the mineral nutrients, are supplied by
the mineral and organic components of the soil.
They are divided into two groups, according to their
abundance in plants. The macronutrients, nitrogen
(N), potassium (K), phosphorus (P), calcium (Ca),
magnesium (Mg) and sulfur (S), comprise from 0.1
to 6 % of dry plant material. The micronutrients,
including iron (Fe), chlorine (Cl), boron (B),
manganese (Mn), zinc (Zn), copper (Cu) and
molybdenum (Mo), have requirements in the order
of 0.1-100 mg per kg dry weight.
A deficiency of anyone nutrient results in a
reduced growth rate and yield of the crop. The
problem can only be corrected by increasing the
supply of that nutrient. No amount of N or P
fertilizer, for instance, can compensate for a
deficiency of B. Therefore, it is important to
diagnose a nutritional disorder correctly, in order to
treat it efficiently.
It is also important to recognise that supplying a
nutrient in excess of the crop's requirement is of no
Managing Sweet Potato Nutrition
benefit to the crop. It is an unnecessary expense, and
may cause environmental pollution when excess
nutrients leach into streams and groundwater
supplies.
Many mineral nutrients (including B, Cl, Mn
and Cu) are toxic to plants if they are present at high
concentrations. Some other elements, which are not
essential nutrients for sweet potato, may also cause
toxicity. These include aluminium (AI), a problem
in acid soils, and sodium (Na), in saline soils.
Causes of nutrient disorders
The supply of a mineral nutrient to the plant is
determined not only by its total abundance in the
soil, but also by the proportion of the total which is
in an available form at any time, and by the plant's
ability to capture this available component.
Usually only a small proportion of the total
nutrient is available for uptake. Availability of many
essential nutrients is affected by soil pH. At high pH
(alkaline soil), the solubility of P, and of many
micronutrients (e.g. Fe, Mn, Zn and Cu) is greatly
reduced, and the crop may experience deficiencies
of these nutrients. At low pH (acid soil), the
solubility of some elements, particularly P and Mo,
is reduced, while that of Al and Mn may be
13
increased to toxic levels. Disorders such as Al
toxicity, which inhibit root development, reduce the
plant's ability to capture nutrients and water, and
may induce symptoms of secondary disorders such
as Mg deficiency or water stress. It is important to
recognise the primary agent in such cases.
Deficiencies of macro nutrients, particularly N, P
and K, are often associated with fertility decline
following sequential cropping. These elements are
taken up in such large quantities by the crop that the
soil's reserves become depleted after a number of
crops have been produced. Increasing cropping
intensity results in an increasing dependence on
external supplies of these nutrients. In low-intensity
agriculture, supplies may be replenished during a
bush fallow, by allowing time for weathering of
mineral particles, by redistributing nutrients into the
crop's root zone from below, and by capture of
wind-borne nutrients from sea spray. Nutrients
accumulated by plants during the fallow become
available to the crop as the plant material
decomposes, or when it is burnt. Burning makes
many nutrients immediately available to the
following crop, but it also makes those nutrients
easily lost by leaching. Burning also decreases the
soil's ability to continue supplying nutrients, as
there is less organic material to decompose. Some

nutrients, particularly Nand S, are lost into the
atmosphere during burning.
Deficiencies of micronutrients are usually
associated with low natural abundance in the soil, or
unfavourable soil conditions causing insolubility of
these nutrients. In the case of low abundance,
correction usually requires the application of only a
few kilograms per hectare of the deficient nutrient,
which may be effective for a number of years. Such
inputs are likely to be cost-effective, even when the
application of N or P fertilizers is not. The
management is more difficult when the deficiency is
due to adverse soil conditions, such as the very high
pH in coralline soils. Applying the nutrient as a
foliar spray is one way to avoid it being fixed in
such soils. Increasing the organic matter content of
the soil is also beneficial.
Diagnosing nutrient disorders
Plants respond to a deficiency of any nutrient
firstly by decreasing their growth rate. Specific
symptoms which may allow the deficient nutrient to
be identified, usually occur only at relatively severe
levels of deficiency. Nevertheless, such symptoms
are often the first thing to alert the grower that there
is a problem, and they are very useful for diagnosis.
Since plant species differ in sensitivity to particular
nutrient stresses, observation of symptoms on other
crops in the same area should indicate to producers
and advisers that the problem may also be affecting
sweet potato, even if symptoms are not evident on
sweet potato crops. Chemical analysis of the plant
tissue provides a second diagnostic tool, which,
when available, can be very valuable for confirming
a tentative diagnosis based on visible symptoms, or
identifying a suspected problem when symptoms are
not visible.
If a soil is low in several nutrients, the plant
usually shows deficiency symptoms of the element
which is most limiting to growth. If that nutrient is
supplied, the growth rate will increase until it is
limited by the next most scarce nutrient, and a new
set of symptoms may develop. It is difficult to
establish from plant symptoms or tissue
composition which nutrients are likely to be
deficient other than the one most limiting. Soil tests
may provide some guidance, but they need to be
calibrated for each crop and soil type before they
can be interpreted with confidence.
One of the simplest and most reliable methods
of discovering all the nutrients which are deficient
in a soil is through small pot trials. In nutrient
omission pot trials, each pot receives an adequate
supply of all the mineral nutrients (control, or 'All'
treatment), or all minus one. Plants are grown for a
short period (usually 4-6 weeks), and the dry
weight of tops is compared with that of the 'All'
treatment. Any nutrient whose absence results in a
significant decrease in weight is regarded as
deficient. Usually an indicator plant such as maize is
used, which offers rapid and uniform establishment
14
from seed, and well characterised responses to
nutrient deficiencies. However, nutrient levels
which are deficient for one species may be adequate
for another. In recent studies, sweet potato tip
cuttings have been used successfully in nutrient pot
trials (Dowling et al. 1995, 1996).
If a nutrient deficiency is suspected, the best
way of confirming it is by observing a positive
response to fertilizer containing that nutrient. When
testing a fertilizer response, it is important to have
an untreated area for comparison. Usually a narrow
test strip in the middle of the field is treated with
fertilizer. Alternatively, fertilizer may be applied to
the whole field, with the exception of a central strip,
which would remain unfertilized. Fertilizers often
contain more than one nutrient, an it is important to
establish which nutrient is causing the response. For
example, Nand S deficiencies both produce similar
symptoms in the crop. They can be differentiated by
applying sulfate of ammonia (containing both Nand
S) to one strip and urea (containing only N) to
another. If the crop greens up in both strips, the
problem is N deficiency, but if it only responds to
the sulfate of ammonia, it is S deficiency.
Another useful technique for confirming
deficiencies of micronutrients is leaf painting. By
carefully painting half of an affected leaf with a
dilute solution of the suspected nutrient, the
response can be seen by comparing the colour or
expansion of the painted half with the unpainted
half. Leaf painting has been used successfully to

------------------------- - ---------------------------------------------------------------------------------------------------
diagnose deficiencies of Fe, Mn and Zn in sweet
potato.
Interpreting visible symptoms
Due to the different role played by each nutrient
in the plant, each nutritional disorder tends to
produce its own characteristic symptoms. Visible
symptoms provide a useful diagnostic tool which is
not dependent on costly laboratory equipment or
time-consuming chemical analyses. However, some
disorders produce rather similar symptoms or no
symptoms at all, and the effects of insect pests and
diseases may produce symptoms similar to those of
nutritional disorders. Environmental conditions (e.g.
moisture supply, temperature, light) may affect the
appearance and severity of nutrient disorders.
Cultivars may also differ in their expression of
symptoms. Sweet potato, in particular, shows
enormous diversity in the appearance of cultivars,
and this is reflected in the range of symptoms they
display. Nevertheless, there are distinct patterns, and
a careful observer can usually reduce the number of
possible causes to a few, if not to a single suspect.
Tentative diagnoses can then be confirmed by
applying fertilizer test strips, by soil tests, leaf
painting or plant tissue analyses.
Visible symptoms often take the form of
chlorosis, the reduction of green colour (chlorophyll
pigment) in the leaves. Chlorotic tissue may be light
green, yellow or whitish. Tissue furthermost from
the veins is often the most severely affected, as it is
last in the supply line. Hence, chlorosis patterns are
frequently described as interveinal, if the tissue on
and adjacent to the veins retains a darker colour than
the remainder of the leaf. To what degree the minor
veins retain their colour in addition to the major
veins, and the distance over which the colour
change is graduated, are additional features which
aid diagnosis. If the chlorosis affects the whole leaf
blade uniformly, it is referred to as 'general'. 'Vein
clearing', the case when the veins become paler than
the rest of the blade, is more often a symptom of
viral infection than of a nutritional disorder.
Necrosis is the death of tissue. It may occur
following chlorosis as part of a progressive
degradation, or it may arise in localised zones of the
leaf due to a critical disfunction. The location, shape
and size of necrotic lesions are useful discriminators,
as are the colour and texture of the dead tissue.
Other symptoms include changes in the
occurrence and intensity of secondary pigmentation
(red or purple colours), changes in the shape or
dimensions of plant parts such as thickening,
cupping or curling of the leaf blade, size reduction
of the blade, deformities causing irregularly shaped
or incomplete leaf blades, or shortening of
internodes on the stem.
In addition to the appearance of a particular
symptom, the position or location of that symptom on
the plant must be noted. Nutrients are absorbed by
the root system, and distributed among the various
15
plant parts. Some of these nutrients may be
redistributed to younger parts of the plant during
times of shortage either readily (e.g. K, P), more
slowly (e.g. S) or hardly at all (e.g. B, Ca). Thus,
deficiencies of K and P are likely to be observed first
on older leaves, that of S on both older and younger
leaves, and those of B and Ca on the younger leaves.
Elements taken up in excess of plant requirements
continue to be accumulated during the life of a leaf.
Thus, there will be a tendency for toxicity symptoms
to appear first on the older leaves where
accumulation has been occurring for the longest time.
In many locations, sweet potato flowers
sparingly or not at all. An unusually prolific or early
production of flowers is usually a sign that the crop
is under nutritional stress. However, as a number of
nutrient deficiencies can cause increased flowering,
this symptom is of little use in diagnosing the
particular deficiency.
Interpreting tissue analyses
Chemical analysis of plant tissue is also an
important technique in the diagnosis of nutritional
disorders. In annual crops, tissue analysis is most
often used in 'trouble-shooting' rather than in the
recommendation of fertilizer rates. However, if the
tissue samples are collected early in crop growth
and analyses are completed quickly, a corrective
fertilizer application may be possible within the
same season.

The interpretation of tissue analyses is based on
established relationships between crop yield and
nutrient concentrations in plant tissue (Fig. 1).
Critical concentrations are those which separate the
sufficient (healthy) range from the deficient or toxic
range. For practical purposes, critical concentrations
are defined as those concentrations associated with
90% of maximum yield (Ulrich and Hills 1973).
Between these concentrations is the range of
concentrations required for healthy growth.
Figure I.
I I I
I I I
I CrItIcal I concentration I for deficiency
CrItIcal I concentration I
for toXicity I Nutrient concentration in plant tissue
Schematic relationship between nutrient concentration in the plant tissue and dry matter yield relative to the maximum possible yield.
The relationship between crop yield and
concentration of a particular nutrient in plant tissue
may be determined by means of nutrient solution
culture experiments, glasshouse pot experiments, or
field experiments. Generally, field experiments are
considered the best (Bates 1971), but are
considerably more expensive than solution culture
and pot experiments. They also depend on the
availability of sites which are deficient in each of
the nutrients to be studied. The values given in this
publication have been derived from solution culture
experiments (O'Sullivan et al. 1996a). Where
possible, their reliability has been validated under
field conditions.
A certain part of the plant rather than the whole
plant, is usually collected for analysis. Leaves are
usually considered the most satisfactory parts (Bates
1971). Because leaves continue to accumulate some
nutrients with age, it is important that nutrient
concentrations in leaves of the same physiological
age are compared. In many annual crops, the blade
of the youngest fully expanded leaf is selected as the
'index' tissue for analysis. However, sweet potato
leaves may continue to expand throughout much of
their life, so their physiological maturity cannot be
judged easily on the basis of full expansion. The
many studies referred to in this book have selected
different leaves or parts of the vine for analysis,
which makes the information difficult to compare.
In our research, the blades of the 7th to 9th youngest
leaves have been selected as the index tissue (Table 3).
16
They were selected as being sufficiently responsive
to disorders of both mobile and immobile nutrients,
and having less variable nutrient concentrations than
younger leaves (O'Sullivan et al. 1996b).
Apart from the physiological age of the leaf, as
indicated by its position on the plant, tissue
composition may vary with the age or stage of
development of the crop. For instance, some
researchers have found the critical concentration for
N deficiency to decline with crop age. Caution
should therefore be exercised in applying the critical
concentrations established for young plants to tissue
taken from older crops. With regard to the values
given in Table 3, it should be noted that the sweet
potato plants grew more rapidly under experimental
conditions than could be expected in the field, and
that these plants may be equivalent to crops from 6
to 10 weeks of age, depending on the temperature
and water supply experienced by the crop. In any
case, they represent crops prior to the stage of rapid
growth of the storage roots. From the point of view
of applying corrective measures to the crop on the
basis of the diagnosis, it is preferable to sample the
crop at the earliest stage possible. However, in many
instances, symptoms of a disorder may not appear
until advanced stages of crop development. In such
cases, tissue analysis will still be valuable, but
discrepancies arising from plant age should be
borne in mind when interpreting the results.
Environmental conditions may further affect the
concentrations of nutrients found in leaves. The

concept of critical nutrient concentration requires
that the nutrient of interest is the only factor limiting
growth when the plant material is sampled. It has
been shown that water stress can change the nutrient
concentrations in leaves, and that plants take some
time to recover normal concentrations after
restoration of adequate water supply (Reuter and
Robinson 1986). For example, to establish the P
status of Stylosanthes humilis, Fisher (1980)
recommended that a period of several weeks without
water stress should precede the sampling of tissue.
This is not practical in many situations, but users
should be mindful of this potential source of error.
To collect leaf samples, the blades are removed
without the petiole, and should be dried as soon as
possible after sampling, using gentle heat
(e.g. 60--70°C for 48 hours) or microwaving. If
samples must be stored for more than a few hours
before drying, it is preferable to keep them cool
(e.g. in an ice box) to minimise the weight loss due
to respiration of the living tissue. It is important to
sample leaves that have not been contaminated with
soil. If the leaves are dusty, they may be gently
rinsed and blotted dry, but extended immersion in
water and rubbing should be avoided. Only distilled
or deionised water should be used.
When sampling a crop, it is best to take a
composite sample of leaves from several plants which
are equally affected by the symptom of concern
(Reuter and Robinson 1986). If the crop is not
uniformly affected, several samples could be taken,
each from small, uniform areas of the crop, from the
most to the least affected. The symptoms observed,
and the level of severity, should be recorded for each
sample, and the samples clearly labelled.
Soil analysis
The total amount of a nutrient in the soil does
not generally reflect the quantity available for
uptake by plant roots. Thus, chemical methods have
been developed, and continue to be developed, to
estimate the quantity of a nutrient that is available to
the plant. In addition to the requirement that the
method provide a good estimate of nutrient
availability in a defined range of soil types, soil
analysis methods must be rapid, accurate, and
reproducible before being accepted for routine use
in soil testing laboratories.
Table 3. Critical nutrient concentrations for deficiency and toxicity, and the adequate concentration ranges for sweet potato, measured in the 7th to 9th open leaf blades from the shoot tip, sampled at 28 days from planting. Data were obtained from experiments in solution culture using cv.Wanmun.
Nutrient Unit Critical concentration for Adequate range Critical concentration deficiency for toxicity
Nitrogen % 4.0 4.2-5.0
Phosphorus % 0.22 0.26-0.45
Potassium % 2.6 2.8-6.0
Calcium % 0.76 0.90-1.2
MagneSium % 0.12" 0.15-0.35
Sulfur % 0.34 0.35-0.45
Chlorine % 0.9-1.5
Iron mg/kg 33 45-80
Boron mg/kg 40 50-200 220-350
Manganese mg/kg 19 26-500 1600"
Zinc mg/kg II" 30-60 70-85
Copper mg/kg 4-5 5- 14 15.5"
Molybdenum mg/kg 0.2 0.5-7
a These critical concentrations have been found, on occasion, to be inconsistent with field observations. or to vary with
environmental conditions. Refer to the relevant sections for a full discussion.
17

The results of soil analyses are interpreted on the
basis of previously-established relationships
between crop yield and soil test. These relationships
may be established by means of glasshouse pot
experiments or field experiments. In either case,
they are specific to both the soil type and the crop
species (and to some extent, the cultivar) used in the
experiments, and can be applied to other crops or
soils only with a degree of caution and uncertainty.
One advantage of soil analyses is the fact that
they can be conducted, and fertilizers applied, before
a crop is planted. Disadvantages of soil analyses
include the difficulty of obtaining methods suited to
varied soil types, problems in sampling due to soil
variation across a field, and problems in estimating
the likely effects of environmental conditions in the
forthcoming season (Melsted and Peck 1973).
Correcting nutrient disorders
Once a nutritional problem has been correctly
diagnosed, it is usually possible to rectify it, if not
for the present crop, then at least for future crops at
the same site. Whether or not a corrective measure
can improve yields in an existing crop will depend
on the nature of the problem and on the age of the
crop when the diagnosis is made.
Nutrient deficiencies are alleviated by increasing
the supply of the deficient nutrient. Applying
inorganic fertilizers is one way of doing this.
Another may be to add organic material such as
animal manure, if it contains an appropriate balance
of the required nutrients. Other approaches aim to
change the soil properties, in order to increase the
availability of nutrients already present or to reduce
the supply of elements causing a toxicity. The pH of
acid soils may be increased by adding lime (CaC03)
or dolomite (CaC03.MgC03). Gypsum
(CaS04.2H20) may be used to correct problems of
soil surface crusting and poor permeability in saline
and sodic soils. In soils prone to waterlogging,
improved drainage may be necessary to reduce
denitrification, to reduce the production of toxic
forms of Mn, or simply to ensure that the roots
receive enough oxygen to function well. Sweet
potato roots are very sensitive to low oxygen supply.
Increasing the organic matter content of the soil
has a number of beneficial effects. The gradual
decomposition of this material provides a steady
supply of plant-available nutrients. The organic
particles may also provide a suitable substrate on
which soil nutrients can be held in an available
form. Organic matter increases the soil's ability to
resist acidification. It also increases water retention
so that the soil takes longer to dry out, and gives the
soil an open texture so that more air can get to the
roots. Organic matter is increased by leaving crop or
fallow residue on the field, without burning, or by
bringing plant material from another site. If the need
for field sanitation prevents leaving the crop
residue, then options may be to compost it and
return it later, or to use it to mulch another crop
18
which is not at risk from the pest. Often sweet
potato vines are removed and used to feed stock.
Returning the animal manure to the field replaces
some of the nutrients, but it will not maintain the
organic matter content of the soil unless
supplemented by plant material from fallow or
green manure crops.
Plant species, and even cultivars within species,
differ in their sensitivity to low nutrient levels in the
soil. They may vary in their nutrient uptake or in
tissue requirements for a particular nutrient. For
some crop species, agricultural scientists have
developed cultivars resistant to particular nutrient
problems, such as sunflower cultivars tolerant of
low B supply (Blamey et al. 1984), and barley
cultivars resistant to B toxicity. In sweet potato, a
great diversity of cultivars exist, and there is
evidence of regional adaptations conferring
tolerance to low N (Jones and Bouwkamp 1992),
and possibly to low B (D'Souza and Bourke 1986a).
Researchers have identified lines which are tolerant
of Al (e.g. Munn and McCollum 1976; Sangalang
and Bouwkamp 1988; Ritchey et al. 1991) or of
salinity and B toxicity (Chavez et al. 1995). It is
likely that variation exists in the requirements for
other nutrients also, which may be used in the future
for selection and breeding of cultivars to overcome
particular nutritional problems.
The approach taken to crop nutrition will depend
on the grower's context. Where fertilizers and water
are readily available and relatively inexpensive,

growers may aim to maximise the crop's potential by
eliminating any nutritional stress. Where fertilizers
are unavailable or too expensive, the aim may be to
optimise use of resources in the agroecosystem, in
order to gain an adequate and sustainable reward for
the grower's labour. At whatever level of operation,
it is important to recognise the limitations of the
resource base. A traditional cropping system may
become unsustainable through intensification,
whether by increasing the number of crop cycles
between fallows, or shortening the fallow period.
However, intensification is frequently paralleled by a
shift from subsistence to cash cropping. At some
point in this progression, the purchase of inputs,
including fertilizers, may become profitable. Grower
advisers should remain aware of the options, even if
some are not currently cost-effective.
Nutrient requirements of sweet potato
Sweet potato is regarded as being tolerant of
poor fertility, as it may produce adequate yields on
soils too poor for many other crops. However, the
yield obtained on poor soil will be only a fraction of
the potential yield for the cultivar. Often large
increases in yield can result from a modest increase
in nutrient supply.
Most of the nutrients taken up by a sweet potato
crop are removed from the site when the crop is
harvested. Depending on the extent of nutrient
reserves in the soil, this loss may be incurred only
once or several times before yields of subsequent
crops suffer from nutrient deficiency. The amount of
nutrients removed by the crop depends on the yield,
and on whether the vines are removed from the field
as well as the roots . Table 4 gives approximate rates
of nutrient removal for crops yielding 12 tlha of
storage roots (about the global average) and 50 tlha
(a high yield) . In an intensive farming system, those
nutrients for which the soil has limited reserves may
be supplemented by fertilizers . In addition to crop
removal, nutrient losses through leaching, soil
erosion and fixation will affect the actual fertilizer
requirement. In less intensive systems, the rate of
cropping that is sustainable will depend on the time
required for soil reserves to be mobilised, or organic
material to decompose, to replenish the plant
available nutrient pools in the soil.
Table 4. Estimated removal of nutrients from the soil by sweet potato crops of 12 tlha (average) and 50 tlha (high). for situations where only storage roots are harvested. and where both roots and vines are removed.
Roots and Vlnesb
Nitrogen 26 52 215
Phosphorus 6 9 38
Potassium 60 90 250 376
Calcium 3.6 16 15 65
Magnesium 3 6.5 12.5 27
Sulfur 1.8 4.3 7.5 18
Chlorine 10 18 43 75
Iron 0.060 0.160 0.250 0.670
Boron 0.024 0.074 0.100 0.310
Manganese 0.024 0.175 0.100 0.730
Zinc 0.036 0.062 0. 150 0.260
Copper 0.018 0.037 0.075 0. 155
Molybdenum 0.004 0.006 0.015 0.023
'Concentrations of nutrients in sweet potato roots and tops vary considerably. Quantities of nutrients removed have been based on representative concentrations from a number of sources (including Scott and Bouwkamp 1974; Bradbury and Holloway 1988; Woolfe 1992; Spence and Ahmad 1976; Diem 1962; Hill 1989; and the authors' own data), converted to fresh weight basis assuming 70% moisture in the storage roots and 86% moisture in the vines.
bA vine:root weight ratio of 0.6 was assumed. Actual ratios may vary in the approximate range OJ-I.4.
19

Disorders Producing Symptoms Mainly on the Older Leaves
Phosphorus deficiency
The phosphorus (P) availability to plants may be
limited by its low abundance in the soil, but also,
and very commonly, by its adsorption onto various
soil minerals. In acidic soils, P may be adsorbed by
Fe or Al oxides, and various clay minerals. Many of
the most fertile and productive soils in tropical
zones are derived from volcanic material containing
allophane minerals, which have a large P-fixing
capacity. Phosphorus deficiency is often the major
limitation to crop growth on these soils, particularly
where previous cropping has caused a depletion of
soil organic matter and increased acidification.
Phosphorus deficiency is also common on highly
weathered tropical soils and siliceous sands; in fact,
few soils are naturally well endowed with this
nutrient.
In calcareous soils, P may be adsorbed by
calcium carbonate, or precipitated as calcium
phosphate (Tisdale et al. 1993). The ability of sweet
potato to take up P may also be reduced by high pH.
Sweet potato was found to grow poorly in solution
culture maintained at pH 8.0 (Ila' ava 1997). This
was largely attributed to poor P uptake despite
continuous monitoring and maintenance of Pin
solution.
Sweet potato has been reported to be relatively
tolerant of low soil P status (de Geus 1967). A
number of fertilizer trials in the USA have shown
little or no yield responses of sweet potato to the
application of P fertilizers (Bouwkamp 1985; Jones
and Bouwkamp 1992). In these trials, it appears that
residual P from previous crops was sufficient to
supply the needs of the sweet potato crop.
Sweet potato's efficiency in obtaining soil Pis
due in part to its association with vesicular
arbuscular mycorrhizae (VAM). These ubiquitous
soil fungi invade the plant roots and feed on its
sugars, and in return they assist with the capture of
P from soils with low P availability. Mycorrhizal
infection has been shown to increase sweet potato
growth and yield in a number of studies (e.g.
Paterson et al. 1987; Kandasamy et al. 1988;
Mulongoy et al. 1988; Khasa et al. 1992; Paula et al.
1992, 1993; Dowling et al. 1994). Floyd et al.
(1988) found that the extent of mycorrhizal
infection was positively correlated with yield, and
negatively correlated with the crop response to P
fertilizer, over a range of soils in the Highlands of
PNG. The effect is greatest under low P fertility
(Negeve and Roncadori 1985), and VAM may have
no benefit or even a negative effect on crops which
are well supplied with P.
21
Although sweet potato may yield relatively well
under low P conditions, P deficiency is still a very
common cause of reduced yields. Goodbody and
Humphreys (1986) found significant positive
correlations between sweet potato yield and
available P in each of three soil types surveyed in
Simbu province of PNG. Also in Highland PNG,
Floyd et al. (1988) obtained a three-fold increase in
yield in response to P fertilizers, when K was also
supplied. Recent field trials have demonstrated a
large positive response of sweet potato to P fertilizer
on a number of volcanic ash soils in Tonga
(Halavatau et al. 1996) and andisols in PNG
(Dowling et al. 1994). Crop surveys in Uganda
showed P deficiency to be the most severe problem
of sweet potato on heavily cropped and acidified
soils in the Kabale region (E. Carey and J. Low,
pers. comm. 1996).
It is clear from many such examples that wider
use of P fertilizers will play an important role in
improving sweet potato production, as it has for
other crops. However, it is also evident that rates of
P fertilizers recommended for other crops may be
excessive and wasteful when used on sweet potato.
I Symptoms of phosphorus deficiency
Mild to moderate P deficiency may be difficult
to recognise in the field. Growth may be reduced to
less than one half that of well nourished plants,
without the appearance of any identifiable
symptoms of P deficiency (Plate la) . Mild P
deficiency is often associated with a darker than
normal, bluish green colour of the foliage. Unlike N
deficiency, young to mature leaves remain dark
green at all levels of severity. Obvious symptoms on
the older leaves are associated with severe stunting
(Plate Ib).
The first sign of P deficiency is usually the
premature senescence of older leaves. In most (but
not all) cultivars, yellowing is preceded by the
appearance of purple anthocyanin pigments,
producing a range of autumnal colours in the
senescing leaves (Plate Ic). Yellowing may spread
from discrete interveinal patches, which typically
become cleared of anthocyanin pigment (Plate Id),
or may be more general, but often affecting one half
of the blade more than the other (Plate Ie). In this
case, the chlorotic areas may appear orange or red
due to the overlying anthocyanin pigments. Necrotic
lesions subsequently develop in the chlorotic zones
(Plate If), and the necroses spread as irregular
patches until the leaf blade is entirely brown and
dry. In some cultivars (e.g. Markham, Plate Ig) no
yellow or purple phase precedes the necrotic
lesions, which appear on green tissue. However, as
in other cultivars, those parts of the leaf blade which
are not yet necrotic tum yellow in the final stages of
senescence (Plate Ih).
Some cultivars may develop purple
pigmentation on the upper surface of the youngest
leaves, particularly on the veins (Plate Ii). This may
resemble N deficiency, although in P deficiency it is
less common among cultivars, and is less strongly
veinal.
Possible confusion with other symptoms
The appearance of red pigmentation on the veins
of young leaves may resemble N deficiency.
However, in the case of P deficiency, there is no
general chlorosis of the plant. Potassium and Mg
deficiencies also cause chlorosis on older leaves, but
in P deficiency chlorosis usually does not retain a
distinct interveinal pattern, as is more typical of K
or Mg deficiencies.
Sweet potato feathery mottle virus (SPFMV)
may also induce chlorotic spots surrounded by
purple tissue on older leaves. Lesions caused by the
virus are randomly scattered over the leaf blade, and
are not restricted to the oldest leaves on the vine.
The symptoms do not progress to cause necrotic
lesions or orange and red colours on the senescing
leaves, as seen in P deficiency.
22
Plate I. Phosphorus deficiency
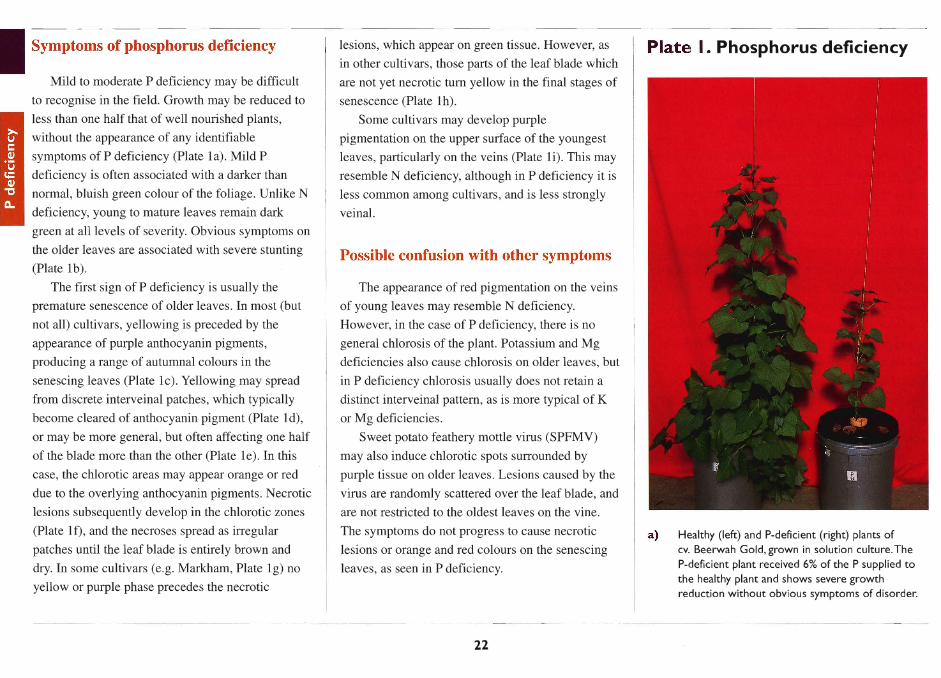
a) Healthy (left) and P-deficient (right) plants of cv. Beerwah Gold, grown in solution culture. The P-deficient plant received 6% of the P supplied to the healthy plant and shows severe growth reduction without obvious symptoms of disorder.

b) A severely stunted, six-weeks-old plant of cv. Hawaii, grown in a P-deficient soil in Tonga.
Typical symptoms of P deficiency are evident, including purpling and subsequent yellowing of older leaves, with dark green colour remaining in
young leaves.
c) Bright autumnal colours in senescing older leaves of a P-deficient crop of cv. Hawaii in Tonga. Note also the numerous flowers, which are often a symptom of stress.
d) Interveinal chlorotic zones developing to necrosis on an older leaf of cv. Hawaii grown in solution culture with low P supply.
23

Plate I. Cont'd
e) Generalised chlorosis on an older leaf of
cv. Beerwah Gold, affecting one side of the leaf blade more than the other.
f) Necrotic lesions spreading within the chlorotic tissue on an older leaf of cv.Wanmun.
24
g) Necrotic lesions without chlorosis or purple pigmentation, developing as a result of P deficiency on an older leaf of cv. Markham.

h) Yellowing and extensive necrosis on a senescing leaf due to P deficiency in cv. Markham.
i) Purple pigmentation on the young leaves of a P-deficient plant of cv. Markham. Healthy plants of this cultivar have no purple pigmentation.
25
Diagnostic soil and plant tissue tests
In solution culture experiments, a critical
concentration of 0.22% P has been estimated in the
blades of the 7th to 9th youngest leaves.
Concentrations between 0.26 and 0.45% P were
associated with maximal growth (Table 3). These
concentrations concur with those of Leonard et al.
(1949) and Weir and Cresswell (1993).
Little work has yet been done to calibrate soil tests
for predicting yield response of sweet potato to
applied P. Bingham (1962) suggested that available P
levels in the range 5-7 mglkg (Olsen's method)
correspond to the threshold for deficiency in crops
with a low P requirement, such as sweet potato.
Goodbody and Humphreys (1986) obtained positive
regressions between available P and sweet potato
yield, on soils ranging from 0.6 to 5 mglkg available P
(Olsen's method). Fox et al. (1974) gave
0.001 ppm (0.3/-.IM) as the minimum soil solution
concentration of P associated with 95% of maximum
yield of sweet potato, and Nishimoto et al. (1977)
found that a soil solution concentration of
0.003 ppm (O.l/-.lM) corresponded to a yield 70% of
the optimum. It should be noted that these
measurements include only part of the P in soil
organic matter, which may represent a considerable
proportion of the P available to the crop in some soils.
Measurements of phosphate binding capacity, in
addition to plant-available P, have been used to
estimate the quantity of P fertilizer required on

phosphate-fixing soils. Phosphate binding can be
estimated using phosphate sorption isotherms (Fox
and Kamprath 1970), or phosphate retention
(Saunders 1974). These methods have been
described by Rayment and Higginson (1992).
Correction of phosphorus deficiency
Phosphorus deficiency can be corrected by
broadcast, band or spot application of soluble P
sources, such as single or triple superphosphate,
ammonium phosphate, or mixed fertilizers
(containing N, P and K, with or without other
nutrients). Band or spot application of P fertilizers is
recommended on strongly P-fixing soils.
Rock phosphate is a relatively cheap alternative
to more soluble fertilizers. Rock phosphate should
be well incorporated into the soil, and is usually
only effective on acidic soils, due to its very low
solubility at neutral to high pH. On an acid lateritic
soil, Kabeerathumma et a1. (1986) found rock
phosphate to be equally effective as superphosphate
on the first sweet potato crop, and to have a greater
residual effect.
Single superphosphate (10% P) also contains S
and Ca, and is recommended in soils where these
nutrients are also low. Triple superphosphate (TSP,
24% P) also contains Ca, but not S.
A sweet potato crop will remove about 8-40 kg
P/ha from the soil depending on yield (Table 4), but
on P-fixing soils, much higher rates of application
(> 1 00 kg P/ha) may be needed in the first year of
application. In subsequent years, lower rates may
suffice to maintain an adequate supply of P to the
crop.
Traditional subsistence methods of cultivating
sweet potato, including the incorporation of
substantial amounts of organic matter and using
large, healthy runners for planting, add significant
amounts of P, as well as other nutrients .
Decomposition of organic matter provides a steady
supply of plant-available P even on highly P-fixing
soils. An important part of the response of sweet
potato crops to organic matter additions is due to
improved P nutrition (Floyd et al. 1988).
26