nutrient reference condition identification and ambient
TRANSCRIPT

A product of theRegional Technical Advisory Group
Nutrient Reference Condition Identification and Ambient Water Quality Benchmark
Development Process
Freshwater Lakes and Reservoirs within USEPA Region 7

2 Nutrient Reference Condition Identification and Ambient Water Quality Benchmark Development Process
The Regional Technical Assistance Group (RTAG) for the development of nutrient benchmarks was formed in 1999 by the U.S. Environmental Protection Agency in Kansas City. The group consisted of state, federal, tribal and academic members. The RTAG’s mission was to develop
numeric nutrient benchmarks (surrogate criteria) for mid-continent lakes and reservoirs larger than 10 acres in size to protect aquatic life against anthropogenic eutrophication (excess nutrients beyond natural nutrient levels).
The RTAG utilized EPA guidance on developing nutrient benchmarks and the development process consisted of several iterations of data gathering and assessment, lake classification assessment, and statistical analysis and modeling. Lake data gathering and assessment were conducted by the Central Plains Center for BioAssessment (CPCB) with the assistance of RTAG members. Several lake classification methods were pursued including classifying and analyzing mid-continent lakes by nutrient regions, Level III and IV ecoregions, lake type, lake depth, watershed area, turbidity, flushing rate and land use-land cover. RTAG members developed a selection process for identifying reference lakes, which were identified in each state. Statistical analyses were performed on reference lake data to generate reference lake conditions. Reference lake conditions were also modeled using two statistical approaches: percentiles of all lake data and trisection modeling based on chlorophyll-a levels.
Final nutrient lake benchmarks were determined by the RTAG using a weight-of-evidence approach and operating on group consensus basis. Nutrient lake benchmarks were derived from reference lake values, 25th percentile values, trisection reference values and a range of literature values. Final benchmark numbers were developed for the entire Region 7 area that includes the state of Kansas (KS), Iowa (IA) Missouri (MO) and Nebraska (NE) excluding the Sand Hills ecoregion lakes.
Benchmarks for lakes and reservoirs occurring in Region 7 (excluding Sand Hills lakes) are as follows.
700 • µg/l for total nitrogen35 • µg/l for total phosphorus8.0 • µg/l for chlorophyll-a
We gratefully acknowledges the contributions of the following USEPA Region 7 Regional Technical Advisory Group (RTAG) members: Dr. Walter Dodds (Kansas State University), Dr. John Downing (Iowa State University), Dr. Jack Jones (University of Missouri), Dr.
John Holz (University of Nebraska-Lincoln), Dr. Val Smith (University of Kansas), Ed Carney (Kansas Department of Health and Environment), Mark Osborne (Missouri Department of Natural Resources), John Bender (Nebraska Department of Environmental Quality); Dr. Donald Huggins and Debbie Baker (University of Kansas); and Dr. Gary Welker (USEPA Region 7). Dr. Elizabeth Smith assisted with an early version of this document. Thanks also go to the many others from various agencies, tribes, states and universities who attended workgroup meetings and contributed to the development of the lake nutrient benchmarks.

Freshwater Lakes and Reservoirs within USEPA Region 7 3
Introduction . . . . . . . . . . . . . . . . . . . . . . . . . . 4
Overview of the Nutrient Problem . . . . . . . . . . . . . 10
Geographic Area Covered by This Document. . . . . . . 12
Data Collection for Lakes and Reservoirs . . . . . . . . . 15
AssessmentofClassificationFactors . . . . . . . . . . . 18
Statistical Analyses . . . . . . . . . . . . . . . . . . . . . 23
Reference Condition Determination . . . . . . . . . . . . 25
FrameworkforEstablishingNutrientBenchmarks . . . 32
Table of Contents

4 Nutrient Reference Condition Identification and Ambient Water Quality Benchmark Development Process
IntroductionBackground
Nutrients are essential to sustain life and fuel growth. However, in life, too much of a good thing can have deleterious effects. In general,
excessive amounts of nutrients lead to increased cyanobacteria (‘blue green algae’) and algal production resulting in increased availability of organic carbon within an ecosystem, a process known as eutrophication (NOAA, 1999). Nutrients in excess of natural conditions, termed cultural eutrophication, impair aquatic life and can lead to harmful human health effects. Results of excess nutrient levels include production of phytoplankton blooms (cyanobacteria, eukaryotic algae) leading to decreased oxygen concentrations, shifts and loss of aquatic species including fish (e.g., Leach et al., 1977; Eminson and Phillips, 1978; Persson et al., 1991; Vollenweider, 1992; Schupp and Wilson, 1993; Egertson and Downing, 2004) and excessive macrophyte growth (Daldorph and Thomas, 1978). Further consequences of high nutrient levels are decreases in water clarity (i.e., murky water), drinking water taste and odor problems, and human health effects from the production of cyanobacteria (‘blue green algae’) and their resultant toxins (see review by Chorus et al., 2000, Lopez et al., 2008).
Sources of excess nutrients include agricultural runoff, municipal wastewater, urban runoff, and atmospheric deposition (USGS, 1999; Mueller and Spahr, 2006). Impairment from excess nutrients in lakes, streams and wetlands has been documented in virtually all 50 States. ‘Dead zones’ in coastal waters resulting from cultural eutrophication have been documented as well. The Gulf of Mexico hypoxic (i.e., low oxygen) zone, an area along the Louisiana-Texas coast, is believed to be the resulting impairment from nutrient contributions in the Mississippi, Missouri, and Ohio River watersheds (SAB, 2007).

Freshwater Lakes and Reservoirs within USEPA Region 7 5
NutrientBenchmarkDevelopmentProcess for Lakes and Reservoirs
On the 25th anniversary of the 1972 Clean Water Act, former Vice President Al Gore called for the development of an action plan that would fulfill the original “fishable and swimmable” waters goal of the Act. The result of the call to action was the Clean Water Action Plan (February 1998) which provided a blueprint for restoring and protecting the nation’s waters by building upon past water quality accomplishments and proposed new challenges for the protection of the nation’s waters. One of the challenges proposed was the reduction of nutrient over-enrichment, and the Environmental Protection Agency (EPA or USEPA) was called upon to develop numerical benchmarks – acceptable levels of nutrients (i.e., nitrogen and phosphorus) in water. Nutrient criteria would be different than typical water quality criteria and would be a “menu of different numeric values” based on waterbody types (i.e., stream, lake, wetland) and ecoregional, physiographic or other spatial classifications.
In June of 1998, the National Strategy for the Development of Regional Nutrient Criteria, was produced by USEPA’s Office of Water and provided an approach for assessing nutrient information and working with States and Tribes in the development of protective nutrient criteria. Key elements of the strategy were to take a geographic and waterbody approach, development of technical guidance, the use of regional nutrient teams and the development of criteria by States and Tribes.
Ecoregional and waterbody-type specific approach
Rather than develop nation-wide criteria for nutrients, the national nutrient strategy called for the development of criteria based on a regional geographic basis as defined by geology, soils, topology, vegetation and climatic conditions. One suggested geographic approach was the ‘ecoregional’ framework developed by James Omernik (Omernik, 1987) (Figure 1) that was used as the basis for the later development of nutrient ecoregions as cited and illustrated in this document. The size of ecoregions can vary from watershed size to continental in scale. For the purposes of developing nutrient criteria the scale or size of the ecoregions should be dictated by regional nutrient conditions
Algal bloom in Cheney Reservoir Sedgwick County, Kansas (Photo by Ed Carney, KDHE).
Algal bloom noted in 2004 at Marion Lake, Marion County, KS. (Photo by Salina Field Office, KDHE)

6 Nutrient Reference Condition Identification and Ambient Water Quality Benchmark Development Process
and availability of data. In addition to Omernik’s ecoregion work, other geographic regions and ecoregions have been developed by a number of researchers (e.g., Kuchler, 1964; Bailey, 1995; Maxwell et al., 1995; Abel et al., 2000). While a number of regionalization approaches are available, Omernik’s ecoregions are often used in proposed approaches in development of nutrient criteria (Rohm et al., 2002; Dodds and Oakes, 2004; Tennessee Department of Environmental Conservation, (TDEC) 2004; Stoddard, 2005; Virginia Water Resource Research Center, (VWRRC) 2005, LDEQ 2006).
A major element of the national nutrient strategy was to develop nutrient criteria by waterbody type (i.e., lakes, streams, and wetlands). The focus of this document is on the development of nutrient benchmarks for lakes greater than 10 acres in size. Lakes can be classified as natural lakes, reservoirs, artificial lakes, oxbow lakes, sand pit lakes, shallow lakes, deep lakes and so on. The national nutrient strategy also calls for the development of nutrient criteria for rivers and streams, wetlands, estuaries and coastal marine waters and highlights the need to keep in mind the inter-relationship of all water-body types.
Technical guidance
In April of 2000, the EPA Office of Water published the Nutrient Criteria Technical Guidance Manual: Lakes and Reservoirs (Gibson, et al., 2000). This “lakes document” provides technical guidance to develop water quality criteria for the protection of aquatic life from excess nutrients in lakes and reservoirs. It builds upon the national nutrient strategy and provides guidance on establishing appropriate databases, causal and response variables, characterization of reference condition, nutrient modeling,
Mined Land Lake 27 has excellent water quality and few nutrient problems. (Photo by Ed Carney, KDHE),
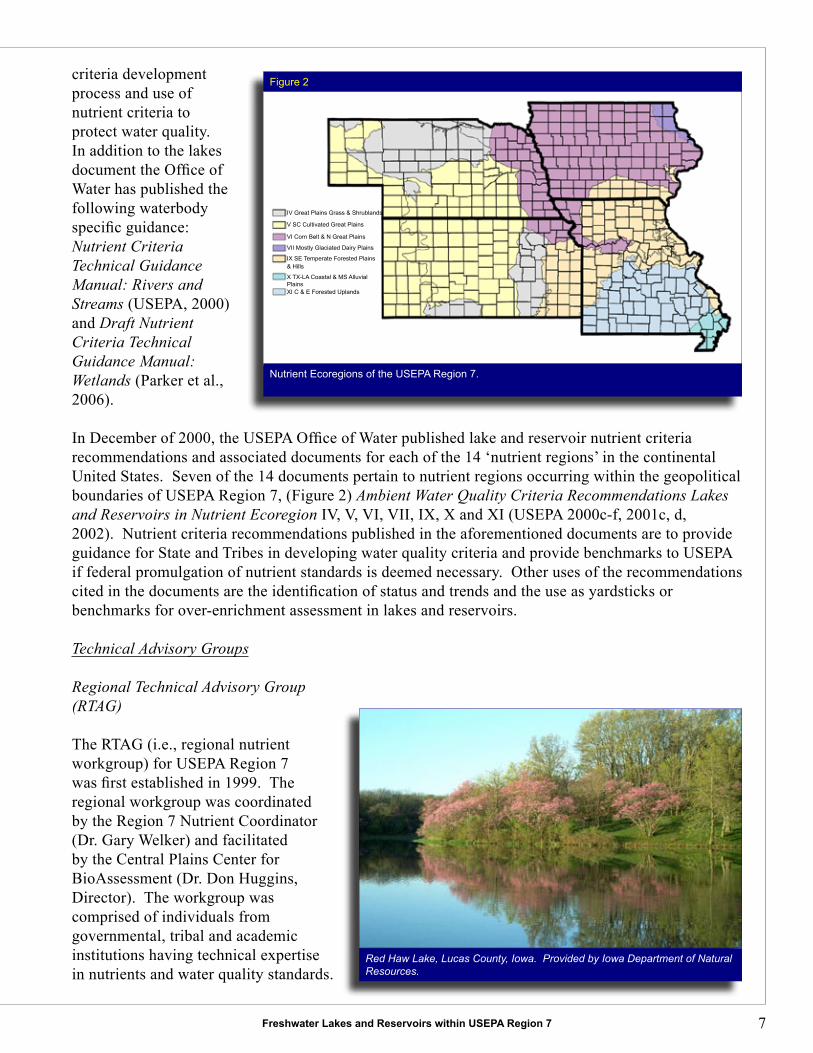
Level III Ecoregions of the USEPA Region 7.
Figure 1
Central Great PlainsCentral Irregular PlainsCentral Oklahoma/Texas PlainsDriftless AreaFlint HillsInterior River Valleys and HillsMississippi Alluvial PlainNebraska Sand HillsNorthwestern Glaciated PlainsNorthwestern Great Plains
Ozark HighlandsSouthwestern TablelandsWestern Corn Belt PlainsWestern High Plains
Freshwater Lakes and Reservoirs within USEPA Region 7 7
criteria development process and use of nutrient criteria to protect water quality. In addition to the lakes document the Office of Water has published the following waterbody specific guidance: Nutrient Criteria Technical Guidance Manual: Rivers and Streams (USEPA, 2000) and Draft Nutrient Criteria Technical Guidance Manual: Wetlands (Parker et al., 2006).
In December of 2000, the USEPA Office of Water published lake and reservoir nutrient criteria recommendations and associated documents for each of the 14 ‘nutrient regions’ in the continental United States. Seven of the 14 documents pertain to nutrient regions occurring within the geopolitical boundaries of USEPA Region 7, (Figure 2) Ambient Water Quality Criteria Recommendations Lakes and Reservoirs in Nutrient Ecoregion IV, V, VI, VII, IX, X and XI (USEPA 2000c-f, 2001c, d, 2002). Nutrient criteria recommendations published in the aforementioned documents are to provide guidance for State and Tribes in developing water quality criteria and provide benchmarks to USEPA if federal promulgation of nutrient standards is deemed necessary. Other uses of the recommendations cited in the documents are the identification of status and trends and the use as yardsticks or benchmarks for over-enrichment assessment in lakes and reservoirs.
Technical Advisory Groups
Regional Technical Advisory Group (RTAG)
The RTAG (i.e., regional nutrient workgroup) for USEPA Region 7 was first established in 1999. The regional workgroup was coordinated by the Region 7 Nutrient Coordinator (Dr. Gary Welker) and facilitated by the Central Plains Center for BioAssessment (Dr. Don Huggins, Director). The workgroup was comprised of individuals from governmental, tribal and academic institutions having technical expertise in nutrients and water quality standards.
Red Haw Lake, Lucas County, Iowa. Provided by Iowa Department of Natural Resources.
IV Great Plains Grass & Shrublands
V SC Cultivated Great Plains
VI Corn Belt & N Great Plains
VII Mostly Glaciated Dairy Plains
IX SE Temperate Forested Plains & Hills
X TX-LA Coastal & MS Alluvial PlainsXI C & E Forested Uplands
Nutrient Ecoregions of the USEPA Region 7.
Figure 2

8 Nutrient Reference Condition Identification and Ambient Water Quality Benchmark Development Process
Membership changed slightly since the formation but has essentially been comprised the following researchers, scientists and members: Dr. Walter Dodds (Kansas State University), Dr. John Downing (Iowa State University), Dr. Jack Jones (University of Missouri), Dr. John Holz (University of Nebraska-Lincoln), Ed Carney (Kansas Department of Health and Environment), Mark Osborne (Missouri Department of Natural Resources), John Bender (Nebraska Department of Environmental Quality); Dr. Donald Huggins and Debbie Baker (Central Plains Center for BioAssessment located at the University of Kansas); and Dr. Gary Welker (USEPA Region 7). The Prairie Band of Potawatomie Indians, Department of Agriculture and US Geological Survey were also represented. The CPCB maintained thorough documentation of the meeting, data used and the entire process, which can be accessed through the internet at http://cpcb.ku.edu/progwg/html/nutrientwg.htm.
The mission of the workgroup was to “develop scientifically defensible numeric nutrient benchmarks for lakes/reservoirs, streams/rivers and wetlands in the Central Great Plains (Iowa, Kansas, Missouri and Nebraska).” The RTAG’s role was to develop benchmarks for nutrients to aid the States and Tribes in their responsibility to develop nutrient criteria. Equally important was the documentation of the RTAG’s approach (i.e., benchmark development process) in developing these numbers. Workgroup operational ground-rules for the development of nutrient benchmarks for lakes and reservoirs were as follows:
Nutrient benchmarks are to protect lakes and reservoirs and down stream receiving waters • against adverse impacts of cultural eutrophication (excess nutrient levels above natural or minimally impaired conditions);

Freshwater Lakes and Reservoirs within USEPA Region 7 9
Nutrient benchmarks are to be protective of aquatic life - economics, technology, attainability • and social values are not part of the benchmark development process; andBenchmarks developed by the RTAG are by group consensus and are developed for the • purpose of assisting and providing guidance to States and Tribes in the development of their own nutrient criteria.
Lake and reservoir variables
USEPA has indicated that nutrient criteria developed by States and Tribes be comprised of both causal and response variables (Grubbs, 2001). Nitrogen and phosphorus have long been known to be primary causes of cultural eutrophication (National Academy of Science, 1969; Smith, 1982; Elser et al., 1990; Correll, 1999; Jeppesen et al., 2000; National Research Council, 2000) and have been selected as the two primary nutrient causal variables. The linkage between causal variables (e.g., total nitrogen or TN and total phosphorus or TP) and chlorophyll a (response variable), a commonly used indicator of algal biomass, is well-known (EPA, 2000). Secchi depth measurements (response variable) have become a routine measurement of trophic lake status, is relatively inexpensive to conduct and can be performed by local lake monitoring groups. Other examples of response variables that a State or Tribe could develop into criteria are periphyton metrics, biological oxygen demand, fish community metrics (i.e., metrics which quantify changes in fish community structure and function with changes in trophic state) and macrophyte metrics. Emphasis should be placed on developing both causal (TN and TP) and a response variable(s).
Development of Criteria by States and Tribes
USEPA Office of Water has produced nutrient criteria recommendations (sometimes referred to as Clean Water Act 304(a) criteria), which are based on rather large geographic areas (i.e., nutrient regions). The result of the RTAG effort and this document was the development of ‘nutrient benchmarks’ on a smaller geographic scale as compared to the geographic scale used to develop the 304(a) criteria. However, the States and authorized Tribes are ultimately responsible for developing causal and response nutrient criteria for their State/Tribe on a Statewide/Reservation-wide approach or using sub-sets of geographic areas (i.e., ecoregions) within their State/Tribal borders. Thus the States and Tribes, on a geographic scale, may further refine the nutrient benchmarks developed within this document. It is hoped that the EPA, States and Tribes will use this document and the lessons learned from the process the RTAG experienced in the development of their nutrient criteria.

10 Nutrient Reference Condition Identification and Ambient Water Quality Benchmark Development Process
Eutrophication is an established water quality management concept and concern reaching as far back as the 1600’s in America (Capper et al.,
1983). However, extensive public recognition of this form of pollution in coastal water bodies is relatively recent. The publication “Eutrophication, Causes, Consequences, and Correctives” (National Academy of Science, 1969) is often perceived as the technological beginning of American nutrient pollution awareness and is centered on the understanding and abatement of this problem primarily in freshwater lakes and reservoirs. We have since come to better understand the problem in streams, rivers, and estuaries, with a focus on: (1) recommending ways to help watershed managers achieve meaningful reductions in the impacts of nutrient over-enrichment in the near-term and (2) identifying areas where future efforts hold the promise of long-term reductions in nutrient over-enrichment and its effects (Nürnberg, 1996; Smith et al., 1999; Anderson et al., 2002; Smith, 2003).
As indicated previously, nutrients, phosphorus and nitrogen, are required for maintaining metabolic processes in aquatic and semi-aquatic organisms. However, when nutrient concentrations are elevated above natural background levels due to anthropogenic sources, lake eutrophication is accelerated. Nutrient levels above background or natural levels are referred to as cultural eutrophication. Anthropogenic sources of nutrients include agricultural fertilizers, confined animal feeding operations, rangeland and pasture runoff, urban runoff including residential fertilizer and pet wastes, wastewater treatment effluents, and leaking septic tanks.
Unfortunately, nutrient pollution from anthropogenic sources is widespread. The amount of nutrients entering our waters has dramatically escalated over the past 50 years, and nutrients now pose significant water quality and public health concerns across the United States. The most widely known examples of significant nutrient impacts include the
Overview of the Nutrient Problem

Freshwater Lakes and Reservoirs within USEPA Region 7 11
Gulf of Mexico and the Chesapeake Bay. For these two areas alone, there are 35 States that contribute the nutrient loadings. Nationally, nutrient pollution is one of the top causes of water quality impairment and is linked to over 14,000 water segments listed as impaired. Over two million acres of lakes and reservoirs across the country are impaired and not meeting water quality standards due to excess nutrients. (USEPA, 2009)
The spreading environmental degradation associated with excess levels of nitrogen and phosphorus in our nation’s waters has been studied and documented extensively. Over the past decade, there have been numerous major reports, a substantially large number of national and international scientific studies, and a growing number of quantitative analyses and surveys at the state and national levels indicating that we are falling behind. EPA’s Science Advisory Board has prepared two critical reports (USEPA 2007, USEPA 2010). The Agency itself has issued numerous reports over the years sounding the alarm. And this body of data, analysis and conclusions is substantiated by numerous published articles, state-level technical reports, and university studies across the country (USEPA, 2009).
Nutrient pollution in lakes and reservoirs is well documented. Excess loadings of nutrient pollution in lakes and reservoirs produce enhanced plant growth or extensive algal blooms, along with the associated reduced dissolved oxygen levels that result from the eventual decomposition of the excessive vegetative growth (Mueller and Helsel, 1996). The algae use up dissolved oxygen in the process, thus depleting oxygen levels - a condition known as hypoxia. Accelerated plant growth coupled with the storage of nutrients deposited or accumulated in the sediment can lead to a substantial loss of aquatic resources as water quality becomes progressively worse and leads to low dissolved oxygen, loss of species diversity, aquatic habitat alterations and shifts in lake taxonomy (USEPA, 2009). Another symptom of excessive nutrient concentrations are the production are the human health related problems including taste and odor issues in drinking water sources and the production of toxin producing microbes (i.e., cyanobacteria). The State of Nebraska has had a sampling program for microcystin (a cyanotoxin) in place for several years. Since 2005, 29 percent of the sampled lakes have exceeded the health alert level for microcystin. In 2008, eight lakes were closed to recreation for 2 to 11 weeks due to microcystin levels exceeding the state’s health alert level (Nebraska DEQ, 2009).
In response to the growing awareness of problems associated with Nutrient pollution, numerous effort have been undertaken over the past decade, including the aforementioned guidance documents. This document serves to identify reference conditions (those minimally impacted by anthropogenic sources of nutrients) and establish benchmarks to evaluate eutrophication and to assist States and Tribes in developing numeric nutrient criteria. Numeric nutrient water quality standards will drive water quality assessments and watershed protection management. They will support improved development of nutrient Total Maximum Daily Loads (TMDLs). Perhaps most importantly, they will create state- and community-developed environmental baselines that allow us to manage more effectively, measure progress, and support broader partnerships based on nutrient trading, Best Management Practices (BMPs), land stewardship, wetlands protection, voluntary collaboration, and urban storm water runoff control strategies.

12 Nutrient Reference Condition Identification and Ambient Water Quality Benchmark Development Process
The following section provides a general description of the Nutrient Ecoregions and Level III Ecoregions studied in this report, and their geographical
boundaries. USEPA established the seven Nutrient Ecoregions found in the aforementioned Water Quality Recommendations reports (USEPA, 2000c-f; 2001b-d, 2002). The boundaries and extent of both the Nutrient Ecoregions and Level III Ecoregion occurring partially or wholly within USEPA Region 7 are shown in Figures 1 and 2.
EPA Region 7 contains fourteen Level III Ecoregions, but only 13 had existing lake data. A detailed description of the characteristics of each of these subecoregions is provided below for each of the seven aggregate Nutrient Ecoregions covered by this report. The following are brief descriptions provided by Omernik (1999) of the climate, vegetative cover, topography, and other ecological information pertaining to these ecoregions.
AggregateNutrientEcoregionIV:GreatPlainsGrassand Shrublands.
26. Southwestern Tablelands (Omernik Level III)Unlike most adjacent Great Plains ecological regions, little of the Southwestern Tablelands is in cropland. Much of this elevated tableland is in subhumid grassland and semiarid grazing land. The potential natural vegetation in this region is grama-buffalo grass with some mesquite/buffalo grass in the southeast and shinnery (midgrass prairie with open low and shrubs) along the Canadian River.
28. Flint Hills (Omernik Level III)The Flint Hills is a region of limestone and shale open hills with relatively narrow steep valleys. In contrast to surrounding ecological regions that are mostly in cropland, most of the Flint Hills is grazed by beef cattle. Potential natural vegetation in the region is tallgrass prairie.
Geographic Area Covered by This
Document

Freshwater Lakes and Reservoirs within USEPA Region 7 13
43. Northwestern Great Plains (Omernik Level III)The Northwestern Great Plains Ecoregion encompasses the Missouri Plateau section of the Great Plains. It is a semiarid rolling plain of shale and sandstone punctuated by occasional buttes. Native grasslands, largely replaced on level ground by spring wheat and alfalfa, persist in rangeland areas on broken topography. Agriculture is restricted by the erratic precipitation and limited opportunities for irrigation.
44. Nebraska Sand Hills (Omernik Level III)The Nebraska Sand Hills comprise one of the most distinct and homogenous Ecoregions inNorth America. One of the largest areas of grass stabilized sand dunes in the world, this region is generally devoid of cropland agriculture, and except for some riparian areas in the north and east, the region is treeless. Large portions of this Ecoregion contain numerous lakes and wetlands and have a lack of streams.
AggregateNutrientEcoregionV:SouthCentralCultivatedGreatPlains
25. Western High Plains (Omernik Level III)Higher and drier than the Central Great Plains to the east, and in contrast to the irregular, mostly grassland or grazing land of the Northwestern Great Plains to the north, much of the Western High Plains comprises smooth to slightly irregular plains having a high percentage of cropland. Grama-buffalo grass is the potential natural vegetation in this region as compared to mostly wheatgrass-needlegrass to the north, Trans-Pecos shrub savanna to the south, and taller grasses to the east. The northern boundary of this ecological region is also the approximate northern limit of winter wheat and sorghum and the southern limit of spring wheat.
27. Central Great Plains (Omernik Level III)The Central Great Plains is slightly lower, receives more precipitation, and is somewhat more irregular than the Western High Plains to the west. This plains region was once grassland, with scattered low trees and shrubs in the south; much of this ecological region is now cropland. The eastern boundary of the region delimits the eastern limits of the major winter wheat growing area of the United States.
AggregateNutrientEcoregionVI:CornBeltandNorthernGreatPlains.
47. Western Corn Belt Plains (Omernik Level III)Once covered with tallgrass prairie, over 75 percent of the Western Corn Belt Plains is now used for cropland agriculture and much of the remainder is in forage for livestock. A combination of nearly level to gently rolling glaciated till plains and hilly loess plains, an average annual precipitation of 63 - 89 cm, which occurs mainly in the growing season, and fertile, warm, moist soils make this on of the most productive areas of corn and soybeans in the world. The region is also one of major environmental concerns regarding surface and groundwater contamination from fertilizer and pesticide applications as well as livestock concentrations.
AggregateNutrientEcoregionVII:MostlyGlaciatedDairyRegion
52. Driftless Area (Omernik Level III)The hilly uplands of the Driftless Area easily distinguish it from the surrounding ecoregions. Much of the area consists of a loess-capped plateau, deeply dissected by streams. Also called the Paleozoic Plateau, because there is evidence of glacial drift in this region, the glacial deposits have done little to affect the landscape compared to the subduing influences in adjacent ecoregions. Livestock and dairy farming are major land uses and have had a significant impact on stream quality.

14 Nutrient Reference Condition Identification and Ambient Water Quality Benchmark Development Process
AggregateNutrientEcoregionIX:SoutheasternTemperateForestedPlainsandHill
29. Central Oklahoma/Texas Plains (Omernik Level III)The Central Oklahoma/Texas Plains ecoregion is a transition area between the once prairie, now winter wheat growing regions to the west, and the forested low mountains of eastern Oklahoma. The region does not possess the arability and suitability for crops such as corn and soybeans that are common in the Central Irregular Plains to the northeast. Transitional “cross-timbers” (little bluestem grassland with scattered blackjack oak and post oak trees) is the native vegetation, and presently rangeland and pastureland comprise the predominant land cover. Oil extraction has been a major activity in this region for over 80 years.
40. Central Irregular Plains (Omernik Level III)The Central Irregular Plains has a mix of land use types and tends to be topographically more irregular than the Western Corn Belt Plains to the north, where most of the land is in crops; however, the region is less irregular and less forest covered than the ecoregions to the south and east. The potential natural vegetation of this ecological region is a grassland/forest mosaic with wider forested strips along the streams compared to the region to the north. The mix of land use activities in the Central Irregular Plains also includes mining operations of high-sulfur bituminous coal. The disturbance of these coal strata in southern Iowa and northern Missouri has degraded water quality and affected aquatic biota.
72. Interior River Lowland (Omernik Level III)The Interior River Lowland is made up of many wide, flat-bottomed terraced valleys, forested valley walls, and dissected glacial till plains. In contrast to the generally rolling to slightly irregular plains in adjacent ecological regions to the north, east and west, where most of the land is cultivated for corn and soybeans, a little less than half of this area is in cropland, about 30 percent is in pasture, and the remainder is in pasture.
AggregateNutrientEcoregionX:Texas-LouisianaCoastalandMississippiAlluvialPlains.
73. Mississippi Alluvial Plain (Omernik Level III)This riverine ecoregion extends from southern Illinois, at the confluence of the Ohio River with the Mississippi River, south to the Gulf of Mexico. It is mostly a flat, broad floodplain with river terraces and levees providing the main elements of relief. Soils tend to be poorly drained, except for the areas of sandy soils. Winters are mild and summers are hot, with temperatures and precipitation increasing from north to south. Bottomland deciduous forest vegetation covered the region before much of it was cleared for cultivation. Presently, most of the northern and central parts of the region are in cropland and receive heavy treatments of insecticides and herbicides. Soybeans, cotton, and rice are the major crops.
AggregateNutrientEcoregionXI:CentralandEasternForestedUplands.
39. Ozark Highlands (Omernik Level III)The Ozark Highlands ecoregion has a more irregular physiography and is generally more forested than adjacent regions, with the exception of the Boston Mountains to the south. The majority of this dissected limestone plateau is forested; oak-hickory is the predominant type, but stands of oak and pine are also common. Less than one fourth of the core of this region has been cleared for pasture and cropland, but half or more of the periphery, while not as agricultural as bordering ecological regions, is in cropland and pasture.

Freshwater Lakes and Reservoirs within USEPA Region 7 15
The RTAG and outside experts comprised water quality specialists, colleges, water resource managers and scientists, representing a variety
of state and tribal agencies and universities, who were selected in accordance with National Nutrient Criteria Strategy Document guidelines (USEPA, 1998a). Database compilation and data analysis were performed by the personnel of the CPCB.
The RTAG initially recommended four primary variables for data collection: TN, TP, chlorophyll a (Chla), and Secchi disk transparency (SD). These variables were selected because they are early indicators of causal and biological response indicators of nutrient loadings. Other measures of clarity or transparency may be used, but SD is typically included because a large body of information is already available in this form; it is inexpensive and reliable; and continued SD measurements provide continuity with historical data. However, for reasons outlined below, SD was not used in development of the final nutrient benchmarks for Region 7 lakes and reservoirs.
Data Sources
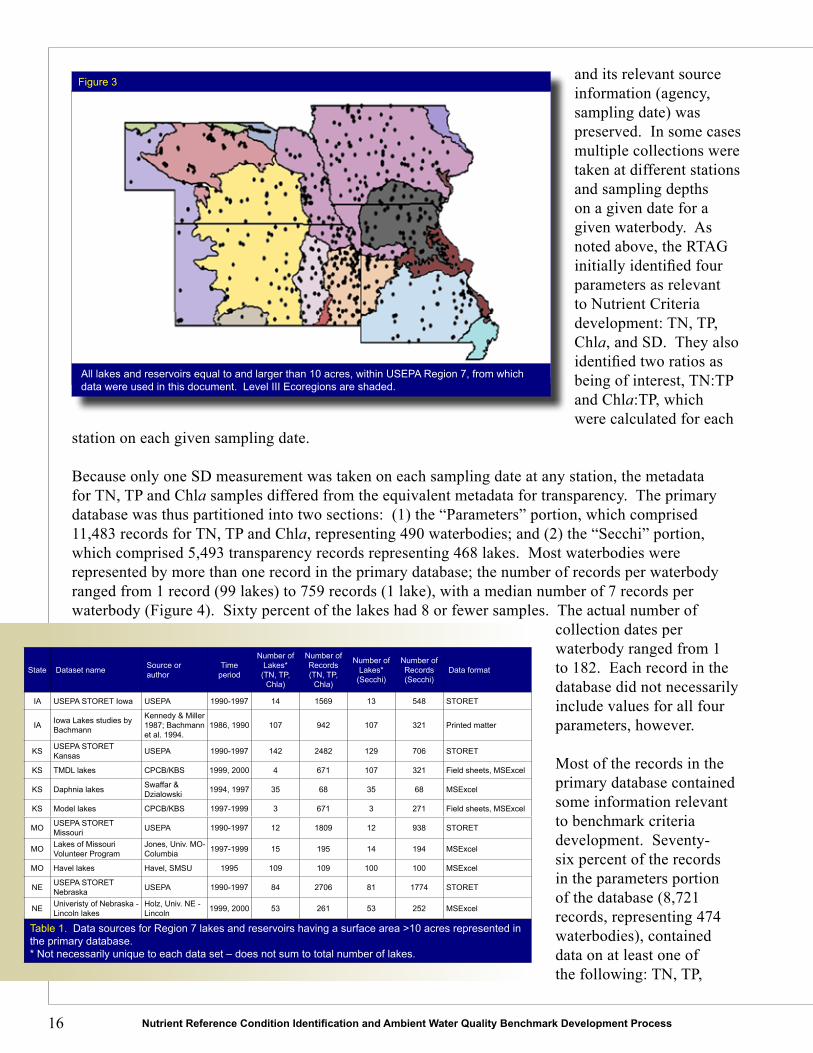
The CPCB compiled available water quality data for lakes greater than 10 acres in Iowa, Kansas, Missouri and Nebraska (Figure 3). These data were collected between 1986 and 2000 by a variety of agencies and individuals with established internal quality assurance procedures (Table 1). All data were ultimately combined into a single Microsoft Access relational database, and checked for accuracy and quality.
The Primary Database - Raw Data
The primary database used in developing this report was created from the sources detailed above. In the primary database, each record represented a single sampling event,
Data Collection for Lakes and Reservoirs
16 Nutrient Reference Condition Identification and Ambient Water Quality Benchmark Development Process
and its relevant source information (agency, sampling date) was preserved. In some cases multiple collections were taken at different stations and sampling depths on a given date for a given waterbody. As noted above, the RTAG initially identified four parameters as relevant to Nutrient Criteria development: TN, TP, Chla, and SD. They also identified two ratios as being of interest, TN:TP and Chla:TP, which were calculated for each
station on each given sampling date.
Because only one SD measurement was taken on each sampling date at any station, the metadata for TN, TP and Chla samples differed from the equivalent metadata for transparency. The primary database was thus partitioned into two sections: (1) the “Parameters” portion, which comprised 11,483 records for TN, TP and Chla, representing 490 waterbodies; and (2) the “Secchi” portion, which comprised 5,493 transparency records representing 468 lakes. Most waterbodies were represented by more than one record in the primary database; the number of records per waterbody ranged from 1 record (99 lakes) to 759 records (1 lake), with a median number of 7 records per waterbody (Figure 4). Sixty percent of the lakes had 8 or fewer samples. The actual number of
collection dates per waterbody ranged from 1 to 182. Each record in the database did not necessarily include values for all four parameters, however.
Most of the records in the primary database contained some information relevant to benchmark criteria development. Seventy-six percent of the records in the parameters portion of the database (8,721 records, representing 474 waterbodies), contained data on at least one of the following: TN, TP,
State Dataset name Source or author
Time period
Number ofLakes*
(TN, TP, Chla)
Number ofRecords (TN, TP,
Chla)
Number ofLakes*
(Secchi)
Number ofRecords (Secchi)
Data format
IA USEPA STORET Iowa USEPA 1990-1997 14 1569 13 548 STORET
IA Iowa Lakes studies by Bachmann
Kennedy & Miller 1987; Bachmann et al. 1994.
1986, 1990 107 942 107 321 Printed matter
KS USEPA STORET Kansas USEPA 1990-1997 142 2482 129 706 STORET
KS TMDL lakes CPCB/KBS 1999, 2000 4 671 107 321 Field sheets, MSExcel
KS Daphnia lakes Swaffar & Dzialowski 1994, 1997 35 68 35 68 MSExcel
KS Model lakes CPCB/KBS 1997-1999 3 671 3 271 Field sheets, MSExcel
MO USEPA STORET Missouri USEPA 1990-1997 12 1809 12 938 STORET
MO Lakes of Missouri Volunteer Program
Jones, Univ. MO-Columbia 1997-1999 15 195 14 194 MSExcel
MO Havel lakes Havel, SMSU 1995 109 109 100 100 MSExcel
NE USEPA STORET Nebraska USEPA 1990-1997 84 2706 81 1774 STORET
NE Univeristy of Nebraska - Lincoln lakes
Holz, Univ. NE - Lincoln 1999, 2000 53 261 53 252 MSExcel
Table 1. Data sources for Region 7 lakes and reservoirs having a surface area >10 acres represented in the primary database.* Not necessarily unique to each data set – does not sum to total number of lakes.
All lakes and reservoirs equal to and larger than 10 acres, within USEPA Region 7, from which data were used in this document. Level III Ecoregions are shaded.
Figure 3

Freshwater Lakes and Reservoirs within USEPA Region 7 17
and Chla. Many records contained other environmental data as well, such as temperature, pH, and dissolved oxygen. Secchi data were available for 468 waterbodies.
The RTAG also identified seven factors as potentially important classification variables for use in the initial data analyses (see below). The first two factors attempt to describe similar geophysical regions that have potential similar nutrient and biological features. A third factor was temporal (sampling season), and the fourth was geospatial (Level III Ecoregion). The other four factors were aspects of waterbody classification: one was categorical (waterbody type) and three were quantitative measures of morphometry and hydrology (surface area; mean depth; and hydraulic retention time). The below factors below were analyzed using both the primary database and the medians database.
NutrientEcoregions(7categories):• There were seven Nutrient Ecoregions (USEPA, 1998a) represented in USEPA Region 7 (Table 2). LevelIIIEcoregion(14categories):• There were fourteen Level III Ecoregions (Omernik, 1987) represented in USEPA Region 7. Lakes were classified according to USEPA-revised ecoregion boundaries (Omernik, 2000) (Table 2). SamplingSeason(4categories):• Records were coded by sampling date into four seasons: winter (22 Dec-21 Mar), spring (22 Mar-21 Jun), summer (22 Jun-21 Sep), and fall (22 Sep-21 Dec). The three non-winter seasons are together considered to comprise the growing season. WaterbodyType(3categories):• Waterbodies were coded as artificial (reservoirs), natural (lakes), or sand pit (borrow pits for gravel and sand extraction). SurfaceArea(4categories):• Waterbodies were coded as small (10.1-100 acres), medium (100.1-1000 acres), large (1000.1-10000 acres), or very large (> 10000 acres).MeanDepth(3categories):• Lakes were coded as shallow (≤ 2 m), mid-depth (2.1-4 m), or deep (> 4 m); this explicitly refers to lake mean depth, rather than the depth at which samples were taken.HydraulicRetentionTime(4categories):• The average length of time water remains in a lake is called the retention time or flushing rate. The lake’s size, water source, and watershed size primarily determine the retention time The average hydraulic residence time was categorized as very short (≤ 14 days), short (14.1-100 days), medium (100.1-200 days), or long (> 200 days).
Number of records per reservoir or lake in the Primary database used by the RTAG.
140
120
100
80
60
40
20
0
<= 1
<= 2
<= 4
<= 8
<= 1
6
<= 3
2
<= 6
4
<= 1
28
<= 2
56
<= 5
12
<512
Number of records per lake
Num
ber o
f lak
e
Figure 4

18 Nutrient Reference Condition Identification and Ambient Water Quality Benchmark Development Process
From a scientific standpoint, the RTAG wanted to make sure that the factors retained to assess lake classification schemes were those that appear to be the most
important and were not redundant with other factors. Nutrient regional difference in TP, TN and Chla were examined for five of the seven nutrient regions that had a sufficient number of lakes (≥ 10 lakes) in the median’s data base to analyze. Similarly, only 7 of the 14 level III ecoregions had 10 or more lakes with median values for some or all indicator variables. Ecoregional differences between all lakes and the a priori reference lakes were examined. In general the highest difference in TP, TN and Chla occurred between the Nebraska Sand Hills and Western Corn Belt Plain lakes and all other ecoregion groups (see Figures 8, 9, and 10).
Using scatter plots, correlation matrices, and simple and robust regression techniques (NCSS, 1997) the potential relationships between all of the morphological factors and TP, TN and Chla values were examined for all lakes and subsets of lakes representing two different reference classes of lakes. Statistically speaking, all morphological factors examined were found to be moderately correlated with each other with the highest significant relationships (p ≤ 0.05) observed between mean depth and retention time (r2 = 0.55) and mean depth and surface area (r2 = 0.39). These r2 values (coefficient of determination values) were associated with robust regression models determined using Number Cruncher Statistical Software 6.0.21 for Windows (NCSS, 1997). All factors were positively correlated with each other and in general these relationships suggested that as the surface area of a lake increased so did mean depth and retention time. Therefore, the RTAG was in the position of trying to decide which of the factors were ecologically most important in terms of developing regional benchmarks for nutrients. For practical and statistical reasons, two factors were eliminated (season and retention time). Mean depth as a classification variable was examined in detail and finally dropped as differences in TP, TN and Chla values between depth categories was so slight.
Assessment of Classification Factors

Freshwater Lakes and Reservoirs within USEPA Region 7 19
NutrientEcoregions
There are seven Nutrients Ecoregions in USEPA Region 7. Lakes were categorized as to which Nutrient Ecoregion they were located in, however, the RTAG did not choose to analyze the data based on Nutrient Ecoregions, believing that the smaller Level III Ecoregions more accurately characterized the lake watersheds.
It was also noted that only five of the seven nutrient ecoregions within Region 7 had enough lakes (≥ 10) to examine nutrient region differences and the RTAG chose to assess nutrient ecoregional differences using information from existing USEPA documents that were based on larger spatial databases (USEPA, 2000c-f; 2001c,d; 2002). The advantage of using these EPA nutrient region documents was that they offered more complete spatial coverage of each region and a much large database with more lakes and more constituent measurements. This was especially true for nutrient ecoregions that comprised little of the land mass of EPA Region 7. These were the Central and Eastern Forested Uplands and Mostly Glaciated Dairy Region nutrient regions.
LevelIIIEcoregions
The section entitled, “Geographic Area Covered By This Document,” describes the 14 Level III ecoregions occurring in USEPA Region 7. However, only 11 Level III ecoregions contained lakes of the size that the RTAG was to analyze (> 10 acres in surface area). In addition, examination of the data by ecoregion revealed that the Nebraska Sand Hills lakes comprise a distinct population that appeared to have unnaturally high background values for both Chla and phosphorus (Figure 5, Table 3). This contention was supported by all RTAG members from Nebraska. Thus, so not to inflate phosphorus values in the recommended nutrient benchmarks, the RTAG decided to exclude the Nebraska Sand Hills lakes from further regional analyses.
Nutrient Ecoregion # lakes Level III Ecoregions # lakes % of lakes % area
Great Plains Grass & Shrublands
62 Flint Hills 28 7.61 3.42
Nebraska Sand Hills 29 7.88 7.84
Northwestern Glaciated Plains 0 0 0.76
Northwestern Great Plains 1 0.27 0.77
Southwestern Tablelands 4 1.09 1.26
South Central Cultivated Great Plains
72 Central Great Plains 61 16.58 20.92
Western High Plains 11 2.99 10.56
Corn Belt & Northern Great Plains
132 Western Corn Belt Plains 132 35.87 23.42
Mostly Glaciated Dairy Region
1 Driftless Area 1 0.27 0.98
Southeastern Temperate Forested Plains & Hills
91 Central Irregular Plains 89 24.18 14.87
Central Oklahoma/Texas Plains 2 0.54 0.27
Interior River Lowland 0 0 2.14
Texas-Louisiana Coastal & Mississippi Alluvial Plains
0 Mississippi Alluvial Plain 0 0 1.43
Central & E Forested Uplands
10 Ozark Highlands 10 2.72 11.37
Totals: 368 368 100 100
Table 2. Nutrient Ecoregion aggregations of the Level III Ecoregions in the four-state area, shown with number and area of lakes > 10 acres surface area in the medians dataset.
Scatter plot of median lake values of Chla and TP for reference lakes occurring in the Nebraska Sand Hills ecoregion (▲) and all other ecoregions(O)comprising USEPA Region 7.
1000
100
10
1
Total Phosphorus (µg/L)
Chl
orop
hyll
a (µ
g/L)
Figure 5
1 10 100 1000 10000

20 Nutrient Reference Condition Identification and Ambient Water Quality Benchmark Development Process
Season
The RTAG decided to pool sample data from all seasons, because over 80 percent of samples were collected in spring and summer, which is the period when lakes most often express the effects of cultural eutrophication. Any attempt to discern temporal effects across regions and lake categories was not practical due to the limited and temporally clumped nature of the lake samples. In addition, only by pooling the temporal data for lakes could the RTAG gain a reasonable sample size for analysis and assessment of the other identified classification factors.
Lake Type
Lakes were classified as natural, artificial (reservoirs), or sand pit. The relatively clear and shallow sand pits were created from the excavation of gravel and sand and as a group occur mainly in Nebraska along the larger sandy-bottom streams and rivers. Large reservoirs and impoundments were created throughout the region for flood control, water supply and recreation. Few groups of natural lakes are found in Region 7 except for the Nebraska Sand Hills lakes, the pothole lakes of the Western Corn Belt Plains ecoregion in Iowa and the floodplain oxbow lakes in the large river floodplains. In general these natural lakes tend to be characterized by the ecoregion in which they are found. For example, the natural lakes of the Nebraska Sand Hills ecoregion are typically shallow, highly productive lakes with well-developed littoral zones of macrophytes. The Iowa pothole lakes are very high in both nitrogen and phosphorus like all lakes and impoundments in the Western Corn Belt Plains ecoregion. Floodplain lakes are shallow, productive oxbow lakes that are most frequent along the Missouri and Mississippi River floodplains. Given these facts, the RTAG
determined that benchmark values would not be based on lake types. Examination of the database also showed some data limitations for a regional assessment for some lake types.
Surface Area
Actual surface area estimates were available for 293 lakes and impoundments in the regional dataset. A moderate relationship between mean depth and surface area was found when a simple linear regression
parameter(µg/L) ecoregion n Median Min 25th
quartile Mean Max 75th quartile
TN CGP 40 895 105 643 1193 5310 1485
TN CIP 110 853 100 614 1024 4100 1202
TN COT 1 500 500 500 500 500 500
TN DA 0 - - - - - -
TN FH 23 615 70 370 848 2395 1285
TN IRL 6 550 380 453 691 1137 1073
TN MAP 0 - - - - - -
TN NGP 1 1090 1090 1090 1090 1090 1090
TN NSH 48 2862 575 1486 3385 15644 4525
TN OH 33 493 167 313 534 1215 662
TN ST 0 - - - - - -
TN WCB 119 1700 470 1250 2844 17600 3000
TP WHP 10 778 525 575 765 1020 951
TP CGP 61 90 10 47 123 610 145
TP CIP 136 61 5 40 91 740 119
TP COT 2 65 25 25 65 105 105
TP DA 1 265 265 265 265 265 265
TP FH 30 50 5 25 62 275 76
TP IRL 6 33 19 20 51 106 98
TP MAP 0 - - - - - -
TP NGP 1 130 130 130 130 130 130
TP NSH 51 253 10 126 379 2420 489
TP OH 34 26 11 20 37 146 51
TP ST 4 48 30 33 53 85 78
TP WCB 129 108 20 64 151 1815 165
TP WHP 11 40 10 20 54 220 55
Chla CGP 45 21 3 8 27 96 41
Chla CIP 134 15 2 8 22 110 26
Chla COT 2 6 4 4 6 8 8
Chla DA 1 20 20 20 20 20 20
Chla FH 30 10 2 6 14 54 17
Chla IRL 6 9 4 4 22 65 49
Chla MAP 0 - - - - - -
Chla NGP 0 - - - - - -
Chla NSH 43 28 5 15 64 467 60
Chla OH 33 8 1 4 10 34 15
Chla ST 4 13 7 8 16 30 27
Chla WCB 97 29 3 18 43 237 51
Chla WHP 2 8 4 4 8 12 12
Table 3. Descriptive statistics by ecoregion of USEPA Region 7 (lakes > 10 acres).
Freshwater Lakes and Reservoirs within USEPA Region 7 21
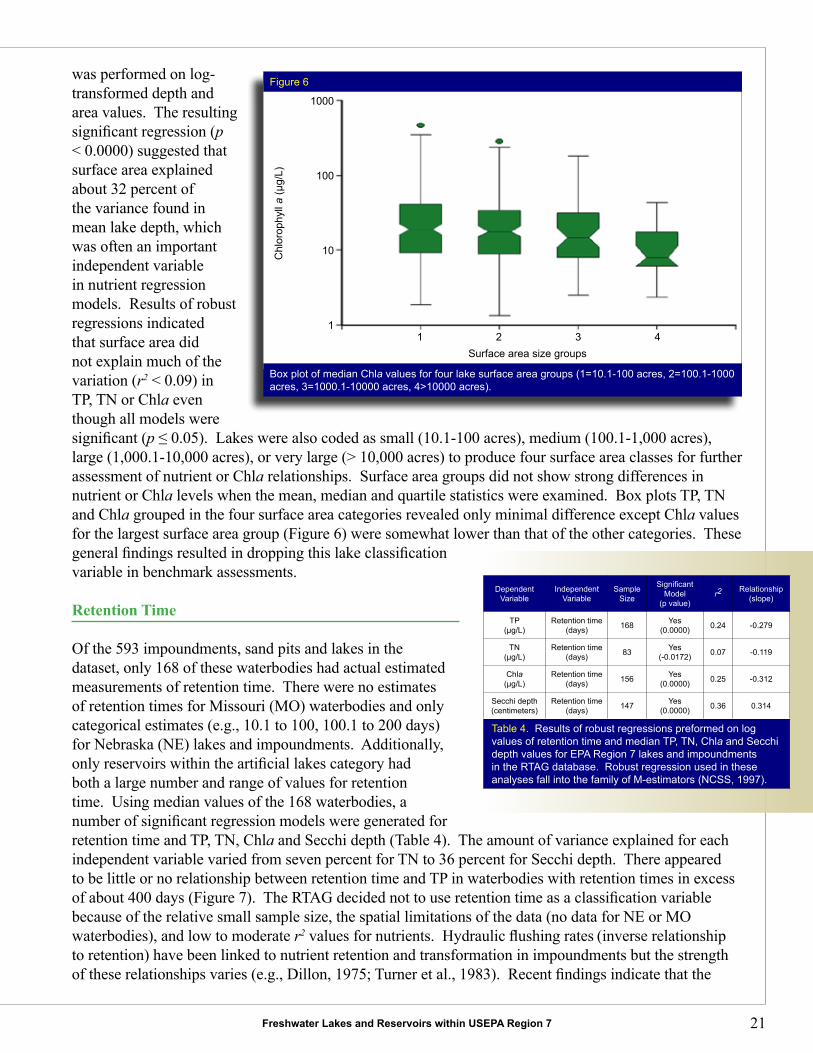
was performed on log-transformed depth and area values. The resulting significant regression (p < 0.0000) suggested that surface area explained about 32 percent of the variance found in mean lake depth, which was often an important independent variable in nutrient regression models. Results of robust regressions indicated that surface area did not explain much of the variation (r2 < 0.09) in TP, TN or Chla even though all models were significant (p ≤ 0.05). Lakes were also coded as small (10.1-100 acres), medium (100.1-1,000 acres), large (1,000.1-10,000 acres), or very large (> 10,000 acres) to produce four surface area classes for further assessment of nutrient or Chla relationships. Surface area groups did not show strong differences in nutrient or Chla levels when the mean, median and quartile statistics were examined. Box plots TP, TN and Chla grouped in the four surface area categories revealed only minimal difference except Chla values for the largest surface area group (Figure 6) were somewhat lower than that of the other categories. These general findings resulted in dropping this lake classification variable in benchmark assessments.
Retention Time
Of the 593 impoundments, sand pits and lakes in the dataset, only 168 of these waterbodies had actual estimated measurements of retention time. There were no estimates of retention times for Missouri (MO) waterbodies and only categorical estimates (e.g., 10.1 to 100, 100.1 to 200 days) for Nebraska (NE) lakes and impoundments. Additionally, only reservoirs within the artificial lakes category had both a large number and range of values for retention time. Using median values of the 168 waterbodies, a number of significant regression models were generated for retention time and TP, TN, Chla and Secchi depth (Table 4). The amount of variance explained for each independent variable varied from seven percent for TN to 36 percent for Secchi depth. There appeared to be little or no relationship between retention time and TP in waterbodies with retention times in excess of about 400 days (Figure 7). The RTAG decided not to use retention time as a classification variable because of the relative small sample size, the spatial limitations of the data (no data for NE or MO waterbodies), and low to moderate r2 values for nutrients. Hydraulic flushing rates (inverse relationship to retention) have been linked to nutrient retention and transformation in impoundments but the strength of these relationships varies (e.g., Dillon, 1975; Turner et al., 1983). Recent findings indicate that the
Box plot of median Chla values for four lake surface area groups (1=10.1-100 acres, 2=100.1-1000 acres, 3=1000.1-10000 acres, 4>10000 acres).
1000
100
10
1
Surface area size groups
Chl
orop
hyll
a (µ
g/L)
Figure 6
1 2 3 4
Dependent Variable
Independent Variable
Sample Size
Significant Model
(p value)r2 Relationship
(slope)
TP(µg/L)
Retention time (days) 168 Yes
(0.0000) 0.24 -0.279
TN(µg/L)
Retention time (days) 83 Yes
(-0.0172) 0.07 -0.119
Chla(µg/L)
Retention time (days) 156 Yes
(0.0000) 0.25 -0.312
Secchi depth(centimeters)
Retention time (days) 147 Yes
(0.0000) 0.36 0.314
Table 4. Results of robust regressions preformed on log values of retention time and median TP, TN, Chla and Secchi depth values for EPA Region 7 lakes and impoundments in the RTAG database. Robust regression used in these analyses fall into the family of M-estimators (NCSS, 1997).

22 Nutrient Reference Condition Identification and Ambient Water Quality Benchmark Development Process
primary source (i.e., point and non-point) of nutrient input to lakes is a determining factor as to how flushing rates affect nutrients and algal communities (Jones and Elliott, 2007).
MeanDepth
Mean depth was often associated with significant TP, TN and Chla regression models and explained moderate to low amounts of the variance in TP, TN and Chla. For example when using all lakes, the r2 values for significant TP, TN and Chla robust regression models where mean depth was the only independent variable were 0.10, 0.14 and 0.16,
respectively. Regression models with either surface area or retention time as the independent variable were either poor predictors of TP, TN and Chla levels or produced r2 values similar to the mean depth models.
To further explore the possibility of using mean depth as a classification variable, the RTAG created three depth categories: 2 meters and less (n≈242); 2.1 to 4 meters (n≈125) and greater than 4 meters (n≈46). The selection of the cut off values for each of the three categories was based on the distribution of the mean depth values and the collective opinion of the RTAG members as to the relevancy of each category in representing ecologically meaningful lake classes. No systematic effort was made to identify depth categories that yielded the most dissimilar classes for each of the nutrient and Chla variables. However, the RTAG also examined a 17-category depth classification but no clear associations between depth classes and TP, TN and Chla were observed in the March 2001 RTAG meeting. In the October 2001 RTAG meeting, the depth classification was reduced to two groups - shallow and deep lakes (<2m and ≥2m, respectively). The means, medians and quartiles values for TP, TN and Chla for both shallow and deep lakes were determined and compared for Trisection lakes and a priori-determined reference lakes excluding the Sand Hills lakes (Table 5).
In light of the close agreement of median values between shallow and deep reference lakes in all indicators except for perhaps TN, the RTAG decided not to pursue the development of benchmarks for shallow and deep lakes. The average median values for Chla in shallow versus deep lakes were 7 and 7.5 μg/L, respectively. Additionally, mean median concentrations for TP for shallow and deep lakes were 35.5 and 37 μg/L, respectively. The average median TN for shallow lakes was 981 μg/L, about 120 μg/L higher than the average median value for deep lakes (859 μg/L).
Non-linear regression of median TP (µg/L) and reservoir/lake retention time (days) for 167 reservoirs and lakes found in Iowa and Kansas. The retention time value of 10,400 days for Mined Lake No. 17 (KS) was considered an outlier and dropped from this analysis.
1000
900
800
700
600
500
400
300
200
100
0
Retention Time (days)
Tota
l Pho
spho
rus
(µg/
L)Figure 7
0 600 800 1000200 400 1200 1400 1600
Lake Group Indicator Variable Trisection Lakes (μg/L) Reference Lakes (μg/L)
Shallow Chla 6 8
Shallow TP 36 35
Shallow TN 1402 560
Deep Chla 7 8
Deep TP 40 34
Deep TN 783 935
Table 5. Comparison of shallow (<2m) and deep (≥2m) reference lakes by median concentrations for TP, TN and Chla.
Freshwater Lakes and Reservoirs within USEPA Region 7 23
A medians database was created to develop nutrient benchmarks for Region 7 waterbodies. For each waterbody in the database, a median value for
each parameter of interest was calculated for each event (each date) from the total population of all seasons, pooled across all years of record, all sampling sites, all sampling depths, and all replicates taken. The median values of all events were calculated to represent each waterbody. Because the data distributions tended not to be normally distributed, medians provided a better estimate of the central tendency for each parameter than arithmetic means. Without normalizing the data by using medians for each site, analyses would be biased toward the results of more frequently sampled sites. The use of parameter medians is also consistent with data reduction methods used in the USEPA’s guideline documents (USEPA, 2000a-f, 2001b-d, 2002).
A waterbody in the medians database was represented by its median TN value and by its median TP value, even if those measurements were taken during different sampling events. Furthermore, each median TN:TP ratio was not constructed as a quotient of the corresponding median TN and median TP values, but rather was the median of all calculated TN:TP values recorded for that waterbody. Sampling metadata (e.g., the name of data collector, date, and other information about specific sampling events) were not preserved with the parameter values for each waterbody in the medians database. The medians database comprised 486 records representing 486 waterbodies. As disclosed previously detailed inspections of data from the Nebraska Sand Hills ecoregion suggested that these extremely shallow, hypertrophic waterbodies should be considered regional outliers, thus these data were not used by the RTAG in setting regional benchmarks (Figure 5). The Sand Hills region of Nebraska is one of the most distinct and homogenous ecoregions in North America. Except for riparian areas this ecoregion is nearly treeless and almost devoid of
Statistical Analyses

24 Nutrient Reference Condition Identification and Ambient Water Quality Benchmark Development Process
cultivated crops while representing one of the largest grass stabilized sand dune regions in the world. Most of the lakes and wetlands of this region are found in two large aggregates; the western-most region of alkaline lakes and wetlands that have closed basins, and the central and eastern lakes regions with lakes having lower alkalinity values and high surface to groundwater interactions.
The Nutrient Criteria Technical Guidance Manual (USEPA, 2000) recommends that criteria development take into consideration not only nitrogen and phosphorus, but also the two response variables Chla (a measure of algal biomass) and SD transparency that is often used as an indirect measure of algal production. However, much of the land surface in USEPA Region 7 contains highly erodible soils that contribute to high levels of suspended inorganic turbidity in surface waters, and thus result in lowered SD transparency. Secchi disk measurements made under these conditions are not necessarily sensitive to changes in algal biomass, and therefore are not always good indicators of trophic state or nutrient status (Lind, 1986; Stauffer, 1991). The RTAG thus decided to focus only on TN, and TP, Chla in nutrient criteria development.
Water Quality Trends
The general water quality trends observed following statistical analyses of the Medians database were:
A majority of Region 7 waterbodies are eutrophic.• If eutrophy and hypereutrophy are defined according to the criteria proposed by Jones and Knowlton (1993), then waterbodies in 8 of the Level III ecoregions are eutrophic with respect to TN and TP concentrations (median values of TN >500 µg/L and TP >25 µg/L, Table 3), and waterbodies in 10 ecoregions can be considered to be eutrophic with respect to concentrations of Chla (median values of Chla >7 µg/L, Table 3).
A majority of waterbodies in Region 7 showed evidence of phosphorus limitation.• TN:TP ratios >10:1 by weight indicates that algal growth maybe either N-limited or jointly N- and P- limited, while TN:TP ratios >17:1 by weight imply that algal growth is phosphorus-limited (Smith, 1998). All calculated TN:TP medians were greater than 10, and four ecoregions had TN:TP medians greater than 17.
Size-related patterns in water quality were evident.• For the three primary parameters used in this study, there were significant size-related patterns in the median values for TN, TP, Chla:
natural > artificial > sand pit1. shallow > medium > deep2.

Freshwater Lakes and Reservoirs within USEPA Region 7 25
In order to assess the impacts of human mediated disturbances, scientists often identify sites that experience relatively minimal levels of
impairment and therefore represent “healthy or acceptable” conditions. These reference conditions can then be used as benchmarks for ecosystem health in the development of nutrient criteria (USEPA, 1998, 2000a). USEPA has suggested that the following general approaches can be used to assist in identifying and defining reference conditions in lakes and reservoirs:
Biological survey of sites. • Paleolimnology. • Evaluation of historical data. • Prediction of expected conditions using • models. Expert consensus.•
However, a question arises as to the meaning of reference condition and the extent of disturbance, or lack of disturbance, it represents. Varying levels of human disturbance found in the environment require the need for a range of reference condition definitions (Hughes, 1995; Bailey et al., 2004). Historical condition, the condition of the ecosystem at some point in the past undisturbed by human activity, is unlikely to be found and is difficult if not impossible to define. The minimally disturbed condition, or the absence of significant human disturbance, if this can be determined, may serve as a benchmark in comparing other definitions of reference condition such as least disturbed, which may change over time as climate, land use, and management practices change. Best potential condition is defined as least disturbed ecological conditions with best management practices in place for a time period that yields results. Most states in the Central Plains region refer to the least disturbed reference condition due to the extent
Reference Condition Determination

26 Nutrient Reference Condition Identification and Ambient Water Quality Benchmark Development Process
and nature of modern land use in the plains region. The RTAG examined several different methods of defining a reference condition that represents the least disturbed condition, or what is considered to be the best potential condition. This section compares these methods.
A Priori-Determined Reference Lakes
One method to determine which condition of lakes reflects reference condition, or minimal anthropogenic impact, is to examine lakes and their watersheds that reflect natural or geographic conditions representative to the region in which they occur. RTAG members were asked to evaluate each lake as to its reference condition. Members were provided with a complete list of all waterbodies in the lake database, and asked to evaluate land use and land cover; information regarding the nature and extent of point source pollution; general information on water quality; habitat characteristics; and six biological metrics (Table 6). This list was modified from a working document entitled “Core Factors to Consider in the Selection of Reference Condition in Central Plains Streams,” developed by the USEPA Region 7 Biocriteria Technical Advisory Group.
The RTAG utilized its diversity of regional experts in the determination of the reference condition to thoroughly and objectively assimilate the available information on potential reference lakes. Using the RTAG’s collective and localized
knowledge and expertise, all of the nuances of the local ecology as well as interpretation of existing data relative to reference condition were used to identify reference lakes and reservoirs within the context of environmental conditions in the central plains and adjacent regions. This approach also reduced the risk of making insufficiently informed decisions inherent in data interpretation by just one or a few like-minded professionals. It was recognized that each expert had available to them somewhat different data and experience with their waterbodies. However, the use of evaluation
State All lakes Reference lakes
Iowa 102 18
Kansas 148 47
Missouri 111 15
Nebraska 125 50 (10 without Sand Hills)
Table 7. Number of reference lakes selected by each state.
Factors A B
LAND USE/LAND COVER
Percentage row crop X
Land use/ land cover (broadscale conditions) X
Land use/ land cover (site specific) X
Urban and suburban development X
Crossover sites (occur in multiple ecoregions) X
POINT SOURCE
WWTPs X
CAFOs X
Mining X
Road density X
Oil field coverages X
Center pivot irrigation X
RCRA X
Superfund site X
WATER QUALITY
Sediment chemistry X
Water chemistry X
Natural salinity X
Natural anomalies (rare or unique sites) X
Artificial waterbodies X
Springs X
Dewatering/ water diversion X
HABITAT
Shoreline Development X
Septic tanks (density & proximity) X
Dendritic buffer strip/habitat X
BIOLOGICAL
Faunal assemblages (e.g., fish, macroinvertebrates) X
Threatened or endangered species X
Species in “need of conservation” X
Fish kills X
Fish surveys X
Aquatic life classification X
Table 6. Factors that should be considered in the evaluation and identification of reference lakes and reserviors. Two groups of factors were identified and ranked as to the importance; Group A which were considered to be important factors for consideration, and Group B factors that were worthy of consideration.

Freshwater Lakes and Reservoirs within USEPA Region 7 27
factors listed in Table 6 provided a common set of factors to be considered when developing individual state lists that included lakes of similar type and occurring within the shared ecoregions.
In response, Kansas submitted a list of 47 reference lakes. List membership was primarily based on a combination of land use/land cover (as percent row crop in the watershed) and historical data. Nebraska submitted a list of 50 lakes. List membership was based mainly on both watershed development and lake characteristics. Missouri submitted a list of 17 lakes, 15 primarily based on watershed land use/land cover characteristics of <10% row crop and >50% forest. Iowa submitted a list of 21 candidate lakes. The Iowa reference lake list membership was based on fulfillment of at least four of the following five criteria: (1) Chla: < 15 µg/L, (2) inorganic suspended solids: < 10 mg/L, (3) N:P ratio: from 20 to 100, (4) Secchi depth: > 1 meter, and (5) TP: < 100 µg/L. In summary, a total of 130 waterbodies were identified as reference quality (Table 7).
The population of a priori-selected lakes was designated as the ‘reference’ population. In Nebraska, 40 of the 50 reference lakes listed were found in the Nebraska Sand Hills ecoregion. Due to the unique nature of the lakes and wetlands associated with the Nebraska Sand Hills, all lakes from this ecoregion were removed from further analyses. Descriptive statistics for TN, TP, and Chla from the remaining waterbodies in this reference group were examined and are shown in Table 8. Region-wide, the
Parameters n Mean 25th quartile Median 75th quartile
TN (µg/L) 57 875 470 755 1100
TP (µg/L) 79 46 25 32 55
Chla (µg/L) 69 10 4 7 13
Table 8. Descriptive statistics for selected parameters for the a priori-defined population of reference lakes.
Violin plots of TP (µg/L) for all lakes and a priori reference lakes within ecoregions. Only lakes greater than 10 acres in surface area were included in this analysis. Dashed lines indicate, the benchmark value for TP of 35 µg/L.
1
10
100
1000
10000
CGP CIP FH NSH WCB WHP
ER
10000
1000
100
10
1
Ecoregion
TP (µ
g/L)
CGP NSHCIP FH WCB WHP
1
10
100
1000
10000
CGP CIP FH IRL NSH OH WCB WHP
ER
10000
1000
100
10
1
Ecoregion
TP (µ
g/L)
CGP IRL NSH CHCIP FH WCB WHP
Figure 8
All lakes
Reference lakes

28 Nutrient Reference Condition Identification and Ambient Water Quality Benchmark Development Process
mean concentration for each indicator was 14 to 30 percent higher than corresponding median values indicating the data was skewed toward higher values by a few lakes with high values. A series of violin plots were produced to examine the statistical properties of indicators both within and between various lake and ecoregion groupings (Figure 8 - Figure 10). The violin plot combines the basic summary statistics of a box plot (Tukey, 1977) with the visual information provided by a local density estimator. The goal is to reveal the distributional structure in a variable. The violin plot displays the median as a circle from which extends interquartile
range (25th to 75th percentiles) as a thick line, and these properties are then “boxed” by the mirrored density curves for all data. The thin lines extending from both ends of the interquartile “box” (line) represent the adjacent values. While there are many variations of the box plot, five or more data points are needed to correctly calculate and construct a box plot, therefore violin plots in Figures 8-10 are based on median values for five or more lakes that are represented by their median value.
TheQuartileMethodtoEstablishaReferenceCondition
USEPA’s Nutrient Technical Manuals (USEPA, 2000a; 2000b; 2001b) describe two ways of establishing a reference condition. The first method is to choose the upper quartile value (75th percentile) of the distribution of an a priori reference population of sampling stations. When reference conditions are not identified, the second method is to determine the opposite end of the distribution or
Parameters n Mean 25th quartile Median 75th quartile
TN (µg/L) 369 1540 627 990 1620
TP (µg/L) 441 104 40 67 127
Chla (µg/L) 381 26 8 16 32
Table 9. Descriptive statistics for selected parameters for the entire population of Region 7 lakes (excluding the Nebraska Sand Hills).
Violin plots of TN (µg/L) for all lakes and a priori reference lakes within ecoregions. Only lakes greater than 10 acres in surface area were included in this analysis. Dashed lines indicate, the benchmark value for TN of 35 µg/L.
10
100
1000
10000
100000
CIP FH NSH WCB WHP
ER
100000
10000
1000
100
10
Ecoregion
TN (µ
g/L)
NSHCIP FH WCB WHP
10
100
1000
10000
100000
CGP CIP FH IRL NSH OH WCB WHP
ER
100000
10000
1000
100
10
Ecoregion
TN (µ
g/L)
CGP IRL NSH CHCIP FH WCB WHP
Figure 9
Reference lakes
All lakes

Freshwater Lakes and Reservoirs within USEPA Region 7 29
lower quartile value (25th percentile) of the population of all available sampling stations (some of which are presumed to be degraded) within a region (Figure 11).
Using the dataset that excluded the Nebraska Sand Hills lakes, the 25th percentile of the entire lake population was calculated for each parameter (Table 9). This cut-off was later compared to other potential benchmark values (Table 10). The values also show that this dataset of USEPA Region 7 lakes does not fit the theoretical model proposed by the USEPA (Figure 11), since the 25th percentile of the parameters from the entire lake population is below that of the 75th percentile of the reference lake population. Histograms of the values further illustrate this point (Figure 12). The model most likely exaggerates what one would find for any set of lakes, greatly pulling the reference population out of the entire population. In reality, the reference population is a subset of the entire population and its bell curve should greatly or completely overlap the left side of the bell curve.
However, most waterbodies in Region 7 have already been strongly impacted by anthropogenic nutrient loading. In cases where a group of waterbodies already shows evidence of human impact, a percentile other than 25th percentile can be used in an effort to approximate previous natural conditions (USEPA Nutrient Criteria Guidance Manual April, 2000). Thus, the RTAG chose to explore a third procedure termed the Trisection method.
Parameter 75th percentile reference lakes
25th percentile all lakes
TN (µg/L) 1100 627
T P (µg/L) 55 40
Chla (µg/L) 13 8
Table 10. Comparison of the 25th percentile of the entire lake population and the 75th percentile of the a priori-defined reference population.
Violin plots of seston Chla (µg/L) for all lakes and a priori reference lakes within ecoregions. Only lakes greater than 10 acres in surface area were included in this analysis. Dashed lines indicate, the benchmark value for TP of 35 µg/L.
1
10
100
1000
CIP FH NSH WCB
ER
1000
100
10
1
Ecoregion
Chl
a (µ
g/L)
NSHCIP FH WCB
1
10
100
1000
CGP CIP FH IRL NSH OH WCB
ER
1000
100
10
1
Ecoregion
Chl
a (µ
g/L)
CGP IRL NSH CHCIP FH WCB
Figure 10
Reference lakes
All lakes

30 Nutrient Reference Condition Identification and Ambient Water Quality Benchmark Development Process
TheTrisectionMethodtoEstablishaReferenceCondition
The Trisection method (USEPA, 1998) designates the group of lakes that fall in the best third for a specific parameter as the reference condition for that parameter. This population of reference lakes can then be used as a standard of comparison for the entire population of lakes. Some methods recommend trimming off the worst 5 percent of lakes before sectioning the population into thirds, but the RTAG ultimately decided not to do this. However, as was the case in the other methods, the Nebraska Sand Hills lakes were removed from the set of data used to determine the Trisection reference sites.
After extensive preliminary analyses, the RTAG decided to focus on Chla alone as the primary factor used in Trisection-based reference nutrient criteria development; that is, the RTAG designated a subset of waterbodies
in the database as reference based solely upon their Chla levels and then examined all other corresponding physical and chemical characteristics of that sub-population. To arrive at this reference population, the population of Chla data provided by the medians dataset was first divided into thirds, and then the waterbodies in the lowest one-third were designated as ‘reference’ systems. Median values for TN, TP, and Chla for the waterbodies in this lowest one-third were then calculated (Table 11). Note that for Chla, the median value is approximately the 16th percentile of the population (the median of the best third), thus for Chla, the Trisection method yielded a more conservative value than the 25th percentile method suggested in the Nutrient Criteria Technical Guidance Manual (USEPA, 2000).
Reference values as selected from a theoretical dataset of streams, proposed by the USEPA Nutrient Criteria Guidance Manual (2000a). The reference value is selected from either the 75th percentile of a reference population or the 25th percentile of the entire waterbody population.
Higher water quality
Figure 11
Lower water quality
Reference lakes All lakes
75th
percentile
25th
percentile
Parameters n Mean 25th quartile Median 75th quartile
TN (µg/L) 103 1067 410 610 1110
TP (µg/L) 131 63 23 35 70
Chla (µg/L) 131 7 4 7 9
Table 11. Descriptive statistics for selected parameters for the Trisection-determined population of reference lakes.
a priori reference median
75th percentile a priori reference
25th percentile all lakes
Trisection reference median
TN (µg/L) 755 1100 627 610
TP (µg/L) 32 55 40 35
Chla (µg/L) 7 7 8 7
Table 12. Summary of the various methods to determine reference values of lake parameters.

Freshwater Lakes and Reservoirs within USEPA Region 7 31
Density traces of non-reference (solid line) and reference (dashed line) lakes in USEPA Region 7, for TN (µg/L), TP (µg/L) and Chla (µg/L).
80
70
60
50
40
30
20
10
0
Chlorophyll a (µg/L)
Num
ber o
f lak
es
1500 100 200 250
Num
ber o
f lak
esN
umeb
er o
f rec
ords
50
60
50
40
30
20
10
03000 200 400 600100 500
30
25
20
15
10
5
030000 2000 40001000 5000
Total phosphorus (µg/L)
Total nitrogen (µg/L)
Non-reference lakes
Reference lakes
Non-reference lakes
Reference lakes
Non-reference lakes
Reference lakes
Figure 12

32 Nutrient Reference Condition Identification and Ambient Water Quality Benchmark Development Process
After examining the various nutrient and stressor benchmarks determined using the various reference and distributional bench mark
determination approaches, much discussion ensued as to how to arrive at final recommended benchmark value for TP, TN and Chla. While the RTAG relied heavily on the outcomes of the selected benchmark determination approaches, the group also used its collective expertise and experience with lakes and reservoirs to guide its selection of a recommended value for each of the stressor and receptor indicators. Discussions continued until consensus was reached on each of the final benchmark values. Early in the RTAG process it was recognized that the response variable Chla was a well documented driver and indicator of lake and reservoir health. Downing et al., (2001) found that 10 µg/L of Chla represented a threshold at which cyanobacteria biomass and risk of dominance in lakes and reservoirs sharply escalates. Because cyanobacteria dominance has been clearly linked to reductions in lake ecosystem health the RTAG determined that 8 µg/L of Chla was necessary to protect lakes from the risk of high cyanobacteria biomass and bloom frequencies. The RTAG agreed that selection of a benchmark concentration at 10 µg/l (the threshold value) was still a level at which cyanobacteria dominance was shown to increase and thus provided no margin of safety against this risk. It was finally agreed that 8 µg/L represented a Chla level that would limit potential cyanobacteria and other aquatic life risks associated with eutrophication in regional waterbodies. Once this tentative Chla benchmark level was proposed the RTAG then examined the two benchmark approaches that strongly relied upon regional Chla values in the assessment process; the Tri section and to a lesser extent the a priori reference lakes. Chla levels associated with the eutrophic threshold literature (Table 13, OECD, 1982), 25th percentile distribution approach and the results of the USEPA determined benchmark levels for whole nutrient regions (USEPA, 2000c-f & 2001c-d)
Framework for Establishing Nutrient
Benchmarks

Freshwater Lakes and Reservoirs within USEPA Region 7 33
Great Plains Grass &
Shrubland(IV)
South Central Cultivated Great
Plains(V)
Corn Belt & Northern Great
Plains(VI)
Glaciated Dairy
Region (VII)
Southeastern Temperate Forested
Plains & Hills(IX)
Central & Eastern Uplands
(XI)
TN (µg/l) 440 560 781 660 358 458
TP (µg/l) 20 33 37.5 14.8 20 8
Chla (µg/l) 2 2.3 8.6 5.2 5.2 2.8
Table 14. USEPA Office of Water ambient water quality criteria recommendations (USEPA; Office of Water; 2000c-f & 2001c-d).
that partially occur in USEPA Region 7 (Table 14) were used as additional Chla benchmark estimators for this region.
In general, the Chla benchmarks derived from all five of the benchmark determination approaches (lines of evidence) were the same or similar to the RTAG’s originally determined 8µg/L threshold for Chla when assessing elevated cyanobacteria risks (Table 15). Only the mean nutrient region value for Chla determined from Table 14 produced a departure from the proposed 8µg/L threshold and other benchmark values. Typically, these broader USEPA studies of the whole nutrient regions (USEPA, 2000c-f and 2001c-d) generated low nutrient region benchmark levels for both stressors and receptors (Table 14) that contributed to the low mean values in Table 15 for this line of evidence. The preponderance of evidence and opinion of the RTAG indicated that the Chla benchmark value of 8µg/L was a reasonable and scientifically defensible benchmark for USEPA Region 7. Once the Chla benchmark was agreed upon, the RTAG used this receptor benchmark to work through the existing lines of evidence (the five benchmark approaches) to identify corresponding TN and TP benchmark values.
Benchmark estimates for TP were fairly consistent, ranging from a low of 22 to a high of 40 µg/L (Table 15). Those approaches that used Chla directly or indirectly in the benchmark determination processes (a priori reference, trisection and eutrophic threshold literature) yielded TP benchmark values that were most similar (30-35 µg/L). The RTAG decided to heavily weigh these lines of evidence in selecting the final TP benchmark value of 35 µg/L. This final benchmark was 3 µg/L higher than the a priori reference lakes value and table mean for TP (see TP row in Table 15) but the same as the TP value associated with the best one-third of regional lakes as determined using Chla values in the trisection approach.
As with the TP benchmark selection process, the RTAG used the tabular result of the five benchmark determination approaches (Table 14 and 15) as the starting point in deriving a final TN benchmark
Parameter Ultra-oligotrophic Oligo-trophic Meso-trophic Eutrophic Hyper-trophic
OE
CD
TP < 4 10 – 4 10 – 35 35 – 100 > 100
Mean Chla < 1 1 – 2.5 2.5 - 8 8 –25 > 25
Max. Chla < 2.5 2.5 – 8 25 – 8 25 – 75 > 75
Mean Secchi disk > 12 12 – 6 3 – 6 3 – 1.5 < 1.5
Nür
nber
g
TP < 10 30 – 10 30 -100 > 100
TN < 350 350 - 650 650 – 1,200 > 1,200
Mean Chla < 3.5 3.5 - 9 25 – 9 > 25
Mean Secchi disk > 4 2 – 4 1 – 2 <1
O2 depletion rate <250 250 -400 400 - 550 > 550
Table 13. Two fixed boundary trophic classification system for lakes (*OECD 1982, **Nürnberg 1996). TP, TN, Chla values are recorded as (µg /L), while mean Secchi disk depths are in meters (m) and dissolved oxygen (O2) depletion rates are given as mg m-2 d-1.
a priori reference median
25th percentile all lakes
Trisection reference median
EutrophicThreshold
Mean Nutrient Region Criteria Mean
TN (µg/l) 755 627 610 650 542 637TP (µg/l) 32 40 35 30 22 32Chla (µg/l) 7 8 7 8 4 7Table 15. Lines of evidence table for used as framework for discussion and consensus of RTAG lake nutrient benchmark values.

34 Nutrient Reference Condition Identification and Ambient Water Quality Benchmark Development Process
value. The benchmark values listed for TN in Table 15 varied for a high of 755 µg/L for the median concentration for a priori lakes to a low of 542 µg/L as determine using all data for those nutrient regions that partially occur in Region 7 (USEPA, 2000c-f & 2001c-d). The mean TN benchmark value from Table 15 is 637 µg/L which included the lower TN benchmark taken from the large USEPA study of the whole nutrient regions found to occur in Region 7. Removing this line of evidence from the calculation of means produced a somewhat higher TN benchmark value of 660 µg/L which was very similar to the literature threshold value of 650 µg/L for TN (see TN row in Table 15). Further discussion of the role of TN in regional lake enrichment identified TN:TP ratios as an approach that might be valuable in determining a final TN benchmark number as well as closer examination of the literature regarding TN threshold values and trophic state. The mean TN:TP ratio of USEPA Region 7 lakes was approximately 20 which is somewhat close to the level where either TP or both TN and TP could be limiting nutrients in this lake population. Using the 20:1 ratio of TN to TP and the proposed TP benchmark value of 35 µg/L the RTAG calculated that the corresponding limiting concentration for TN was 700 µg/L. Downing et al., (2001) also indicated that cyanobacteria dominance increased at or around 700 µg/L. These two findings suggested that a more appropriate benchmark would be a somewhat higher TN value than indicated by most of the benchmark approaches. Close examination of Nürnberg’s (1996) TN levels associated with eutrophic systems indicated that TN levels varied from 650 to 1200 µg/L and that the proposed regional TN benchmark value of 700µg/L occurred well within this range and supported the RTAG view that 700µg/L TN was both protective and representative of potentially limiting TN values in this region.
Thus the final suite of nutrient benchmarks produced by the RTAG was largely based on a weight of evidence approach that used five different benchmark determination approaches. All benchmark approaches were calculated using a standardized regional database, analyzed using the same methods and assessed and determined by group consensus of the RTAG. The RTAG was composed of some of the best regional and national experts on water quality, nutrient enrichment and aquatic ecosystem health and thus the final selection of benchmark

Freshwater Lakes and Reservoirs within USEPA Region 7 35
reflects their collective wisdom and knowledge as well as the quantitative benchmark data used by them in making their decisions. Below is summarized the final lake nutrient benchmarks.
During the RTAG process, the Kansas Department of Health and Environment released their “1999 Lake and Wetland Monitoring Program Report” (Carney, 1999) in which they developed ecoregional reference lake (i.e., reservoirs) conditions. Two methods of determining lake reference water quality for Kansas lakes were used; 1) the trisection approach (USEPA, 1998) and 2) KDHE program staff’s best professional judgment (BPJ). Carney’s findings representing statewide reference values (≈ benchmark values) were lower but similar to the proposed regional benchmarks (Table 16). In essence, Carney’s approach in identifying Kansas reference values for TN, TP and Chla used two of the five lines of evidence that the RTAG used in reaching its determination of regional benchmarks. While the state of Kansas lake population is just a portion of the larger regional lakes database, their more regional restricted findings do support the RTAG benchmark process and the resulting regional benchmark numbers.
As an evaluation of the appropriateness of the final regional benchmark values and to validate the occurrence of stressor/response relationships, early RTAG work using correlation and regression analyses were reviewed and a summary of findings using the regional lake population is presented below. Scatter plots, correlation matrices and robust regression analyses of the relationships between TP, TN and Chla were performed using a number of differing lake classifications and other classification factors including but not limited to lake size, lake depth and retention time. While only a few of these results are presented in this document, the RTAG used robust regression modeling to define stressor/response relationships and to calculate TP and TN values associated with several Chla concentrations, including the final benchmark value of 8 µg/L, which support the RTAG findings.
High Plains / Southwest Tablelands
(25/26)
Central Great Plains(27)
Flint Hills(28)
Central Irregular Plains(40)
Western Corn Belt
Pains(47)
Kansas Statewide
TN (µg/l) 474 648 176 407 646 405
TP (µg/l) 21 35 16 19 26 21
Chla (µg/l) 6.5 6.6 5.8 6.7 10.3 6.5
Table 16. Reference nutrient concentrations for lakes in the state of Kansas (Carney, Edward C., 2001; Lake and Wetland Monitoring Report; Kansas Department of Health & Environment).
Modelattributes
Central Great Plains
Central Irregular Plains Flint Hills
Nebraska Sand Hills
Ozark Highlands
Western Corn Belt Plains USEPA
TP TN TP TN TP TN TP TN TP TN TP TN TP TN
p value 0.0010 0.0280 0.0000 0.0000 0.0350 NS* 0.0307 0.0088 0.0000 0.0005 0.0000 0.0007 0.0000 0.0000
n 28 17 113 92 26 19 42 39 36 35 68 63 343 290
r2 0.34 0.28 0.26 0.15 0.17 0.11 0.17 0.52 0.31 0.33 0.17 0.4 0.34
Predicted value 39.9 616.4 30 350.7 36.9 15.7 522.2 41.5 667.9 25.5 279.6 33.8 477.4
Table 17. Predicted total phosphorus (TP) and total nitrogen (TN) values from chlorophyll a (Chla) robust regression models using unimpaired lakes (non 303(d) lakes) in the lakes database that were ≥10 acres in size and using a Chla concentration of 10 µg/L for the dependant variable.∗ p = 0.2598
Lake nutrient benchmarks for lakes occurring in Kansas, Iowa, Nebraska, and Missouri (excluding all Sand Hills lakes)
8 µg/l for chlorophyll-• a35• µg/l for total phosphorus700 • µg/l for total nitrogen

36 Nutrient Reference Condition Identification and Ambient Water Quality Benchmark Development Process
During 2001, the RTAG performed a number of robust regressions to identify and quantify stressor – receptor relationships when possible. As might be suspected, both TP and TN were found to be the best predictors of lake Chla and a number of significant models were produced and examined by the RTAG. Eleven ecoregional models and two USEPA Region 7 models were found to be significant models when using either log TP and TN as the single independent variable (Table 17). Only six ecoregion had enough (≈ 20) individual lake data to be used in these modeling efforts. Lake data used in these models were single value data, typically median values, to limit the effects of uneven sample size. Predicted TP and TN values were also calculated for all significant Chla models where the Chla value was set at 10 µg/L. As previously discussed, this Chla concentration appears to be a threshold level at which point the frequency of cyanobacteria blooms increase (Downing et al., 2001). Predicted TP values ranged from 15.7 µg/L in the Nebraska Sand Hills ecoregion model to 41.5 µg/L in the Ozark Highlands model while 33.8 µg/L was the predicted TP value in the USEPA Region 7 model (Table 17). A similar spread in predicted TN values was also observed within ecoregions while the predicted TN value of 477.4 µg/L for the USEPA Region 7 model was near the middle of ecoregion spread. It should be noted that some ecoregion models explained little of the observed variance in Chla concentrations (small r2) suggesting that other limiting factors might be involved in controlling Chla levels in these lakes.
In 2010 robust regression modeling was again used to examine the prior noted relationships between TP, TN and Chla and to use the model outputs to predict TP and TN values based on the proposed Chla benchmark of 8 µg/L. The lakes database used in these analyses included 13% more TP lakes and 8% more TN lakes than the 2001 database. The chlorophyll model (log Chla) using log TP as the independent variable was highly significant (p < 0.0000) as was the single independent variable (log TP). However, the intercept was not-significant (α ≥ 0.05) indicating that the intercept was zero (i.e., intercept not different from zero). This TP model had an r2 value of 0.39 and was based on a sample size of 396 lakes taken from the lakes database. Another robust regression model for log Chla was run using TN as the independent variable; the model, intercept and TN were all found to be highly significant (p < 0.0000). The r2 value for the Chla/TN model was 0.35 and was calculated from data on 318 lakes.
The upper and lower 95% confidence limit (CL) values were also calculated for the chlorophyll models used to predict TP and TN, which were very tight around the predicted TP value of 29.6 µg/L (Table 18). This was not the case for the Chla model used to predict TN levels where upper and lower 95% CL ranged from 60 to 3050 µg/L. The predicted TN concentration for this model was 322 µg/L, or about one half of the recommended TN benchmark value of 700 µg/L. This was the result of the large TN data cloud that suggests that other factors influence the Chla and TN relationship. One possibility is that most TN concentrations are very high and already in excess of limiting levels. It also may be that there are few nitrogen limited
USEPA Region 7 Models Model Parameters Formula and Calculation
TP Model Chla (µg/L)
TP (µg/L) m +b Log (Chla) = m Log(TP) +b
.09121672* + (.6135941)TP_log 8 29.6 0.614 0.000 0.903089987 0.614 1.470830598 0.000
Lower 95% CL for slope 8 47.7 0.538 0.000 0.903089987 0.538 1.678605924 0.000
Upper 95% CL for slope 8 20.5 0.689 0.000 0.903089987 0.689 1.310725671 0.000
TN Model Chla (µg/L)
TN (µg/L) m +b Log (Chla) = m Log(TN) +b
-.6535285 + (.6212593)TN_log 8 322 0.621 -0.654 0.903 0.621 2.507 -0.654
Lower 95% CL for slope and intercept 8 3050 0.529 -0.94 0.903 0.529 3.484 -0.94
Higher 95% CL for slope and intercept 8 60.1 0.714 -0.367 0.903 0.714 1.779 -0.367
Table 18. Predicted total phosphorus (TP) and total nitrogen (TN) values from chlorophyll a (Chla) robust regression models using all lakes in the lakes database that were ≥10 acres in size and using a Chla concentration of 8 µg/L for the dependant variable. All TP and TN models and their independent variables were significant at alpha ≤ 0.05 except where noted.*intercept for TP model was non-significant at alpha ≤ 0.05

Freshwater Lakes and Reservoirs within USEPA Region 7 37
lakes in Region 7 and Chla models should be calculated using only TN limited lakes.
In general the regression-predicted TP concentrations for USEPA Region 7 found in Table 17 and 18 were somewhat lower (≈30 and 34 µg/L, respectively) than the RTAG determined TP benchmark concentration of 35 µg/L for USEPA Region 7. Predictive Chla models for TN typically generated lower estimates of TN for the Chla models based on the benchmark of 8 µg/L. However, these predictive regression modeling approaches represent only one of several approaches that were used by the RTAG in their effort to determine appropriate stressor and response benchmarks for Region 7.
Throughout the process of determining benchmarks and documenting the process, the issue of sample size was discussed. The RTAG spent some time discussing the potential implications of sample size and sampling window (i.e., inclusive period that data would be aggregated into produce a sample size or population). The group recognized several important factors that might need to be taken into consideration in determining a minimal sample size for nutrients and especially Chla concentrations. The RTAG agreed that even “good” lakes can experience algal blooms including cyanobacteria blooms but it is the frequency, duration and extent of such conditions that determine the degree of impact and loss of potential uses. In addition TN, TP and Chla concentrations vary seasonally and annually depending upon prevailing climatologic conditions (e.g., wet year, drought period) and a sampling window broad enough to capture season or inter-annual conditions is desirable. Balancing the need to capture some or all of the natural variability of both stressor and receptors dynamics in regional lakes with the resource demands associated with data collection and analyses was discussed. The group recommended using a mean TN, TP and Chla value with a minimum of nine samples taken evenly over three growing seasons (3 year period). The RTAG concluded that they could not consider cost or resource related factors in their sample size recommendation since these factors were unknown to them, would likely change with time, and were beyond their charge as scientists.
In conclusion, the RTAG-proposed benchmarks for TN, TP and Chla are founded on the findings associated with five separate but related lines of evidence (benchmark determination approaches) as summarized in the first portion of this section. In retrospect, perhaps the RTAG should have formally included regression modeling as a sixth line of evidence in its documentation of the process used in determining the recommended benchmarks. The addition of the regression discussion can be viewed both as supportive evidence for the benchmark numbers and recognition of the importance of the regression in quantifying stressor – receptor relationships and “back casting” modeling results in examining specific receptor endpoints. This process greatly benefited from the individual and collective expertise of the RTAG and this document and the final benchmark values greatly benefited from this collective effort especially when weighing out the values and means of each of the various lines of evidence and their resultant values.

38 Nutrient Reference Condition Identification and Ambient Water Quality Benchmark Development Process
LITERATURECITED
Abel, R.A., S.M. Olson, E. Einerstein, P.T. Hurley, J.T. Diggs, W. Eichbaum, S. Walters, W. Wettengel, T. Allnutt, C.J. Loucks and P. Hedao. 2000. Freshwater Ecoregions of North America: A Conservation Assessment. World Wildlife Fund. Island Press, Washington, DC.
Anderson, D.M., P.M. Glibert and J.M. Burkholder. 2002. Harmful algal blooms and eutrophication: nutrient sources, composition and consequences. Estuaries. 25: 704-726.
Bailey, R.G. 1995. Description of the Ecoregions of the United States, 2nd ed. USDA, Misc. Publ. 1391, Washington, DC.
Bailey R.C., R.H. Norris and T.B. Reynoldson. 2004. Bioassessment of Freshwater Ecosystems Using the Reference Condition Approach. Kluwer Academic Publisher, Boston MA.
Bricker, S.B., C.G. Clement, D.E. Pirhalla, S.P. Orlando, and D.G.G. Farrow. 1999. National Estuarine Eutrophication Assessment: Effects of Nutrient Enrichment in the nation’s Estuaries. Special Projects Office and the National Centers for Coastal Ocean Science, National Ocean Service, National Oceanic and Atmospheric Administration. Silver Spring, MD.
Capper, J., G. Power, F.R. Shivers, Jr. 1983. Chesapeake Waters: Pollution, Public Health, and Public Opinion, 1607-1972. Centerville, MD. Tidewater Publishers.
Carney, C.E. 1999. Lake and wetland monitoring program, 1999 annual report. Bureau Environ. Field Services, Div. Environ., Kansas Department of Health and Environment, Topeka, KS. 60pp.
Chorus, I., I.R. Falconer, H.J. Salas and J. Bartram. 2000. Health risk caused by freshwater cyanobacteria in recreational waters. J. Tox. and Environ. Health. Part B. 8: 323-347.
Correll, D.L. 1999. Phosphorus: a rate limiting nutrient in surface waters. Poultry Sci. 78: 674-682.
Daldorph; P.W.G. and J.D. Thomas. 1991. The effect of nutrient enrichment on a freshwater community dominated by macrophytes and molluscs and its relevance to snail control. J. Applied Ecology. 28(2): 685-702.
Dillon, P. J. 1975. The phosphorus budget of Cameron Lake, Ontario: The importance of flushing rate to the degree of eutrophy of lakes. Limnol. Oceanogr. 20(1): 28-39.
Dodds, W.K. and R.M. Oakes. 2004. A technique for establishing reference nutrient concentrations across watersheds affected by humans. Limnol. Oceanogr.: Methods 2: 333–341.
Downing, J.A., S.B. Watson and E. McCauley. 2001. Predicting Cyanobacteria dominance in lakes. Can. J. Fish Aquat. Sci. 58: 1905-1908.
Egertson, C.J. and J.A. Downing. 2004. Relationship of fish catch and composition to water quality in a suite of agriculturally eutrophic lakes. Can. J. Fish. Aquat. Sci. 61: 1784-1796.
Elser, J.J., E.R. Marzolf and C.R. Goldman. 1990. Phosphorus and nitrogen limitation of phytoplankton growth in the freshwaters of North America: A review and critique of experimental enrichments. Can. J. Fish Aquat. Sci. 47: 1468-1477.
Eminson, D. and G. Phillips. 1978. Laboratory Experiment to Examine the Effects of Nutrient Enrichment on Macrophyte and Epiphyte Growth. Proceedings: 20th Congress, Internationale Vereinigung fur Theoretische und Angewandte Limnologie; Copenhagen, Denmark, 8 August 1977. Vol. 20, Part 1: 82-87.
Gibson, G.R., Jr., R.E. Carlson, J. Simpson, E. Smeltzer, J. Gerritsen, S. Chapra, S. Heiskary, J. Jones, and R. Kennedy.

Freshwater Lakes and Reservoirs within USEPA Region 7 39
2000. Nutrient Criteria Technical Guidance Manual. Lakes and Reservoirs. U.S. EPA Office of Water, Washington, D.C. EPA-822-B00-001.
Gibson, C.R., Jr., A.J. Howell, and G.W. Smith. 2004. Coastal Marine Waters Technical Sampling Methodology for Nutrient Criteria Development. USEPA. Office of Water, Office of Science and Technology. In preparation.
Grubbs, G. 2001. “Development and Adoption of Nutrient Criteria into Water Quality Standards”. Office of Science and Technology, US Environmental Protection Agency, WQSP-0101, Washington, D.C. November 14, 2001 memorandum.
Heiskary, S. 2000. Case Study, p. 6-10. In: Nutrient Criteria Technical Guidance Manual: Lake and Reservoirs. Office of Water, Office of Science and Technology. Washington, DC. USEPA-822-B00-001.
Howell, A.J. and Gibson, G.R., Jr. 2003. Quality Assurance Project Plan for Coastal Marine Nutrient Surveys and Reference Condition Development. USEPA. Office of Water, Office of Science and Technology.
Hughes, R.M. 1995. Defining acceptable biological status by comparing with reference conditions (Chapter 4). Biological Assessment and Criteria: Tools for Water Resource Planning and Decision Making, W. S. Davis and T. P. Simon, eds. Lewis Publishers, Boca Raton, FL.
Jones, I.D. and J.A. Elliott. 2007. Modelling the effects of changing retention time on abundance and composition of phytoplankton species in a small lake. Freshwater Biology 52: 988–997.
Jeppesen, E., J.P. Jensen, M. Søndergaard, T. Lauridsen, F. Landkildehus. 2000. Trophic structure, species richness and biodiversity in Danish lakes: changes along a phosphorus gradient. Freshwater Biology. 45(2): 201–218.
Kuchler, A.W. 1964. Potential natural vegetation of the conterminous United States. Am. Geographical Soc., Special Publ. 36, New York, NY.
Leach, J.H., M.G. Johnson, J.R.M. Kelso, J. Hartmann, W. Kumann and B. Entz. 1977. Response of percid fishes and their habitats to eutrophication. J. Fish. Res. Board Can. 34: 1964-1971.
Lind, O.T. 1986. The effect of non-algal turbidity on the relationship of Secchi depth to chlorophyll a. Hydrobiologia. 140(1): 27-35.
Lopez, C.B., E.B. Jewett, Q. Dortch, B.T. Walton and H.K. Hudnell. 2008. Scientific Assessment of Freshwater Harmful Algal Blooms. Interagency Working Group on Harmful Algal Blooms, Hypoxia, and Human Health of the Joint Subcommittee on Ocean Science and Technology. Washington, DC.
LDEQ (Louisiana Department of Environmental Quality). 2006. Developing nutrient criteria for Louisiana (version 2). Water Quality Assessment Division, LDEQ. 49 pp.
Maxwell, J.R., C.J. Edwards, M.E. Jensen, S.J. Paustian, H. Parrott and D.M. Hill. 1995. A hierarchical framework of aquatic ecological units in North America (Neartic Zone). Gen. Tech. Rept. NC-176. North Central Forest Experimental Station, Forest Service, USDA, St. Paul, MN.
Mueller, D.K. and N.E. Spahr. 2006. Nutrients in streams and rivers across the Nation – 1992-2001. U.S. Geological Survey, Scientific Invest. Rept. 2006-5107.
Muir, W. 2004. Personal communication. USEPA Region 3, Environmental Services Division. Philadelphia, PA.
National Academy of Sciences. 1969. Eutrophication: Causes, Consequences, Correctives. Proceedings of a symposium. Washington, DC.
National Research Council. 2000. Clean Coastal Waters: Understanding and Reducing the Effects of Nutrient Pollution. National Academy Press. Washington, DC. 405 pp.

40 Nutrient Reference Condition Identification and Ambient Water Quality Benchmark Development Process
Nürnberg, G.K. 1996. Trophic state of clear and colored, soft- and hardwater lakes with special consideration of nutrients, anoxia, phytoplankton and fish. Lake and Reservoir Management 12: 432-447.
Omernik, J.M. 1987. Primary Distinguishing Characteristics of Level III Ecoregions of the Continental United States.
Omernik, J.M. 1999. Primary Distinguishing Characteristics of Level III Ecoregions of the Continental United States. Draft.
Omernik, J.M. 2000. Draft Aggregations of Level III Ecoregions for the National Nutrient Strategy. http://www.USEPA.gov/ost/standards/ecomap.htm.
Organization for Economic Co-operation and Development, OECD, 1982. Eutrophication of Waters. Monitoring, Assessment and Control.
Persson, L., S. Diehl, S. Johansson and G. Andersson. 1991. Shifts in fish communities along the productivity gradient of temperate lakes: patterns and the importance of size-structured interactions. J. Fish Biol. 38: 281-294.
Price, K. S. 2001. Data Analysis for the Development of Nutrient Criteria for Estuaries in Delaware. Delaware Department of Natural Resources and Environmental Control. Dover, DE.
Rohm, C.M., J.M. Omernik, A.J. Woods, J.L. Stoddard. 2002. Regional characteristics of nutrient concentrations in streams and their application to nutrient criteria development. J. Am. Water Res. Assoc. 38(1): 213–239.
Schupp, D. and C.B. Wilson. 1993. Developing lake goals for water quality and fisheries. LakeLine, December, 1993: 18-21.
SAB (Science Advisory Board). 2007. Hypoxia in the Northern Gulf of Mexico: an update by the EPA Science Advi-sory Board. EPA-SAB-08-003, December 2007, SAB, Washington, D.C. 333 pp.
Smith, V.H. 1982. The nitrogen and phosphorus dependence of algal biomass in lakes: A empirical and theoretical analysis. Limnol. Oceanogr. 27: 1101-1112.
Smith, V.H. 1998. Cultural Eutrophication of Inland, Estuarine, and Coastal Waters. pp 7-49, In: Pace, M.L. and P.M. Groffman, eds. Successes, Limitations, and Frontiers in Ecosystem Science. Springer, New York, NY.
Smith, V.H., G.D. Tilman, and J.C. Nekola. 1999. Eutrophication: Impacts of Excess Nutrient Inputs on Freshwater, Marine, and Terrestrial Ecosystems. Environ Pollut. 100: 179-196.
Smith, V.H. 2003. Eutrophication of freshwater and coastal marine ecosystems. A global problem. Environ. Sci. Pollut. Res. 10: 126-139
Stauffer, R.E. 1991. Environmental factors influencing chlorophyll v. nutrient relationships in lakes. Freshwater Biology. 25(2): 279–295.
Stoddard, J.L. 2005. Use of ecological regions in aquatic assessments of ecological condition. Environmental Management. 34: 61-70.
TDEC (Tennessee Department of Environment and Conservation). 2004. Tennessee plan for nutrient criteria development, revised October 2004. Planning and Standards Section, Division of Water Pollution Control, TDEC, Nashville, TN.
Tukey, J. 1977. Exploratory Data Analysis. Addison-Wesley, Reading, MA.
Turner, R.R., E.A. Laws, R.C. Harriss. 1983. Nutrient retention and transformation in relationship to hydraulic flushing rate in a small impoundment. Freshwater Biology 13(2): 113-127.
USEPA. 1996. National Water Quality Inventory: Report to Congress 1996. Washington, DC. http://www.USEPA.
Freshwater Lakes and Reservoirs within USEPA Region 7 41
gov/305b/96report/index.html.
USEPA. 1998. Lake and Reservoir Bioassessment and Biocriteria Technical Guidance Document Office of Water, Office of Science and Technology. Washington, DC. USEPA- 841-B-98-007
USEPA. 2000a. Nutrient Criteria Technical Guidance Manual: Lakes and Reservoirs. Office of Water, Office of Science and Technology. Washington, DC. USEPA-822-B00-001.
USEPA. 2000b. Nutrient Criteria Technical Guidance Manual: Rivers and Streams. Washington, DC. USEPA-822-b00-002.
USEPA. 2000c. Ambient Water Quality Criteria Recommendations, Information Supporting the Development of State and Tribal Nutrient Criteria, Lakes and Reservoirs in Nutrient Ecoregion VI, EPA 822-B-00-008.
USEPA. 2000d. Ambient Water Quality Criteria Recommendations, Information Supporting the Development of State and Tribal Nutrient Criteria, Lakes and Reservoirs in Nutrient Ecoregion VII, EPA 822-B-01-009.
USEPA. 2000e. Ambient Water Quality Criteria Recommendations, Information Supporting the Development of State and Tribal Nutrient Criteria, Lakes and Reservoirs in Nutrient Ecoregion IX, EPA 822-B-00-011.
USEPA. 2000f. Ambient Water Quality Criteria Recommendations, Information Supporting the Development of State and Tribal Nutrient Criteria, Lakes and Reservoirs in Nutrient Ecoregion XI, EPA 822-B-012-008.
USEPA. 2001a. National Coastal Condition Report. Office of Research and Development/Office of Water. Washington, DC. USEPA-620/R-01/005.
USEPA. 2001b. Nutrient Criteria Technical Guidance Manual: Estuarine and Coastal Marine Waters. Office of Water, Office of Science and Technology, Washington, DC. USEPA-822-B-01-003.
USEPA. 2001c. Ambient Water Quality Criteria Recommendations, Information Supporting the Development of State and Tribal Nutrient Criteria, Lakes and Reservoirs in Nutrient Ecoregion IV, EPA 822-B-01-009.
USEPA. 2001d. Ambient Water Quality Criteria Recommendations, Information Supporting the Development of State and Tribal Nutrient Criteria, Lakes and Reservoirs in Nutrient Ecoregion V, EPA 822-B-01-010.
USEPA. 2002. Ambient Water Quality Criteria Recommendations, Information Supporting the Development of State and Tribal Nutrient Criteria, Lakes and Reservoirs in Nutrient Ecoregion X, EPA 822-R-02-051.
USEPA. 2007. Hypoxia in the Northern Gulf of Mexico: An Update by the EPA Science Advisory Board, EPA Science Advisory Board, EPA-SAB-08-003.
USEPA. 2009. An Urgent Call to Action – Report of the State-EPA Nutrient Innovations Task Group, http://www.epa.gov/waterscience/criteria/nutrient/nitgreport.pdf
USEPA. 2010..Review of Empirical Approaches for Nutrient Criteria Derivation, EPA Science Advisory Board, EPA-SAB-10-006.
USGS. 1999. The quality of our Nation’s waters – Nutrients and pesticides. U.S. Geological Survey, Circular 1225.
VWRRC (Virginia Water Resources Research Center). 2005. Issues related to freshwater nutrient criteria for lakes and reservoirs in Virginia: Report to the Water Quality Academic Advisory Committee. VWRRC Special Rept. SR27-2005. VWRRC, Virginia Polytechnic Institution and State University, Blacksburg, VA.
Vollenweider R.A. 1992. Coastal Marine Eutrophication: principles and control, pp.1-20, In: Marine Coastal Eutrophication, Vollenweider R.A., Marchetti R. and Viviani R. (eds.), Elsevier, Amsterdam.
