nutrition in the frail elderly · poorer nutritional status classified by mna-sf (bmi) associated...
TRANSCRIPT

Nutrition In The Frail Elderly
Professor Renuka VisvanathanAged & Extended Care Services, The Queen Elizabeth Hospital
And Adelaide Geriatrics Training and Research with Aged Care (GTRAC) Centre
June 2014
Alfred-Victoria
• Member of the Malnutrition In The Elderly Group, Nestle Australia
• Have participated in international initiatives that have been funded through educational grants from Nestle Inc.
• One of the research studies presented in this talk received research sponsorship from Organon Pty Ltd.
• In the past, during training years, I received small travel grants from Pfizer Australia and Servier to attend conferences
University of Adelaide 2
Conflicts of Interest
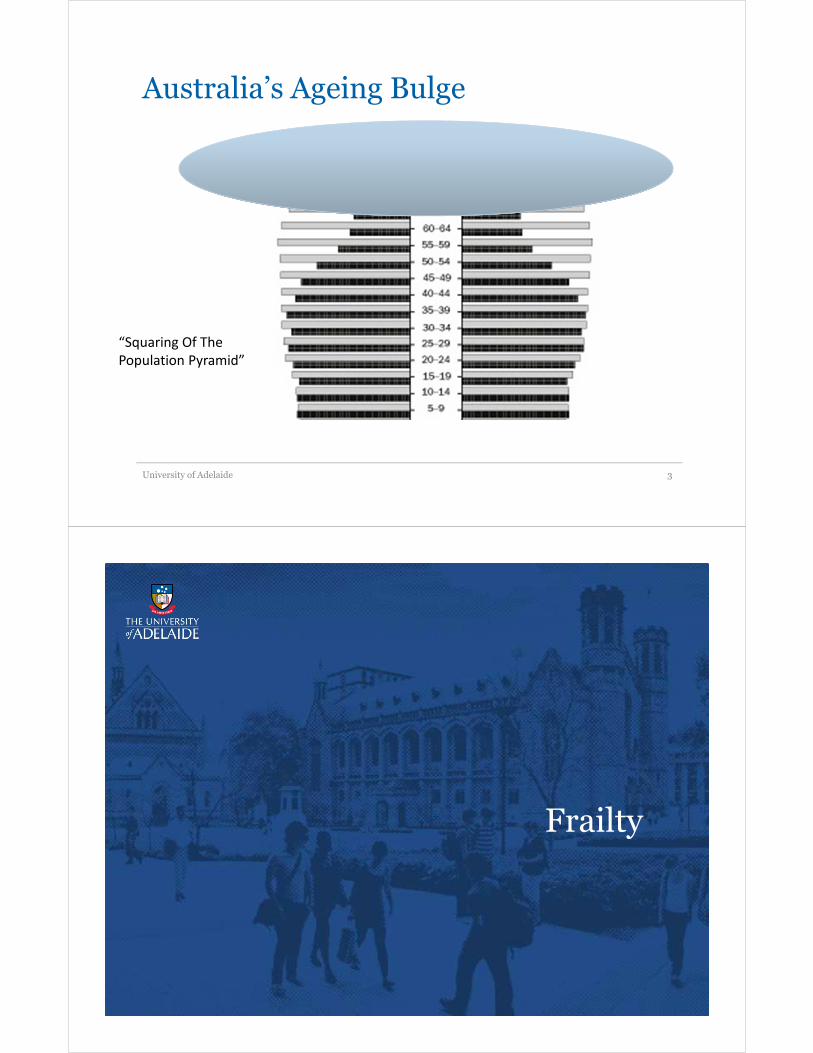
Australia’s Ageing Bulge
University of Adelaide 3
“Squaring Of The
Population Pyramid”
Frailty

FRAILTY• ‘the collected culmination of a lifetime of assaults on the body
by medical problems or lifestyle’ …..‘it is marked by reduced resilience’
• ‘the frail individual is weak, slow and vulnerable to stressor events, such as illness, falls or any circumstance that compromises their physical and/or mental equilibrium’
University of Adelaide 5
Clegg A, …….Rockwood K: Frailty in elderly
people. Lancet 2013, 381(9868):752-762.
72 years old60 years old 69 years old
Lack of Physical
Activity
High Fat and Salt
Diet
Low Fibre Diet
Diabetes
Hypertension
Constipation
Obesity
Diverticulitis
Angina
Obstructive Sleep
Apnoea
Colon Cancer
Stroke
Glaucoma
Hip Fracture0 80
Low socio-economic statusIncreasing Frailty
Frailty Will Be Commonly Seen In Hospitals
• There has been very little research in this area in Australia
• Using prevalence figures from overseas:
It is possible that in 2011, more than 270,000 community dwelling Australians aged 70 years and over were frail or at-risk of frailty.
By 2050, four million Australians aged 70 years and older will either be frail or at-risk of frailty.
University of Adelaide 6
Courtesy of Dr Helen Feist, Demography Researcher, UoA

Frailty: Causes and Consequences
University of Adelaide 7
Falls
Fractures
Medications/Drugs
Under-Nutrition
Early satiety
The Anorexia of Ageing
University of Adelaide 8
Decreased
Appetite
Feeling Full
Earlier
Reduced Nutritional Intake
Loss of Muscle Mass
Sarcopenia
Frailty
�Inflammation
Weight Loss

UNDER-NUTRITION IS COMMON AND HAS ADVERSE HEALTH
CONSEQUENCES
The Mini Nutritional Assessment
Well nourished (MNA > 24)
At risk of malnutrition (MNA= 17-23.5) Malnourished (MNA<17)

MALNUTRITION UNIVERSAL SCREENING TOOL
Malnutrition Screening Tool (MST)1) Have you / the patient lost weight recently without trying?No 0Unsure 2Yes, how much (kg)1-5kg 1 6-10kg 211-15kg 3>15kg 4Unsure 2
2) Have you / the patient been eating poorly because of a decreased appetite?No 0Yes 1
Total Score
If your patients have lost weight and / or are eating poorly they maybe at risk of malnutrition i.e. score 2 or more.
Applies to thelast 6 months
Of weight lossand appetitequestions
If unsure, ask ifthey suspect they have lost weight e.g. clothes arelooser.
For example < ¾of usual intake
May also be eating poorly dueto chewing and swallowing problems
References
1. Ferguson M, et al 1999, ‘ Development of a Valid and Reliable Malnutrition Screening Tool for Adult Acute Hospital Patients’, Nutrition, 1999 Vol 15, No.6 pp.458-
464

Nutritional Risk Is Common In The Community And Associated With Hospitalization
University of Adelaide 13
5%
Malnourished
+ 40% At-risk
�Hospitalization
�Hospital LOS
�Fall
Over 12 months
Nutritional Risk Leads To Poor Discharge Outcomes From Rehabilitation
University of Adelaide 14
����Discharge to acute
hospital or
residential care
M-30%
AR- 46.1%

Poorer nutritional status classified by MNA-SF (BMI) associated with longer:
indicating that for every SD drop in MNA-SF (BMI) score, LOS increased
by 0.19 SD
Lower GNRI score on admission, indicating poorer nutritional status, was
associated with lower discharge function
Poorer Nutritional Status Associated With Long LOS
Predictor Variable
Length of Hospital Stay (days)
Discharge Function (BI) Discharge Other than to Home
β‡ SE
§ 95% CI P β SE 95% CI P OR SE 95% CI P
Nutritional Screening Tool
MNA -0.12 0.004 -0.02 to 0.00 0.162 0.11 0.23 -0.08 to 0.83 0.093 0.96 0.03 0.90 to 1.02 0.14
MNA-SF-BMI -0.19 0.01 -0.08 to 0.10 0.027 0.06 0.40 -0.42 to 1.16 0.320 0.93 0.05 0.84 to 1.04 0.19
MNA-SF-CC -0.18 0.01 -0.03 to 0.00 0.041 0.07 0.37 -0.37 to 1.10 0.329 0.97 0.05 0.87 to 1.07 0.48
MNA-SF-MAC -0.16 0.01 -0.02 to 0.00 0.106 0.05 0.36 -0.42 to 0.10 0.418 0.94 0.05 0.85 to 1.03 0.18
MUST 0.02 0.02 -0.03 to -0.04 0.804 -0.4 1.04 -2.63 to 1.49 0.555 0.96 0.14 0.73 to 1.27 0.79
GNRI 0.06 0.002 -0.004 to 0.002 0.450 0.13 0.08 0.01 to 0.33 0.043 0.99 0.01 0.96 to 1.01 0.19 † All regression models controlled for 6 core confounding variables: for age, gender, CCI, MMSE, Admission BI, Lives Alone. The multiple regression models additionally controlled for CRP levels and GDS-15. LOS outcomes also controlled for "move not home". ‡ β = Standardised Beta Coefficient. §SE = Standard Error
Dr Elsa Dent PhD Work
Results MNA-SF (M) vs. Fried’s (Frail)
Dent E, JNHA
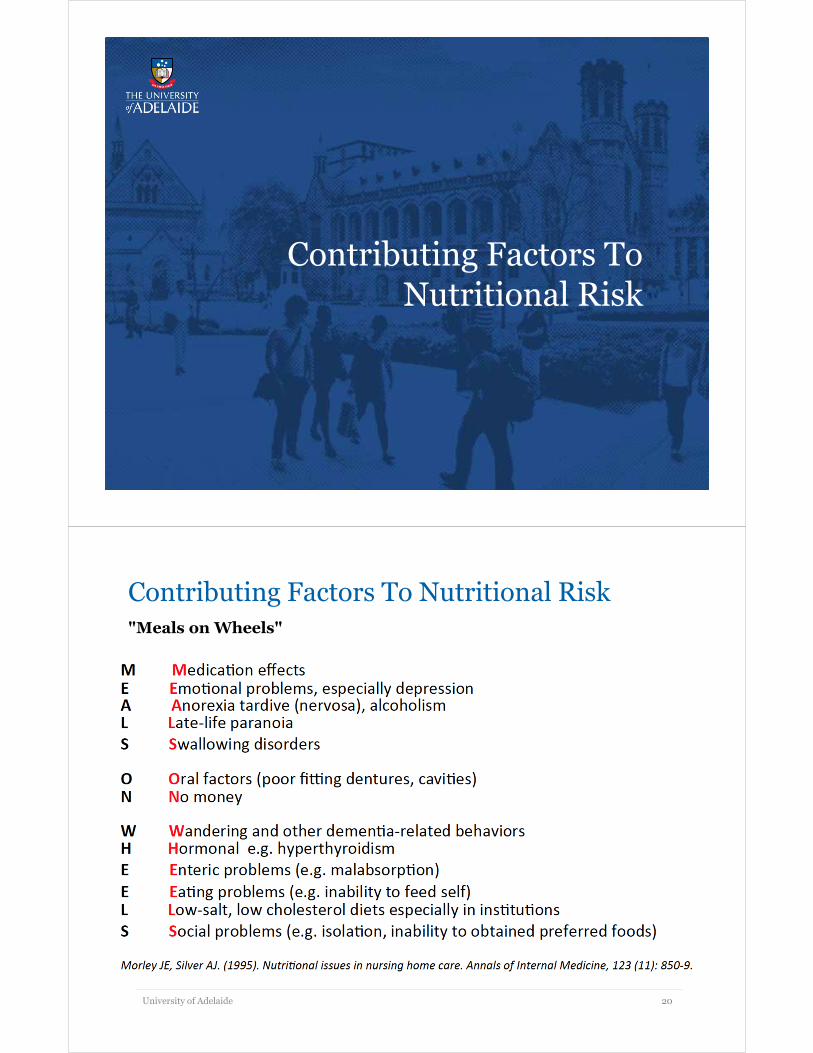
Nutritional Risk Is More Common With Increasing Frailty
University of Adelaide 17
I
N
C
R
E
A
S
I
N
G
F
R
A
I
L
T
Y
I
N
C
R
E
A
S
I
N
G
U
N
D
E
R
N
U
T
R
I
T
I
O
N
Visvanathan R 2007
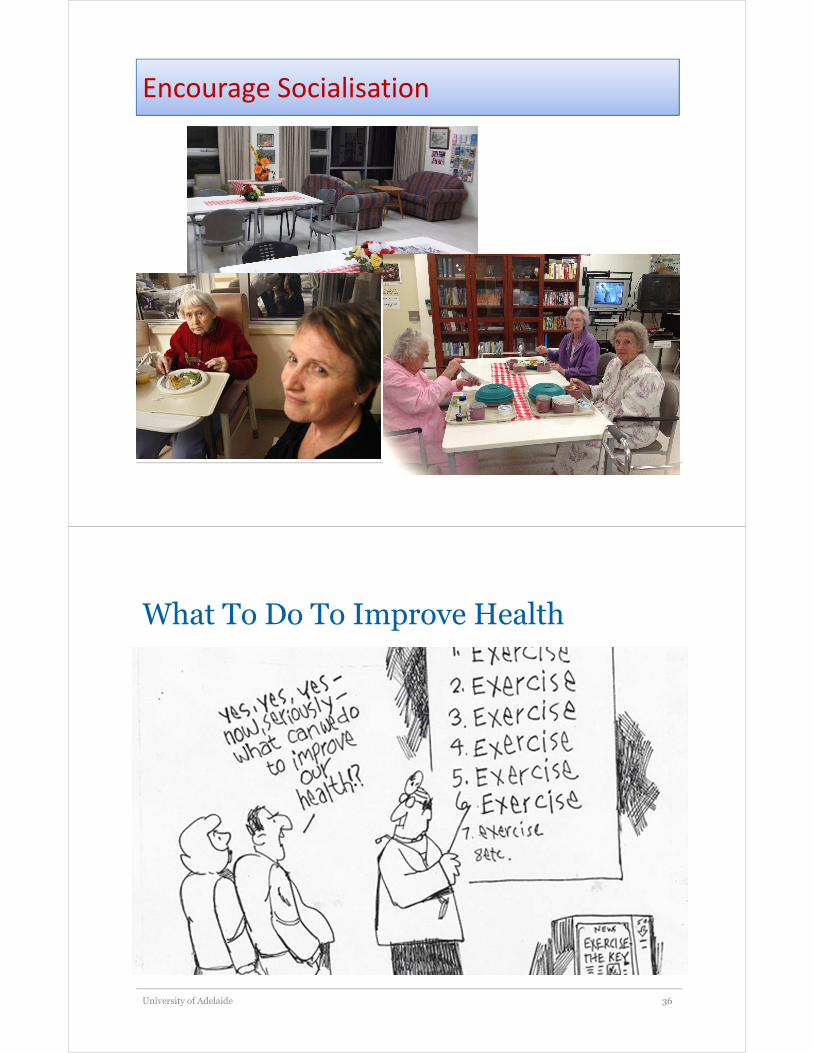
Poor Outcomes Related To Nutritional Risk
University of Adelaide 18
� ����Hospitalisation� ���� Hospital Length of Stay� ���� Falls� ���� Residential Care Placement� ���� Post-operative complications� ���� Delayed wound healing� ���� Infections� ���� Pressure sores� ����Health Care Costs� ���� Health Care Utilization•
�FRAILTY
�INDEPENDENCE
�QUALITY OF LIFE
Contributing Factors To Nutritional Risk
Contributing Factors To Nutritional Risk"Meals on Wheels"
University of Adelaide 20

In Hospital
• Subjective Global Assessment was used to assess 3122 patients from 56 hospitals in Australia and New Zealand
• Response via a 24 hour survey
Food consumption <50% in 35% of ‘Nourished’ and 50%of ‘Malnourished’ subjects
University of Adelaide 21
Agarwal E et. al. Clin Nutrition 2012
Ideal Body Weight

The Body Mass Index
• Weight in Kg / [Height in m]2
• WHO Healthy BMI range is 18.5-25kg/m2
Overweight BMI range is 25-<30 kg/m2
Obese BMI range is 30+ kg/m2
This is different in older people
University of Adelaide 23
University of Adelaide 24AJCN 2014
23.5kg/m2 was used as
the reference BMI
Note increased risk
at approximately
22kg/m2
Note no increased risk in
the WHO overweight
category
65+

What is Weight?
University of Adelaide 25
Where has the
muscle gone?
What is Weight?
University of Adelaide 26
WATER
BLOOD
MARROW
BONE
FAT
MUSCLE
40%

Muscle Is Important In Older Age
University of Adelaide 27
WATER
BLOOD
MARROW
BONE
FAT
MUSCLE
ReducedOSTEOPOROSIS FRACTURES
Reduced
Increase
d
OBESITY Diabetes
Myocardial Infarction
Stroke
Obstructive Sleep Apnoea
Hypertension
Sarcopenia
Loss of Independence
Falls and Fracture
Frailty
Weight Loss In Older People Associated With Muscle Mass Loss
University of Adelaide 28
With loss of weight there is a
loss of lean mass which is
undesirable
When weight is gained, very
little of the weight gain is due to
lean mass (i.e. harder to regain)
Newman et. al. AJCN 2005; 82: 872-878

Protein Intake For Older People
Protein Requirements In Older People- An International Expert Consensus [2012]
University of Adelaide 30
LUCKY NUMBER 13!
JAMDA 2013; 14: 542-559

Key Recommendations From The Group
• To maintain muscle, older people need more dietary protein than younger people :
1.0 to 1.2g/ kg body weight/day
• It is also recommended that 25 to 30g of protein (2.5 to 2.8g of leucine) is consumed with each of the three main meals
• In older people with acute or chronic disease, then the protein requirements increase to between 1.2 to 1.5g/kg body weight/day
• Ingesting protein after exercise is likely to benefit in terms of building muscle
University of Adelaide 31
Caution With Renal Disease
University of Adelaide 32

Avoid Prolonged Fasting
Provide Assistance
Encourage Socialisation
What To Do To Improve Health
University of Adelaide 36

University of Adelaide 37
Encourage Physical Activity

• Executive support
• Review organisation structure
• Training
• Create Value and belief
statements
• Effective communication
• Use employee focus groups
• Redesign your approach to
reward and recognition
Encouraging staff participation= Culture change
The review of organisation structure
Ms Karen Hales,
Nursing Director,
Central Adelaide Geriatrics Service
Key In Hospital Recommendations
• nutrition and oral health screening on admission• good access to dietetics• good access to dental services• high quality food services • access to ethnic appropriate meals• protected meal times• avoid prolonged/unnecessary fasting fasting• assistance with feeding• address reversible factors• early mobilization and physical therapy• encourage family/friends to be present (socialization)• system/organizational support + direct care champions• regular education and training
University of Adelaide 41
Thank You For Listening