nutsimprovedietqualitycomparedtootherenergy-dense
TRANSCRIPT
Hindawi Publishing CorporationJournal of Nutrition and MetabolismVolume 2011, Article ID 357350, 11 pagesdoi:10.1155/2011/357350
Research Article
Nuts Improve Diet Quality Compared to Other Energy-DenseSnacks While Maintaining Body Weight
Siew Ling Tey,1 Rachel Brown,1 Andrew Gray,2 Alexandra Chisholm,1 and Conor Delahunty3
1 Department of Human Nutrition, University of Otago, P.O. Box 56, Dunedin 9054, New Zealand2 Department of Preventive and Social Medicine, University of Otago, P.O. Box 913, Dunedin 9016, New Zealand3 CSIRO Food and Nutritional Sciences, P.O. Box 52, North Ryde, NSW 1670, Australia
Correspondence should be addressed to Rachel Brown, [email protected]
Received 1 April 2011; Accepted 26 May 2011
Academic Editor: Andrea Buchholz
Copyright © 2011 Siew Ling Tey et al. This is an open access article distributed under the Creative Commons Attribution License,which permits unrestricted use, distribution, and reproduction in any medium, provided the original work is properly cited.
Previous studies have reported that regular nut consumption reduces cardiovascular disease (CVD) risk and does not promoteweight gain despite the fact that nuts are energy-dense. However, no studies have investigated the body composition of thoseregularly consuming nuts compared to similar intakes of other snacks of equal energy density. This parallel study (n = 118)examined the effects of providing daily portions (∼1100 kJ/d) of hazelnuts, chocolate, or potato crisps compared to a control groupreceiving no snacks for twelve weeks. Effects on body weight and composition, blood lipids and lipoproteins, resting metabolicrate (RMR), appetite indices, and dietary quality were compared. At week 12, there was no significant difference in any of theoutcome measurements between the groups except for dietary quality, which improved significantly in the nut group. Nuts can beincorporated into the diet without adversely affecting body weight and can improve diet quality.
1. Introduction
Nuts are rich in unsaturated fats, fibre, minerals, vitamins,and phytonutrients [1–5]. Regular consumption of nutshas been associated with reductions in blood cholesterolconcentrations and the risk of CVD [6–11]. However, nutsare energy-dense, high-fat foods, meaning that they containhigh amounts of energy per unit weight. In general, theconsumption of energy-dense foods is associated with weightgain and obesity [12, 13]. Therefore, the public healthrecommendation to consume nuts on a regular basis couldpotentially result in weight gain and possibly negate theirbeneficial effects. Also, the general public perceive nuts as“fattening” and thus might not heed the advice to consumenuts regularly as a means of reducing CVD risk [14]. It is,therefore, important for policy makers to determine whetherthe regular consumption of nuts may promote weightgain and hence increase obesity rates among the generalpopulation and, based on findings, change the wording ofthe health recommendation to consumers as appropriate toclarify any misperceptions.
Epidemiological studies show that nut consumers tendto be leaner than those who do not regularly consume nuts.This research tends to show an inverse or no associationbetween nut consumption and body mass index (BMI) aswell as adiposity [15–19]. Also, clinical trials, where theprimary outcomes have included cardiovascular risk factorssuch as blood cholesterol, have failed to show an increasein body weight with regular consumption of different kindsof nuts, albeit over the short term [7, 9, 20–25]. However,these studies were not designed to assess body weight and inmany instances the investigators provided dietary advice oradjusted energy intake to prevent weight gain.
Studies that have looked at the role of nuts in the contextof supervised weight loss diets reported that subjects whoconsumed nut-enriched diets experienced greater weight lossand greater improvement in CVD risk factors compared witha low-fat diet [26, 27], a complex carbohydrate diet [28],or an isocaloric diet without nuts [29]. Thus, incorporatingnuts into diets intended for weight loss and weight controlhas the potential to result in more favourable changes inbody weight and CVD risk. Four randomised crossover trials
2 Journal of Nutrition and Metabolism
involving the consumption of nuts have specifically lookedat body weight as the primary outcome [30–33]. In generalthese studies indicate that the daily inclusion of nuts into thediet results in either no weight gain or less weight gain thanpredicted from the additional energy intake.
There have been several purported reasons why regu-lar nut consumption may not result in the theoreticallypredicted weight gain [34–37]. Firstly, nuts are high inprotein and fibre with low glycaemic index value, whichmay promote satiety resulting in a reduction in caloriesfrom other foods, that is, dietary compensation [30–33,38, 39]. The crunchy textural property of whole nuts mayalso promote satiety as the mechanical act of masticationresults in the secretion of appetitive hormones such ascholecystokinin and glucagon-like peptide-1 [28, 40–44].Secondly, previous work has suggested that nut consumptionmay lead to an increase in energy expenditure. In humans,a high unsaturated-to-saturated-fat ratio in the diet canincrease RMR. Thus, the high unsaturated fat content of nutsmay increase RMR [30, 41, 45, 46]. Thirdly, some researchhas suggested that the lipid found in nuts may not be highlybioaccessible [47, 48], meaning that a high proportion of thisfat is excreted in the faeces and therefore not available forenergy metabolism [32, 40, 49, 50].
All the above-mentioned studies were not designed toanswer the question as to whether nut consumption isdifferent to the ingestion of other isoenergetic foods withregard to dietary compensation and energy metabolism.This information is needed to determine whether thereis something unique about nuts, setting them apart fromother more highly processed energy-dense foods. It is alsoneeded to confirm current public health advice that nuts,though an energy-dense food, are nutrient-dense and thusshould be consumed regularly as part of a cardio-protectivediet. Therefore, the purpose of this study was to assessthe effects of providing daily portions (∼1100 kJ/d) ofhazelnuts, chocolate, or, potato crisps for twelve weeks onbody weight and composition, blood lipids and lipoproteins,RMR, appetite indices, and diet quality compared with thecontrol group.
2. Materials and Methods
2.1. Subjects. One hundred and twenty-four participantswere recruited from the general public in Dunedin, NewZealand (NZ). The inclusion criteria were healthy males orfemales aged between 18 and 65 years. The exclusion criteriawere people with BMI≥ 30 kg/m2, people who have asthma,women who are pregnant or breastfeeding, people with achronic disease such as cancer, heart disease, or diabetes, andpeople with food allergies or food aversions. The study pro-tocol was approved by the Human Ethics Committee of Uni-versity of Otago, NZ. All participants gave written informedconsent. The trial was registered at the Australian NewZealand Clinical Trials Registry (http://www.anzctr.org.au/),registration number ACTRN12609000265279.
2.2. Test Products. All the Ennis hazelnuts used in thisstudy were purchased from Uncle Joe’s Walnuts (Blenheim,
Marlborough, NZ). All nuts were stored at room temperaturein darkness prior to opening. Dairy milk chocolate (Cadbury,Dunedin, NZ) and ready salted potato crisps (Bluebird,Auckland, NZ) were chosen as comparison foods becausethey are both popular snack foods in NZ and have a verysimilar energy density to nuts, with one being savoury andthe other sweet. The energy density for the study hazelnutswas 26 kJ/g, while the energy density for the chocolate andpotato crisp was 22 kJ/g.
2.3. Study Design. This study was conducted using arandomised, controlled, parallel design with four arms:∼1100 kJ/d for each of hazelnuts (42 g) chocolate (50 g), andpotato crisps (50 g) or no additional food (control group).People who were interested in the study contacted theinvestigator by phone or email. Participants were informedthat the purpose of the study was to assess the effects ofconsuming three different snacks on energy balance andblood cholesterol concentrations. We purposely did notemphasise body weight so that participants were unawarethat this was the focus of the research. They were asked tocomplete a recruitment questionnaire, which included con-tact information, demographic and relevant health detailsthat might affect the study outcomes. All participantswere asked to consume their regular diets (baseline diet)during a two-week run-in period. Baseline measurementswere collected from each participant following this run-in period. These included body weight and composition,blood lipids and lipoproteins, RMR, appetite indices, athree-day diet record (3DDR), and physical activity levels.After collecting all baseline measurements, participants wererandomly allocated to one of the four groups for a period of12 weeks.
Due to the strong possibility of age, sex, and BMIeffects, groups were balanced using eight strata coveringall possible combinations of age group (18–40, 41–65), sex(male, female), and self-reported BMI group (<25, 25–29.9)categories. Allocation within each strata was conducted byan off-site statistician using blocks of size four. Incompleteblocks remaining at the conclusion of enrolment wererandomly allocated first using strata based on sex and BMIand then only BMI, and finally without stratification. Thestatistician was located in another building and had noinvolvement in the enrolment process.
All snacks were individually portioned into daily servingsized bags and participants were asked to collect their snacksfrom the university every three weeks. They received nodietary advice, except that participants in the interventiongroups were told that they might consume the snackshowever they wished as long as their daily portion wasconsumed each day. Participants were instructed that thesnacks were solely for their own personal consumption andshould not be shared with others. They were also asked toreturn any snacks not eaten on any given day. The controlgroup received no additional food. However, they were givena month supply of the snacks of their choice at the end of thestudy. Compliance was measured by weighing the returnedserving bags and by 3DDR.

Journal of Nutrition and Metabolism 3
2.4. Dietary Assessment. A three-day weighed diet record ofall foods and beverages consumed both in and out of thehome was collected from participants at baseline and duringthe intervention using dietary scales (Salter Electronic, SalterHouse wares Ltd., Kent, UK), accurate to within ±1 gram.The nonconsecutive three days included two weekdays andone weekend day over a one-week period.
The initial 3DDR was issued during the diet recordinstruction session at the first visit. Detailed instructions onhow to collect diet records were verbally presented to eachparticipant by a trained researcher. Written instructions werealso included in the 3DDR. Pictures of different portionsizes of common food were given to the participants to helpthem estimate quantities when they did not prepare the mealthemselves. A reminder email and text were sent the dayprior to every dietary collection week to improve compliance.Participants were asked to complete a 3DDR at baseline andduring the intervention, and all 3DDRs were reviewed by theresearcher upon return for completeness and accuracy.
All diet records were analysed to provide an estimateof average energy and nutrient intakes using the com-puter programme Diet Cruncher for the PC [51]. Theprogramme utilises food composition data from NZ Com-position Database [52]. All diet records were entered by asingle trained researcher to ensure consistency in data-entrydecisions when substitutions had to be made.
2.5. Appetite-Rating Questionnaire. Participants in the inter-vention groups (hazelnut, chocolate, and potato crispgroups) were also asked to record their appetite ratings on a100 mm visual analogue scale (VAS) immediately before andafter they consumed the study snacks on the same three daysthat dietary intake was recorded. Mean scores were calculatedfor the 3-day period, using the mean score from one ortwo days where there was missing data. The appetite-ratingquestionnaires included questions on hunger, desire to eat,prospective consumption, fullness, and preoccupation withthoughts of food. Hunger was assessed with the question“How hungry do you feel right now?” preceded with a100 mm VAS, anchored with “Not at all hungry” on the leftside (0 mm) to “Extremely hungry” on the right side of thescale (100 mm). Desire to eat was assessed with the question,“How strong is your desire to eat right now?” and anchoredwith “Strong desire not to eat” and “Strong desire to eat.”Prospective consumption was assessed with the question,“How much food could you eat right now?” and anchoredwith “Nothing at all” and “The most that I have ever eaten.”Fullness was assessed with the question, “How full do youfeel right now?” and anchored with “Not at all full” and“Extremely full.” Preoccupation with thoughts of food wasassessed with the question “Do you have any preoccupationwith thoughts of food right now?” and anchored with“No thoughts of food” and “Very preoccupied, difficult toconcentrate”.
2.6. Physical Activity Assessment. Physical activity may influ-ence the primary outcome measures of interest in this study,namely, body weight and composition and blood lipids andlipoproteins. Therefore, it was important to measure habitual
physical activity. Physical activity was measured using NL-1000 accelerometers (New Lifestyles Inc., USA) at baselineand during the intervention. Participants were asked to wearthe accelerometer clipped to their waist for a period of sevendays. Detailed instructions on how to wear the accelerometerwere given to the participants. The accelerometer was sealedso that participants were blinded to the activity reading.After the accelerometer was returned, information includingnumber of steps and duration of activity was retrieved fromthe 7-day memory and recorded in an Excel spreadsheet.
2.7. Resting Metabolic Rate. Resting metabolic rate wasmeasured by indirect calorimetry after an overnight fast ofat least 12 hours. Due to time constraints, RMR was assessedon around half of the study participants (n = 52) who wererandomly chosen. After a 15-minute rest period, expiredgas collection was achieved through a mouthpiece with thenose clipped for a 15-minute period. Participants were askedto consume their normal diet and refrain from exercise inthe 24-hour period prior to the test. They were also askedto avoid alcohol, caffeine, or nicotine within 12 hours ofthe test. Menstruating females were measured during thefollicular phase of the menstrual cycle, as metabolic ratecould be affected by the thermic effect of progesterone duringthe luteal phase [53].
2.8. Biochemical Indices. Venous blood samples were takenby a nurse at the Human Nutrition clinic on six occasions;two samples at baseline, twice after six weeks, and twice at theend of the study. Two blood samples on nonconsecutive dayswere collected during each testing week to account for intra-individual variation in blood lipid measures. Fasting bloodtests were collected from participants following a 12-hourovernight fast. Ten millilitres of venous blood was collectedinto Vacutainers (Belton Dickinson Diagnostics) containingdisodium EDTA for the analysis of plasma blood lipids andlipoproteins concentrations. Vacutainers were inverted andstored in a chilly bin containing chilled ice-pads after bloodsamples were drawn. All blood specimens were separated bycentrifugation at 3000 g for 15 minutes at 4◦C within twohours of being drawn. Once plasma and red blood cells wereseparated, aliquots were stored at −80◦C until analysis.
Plasma total cholesterol (TC), high-density lipoproteincholesterol (HDL-C), and triglyceride concentrations weremeasured in all blood samples by enzymatic methodsusing kits and calibrators supplied by Roche Diagnostics(Mannheim, Germany) on a Cobas Mira Plus Analyser.High-density lipoprotein cholesterol was measured in thesupernatant following precipitation of apoprotein B contain-ing lipoproteins with phosphotungstate-magnesium chlo-ride solution [54]. Plasma low-density lipoprotein choles-terol (LDL-C) concentration was calculated using the Friede-wald formula [55].
Calibration and quality control is maintained by par-ticipation in the Royal Australasian College of PathologistsQuality Assurance Programme. The mean intra-assay andinter-assay coefficients of variation for plasma TC, HDL-C and triglyceride were 1.12%, 4.74%, 0.73% and 2.76%,6.91%, 2.08%, respectively.
4 Journal of Nutrition and Metabolism
2.9. Anthropometric Measurements. Standing height wasmeasured at baseline to the nearest millimeter using astadiometer. Participants were asked to stand with shoes off,and their backs and heels against the back of the stadiometer.They were instructed to take a deep breath and the adjustablelever was then lowered until it was resting on the top of theirhead.
Body weight was measured in the morning in the fastingstate during all clinic visits. Participants were weighed inlight clothing without footwear, on a bioelectrical impedanceanalyser placed on a hard flat surface that measured to thenearest 0.01 kg. The same machine was used throughoutthe study. Body composition including fat mass, body fatpercent, and waist fat percent was measured at baselineand at the end of the study by using dual energy X-rayabsorptiometry (DXA).
2.10. Statistical Analysis. In order to have 80% power todetect a difference of 0.46 kg or more in weight gain overthe 12 weeks (equivalent to an annual weight change of2.0 kg) between any two groups and assuming a standarddeviation (SD) in weight change of around 0.6 kg for the12-week period (estimated from an overfeeding study byDiaz et al. [56]) using a two-sided test with the level ofsignificance set to 5%, 27 participants would be required ineach group at the end of the study. This detectable effect sizewas equivalent to roughly 20% of the expected weight gainfor the non-control groups based purely on the additionalcalories consumed with full compliance and assuming nocompensatory changes in energy intake. This sample sizewould also be sufficient to detect effect sizes of 0.8 SD orlarger in the appetite ratings in the same way. Allowing for upto 10% attrition and unusable data, 30 participants should beenrolled in each group, 120 participants in total for the fourgroups.
Baseline characteristics of the participants were presen-ted as arithmetic or geometric means and arithmetic orgeometric standard deviations as appropriate. Categoricaldata were presented as frequencies and percentages. Theeffects of the four interventions on all outcomes includingbody weight and composition, blood lipids, RMR, appetiteindices, dietary intakes, and physical activity level wereexamined using either regression models controlling forbaseline values where measurements were available only atbaseline and follow-up (body composition, RMR, appetiteindices, dietary intakes and physical activity level) or linearmixed models with a random subject effect where interimmeasurements were also available (body weight and bloodlipids). Changes within groups were shown along withtheir associated standard errors. Where the overall testfor difference in changes between groups was statisticallysignificant, pairwise comparisons between groups wereperformed. Log-transformations were used for both finaland baseline (and interim where appropriate) values ofdependent variables where this improved residual normalityand/or homoscedasticity.
The primary analysis was intention-to-treat (ITT) analy-sis, which included data from all participants who underwentrandomisation. A secondary per-protocol (PP) analysis was
also performed, using only participants who had at least70% compliance to the snacks, which would be equivalentto a 2 kg weight gain over the twelve weeks without energycompensation. Stata 11.1 (StataCorp, College Station, Tex,USA) was used for all statistical analyses. All tests wereperformed at the two-sided 0.05 level.
3. Results
Of the 124 participants who were enrolled and rando-mised into the study, four participants were retrospectivelyexcluded on their first visit as their BMI was >30 kg/m2
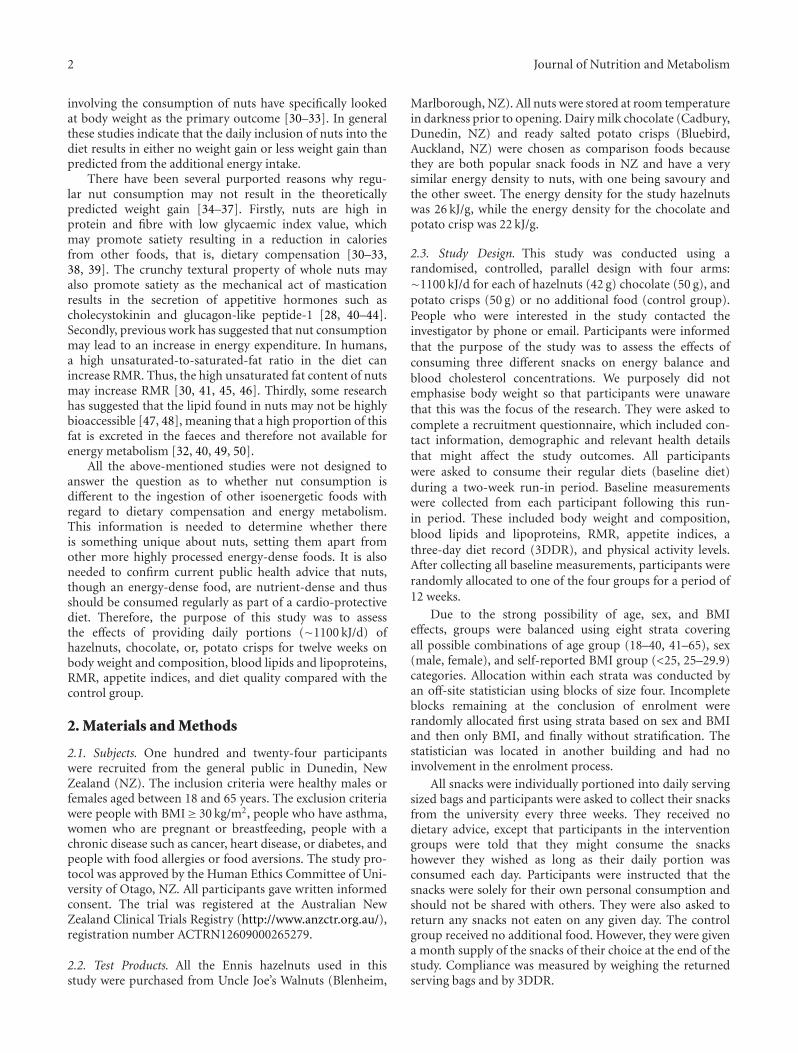
despite their self-reported BMI being <30 kg/m2, one partic-ipant had to undergo surgery, and another one was pregnantand thus both were retrospectively excluded following theirsecond visits. Hence, 118 participants were included in theITT analysis: 32 participants from the hazelnut group, 31from the chocolate group, 29 from the control group, and 26from the potato crisp group. Of these, one participant fromthe chocolate group and one from the potato crisp groupwithdrew from the study due to their dissatisfaction withgroup assignment, three participants were lost to follow-up and consequently dropped out from the study, twoparticipants withdrew from the study due to personal issuesunrelated to the study, and one participant from the hazelnutgroup and two participants from the chocolate group withno previously noted sensitivity to these foods experiencedadverse events after consuming the study snacks and werediscontinued from the study (Figure 1). A similar percentageof participants from each intervention group consumed<70% of study snacks (9% in the hazelnut group, 10% inthe chocolate group, and 8% in the potato crisp group).Using this criterion, 100 participants were included in the PPanalysis.
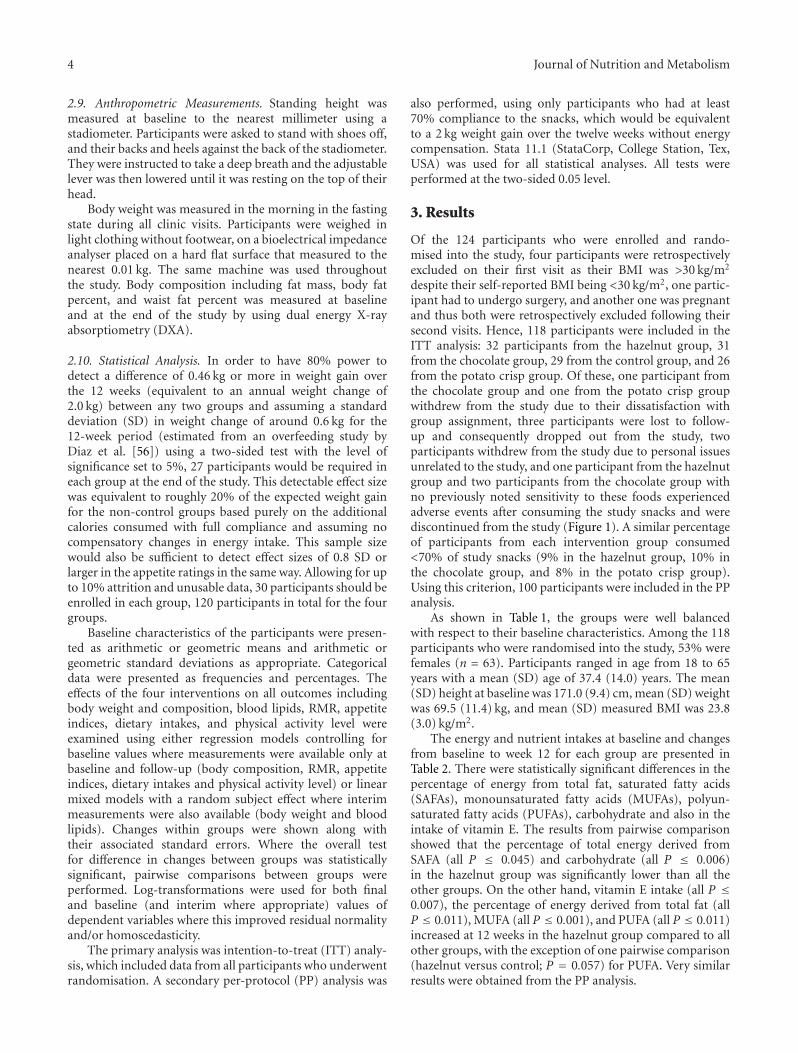
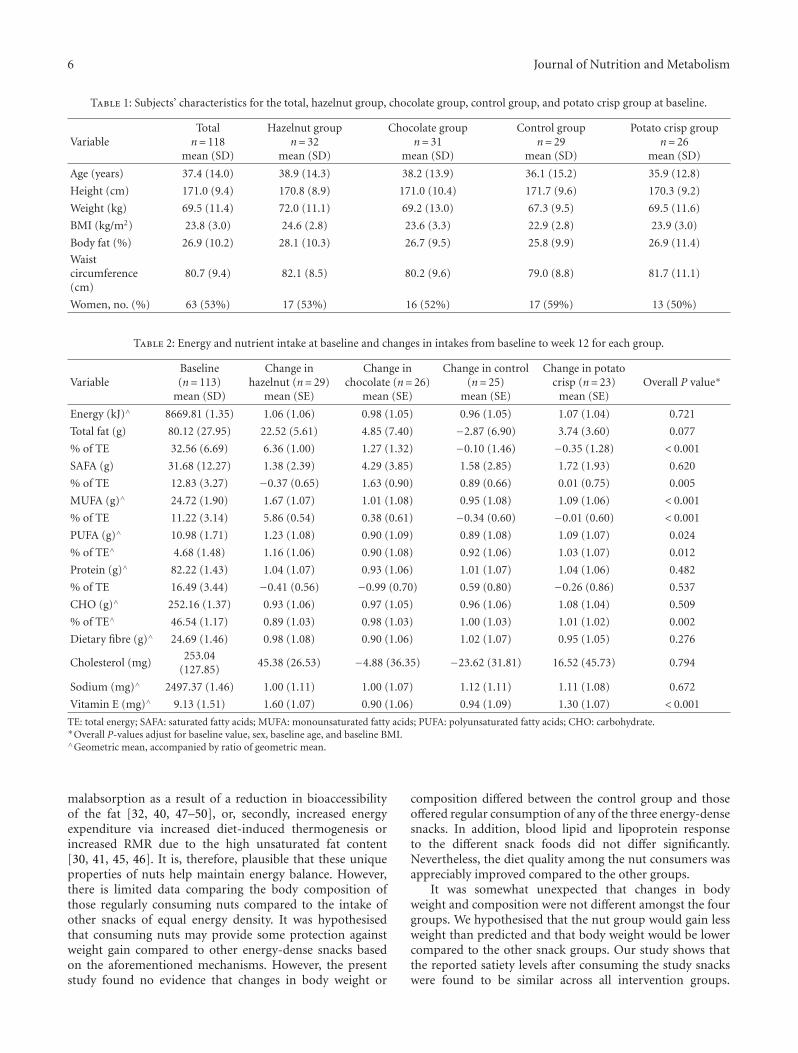
As shown in Table 1, the groups were well balancedwith respect to their baseline characteristics. Among the 118participants who were randomised into the study, 53% werefemales (n = 63). Participants ranged in age from 18 to 65years with a mean (SD) age of 37.4 (14.0) years. The mean(SD) height at baseline was 171.0 (9.4) cm, mean (SD) weightwas 69.5 (11.4) kg, and mean (SD) measured BMI was 23.8(3.0) kg/m2.
The energy and nutrient intakes at baseline and changesfrom baseline to week 12 for each group are presented inTable 2. There were statistically significant differences in thepercentage of energy from total fat, saturated fatty acids(SAFAs), monounsaturated fatty acids (MUFAs), polyun-saturated fatty acids (PUFAs), carbohydrate and also in theintake of vitamin E. The results from pairwise comparisonshowed that the percentage of total energy derived fromSAFA (all P ≤ 0.045) and carbohydrate (all P ≤ 0.006)in the hazelnut group was significantly lower than all theother groups. On the other hand, vitamin E intake (all P ≤0.007), the percentage of energy derived from total fat (allP ≤ 0.011), MUFA (all P ≤ 0.001), and PUFA (all P ≤ 0.011)increased at 12 weeks in the hazelnut group compared to allother groups, with the exception of one pairwise comparison(hazelnut versus control; P = 0.057) for PUFA. Very similarresults were obtained from the PP analysis.

Journal of Nutrition and Metabolism 5
– 2 measured BMI > 30 kg/m2 – 1 measured BMI >30 kg/m2
– 1 underwent surgery
138 assessed for eligibility
15 excluded
124 randomised
32 assigned tohazelnut
33 assigned tochocolate
31 assigned tocontrol
28 assigned topotato crisps
2 excluded 2 excluded 2 excluded
1 adverse event1 withdrew for personal
reasons3 non-compliance
1 disliked diet1 lost to follow up2 adverse events3 non-compliance
1 lost to follow up1 withdrew for personal
reasons
1 disliked diet1 lost to follow up2 non-compliance
32 primary ITT27 secondary PP
31 primary ITT24 secondary PP
29 primary ITT27 secondary PP
26 primary ITT22 secondary PP
– 1 breastfeeding– 4 declined to participate– 4 too busy– 6 reported bmi > 30 kg/m2
– 1 measured BMI > 30 kg/m2
– 1 pregnant
Figure 1: Flowchart of study participants.
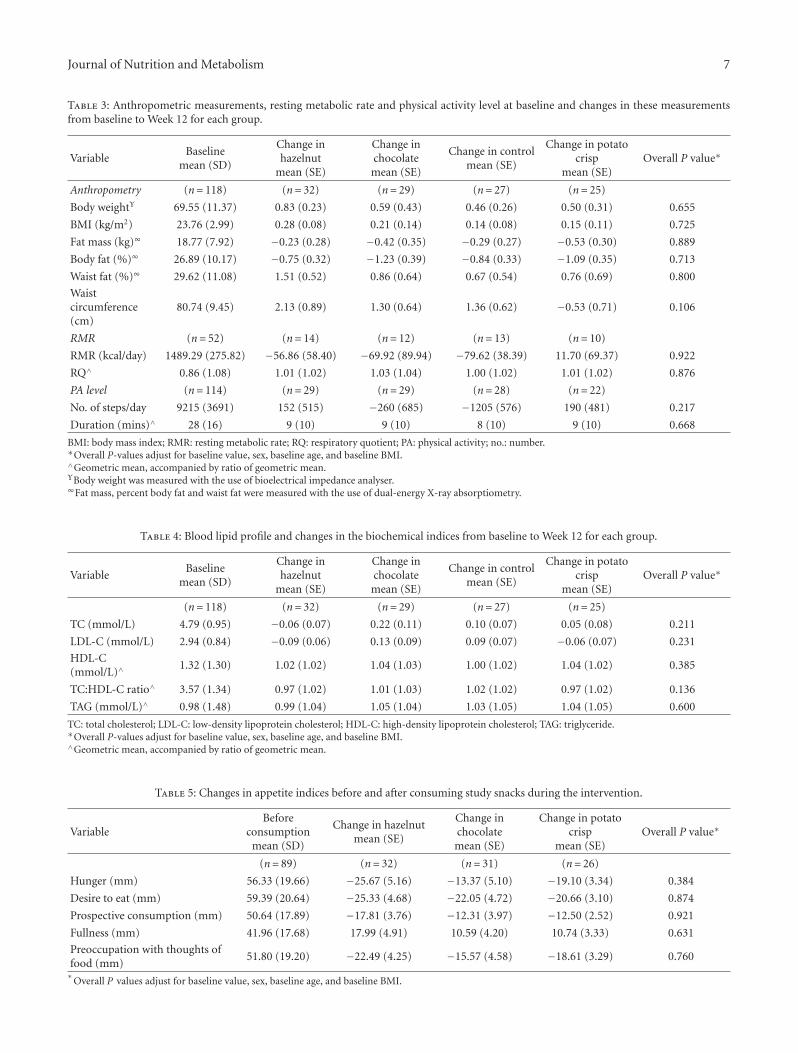
Although there was an apparent decrease in physicalactivity level in the control group, there were no statisticallysignificant differences in the changes of the anthropometricmeasurements, RMR, and physical activity level from base-line to 12 weeks between the groups (all P ≥ 0.106, Table 3).
There was, however, a significant interaction betweengroup and baseline BMI for waist circumference using PPanalysis (P = 0.032). Those with higher BMI reduced theirwaist circumference in the nut group (P = 0.005) and(to a lesser extent) in the potato crisp group (P = 0.032)compared to the control group where the association was inthe opposite direction.
Compared with baseline, the changes in plasma lipidsand lipoproteins at the end of the study did not statisticallysignificantly differ between the groups (all P ≥ 0.136,Table 4).
However, in a PP analysis including only people who had>70% compliance to the study snacks, there was evidenceof a difference in changes in plasma total cholesterol frombaseline to week 12 between the groups (P = 0.035). Plasmatotal cholesterol in the hazelnut group was lower comparedto the chocolate group (P = 0.006), with a tendency for thehazelnut group to be lower than the control (P = 0.057).There was an additional tendency for total cholesterol in the
chocolate group to be higher than the potato crisp group(P = 0.099).
From the ITT analysis, there was no evidence of adifference in changes in the recordings of subjective appetitesensations among the intervention groups (all P ≥ 0.384,Table 5). Overall there was an increase in fullness ratings,decrease in hunger, desire to eat, prospective consumption,and preoccupation with thoughts of food ratings afterconsuming the study snacks. Similar results were obtainedfrom the PP analysis.
4. Discussion
The regular consumption of nuts is recommended inmany national dietary guidelines. One concern with thisrecommendation is that, because nuts are high in fatand thus energy-dense, frequent consumption may lead toweight gain. However, epidemiological studies report thatnut consumers tend to be leaner than those who do notconsume nuts and clinical trials show lower than predictedweight gain from the addition of nuts. The potentialmechanisms can be summarised into two routes [34–37].Firstly, decreased energy intake via increased satiety levelsand food displacements [28, 30–33, 38–44], and energy
6 Journal of Nutrition and Metabolism
Table 1: Subjects’ characteristics for the total, hazelnut group, chocolate group, control group, and potato crisp group at baseline.
VariableTotal
n= 118mean (SD)
Hazelnut groupn= 32
mean (SD)
Chocolate groupn= 31
mean (SD)
Control groupn= 29
mean (SD)
Potato crisp groupn= 26
mean (SD)
Age (years) 37.4 (14.0) 38.9 (14.3) 38.2 (13.9) 36.1 (15.2) 35.9 (12.8)
Height (cm) 171.0 (9.4) 170.8 (8.9) 171.0 (10.4) 171.7 (9.6) 170.3 (9.2)
Weight (kg) 69.5 (11.4) 72.0 (11.1) 69.2 (13.0) 67.3 (9.5) 69.5 (11.6)
BMI (kg/m2) 23.8 (3.0) 24.6 (2.8) 23.6 (3.3) 22.9 (2.8) 23.9 (3.0)
Body fat (%) 26.9 (10.2) 28.1 (10.3) 26.7 (9.5) 25.8 (9.9) 26.9 (11.4)
Waistcircumference(cm)
80.7 (9.4) 82.1 (8.5) 80.2 (9.6) 79.0 (8.8) 81.7 (11.1)
Women, no. (%) 63 (53%) 17 (53%) 16 (52%) 17 (59%) 13 (50%)
Table 2: Energy and nutrient intake at baseline and changes in intakes from baseline to week 12 for each group.
VariableBaseline(n= 113)
mean (SD)
Change inhazelnut (n= 29)
mean (SE)
Change inchocolate (n= 26)
mean (SE)
Change in control(n= 25)
mean (SE)
Change in potatocrisp (n= 23)
mean (SE)Overall P value∗
Energy (kJ)∧ 8669.81 (1.35) 1.06 (1.06) 0.98 (1.05) 0.96 (1.05) 1.07 (1.04) 0.721
Total fat (g) 80.12 (27.95) 22.52 (5.61) 4.85 (7.40) −2.87 (6.90) 3.74 (3.60) 0.077
% of TE 32.56 (6.69) 6.36 (1.00) 1.27 (1.32) −0.10 (1.46) −0.35 (1.28) < 0.001
SAFA (g) 31.68 (12.27) 1.38 (2.39) 4.29 (3.85) 1.58 (2.85) 1.72 (1.93) 0.620
% of TE 12.83 (3.27) −0.37 (0.65) 1.63 (0.90) 0.89 (0.66) 0.01 (0.75) 0.005
MUFA (g)∧ 24.72 (1.90) 1.67 (1.07) 1.01 (1.08) 0.95 (1.08) 1.09 (1.06) < 0.001
% of TE 11.22 (3.14) 5.86 (0.54) 0.38 (0.61) −0.34 (0.60) −0.01 (0.60) < 0.001
PUFA (g)∧ 10.98 (1.71) 1.23 (1.08) 0.90 (1.09) 0.89 (1.08) 1.09 (1.07) 0.024
% of TE∧ 4.68 (1.48) 1.16 (1.06) 0.90 (1.08) 0.92 (1.06) 1.03 (1.07) 0.012
Protein (g)∧ 82.22 (1.43) 1.04 (1.07) 0.93 (1.06) 1.01 (1.07) 1.04 (1.06) 0.482
% of TE 16.49 (3.44) −0.41 (0.56) −0.99 (0.70) 0.59 (0.80) −0.26 (0.86) 0.537
CHO (g)∧ 252.16 (1.37) 0.93 (1.06) 0.97 (1.05) 0.96 (1.06) 1.08 (1.04) 0.509
% of TE∧ 46.54 (1.17) 0.89 (1.03) 0.98 (1.03) 1.00 (1.03) 1.01 (1.02) 0.002
Dietary fibre (g)∧ 24.69 (1.46) 0.98 (1.08) 0.90 (1.06) 1.02 (1.07) 0.95 (1.05) 0.276
Cholesterol (mg)253.04
(127.85)45.38 (26.53) −4.88 (36.35) −23.62 (31.81) 16.52 (45.73) 0.794
Sodium (mg)∧ 2497.37 (1.46) 1.00 (1.11) 1.00 (1.07) 1.12 (1.11) 1.11 (1.08) 0.672
Vitamin E (mg)∧ 9.13 (1.51) 1.60 (1.07) 0.90 (1.06) 0.94 (1.09) 1.30 (1.07) < 0.001
TE: total energy; SAFA: saturated fatty acids; MUFA: monounsaturated fatty acids; PUFA: polyunsaturated fatty acids; CHO: carbohydrate.∗Overall P-values adjust for baseline value, sex, baseline age, and baseline BMI.∧Geometric mean, accompanied by ratio of geometric mean.
malabsorption as a result of a reduction in bioaccessibilityof the fat [32, 40, 47–50], or, secondly, increased energyexpenditure via increased diet-induced thermogenesis orincreased RMR due to the high unsaturated fat content[30, 41, 45, 46]. It is, therefore, plausible that these uniqueproperties of nuts help maintain energy balance. However,there is limited data comparing the body composition ofthose regularly consuming nuts compared to the intake ofother snacks of equal energy density. It was hypothesisedthat consuming nuts may provide some protection againstweight gain compared to other energy-dense snacks basedon the aforementioned mechanisms. However, the presentstudy found no evidence that changes in body weight or
composition differed between the control group and thoseoffered regular consumption of any of the three energy-densesnacks. In addition, blood lipid and lipoprotein responseto the different snack foods did not differ significantly.Nevertheless, the diet quality among the nut consumers wasappreciably improved compared to the other groups.
It was somewhat unexpected that changes in bodyweight and composition were not different amongst the fourgroups. We hypothesised that the nut group would gain lessweight than predicted and that body weight would be lowercompared to the other snack groups. Our study shows thatthe reported satiety levels after consuming the study snackswere found to be similar across all intervention groups.
Journal of Nutrition and Metabolism 7
Table 3: Anthropometric measurements, resting metabolic rate and physical activity level at baseline and changes in these measurementsfrom baseline to Week 12 for each group.
VariableBaseline
mean (SD)
Change inhazelnut
mean (SE)
Change inchocolatemean (SE)
Change in controlmean (SE)
Change in potatocrisp
mean (SE)Overall P value∗
Anthropometry (n= 118) (n= 32) (n= 29) (n= 27) (n= 25)
Body weightΥ 69.55 (11.37) 0.83 (0.23) 0.59 (0.43) 0.46 (0.26) 0.50 (0.31) 0.655
BMI (kg/m2) 23.76 (2.99) 0.28 (0.08) 0.21 (0.14) 0.14 (0.08) 0.15 (0.11) 0.725
Fat mass (kg)∞ 18.77 (7.92) −0.23 (0.28) −0.42 (0.35) −0.29 (0.27) −0.53 (0.30) 0.889
Body fat (%)∞ 26.89 (10.17) −0.75 (0.32) −1.23 (0.39) −0.84 (0.33) −1.09 (0.35) 0.713
Waist fat (%)∞ 29.62 (11.08) 1.51 (0.52) 0.86 (0.64) 0.67 (0.54) 0.76 (0.69) 0.800
Waistcircumference(cm)
80.74 (9.45) 2.13 (0.89) 1.30 (0.64) 1.36 (0.62) −0.53 (0.71) 0.106
RMR (n= 52) (n= 14) (n= 12) (n= 13) (n= 10)
RMR (kcal/day) 1489.29 (275.82) −56.86 (58.40) −69.92 (89.94) −79.62 (38.39) 11.70 (69.37) 0.922
RQ∧ 0.86 (1.08) 1.01 (1.02) 1.03 (1.04) 1.00 (1.02) 1.01 (1.02) 0.876
PA level (n= 114) (n= 29) (n= 29) (n= 28) (n= 22)
No. of steps/day 9215 (3691) 152 (515) −260 (685) −1205 (576) 190 (481) 0.217
Duration (mins)∧ 28 (16) 9 (10) 9 (10) 8 (10) 9 (10) 0.668
BMI: body mass index; RMR: resting metabolic rate; RQ: respiratory quotient; PA: physical activity; no.: number.∗Overall P-values adjust for baseline value, sex, baseline age, and baseline BMI.∧Geometric mean, accompanied by ratio of geometric mean.ΥBody weight was measured with the use of bioelectrical impedance analyser.∞Fat mass, percent body fat and waist fat were measured with the use of dual-energy X-ray absorptiometry.
Table 4: Blood lipid profile and changes in the biochemical indices from baseline to Week 12 for each group.
VariableBaseline
mean (SD)
Change inhazelnut
mean (SE)
Change inchocolatemean (SE)
Change in controlmean (SE)
Change in potatocrisp
mean (SE)Overall P value∗
(n= 118) (n= 32) (n= 29) (n= 27) (n= 25)
TC (mmol/L) 4.79 (0.95) −0.06 (0.07) 0.22 (0.11) 0.10 (0.07) 0.05 (0.08) 0.211
LDL-C (mmol/L) 2.94 (0.84) −0.09 (0.06) 0.13 (0.09) 0.09 (0.07) −0.06 (0.07) 0.231
HDL-C(mmol/L)∧
1.32 (1.30) 1.02 (1.02) 1.04 (1.03) 1.00 (1.02) 1.04 (1.02) 0.385
TC:HDL-C ratio∧ 3.57 (1.34) 0.97 (1.02) 1.01 (1.03) 1.02 (1.02) 0.97 (1.02) 0.136
TAG (mmol/L)∧ 0.98 (1.48) 0.99 (1.04) 1.05 (1.04) 1.03 (1.05) 1.04 (1.05) 0.600
TC: total cholesterol; LDL-C: low-density lipoprotein cholesterol; HDL-C: high-density lipoprotein cholesterol; TAG: triglyceride.∗Overall P-values adjust for baseline value, sex, baseline age, and baseline BMI.∧Geometric mean, accompanied by ratio of geometric mean.
Table 5: Changes in appetite indices before and after consuming study snacks during the intervention.
VariableBefore
consumptionmean (SD)
Change in hazelnutmean (SE)
Change inchocolatemean (SE)
Change in potatocrisp
mean (SE)Overall P value∗
(n= 89) (n= 32) (n= 31) (n= 26)
Hunger (mm) 56.33 (19.66) −25.67 (5.16) −13.37 (5.10) −19.10 (3.34) 0.384
Desire to eat (mm) 59.39 (20.64) −25.33 (4.68) −22.05 (4.72) −20.66 (3.10) 0.874
Prospective consumption (mm) 50.64 (17.89) −17.81 (3.76) −12.31 (3.97) −12.50 (2.52) 0.921
Fullness (mm) 41.96 (17.68) 17.99 (4.91) 10.59 (4.20) 10.74 (3.33) 0.631
Preoccupation with thoughts offood (mm)
51.80 (19.20) −22.49 (4.25) −15.57 (4.58) −18.61 (3.29) 0.760
∗Overall P values adjust for baseline value, sex, baseline age, and baseline BMI.

8 Journal of Nutrition and Metabolism
It appears that participants tended to compensate to a similarextent irrespective of the snack they were provided with,where 61% of the extra energy from the study snacks wasdisplaced by reductions in other foods. This finding is inline with a recent review, which reports that the dietarycompensation accounts for 55–75% of the energy from nuts[35]. No change in physical activity level was observed in theintervention groups throughout the study, and the predictedweight gain given the additional calories provided by thesnacks was 2.8 kg. However, on average actual weight gainwas only 0.64 kg, which equated to 23% of that predictedand did not differ between the snack groups and the controlgroup. This compensatory response has been seen in otherstudies where nuts have been provided as additional foodsand the observed weight gain ranged from 0 to 28% of thepredicted weight gain [30–33].
One recent study comparing the effects of the consump-tion of almonds and cereal bars with the control group onbody weight reported similar results to the current study[57]. The addition of either almonds or cereal bars didnot result in a significant increase in body weight frombaseline indicating a compensatory response for both foods.However, this study had a small sample size (n = 45) andthe energy provided from the almonds (1430 kJ) was signif-icantly higher than that from the cereal bars (950 kJ). Thisdiscrepancy in energy makes comparison difficult but wouldsuggest that compensation was greater in the almond group.
As with our study, research showing some degree ofcompensation has been conducted in non-obese populations[30, 32, 41, 45]. It is speculated that obese individualscompensate differently than their lean counterparts [41, 58,59]. Therefore it would be interesting to repeat this study inan obese population. We note that employing a PP analysis(using 70% compliance as an indicator of adherence tothe dietary advice to eat the snacks) showed that a higherbaseline BMI was associated with a lower waist circumferenceat follow-up in the nut group compared to the control group(P = 0.005) and to a lesser extent in the potato crisp groupcompared to the control group (P = 0.034). Given this,dietary compensation in response to nuts and possibly potatocrisps may be more pronounced in overweight individualscompared to those who are of normal weight. However, thisresult was only marginally statistically significant and shouldbe interpreted with caution unless it can be replicated inother studies.
One purported mechanism whereby nuts may providea beneficial effect on energy regulation is via an increase inenergy expenditure. A previous review suggested this mayaccount for approximately 10% of the energy contributedby nuts [36]. In the present study, RMR was measured in asubsample (n = 52) and there was no evidence of a differencein RMR between any of the snack groups. Previous researchis somewhat mixed. Three studies showed that there was asignificant increase in RMR following 2–19 weeks of peanutconsumption in lean [30, 45] and overweight participants[41]. In contrast, daily almond supplementation for tenweeks [32] and six months [31] failed to show any changesin RMR or respiratory quotient. It is unclear whether theincrement in RMR is specific to peanut consumption only.
Given the inconsistencies among studies, this is an arearequiring further research.
Another explanation provided by some researchers forthe less than predicted weight gain when consuming nutsinvolves the reduction in the bioaccessibility of the lipidin nuts. A recent review estimates 10–15% of the energycontributed by nuts is offset by faecal loss [36]. Similarresults were obtained in the first and only trial specificallydesigned to investigate this effect, whereby 5% of dietaryfat was excreted in the whole peanut group (70 g/d), whichcould potentially offset around 9-10% of the energy providedby nuts [50]. However, recent studies reported that therewere no statistically significant differences in body weightafter consuming three different forms of hazelnuts (30 g/d)[25] and five different forms of peanuts (56 g/d) [22] for fourweeks each, suggesting that the bioaccessibility of lipids wassimilar for all forms of nuts. Thus, the potential differencein bioaccessibility for the amount of nuts (42 g) provided inthe present study may be too small to significantly influencebody weight.
Changes in blood lipid and lipoprotein concentrationsdid not differ between the four groups. Most previousliterature suggests that regular nut consumption in hyperc-holesterolemic individuals results in significant reductions inTC and LDL-C [21, 25, 60–64] with some showing increasesin HDL-C [25, 62, 63] whilst others do not [21, 60, 61, 64].It is likely that we did not observe an improvement inblood lipoproteins with regular nut consumption due tothe low baseline TC (4.8 mmol/L) and LDL-C (2.9 mmol/L)and relatively high HDL-C (1.3 mmol/L) concentrations ofthis study population. Recent studies have shown that themagnitude in the reduction in TC and LDL-C followingregular nut consumption was dependent on the baselineconcentrations [11, 22, 65, 66]. Using PP analysis, plasma TCwas significantly lower in the hazelnut group compared tothe chocolate group (P = 0.006), with a tendency to be lowerwhen compared to the control (P = 0.057). In addition, therewas a tendency for the chocolate group to have higher TCthan the potato crisp group (P = 0.099). This would indicatethat among those actually following the advice to consumethe different snacks, nuts show a more favourable effect onblood lipids. The cholesterol-lowering properties of nuts arelargely due to their unsaturated fat content, but also due toother bioactive compounds such as phytosterols [1–5].
One important finding of this study is that the regularconsumption of nuts improved diet quality compared tothe consumption of other energy-dense snacks. This wasparticularly evident for dietary fat. The percent of energyderived from SAFA was significantly lower while the energyfrom MUFA and PUFA was significantly raised in the nutgroup compared to all the other groups. In addition, theintake of vitamin E during the intervention was significantlyraised in the nut group compared to the other groups. Thesedietary changes support the findings of other studies, whichhave observed improvements in diet quality with the simpleaddition of nuts without any further healthy eating advice[2, 19, 38, 67]. Such changes would be expected to reducethe risk of chronic disease, in particular, CVD. A recentstudy has shown that substituting one unhealthy snack such
Journal of Nutrition and Metabolism 9
as crisps and chocolate bars with one healthy snack suchas unsalted nuts or seeds per day has a positive impacton nutrient density and could prevent approximately 6000cardiovascular deaths every year in the UK [68].
5. Conclusions
Although nuts provided no additional benefits compared toisocaloric quantities of other energy-dense snacks in terms ofbody weight and composition, blood lipids and lipoproteinsin this group of non-obese, normocholesterolaemic individ-uals, diet quality was substantially enhanced in the nut group.This study supports the findings of other studies, whichsuggest that nuts can be incorporated into the diet withoutthe risk of adverse weight gain and can improve diet quality.
Authors’ Contribution
The authors’ responsibilities were as follows S. L. Tey: studycoordinator, designing the study, collecting, entering andanalyzing the data, disseminating findings, and preparing thepaper; R. Brown: study design, supervision of data collecting,data analysis, preparing the paper; A. Gray: assistance withstudy design, statistical analysis, editing of the paper; A.Chisholm: study design, supervision of data collection,editing of the paper; C. Delahunty: assistance with studydesign, editing of the paper.
Conflict of Interests
None of the authors had any personal or financial conflict ofinterests.
Acknowledgments
The funding for the present study was provided by aUniversity of Otago Research Grant. The authors wouldlike to thank the participants for their commitment andenthusiasm in participating in this study.
References
[1] B. W. Bolling, D. L. McKay, and J. B. Blumberg, “Thephytochemical composition and antioxidant actions of treenuts,” Asia Pacific Journal of Clinical Nutrition, vol. 19, no. 1,pp. 117–123, 2010.
[2] J. C. King, J. Blumberg, L. Ingwersen, M. Jenab, and K. L.Tucker, “Tree nuts and peanuts as components of a healthydiet,” Journal of Nutrition, vol. 138, no. 9, pp. 1736S–1740S,2008.
[3] P. M. Kris-Etherton, S. Yu-Poth, J. Sabate, H. E. Ratcliffe,G. Zhao, and T. D. Etherton, “Nuts and their bioactiveconstituents: effects on serum lipids and other factors thataffect disease risk,” American Journal of Clinical Nutrition, vol.70, no. 3, pp. 504S–511S, 1999.
[4] S. K. Sathe, E. K. Monaghan, H. H. Kshirsagar, and M. Venkat-achalam, “Chemical composition of edible nut seeds and itsimplications in human health,” in Tree Nuts: Composition,Phytochemicals, and Health Effects, C. Alasalvar and F. Shahidi,Eds., pp. 12–36, Taylor & Francis Group, Florida, USA, 2008.
[5] R. Segura, C. Javierre, M. A. Lizarraga, and E. Ros, “Other rel-evant components of nuts: phytosterols, folate and minerals,”British Journal of Nutrition, vol. 96, no. 2, pp. S36–S44, 2006.
[6] K. Alexiadou and N. Katsilambros, “Nuts: anti-atherogenicfood?” European Journal of Internal Medicine, vol. 22, no. 2,pp. 141–146, 2011.
[7] D. K. Banel and F. B. Hu, “Effects of walnut consumptionon blood lipids and other cardiovascular risk factors: a meta-analysis and systematic review,” American Journal of ClinicalNutrition, vol. 90, no. 1, pp. 56–63, 2009.
[8] P. M. Kris-Etherton, F. B. Hu, E. Ros, and J. Sabate, “The roleof tree nuts and peanuts in the prevention of coronary heartdisease: multiple potential mechanisms,” Journal of Nutrition,vol. 138, no. 9, pp. 1746S–1751S, 2008.
[9] O. J. Phung, S. S. Makanji, C. M. White, and C. I. Coleman,“Almonds have a neutral effect on serum lipid profiles: a meta-analysis of randomized trials,” Journal of the American DieteticAssociation, vol. 109, no. 5, pp. 865–873, 2009.
[10] E. Ros, “Nuts and novel biomarkers of cardiovascular disease,”American Journal of Clinical Nutrition, vol. 89, no. 5, pp.1649S–1656S, 2009.
[11] J. Sabate, K. Oda, and E. Ros, “Nut consumption and bloodlipid levels: a pooled analysis of 25 intervention trials,” Archivesof Internal Medicine, vol. 170, no. 9, pp. 821–827, 2010.
[12] J. A. Mendoza, A. Drewnowski, A. Cheadle, and D. A.Christakis, “Dietary energy density is associated with selectedpredictors of obesity in U.S. children,” Journal of Nutrition, vol.136, no. 5, pp. 1318–1322, 2006.
[13] R. J. Stubbs, C. G. Harbron, and A. M. Prentice, “Covertmanipulation of the dietary fat to carbohydrate ratio ofisoenergetically dense diets: effect on food intake in feedingmen ad libitum,” International Journal of Obesity and RelatedMetabolic Disorders, vol. 20, no. 7, pp. 651–660, 1996.
[14] Y. Webb and W. Dear, “Slimmers’ knowledge, beliefs andpractices about fat, cholesterol and egg intake,” Food Australia,vol. 48, no. 8, pp. 375–378, 1996.
[15] M. Bes-Rastrollo, J. Sabate, E. Gomez-Gracia, A. Alonso, J. A.Martinez, and M. A. Martinez-Gonzalez, “Nut consumptionand weight gain in a mediterranean cohort: the SUN study,”Obesity, vol. 15, no. 1, pp. 107–116, 2007.
[16] M. Bes-Rastrollo, N. M. Wedick, M. A. Martinez-Gonzalez, T.Y. Li, L. Sampson, and F. B. Hu, “Prospective study of nutconsumption, long-term weight change, and obesity risk inwomen,” American Journal of Clinical Nutrition, vol. 89, no.6, pp. 1913–1919, 2009.
[17] P. Casas-Agustench, M. Bullo, E. Ros, J. Basora, and J. Salas-Salvado, “Cross-sectional association of nut intake with adi-posity in a Mediterranean population,” Nutrition, Metabolismand Cardiovascular Diseases, vol. 21, no. 7, pp. 518–525, 2011.
[18] G. E. Fraser, J. Sabate, W. L. Beeson, and T. M. Strahan,“A possible protective effect of nut consumption on risk ofcoronary heart disease: the adventist health study,” Archives ofInternal Medicine, vol. 152, no. 7, pp. 1416–1424, 1992.
[19] A. E. Griel, B. Eissenstat, V. Juturu, G. Hsieh, and P. M. Kris-Etherton, “Improved diet quality with peanut consumption,”Journal of the American College of Nutrition, vol. 23, no. 6, pp.660–668, 2004.
[20] P. Casas-Agustench, P. Lopez-Uriarte, M. Bullo, E. Ros, J. J.Cabre-Vila, and J. Salas-Salvado, “Effects of one serving ofmixed nuts on serum lipids, insulin resistance and inflam-matory markers in patients with the metabolic syndrome,”Nutrition, Metabolism and Cardiovascular Diseases, vol. 21, no.2, pp. 126–135, 2009.
10 Journal of Nutrition and Metabolism
[21] A. E. Griel, Y. Cao, D. D. Bagshaw, A. M. Cifelli, B. Holub,and P. M. Kris-Etherton, “A macadamia nut-rich diet reducestotal and LDL-cholesterol in mildly hypercholesterolemic menand women,” Journal of Nutrition, vol. 138, no. 4, pp. 761–767,2008.
[22] F. McKiernan, P. Lokko, A. Kuevi et al., “Effects of peanutprocessing on body weight and fasting plasma lipids,” BritishJournal of Nutrition, vol. 104, no. 3, pp. 418–426, 2010.
[23] S. Rajaram, K. Burke, B. Connell, T. Myint, and J. Sabate, “Amonounsaturated fatty acid-rich pecan-enriched diet favor-ably alters the serum lipid profile of healthy men and women,”Journal of Nutrition, vol. 131, no. 9, pp. 2275–2279, 2001.
[24] I. Sari, Y. Baltaci, C. Bagci et al., “Effect of pistachio dieton lipid parameters, endothelial function, inflammation, andoxidative status: a prospective study,” Nutrition, vol. 26, no. 4,pp. 399–404, 2010.
[25] S. L. Tey, R. C. Brown, A. W. Chisholm, C. M. Delahunty,A. R. Gray, and S. M. Williams, “Effects of different forms ofhazelnuts on blood lipids and α-tocopherol concentrations inmildly hypercholesterolemic individuals,” European Journal ofClinical Nutrition, vol. 65, no. 1, pp. 117–124, 2011.
[26] K. McManus, L. Antinoro, and F. Sacks, “A randomizedcontrolled trial of a moderate-fat, low-energy diet comparedwith a low fat, low-energy diet for weight loss in overweightadults,” International Journal of Obesity and Related MetabolicDisorders, vol. 25, no. 10, pp. 1503–1511, 2001.
[27] C. L. Pelkman, V. K. Fishell, D. H. Maddox, T. A. Pearson,D. T. Mauger, and P. M. Kris-Etherton, “Effects of moderate-fat (from monounsaturated fat) and low-fat weight-loss dietson the serum lipid profile in overweight and obese men andwomen,” American Journal of Clinical Nutrition, vol. 79, no. 2,pp. 204–212, 2004.
[28] M. A. Wien, J. M. Sabate, D. N. Ikle, S. E. Cole, and F.R. Kandeel, “Almonds vs complex carbohydrates in a weightreduction program,” International Journal of Obesity andRelated Metabolic Disorders, vol. 27, no. 11, pp. 1365–1372,2006.
[29] Z. Li, R. Song, C. Nguyen et al., “Pistachio nuts reducetriglycerides and body weight by comparison to refinedcarbohydrate snack in obese subjects on a 12-week weight lossprogram,” Journal of the American College of Nutrition, vol. 29,no. 3, pp. 198–203, 2010.
[30] C. M. Alper and R. D. Mattes, “Effects of chronic peanutconsumption on energy balance and hedonics,” InternationalJournal of Obesity and Related Metabolic Disorders, vol. 26, no.8, pp. 1129–1137, 2002.
[31] G. E. Fraser, H. W. Bennett, K. B. Jaceldo, and J. Sabate,“Effect on body weight of a free 76 kilojoule (320 calorie)daily supplement of almonds for six months,” Journal of theAmerican College of Nutrition, vol. 21, no. 3, pp. 275–283,2002.
[32] J. Hollis and R. Mattes, “Effect of chronic consumption ofalmonds on body weight in healthy humans,” British Journalof Nutrition, vol. 98, no. 3, pp. 651–656, 2007.
[33] J. Sabate, Z. Cordero-MacIntyre, G. Siapco, S. Torabian, andE. Haddad, “Does regular walnut consumption lead to weightgain?” British Journal of Nutrition, vol. 94, no. 5, pp. 859–864,2005.
[34] M. A. Martinez-Gonzalez and M. Bes-Rastrollo, “Nut con-sumption, weight gain and obesity: epidemiological evidence,”Nutrition, Metabolism and Cardiovascular Diseases, vol. 21, 1,pp. S40–S45, 2011.
[35] R. D. Mattes and M. L. Dreher, “Nuts and healthy body weightmaintenance mechanisms,” Asia Pacific Journal of ClinicalNutrition, vol. 19, no. 1, pp. 137–141, 2010.
[36] R. D. Mattes, P. M. Kris-Etherton, and G. D. Foster, “Impactof peanuts and tree nuts on body weight and healthy weightloss in adults,” Journal of Nutrition, vol. 138, no. 9, pp. 1741S–1745S, 2008.
[37] S. Rajaram and J. Sabate, “Nuts, body weight and insulinresistance,” British Journal of Nutrition, vol. 96, 2, pp. S79–S86,2006.
[38] K. Jaceldo-Siegl, J. Sabate, S. Rajaram, and G. E. Fraser,“Long-term, almond supplementation without advice on foodreplacement induces favourable nutrient modifications to thehabitual diets of free-living individuals,” British Journal ofNutrition, vol. 92, no. 3, pp. 533–540, 2004.
[39] S. V. Kirkmeyer and R. D. Mattes, “Effects of food attributeson hunger and food intake,” International Journal of Obesityand Related Metabolic Disorders, vol. 24, no. 9, pp. 1167–1175,2000.
[40] B. A. Cassady, J. H. Hollis, A. D. Fulford, R. V. Considine,and R. D. Mattes, “Mastication of almonds: effects of lipidbioaccessibility, appetite, and hormone response,” AmericanJournal of Clinical Nutrition, vol. 89, no. 3, pp. 794–800, 2009.
[41] S. B. Coelho, R. L. de Sales, S. S. Iyer et al., “Effects of peanut oilload on energy expenditure, body composition, lipid profile,and appetite in lean and overweight adults,” Nutrition, vol. 22,no. 6, pp. 585–592, 2006.
[42] J. M. Frecka, J. H. Hollis, and R. D. Mattes, “Effects of appetite,BMI, food form and flavor on mastication: almonds as a testfood,” European Journal of Clinical Nutrition, vol. 62, no. 10,pp. 1231–1238, 2008.
[43] S. S. Iyer, L. A. Boateng, R. L. Sales et al., “Effects of peanutoil consumption on appetite and food choice,” InternationalJournal of Obesity, vol. 30, no. 4, pp. 704–710, 2006.
[44] F. McKiernan and R. D. Mattes, “Effects of peanut processingon masticatory performance during variable appetitive states,”Journal of Nutrition and Metabolism, vol. 2010, Article ID487301, 6 pages, 2010.
[45] A. L. Claesson, G. Holm, A. Ernersson, T. Lindstrom, andF. H. Nystrom, “Two weeks of overfeeding with candy,but not peanuts, increases insulin levels and body weight,”Scandinavian Journal of Clinical & Laboratory Investigation,vol. 69, no. 5, pp. 598–605, 2009.
[46] P. J. H. Jones, J. E. Ridgen, P. T. Phang, and C. L. Birmingham,“Influence of dietary fat polyunsaturated to saturated ratio onenergy substrate utilization in obesity,” Metabolism, vol. 41,no. 4, pp. 396–401, 1992.
[47] S. E. E. Berry, E. A. Tydeman, H. B. Lewis et al., “Manipulationof lipid bioaccessibility of almond seeds influences postpran-dial lipemia in healthy human subjects,” American Journal ofClinical Nutrition, vol. 88, no. 4, pp. 922–929, 2008.
[48] G. Mandalari, R. M. Faulks, G. T. Rich et al., “Release ofprotein, lipid, and vitamin E from almond seeds duringdigestion,” Journal of Agricultural and Food Chemistry, vol. 56,no. 9, pp. 3409–3416, 2008.
[49] P. R. Ellis, C. W. C. Kendall, Y. Ren et al., “Role of cell wallsin the bioaccessibility of lipids in almond seeds,” AmericanJournal of Clinical Nutrition, vol. 80, no. 3, pp. 604–613, 2004.
[50] C. J. Traoret, P. Lokko, A. C. R. F. Cruz et al., “Peanut digestionand energy balance,” International Journal of Obesity, vol. 32,no. 2, pp. 322–328, 2008.
[51] R. Marshall, Diet Entry and Storage, Diet Cruncher. In ABatch Processing Diet Analysis System for the PC. Dunedin,Nutricomp, 2003.

Journal of Nutrition and Metabolism 11
[52] New Zealand Institute for Crop and Food Research, FOOD-files. Datafiles of the New Zealand Food Composition Database,New Zealand Institute for Crop and Food Research, Palmer-ston North, New Zealand, 2006.
[53] L. S. Piers, S. N. Diggavi, J. Rijskamp, J. M. A. Van Raaij, P.S. Shetty, and J. G. A. J. Hautvast, “Resting metabolic rate andthermic effect of a meal in the follicular and luteal phases of themenstrual cycle in well-nourished Indian women,” AmericanJournal of Clinical Nutrition, vol. 61, no. 2, pp. 296–302, 1995.
[54] G. Assmann, H. Schriewer, G. Schmitz, and E. O. Hagele,“Quantification of high-density-lipoprotein cholesterol byprecipitation with phosphotungstic acid/MgCl2,” ClinicalChemistry, vol. 29, no. 12, pp. 2026–2030, 1983.
[55] W. T. Friedewald, R. I. Levy, and D. S. Fredrickson, “Estima-tion of the concentration of low-density lipoprotein choles-terol in plasma, without use of the preparative ultracen-trifuge,” Clinical Chemistry, vol. 18, no. 6, pp. 499–502, 1972.
[56] E. O. Diaz, A. M. Prentice, G. R. Goldberg, P. R. Murgatroyd,and W. A. Coward, “Metabolic response to experimental over-feeding in lean and overweight healthy volunteers,” AmericanJournal of Clinical Nutrition, vol. 56, no. 4, pp. 641–655, 1992.
[57] S. Zaveri and S. Drummond, “The effect of including aconventional snack (cereal bar) and a nonconventional snack(almonds) on hunger, eating frequency, dietary intake andbody weight,” Journal of Human Nutrition and Dietetics, vol.22, no. 5, pp. 461–468, 2009.
[58] D. M. Mourao, J. Bressan, W. W. Campbell, and R. D. Mattes,“Effects of food form on appetite and energy intake in lean andobese young adults,” International Journal of Obesity, vol. 31,no. 11, pp. 1688–1695, 2007.
[59] B. Rolls, J. Ello-Martin, and J. Ledikwe, “Portion size and foodintake,” in Food, Diet and Obesity, D. J. Mela, Ed., pp. 160–176,Woodhead Publishing Limited, Cambridge, UK, 2005.
[60] A. Chisholm, K. McAuley, J. Mann, S. Williams, and M. Skeaff,“Cholesterol lowering effects of nuts compared with a Canolaoil enriched cereal of similar fat composition,” Nutrition,Metabolism and Cardiovascular Diseases, vol. 15, no. 4, pp.284–292, 2005.
[61] S. K. Gebauer, S. G. West, C. D. Kay, P. Alaupovic, D.Bagshaw, and P. M. Kris-Etherton, “Effects of pistachios oncardiovascular disease risk factors and potential mechanismsof action: a dose-response study,” American Journal of ClinicalNutrition, vol. 88, no. 3, pp. 651–659, 2008.
[62] D. J. A. Jenkins, C. W. C. Kendall, A. Marchie et al.,“Dose response of almonds on coronary heart diseaserisk factors: blood lipids, oxidized low-density lipoproteins,lipoprotein(a), homocysteine, and pulmonary nitric oxide: arandomized, controlled, crossover trial,” Circulation, vol. 106,no. 11, pp. 1327–1332, 2002.
[63] M. J. Sheridan, J. N. Cooper, M. Erario, and C. E. Cheifetz,“Pistachio nut consumption and serum lipid levels,” Journal ofthe American College of Nutrition, vol. 26, no. 2, pp. 141–148,2007.
[64] G. A. Spiller, A. Miller, K. Olivera et al., “Effects of plant-baseddiets high in raw or roasted almonds, or roasted almond butteron serum lipoproteins in humans,” Journal of the AmericanCollege of Nutrition, vol. 22, no. 3, pp. 195–200, 2003.
[65] S. Rajaram, E. H. Haddad, A. Mejia, and J. Sabate, “Walnutsand fatty fish influence different serum lipid fractions innormal to mildly hyperlipidemic individuals: a randomizedcontrolled study,” American Journal of Clinical Nutrition, vol.89, no. 5, pp. 1657S–1663S, 2009.
[66] S. Torabian, E. Haddad, Z. Cordero-Macintyre, J. Tanzman,M. L. Fernandez, and J. Sabate, “Long-term walnut supple-mentation without dietary advice induces favorable serumlipid changes in free-living individuals,” European Journal ofClinical Nutrition, vol. 64, no. 3, pp. 274–279, 2010.
[67] C. E. O’Neil, D. R. Keast, V. L. Fulgoni, and T. A. Nicklas,“Tree nut consumption improves nutrient intake and dietquality in US adults: an analysis of National Health andNutrition Examination Survey (NHANES) 1999–2004,” AsiaPacific Journal of Clinical Nutrition, vol. 19, no. 1, pp. 142–150,2010.
[68] F. Lloyd-Williams, M. Mwatsama, R. Ireland, and S. Capewell,“Small changes in snacking behaviour: the potential impacton CVD mortality,” Public Health Nutrition, vol. 12, no. 6, pp.871–876, 2009.

Submit your manuscripts athttp://www.hindawi.com
Stem CellsInternational
Hindawi Publishing Corporationhttp://www.hindawi.com Volume 2014
Hindawi Publishing Corporationhttp://www.hindawi.com Volume 2014
MEDIATORSINFLAMMATION
of
Hindawi Publishing Corporationhttp://www.hindawi.com Volume 2014
Behavioural Neurology
EndocrinologyInternational Journal of
Hindawi Publishing Corporationhttp://www.hindawi.com Volume 2014
Hindawi Publishing Corporationhttp://www.hindawi.com Volume 2014
Disease Markers
Hindawi Publishing Corporationhttp://www.hindawi.com Volume 2014
BioMed Research International
OncologyJournal of
Hindawi Publishing Corporationhttp://www.hindawi.com Volume 2014
Hindawi Publishing Corporationhttp://www.hindawi.com Volume 2014
Oxidative Medicine and Cellular Longevity
Hindawi Publishing Corporationhttp://www.hindawi.com Volume 2014
PPAR Research
The Scientific World JournalHindawi Publishing Corporation http://www.hindawi.com Volume 2014
Immunology ResearchHindawi Publishing Corporationhttp://www.hindawi.com Volume 2014
Journal of
ObesityJournal of
Hindawi Publishing Corporationhttp://www.hindawi.com Volume 2014
Hindawi Publishing Corporationhttp://www.hindawi.com Volume 2014
Computational and Mathematical Methods in Medicine
OphthalmologyJournal of
Hindawi Publishing Corporationhttp://www.hindawi.com Volume 2014
Diabetes ResearchJournal of
Hindawi Publishing Corporationhttp://www.hindawi.com Volume 2014
Hindawi Publishing Corporationhttp://www.hindawi.com Volume 2014
Research and TreatmentAIDS
Hindawi Publishing Corporationhttp://www.hindawi.com Volume 2014
Gastroenterology Research and Practice
Hindawi Publishing Corporationhttp://www.hindawi.com Volume 2014
Parkinson’s Disease
Evidence-Based Complementary and Alternative Medicine
Volume 2014Hindawi Publishing Corporationhttp://www.hindawi.com