nyc syndromic surveillance ifh hit meaningful use workshop 10/1/2010 marlena plagianos, ms nycdohmh...
TRANSCRIPT

NYC Syndromic Surveillance
IFH HIT Meaningful Use Workshop10/1/2010
Marlena Plagianos, MSNYCDOHMH

2
What is Biosurveillance?
• “Collection and integration of timely health-related information for public health action achieved through the early detection, characterization, and situation awareness of exposures and acute human health events of public health significance.”
Aaron T Fleischauer, PhD; Pamela S Diaz, MD; Daniel M Sosin MD . Biosurveillance:
A Definition, Scope and Description of Current Capability for a National Strategy.
Advances in Disease Surveillance 2008;5:175

3
Traditional Surveillance
• Case definitions• Historically low
compliance• Laboratory
confirmation can be slow
• Still important (e.g. H1N1 in NYC)

4
Laboratory Confirmation
•Making firm diagnosis commonly relies on lab result•Limited in-house testing in outpatient setting (minutes)•Commercial laboratory testing takes time (days-weeks)

5
Traditional Reporting is Labor Intensive

6
Traditional Reporting is Labor Intensive

7
Syndromic Surveillance
• Pre-diagnostic indicators of disease• Readiness scenarios: bioterrorism,
pandemics• Objectives:
– Timely, sensitive, specific surveillance– Detect outbreak before ‘astute clinician’
• Typical Process
Collect data
Process & code data
Establish baseline
Identify outbreak
Sound alarm

8
New and Exciting Data Types
Data source Level of data
Data type Setting Care phase
Medication sales Aggregate Drug category Pre-clinical Pre-diagnostic
School absences Aggregate Frequency Pre-clinical Pre-diagnostic
Nurse hotline call Individual Call type Pre-clinical Pre-diagnostic
Chief complaint / Reason for Visit
Individual Text, brief Clinical Pre-diagnostic
EMS call Individual Run type Clinical Pre-diagnostic
Temperature Individual Vital sign Clinical Pre-diagnostic
Radiology Report Individual Text, narrative Clinical Pre-diagnostic
Chest X-ray Individual CPT code Clinical Pre-diagnostic
Diagnosis code Individual ICD9 code Clinical Diagnostic
Progress Note Individual Text, narrative Clinical Diagnosis

9
EHR Syndromic Surveillance
• The Primary Care Information Project (PCIP) uses different EHR data sources to conduct & pilot its syndromic surveillance activities
• Some syndromes tracked using EHR data are:– Influenza-like Illness (ILI)– Fever– Gastrointestinal Illness (GI)
• Case definitions for these syndromes based upon text in these structured fields:– Chief Complaint– Measured Temperature– Diagnosis (ICD-9 CM Code)

10
System Screenshot

11
Aggregate Level Syndromic Data
• Only “Count” Data is collected

12
Data processing and syndrome coding
Respiratory conditions
%Macro Resp; *Respiratory; IF CC=:'COUGH' OR CC=:'COUGHING' OR CC=:'SOB' OR CC=:'DIFFICULTY BREATHING' OR CC='BREATHING PROBLEMS' OR CC=:'SHORTNESS OF BREA' OR CC=:'DIFF BREA' CC='URI' ORTHEN RESP=1; ELSE DO; RESP=
Misspelling INDEX(CC,"COUG") + INDEX(CC,"COUH") +Shortness of breath
INDEX(CC,"S.O.B") + INDEX(CC,"SOB") + INDEX(CC,"S O B") + INDEX(CC,"S O B") + INDEX(CC,"S.OB");
Difficulty breathing
INDEX(CC,"BREAT") + INDEX(CC,"BEATH") + INDEX(CC,"DIB") + INDEX(CC,"D I B") + INDEX(CC,"D.I.B") + INDEX(CC,"BRATHING") + INDEX(CC,"DIFF BR") + INDEX(CC,"DIFF, BR") +
Upper respiratory infection
INDEX(CC,"URI ") + INDEX(CC,"URI/") + INDEX(CC,"URI;") + INDEX(CC,"U R I") + INDEX(CC,"URI,") + INDEX(CC,"U.R.I") +

13
Analysis:Calculate Baseline
Expected disease level
• Approaches: Moving average, regression, time series methods.• Length of baseline: Years, months, days
Adjustments
• Long: Seasonal, secular, environmental (e.g. heat, pollen)• Short: Day of week, weekend/weekday, holidays, reporting failures
14
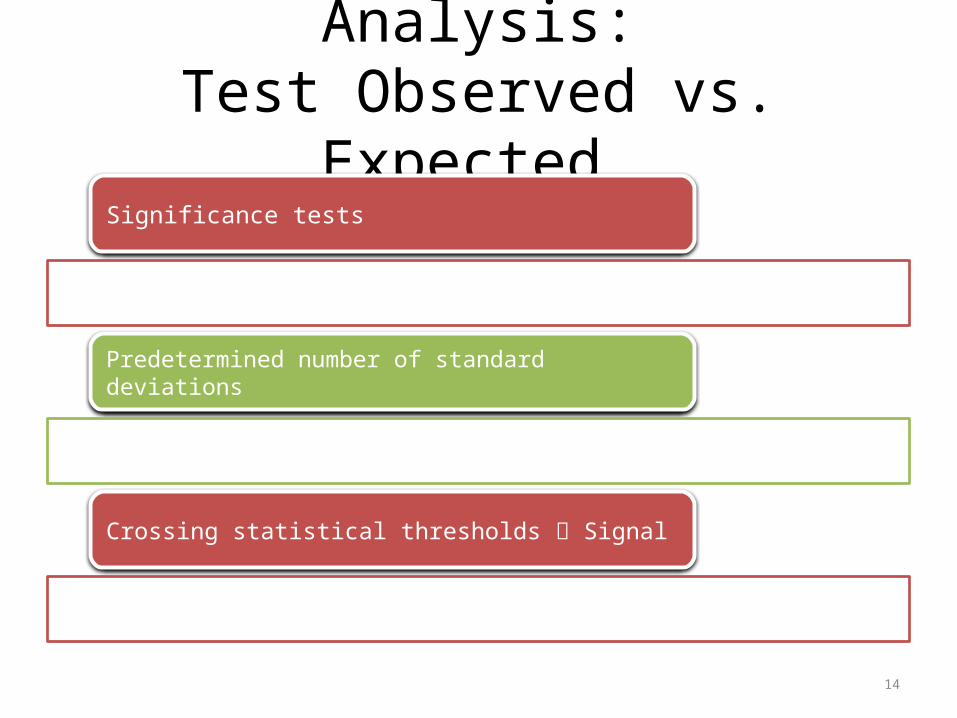
Analysis:Test Observed vs. Expected
Significance tests
Predetermined number of standard deviations
Crossing statistical thresholds Signal

15
Analysis:Test Observed vs. Expected

Electronic Health Record Syndromic SurveillanceDuring 2009 Pandemic
H1N1 in NYC

18
Friday

19
Saturday

20
Sunday

21
Monday

22
Tuesday

23
Wednesday

24
Thursday

25
Friday

26
Saturday

27
Sunday

28
Monday – Memorial Day

29
Tuesday

H1N1 in New York City:
Where did patients seek treatment?
Emergency Departments or
Primary Care Clinics?

31
Objective
• To determine whether the timing of the increase in patient visits was different at emergency departments from primary care clinics during the spring 2009 H1N1 influenza outbreak across the 5 boroughs of NYC

32
Study Sites
l 58 Primary Care Providers (PCP): – 9 Institute for Family
Health (IFH) clinics– 49 practices enrolled
in the NYCDOHMH PCIP (30 visits/day)
v 50 Emergency Departments– 247 visits/day

33
Methods
• Influenza-like Illness (ILI) as a broad estimate of H1N1
• Fever + respiratory related reason for visit or diagnosisPCP
• Chief complaint of fever + a sore throat or cough, or a chief complaint of fluED
34
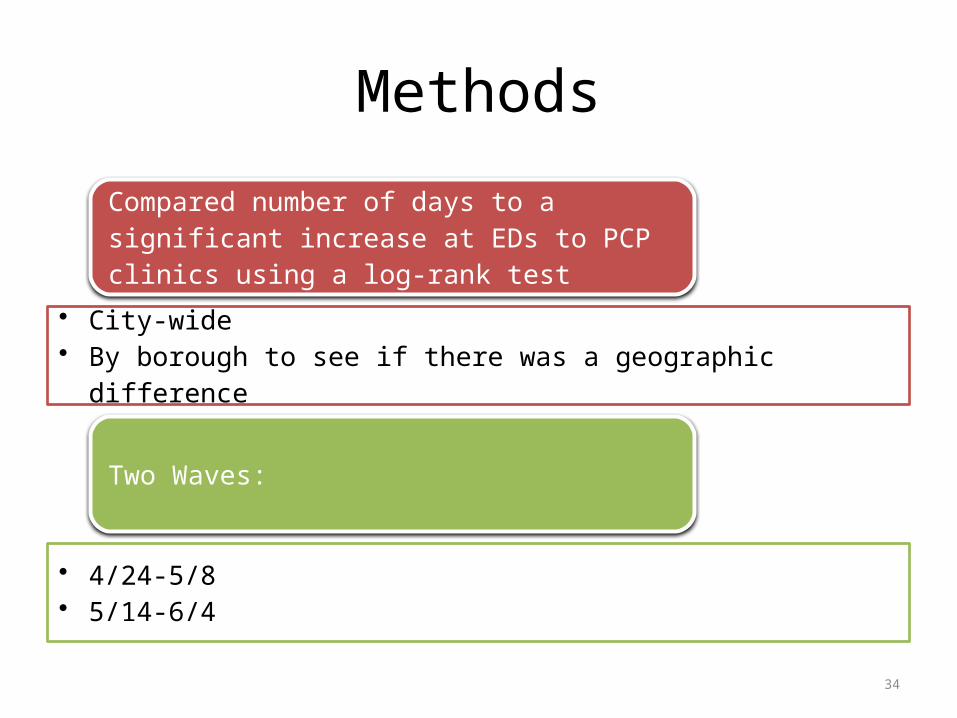
Methods
Compared number of days to a significant increase at EDs to PCP clinics using a log-rank test
• City-wide• By borough to see if there was a geographic difference
Two Waves:
• 4/24-5/8• 5/14-6/4

35
ED, IFH and PCIP ILI Visits

ED, IFH and PCIP ILI Visits

ED, IFH and PCIP ILI Visits

38
Facilities with a significant increase in ILI volume

39
Results, April 24-May 8
Median Days to Increase in ILI
Facilities with Increase in ILI
1-sided log rank
Borough ED PCP ED PCP p-valueAll 4 12 43/50 (86%) 36/58 (62%) <0.0001
Bronx 5 12 8/9 (88%) 10/17 (59%) 0.045
Brooklyn 3 14 12/15 (80%) 6/9 (67%) 0.025
Manhattan 4 13 13/15 (87%) 11/19 (58%) 0.008
Queens 3 7 8/8 (100%) 6/7 (86%) 0.007
Staten Island 14 10 2/3 (67%) 3/3 (100%) 0.902

40
Results, May 14-June 4
Median Days to Increase in ILI
Facilities with Increase in ILI
1-sided log rank
Borough ED PCP ED PCP p-valueAll 4 8 47/50 (94%) 50/58 (86%) <0.0001
Bronx 1 6 9/9 (100%) 16/17 (82%) 0.004
Brooklyn 4 12 13/15 (87%) 7/9 (78%) 0.039
Manhattan 4 7 14/15 (93%) 17/19 (89%) 0.016
Queens 4 8 8/8 (100%) 5/7 ( 71%) 0.091
Staten Island 5 8 3/3 (100%) 3/3 (100%) 0.012

41
Findings
• Emergency Departments experienced an increase in patients with ILI before Primary Care Providers
• PCPs were vastly under-utilized during the outbreak
• NYCDOHMH changed messaging to encourage visiting PCPs instead of EDs for mild illness

42
Future of Syndromic Surveillance
Meaningful Use
• Capability to submit syndromic data to health departments Regional Health Information Organizations (RHIOS), Hubs
Data Validation and Quality Assurance

43
Online Resources
CDC Flu Surveillancehttp://www.cdc.gov/flu/weekly/fluactivity.htm
Distribute
http://www.isdsdistribute.org/