o 4.3 micrometer laser demonstration experiment
TRANSCRIPT

o IC
00 TU O
^=^ \M^J.
BtPORT NO. P77-490 HAC Rt*. NO. OMOa
4.3 MICROMETER LASER DEMONSTRATION EXPERIMENT
HUGHES AIRCRAFT COMPANY CULVER CITY. CALIFORNIA 90230
OCTOBER 1977
Interim Technical Report for Period 29 June 1977 - 30 September 1977
Tha views and conclusions contained in this document are those of the authors and should not be interpreted as necessarily representing the official policies, either expressed or implied of the Defense Advanced Research Projects Agency or the US. Government
eiMMUiMMSCP» BV
Defense Advanced Research Projects Agency ARPA Order No. 2062, Amendment No. 16
MONITORED BY Mr. Wayne Whitney, NRL Code 5540, under Ojmract No. N00173-77-C-0174
CL. CD
QHTRACT EFFECTIVE DATE: 20 June 1977 CONTRACT EXPIRATION DATE: 31 January 1978
•sT e^;
i ^m
n D c JA« 6 1978
c^T lU iJ
,n
m H
\ K
tuumM.,,.; <-„',■'

J U W U J I I I L, I
I J 4.3 MICROMETER LASER DEMORSTRATIOlf EXPERIMENT,
\
REPORT DOCUMENTATION PAGE ESSION NO
7. AuTHORfaJ
1 Philip K./B ally ) Jack/Finzi ^^^Z rTc' PERFORMING ORGANIZATION NA^E AND ADDRESS
Hughes Aircraft Company «^ ^ Centinela cind Teale Sts. " ' Culver Cittf. CA 90Z30 CONTROLLING OFFICE NAME AND ADDRESS
Advanced Research Projects Agency 1400 Wilson Blvd. Arlington, Virginia MONITORING AGENCY NAME « ADDRESSf/f d/f/eren( from Con(ro/l/n« Ollice)
Naval Research Laboratory 4555 Overlook Ave. S.W. Washington, D. C.
READ INSTRUCTIONS BEFORE COMPLETING FORM rcPllNT'S CATALOG NUMBER
erim Report (-A Jun 30 Sepggfcg WTT^eZl TBSBFSB«<H#«*IMta«»P*ffTNUM BER
^PI2*4^Ü 8. CONTRACT OR GRANT NUMBEPfsJ
N0^173-77-C-m4.
/Z ARPA Order'aA-ZObZ AMENUMiJNr Nc
IS. SECURITY CLASS, fof (7i
Unclassified 15a, DECLASSIFICATION DOWNGRADING
SCHEDULE
16. DISTRIBUTION STATEMENT (ol this Report)
i ■'■ V.'
''■ I'l'-i > : foi "Ait .o leieasej T'i... i, uaou CJnümited
17. DISTRIBUTION STATEMENT (ol Iht »balract •"tared In Block 20, II dlllerenl Irom Report)
None
18- SUPPLEMENTARY NOTES
None
19. KEY WORDS (Continue on reverse aide it neceaaary and identity by block numbar)
Carbon Dioxide Laser Chemical Laser Optical Pumping Collisional Energy Transfer
](>■-
20\\ABSTRACT (Continue on raver«« aide II neceaaary end identity by block number)
The possibility of converting multiline CW DF chemical laser radiation to single line CW 4. 3 micrometer radiation by means of an Optical Resonance Pumped Transfer Laser (ORTL) is investigated. The ORTL medium con- sists of a DF and CO2 mixture and a suitable diluent. The optically pumped DF collisionally transfers its vibrational excitation to the CO2. This pro- pram is concerned with a demonstration of 4. 3jj.m oscillation between the (OOfy) and ground state CO2 levels. During this reporting period, a laser dflffllnflitaiilflB experiment has been designed and hardware is being -^
0D I JAN 73 1^73 EDITION OF 1 NOV 65 IS OBSOLETE
^0j h
SECURITY CLASSIFICATION OpTHIS PAGE (When Data Enlrr?,!!

SECURITY C ASSIFlCATION 3F THIS P*OE(Whtn Dal» Enlermd)
\ ^
2C. ABSTRACT (continued)
"""assembled. DF and CO2 fluorescence experiments were performed as a guide to the experimental design. The experiments and results are dis- cussed. The results indicate a strong probability of success for the demonstration experiment.
1 *a
\^m J^^6
SECURITY CLASSIFICATION OF THIS PAGEfWhsn Dal» F.nleredl

SUMMARY
Hi^h energy chemical lasers arc prime candidates for space laser
systems and for other applications, because they are very efficient genera-
tors of high power laser radiation. The multiline output characteristic of
these lasers is, however, detrimental to modern active phase control tech-
niques that may be essent'al for achieving the ultimately required beam
focusing. Optical Resonance pumped Transfer Lasers (ORTL) may offer a
simple and practical solution to this problem by efficiently converting the
multiline DF chemical laser power into a single line output. Specifically,
theoretical analysis indicates that power conversion efficiency of 70 percent
may be achieved in converting 3.8 pm average wavelength DF chemical laser
power into single line output near 4. 3 pm in a DF/CO2 ORTL. The 4. 3 pm
laser output originates from the CO2 (00 1) — (000), transition and therefore
requires inversion relative to the CO2 ground state. The goal of this pro-
gram is to demonstrate laser action in this transiui^n in order to show prin-
ciple feasibility.
During this first program period an ORTL apparatus suitable for
demonstrating CO, 4.3 pm lasing has been assembled and first test results
have been achieved. In a series of experiments we have attempted to verify
that measured population ratios of the CO? levels, (00 l)/(00 0) can in fact
attain or exceed the value of one, which is necessary to achieve lasing in this
band. In a second experiment we will attempt to läse the 4. 3 |j.m transition.
Analysis of fluorescent data at 10. 6 pm and 4. 3 pm radiation obtained fropi a
3 mm ORTL cell pumped by a 200 watt chemical DF laser indicates that ratios
of greater than unity were most likely achieved in these experiments. The
uncertainty of the data reduction is due to complications arising from the as
yet unknown levels of excitation of higher order CO, states that also could
contribute to 10,6 pm fluorescent emissions. Preparations on the second
experiment have progressed and a first attempt at demonstrating laser action
at 4. 3 pm will be made in October.
111
.■ . ..w:-'-~^^: ^.

PREFACE
The work discussed in this report is based upon proprietary prior
work supported by Hughes Internal Research and Development funds. In
addition, work supported by the Ballistic Missile Defense Advanced Tech-
nology Center under Contract DASG60-77-C-0056 has strongly influenced the
technical approach on the present program. This report was authored by
P. K. Baily and J. Finzi. The authors would like to acknowledge the techni-
cal guidance provided by F, N. Mastrup, and numerous technical discussions
with G. Holleman and J. Wang. We would also like to acknowledge the
assistance of K. Hui, H. Injeyan, C. Lovejoy, R. Shimazu, and L. Williams
in performing the fluorescence experiments.
IV

CONTENTS
1. 0 INTRODUCTION 1
2. 0 PROGRAM OBJECTIVES 7
3. 0 FLUORESCENCE EXPERIMENTS 8
3, 1 Apparatus Descriptions H 3. 2 Data Reduction Methods 10 3. 3 Results 13
4.0 LASER DEMONSTRATION EXPERIMENT DESIGN 18
4. 1 General Considerations 18 4. 2 Experimental Apparatus 22
5. 0 FUTURE PLANS 24
5. 1 Immediate Plans 24 5. 2 Implications for Future Work 25
APPENDIX A 26

LIST OF ILLUSTRATIONS
Figure
1
2
3
4
5
6
7
8
Optical Resonance Pumped Transfer Laser (ORTL Got. cept
DF/CO- Energy Transfer Level Diagram .
Predicted Power Conversion Efficiencies ....
Predicted Output Power Per Unit Volume ....
Apparatus for the DF/CO Fluorescence Experiments
Gchernatic of the DF/CO- Fluorescence Experiments
Fluorescence Results at 76 Torr (Helium Diluent) • .
Fluorescence Results at 228 Torr (Helium Diluent) .
Page
2
5
5
6
8
9
14
14
LIST OF TABLES
Table
I
II
Fluorescence Data
Baseline Conditions and Paramoters for Laser Demonstration Experimental ORTL Cell ....
Page
16
20
VI

1.0 INTRODUCTION
High energy chemical lasers in advanced space systems are presently
under active consideration by ARPA and other government agencies. In such
systems the beam degrading effects resulting from propagation through the
atmosphere do not exist at all or are greatly reduced. Therefore, the ability
of the laser system to deliver near ultimate irradiancc levels to distant tar-
gets at prescribed output power levels depends rnly on the extracted beam
quality, the output optics size and, last but not least, on the attainable pre-
cision in pointing and tracking. Modern chemical space laser concepts
involve cavity resonators, such as the cylindrical configuration, where satis-
factory "mode" control or, more precisely, the ability of the resonator to
outcouple a. near diffraction limited beam is questionable or uncertain.
Achievement of the required precision in pointing and tracking may require
single line operation once adaptive optics approaches are seriously pursued
for beam focusing. This is so because the active phase control of a selected
line from amongst the large number of emitted high energy chemical laser
lines does not at all imply control of the entire multiline beam. It is much
more likely that successful active phase control of a chemical laser powered
device beam will only be possible when the output is in fact single line.
The related problems of beam control and single line operation are
both amenable to solution by the Optical Resonance Pumped Transfer Laser
(ORTL) concept. The ORTL concept (Figure 1) promises to permit one to
convert from high efficiency multiline, low optical quality, "multimode" CW
primary laser cavity power to single line, CW low divergence laser output
power. This is accomplished by arranging for the primary, multiline DF
(HF) power to oscillate between two highly reflective mirrors as shown in
Figure 1. The ORTL cell, which is placed within this trapped DF (HF)
laser radiation field becomes, in a well designed ORTL, the major primary
power sink. Effective resonance absorption in the ORTL cell is
achieved by mixing a well balanced amount of DF (HF) gas into the
ORTL gas. The multiline, primary DF (HF) laser power absorbed by the
DF (HF) donors is subsequently transferred by V-V collisions to an acceptor
molecule which becomes the lasing molecule for the single line output (ORTL)
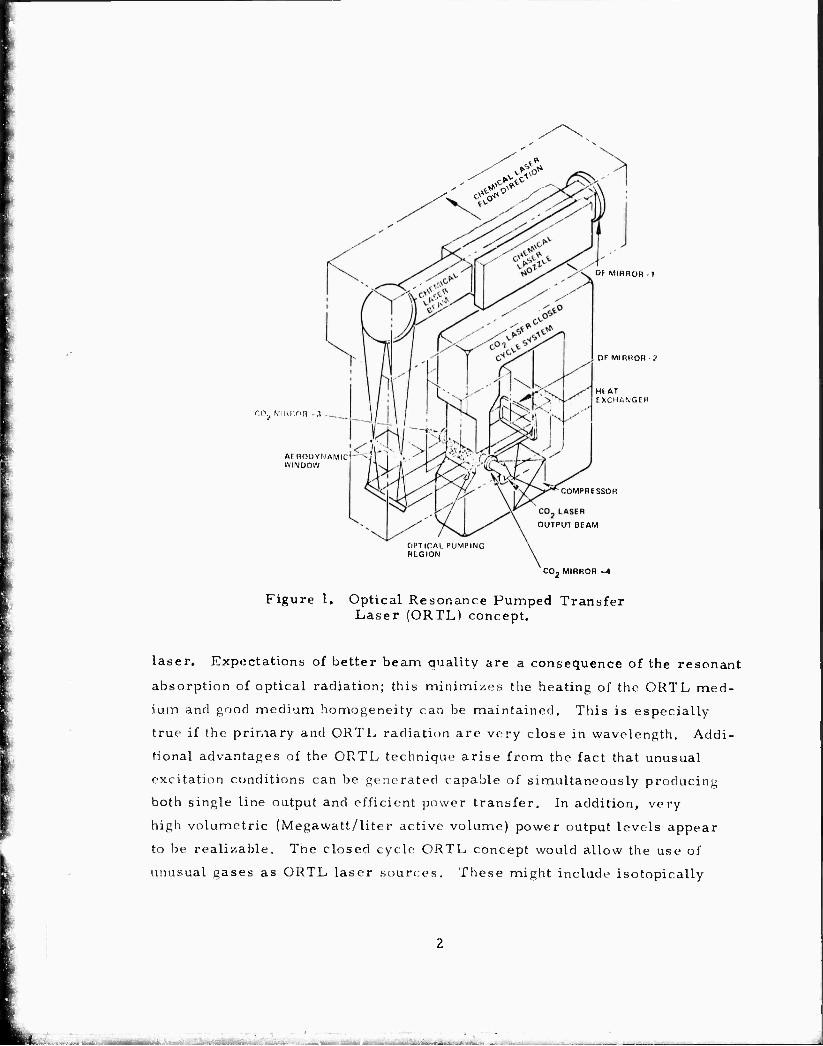
no (.-lucon -.1
AERODYNAMIC WINDOW
DF MIRROR 1
DF MIRHOR 'i
H[ AT EXCHANGE«
COMPRESSOR
OUTPUT BEAM
OPTICAL PUMPING REGION
Figure 1. Optical Resonance Pumped Transfer Laser (ORTL) concept.
laser. Expectations of better beam qualitv are a consequence of the resonant
absorption of optical radiation; this minimizes the heating of the ORTL med-
ium and good medium homogeneity can be maintained. This is especially
true if the primary and ORTL radiation are very close in wavelength. Addi-
tional advantages of the ORTL technique arise from the fact that unusual
excitation conditions can be generated capable of simultaneously producing
both single line output and efficient power transfer. In addition, very
high volumetric (Megawatt/liter active volume) power output levels appear
to be realizable. The closed cycle ORTL concept would allow the use of
unusual gases as ORTL laser sources. These might include isotopically

enriched substances or substances which should not be discharged into the
atmosphere at high rates because of their explosive or toxic nature.
The intracavity ORTL concept was first demonstrated at Hughes in
June, 1970 '' with a DF laser as the primary source of radiation and CCK as
the ORTL medium. Oscillation was achieved at 10.6 microns. The signifi-
cant advances associated with this demonstration were three:
• the ORTL was pumped continuously by DF primary laser power, obtaining CW 10.6pm lasing as opposed to pulsed COo operation in previous work
• multiline, CW optical pumping was used specifically for enforcing a primary pump radiation field controlled donor (DF) vibrational level distribution in the transfer laser medium such that effective multiline pumping with DF laser power could occur
• the necessary high pump radiation flux (Watt/cm ) was achieved by locating the DF/CO2 transfer laser medium inside the closed cavity DF laser resonator mirrors, thus demonstrating the important intracavity configuration and concept.
This 10.6 (i m or DF/CO, ORTL is not very practical for applications
specifically requiring efficient space lasers, however, because of the inherent
and unavoidable power loss associated with converting DF power at an average
wavelength of 3.8 |J m to 10.6 pm CO. laser radiation. This power loss
occurs because all energy transfer processes in the ORTL medium are
quantum effects and, therefore, the maximum possible ORTL output power to
ORTL input power ratio is limited by the wavelength ratio. Another ORTL
with a more favorable, i.e., shorter, output wavelength was therefore
needed. In the special case of DF/CO? ORTL's very reliable predictions on
the transfer of DF excitation to the CO2 (00 1) level could be made because of
the detailed and quantitative knowledge of the involved kinetics. Such analysis
indicated that mixing ratios and pressures could be defined where over
90 percent of the optically pumped DF lever energy would be transferred to
the CO-. (00°!) level. Shorter wavelength lasing could be accomplished if it
J.H.S. Wang, J. Finzi, and F. N. Mastrup, Appl. Phys. Lett. 31, 3^(1977)
BTf "fcM
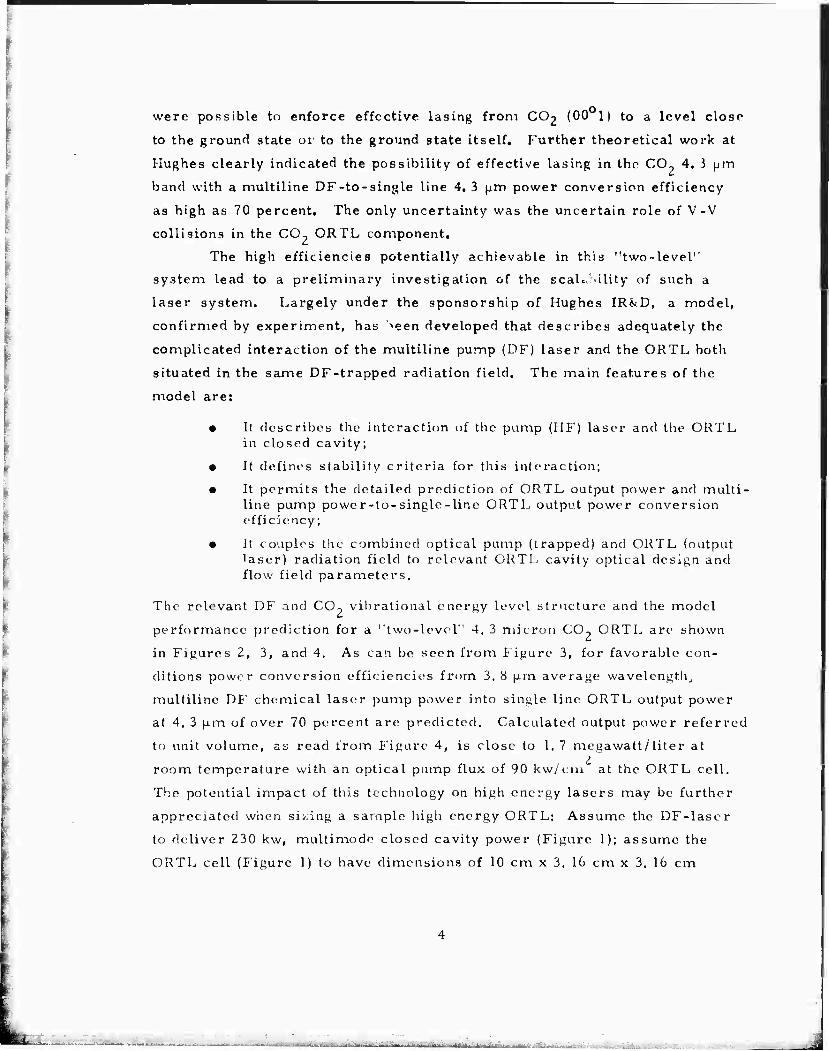
were possible to enforce effective lasing from CO2 (00 1) to a level close
to the ground state or to the ground state itself. Further theoretical work at
Hughes clearly indicated the possibility of effective lasing in the CO? 4, 3 (im
band with a multiline DF-to-single line 4. 3 \im power conversion efficiency
as high as 70 percent. The only uncertainty was the uncertain role of V-V
collisions in the CO, ORTL component.
The high efficiencies potentially achievable in this "two-level1'
system lead to a preliminary investigation of the scaW'ility of such a
laser system. Largely under the sponsorship of Hughes IRfeD, a model,
confirmed by experiment, has -«een developed that describes adequately the
complicated interaction of the multiline pump (DF) laser and the ORTL both
situated in the same DF-trapped radiation field. The main features of the
model are:
• It describes the interaction of the pump (HF) laser and the ORTL in closed cavity;
• It defines stability criteria for this interaction;
• It permits the detailed prediction of ORTL output power and multi- line pump power-to-single-line ORTL output power conversion efficiency;
• It couples the combined optical pump (trapped) and ORTL (output laser) radiation field to relevant ORTL cavity optical design and flow field parameters.
The relevant DF and CO-, vibrational energy level structure and the model
performance prediction for a "two-levcT" 4. 3 micron CO;, ORTL are shown
in Figures 2, 3, and 4. As can be seen from Figure 3, for favorable con-
ditions power conversion efficiencies from 3.8 [im average wavelength,
multiline DF chemical laser pump power into single line ORTL output power
at 4. 3 p.m of over 70 percent are predicted. Calculated output power referred
to unit volume, as read from Figure 4, is close to 1,7 megawatt/liter at
room temperature with an optical pump flux of 90 kw/cm at the ORTL cell.
The potential impact of this technology on high energy lasers may be further
appreciated when sizing a sample high energy ORTL: Assume the DF-laser
to deliver 230 kw, multimode closed cavity power (Figure I); assume the
ORTL cell (Figure I) to have dimensions of 10 cm x 3, 16 cm x 3. 16 cm

DONOU
in
ACCLCTOR |
in
T 3000 1 5 —- > o
j— v
1 001
2 T I Z ?00n < \\06 ! Z
-J Q?0 H- ir
f
> ^000
0 V 0 V ) V 2
Figure 2. CF/CO2 energy transfer level diagram.
>
2 o
LU
> 2 O O
LU
o
100';;,
90%
80%
70%
00%
50%
40%
30%
20%
0%
1 r~—r—-1 100% PHOTON CONVERSION
EFFICIENCY
(?) 9 KW/CMZ
(J) 20.5 KW/CM2
(3) 90 KW/CM2
J_. I 200 300
J- 400 500
T/OK
A. 600 700 800 900
Figure 3. Predicted po-ver conversion efficiencies (pressure = 1/3 Atm, H2.'C02DF = 93:6:1 mole concentration; normalized outcoupling = 4, 25%/cm. )

Figure 4. Predicted output power per unit volume (con- ditions are the same as in Figure 3).
200 300 400 500 600 700 800 900
T/OK
(0, 1 liter); assume the ORTL gas to be at 1/3 atm pressure and Jet the gas
mixture consist of 1 percent DF, b percent CO-, and 93 percent H-, diluent;
assume the ORTL is injection velocity to be 4 x 10^ cm/s( : and inlet
temperature 300 K (M = 0. 1); assume the ORTL cavity to exhibit 85 percent
outcoupling. The expected ORTL output is, for the cited conditions, 160 kw,
at 4. 3 |J.m; the calculated conversion efficiency is 70 percent. The tempera-
ture rise of the ORTL gas flowing through the e,-citation region is only 130 K,
raising the ORTL exit temperature to 430 K. Of particular interest is the
small size of the ORTL (0. 1 liter), the low flow velocity, the comparatively
modest medium temperature rise and, of course, the single line output. All
these features combine to make the ORTL concept exceptionally conveni-nt
for application of advanced mode control techniques.

2.0 PROGRAM OBJECTIVES
The major objectives of the 4. 3 Micrometer Laser Demonstration
Experiment Program are to:
• Demonstrate and characterize 4. 3 |im Cü? lasing action in a DF laser pumped DF/C02 QRTL.
• Assess, through comr ^son with theoretical analysis, the gross effects of V-V collis^ -" in this system.
• Define the need for future and refined work, if any, in this technology area as applied to the chemical space laser ORTL.
The major technical problem is associated with the uncertain effects of CO;, —
CO? V-V collisions. To successfully achieve the objectives the program was
defined in terms ">£ four work tasks as follows:
1. Apparatus Modification and Experimental Design
Z. 4. 3 Micrometer CW DF/CO ORTL Demonstration
3. 4. 3 Micrometer C vV DF/C02 ORTL Characterization
4. Data Analysis and Evaluation
D'.ring this reporting period major results have been achieved as part of
Tasks 1 and 2.

3.0 FLUORESCENCE EXPERIMENTS
As an aid in the design of the laser demonstration experiment, fluor-
escence experiments were performed. These experiments consisted of the
observation of 4. 3 ^m and 10. 6 fim fluorescence from an ORTL cell (without
resonator optics) irradiated by DF laser radiation. Data was taken under a
number of conditions and then analyzed to ascertain the excited state CO?
population densities in order to choose the optin ^1 lasing conditions. These
experiments will be discussed below.
3. 1 APPARATUS DESCRIPTIONS
A photograph of the apparatus and a schematic diagram of the fluor-
escence experiment are shown in Figure 5 and Figure 6. A flowing DF/CO?/
He mixture was introduced into the ORTL cell through a 0. 30 cm circular
duct. For these experiments, the ORTL cell was external to the DF pump
Figure 5, Apparatus for the DF/CO2 fluorescsnce experiments.
i^äÜÜfcWi ■ 1 r nri mm

SPFCTROMETER
ORTLNOZZLE
CdFj LENS
DF LASER
CHOPPER
NARROWBAND FILTER
RADIOMETER
Figure 6. Schematic of the DF/CO?
fluorescence experiments.
laser. The 200 watt DF laserwas focused to a 0.7 cm x 0.4 cm cross-section
at the interaction zone. A back-up mirror returnea the non-absorbed DF
radiation to the cell, giäng rise to a double pass arrangement. The irradia-
tion flux with optical losses taken into account was 1 kw/cm . The flow was
confined to the duct cross section by a surrounding curtain of helium that
matched the pressure and velocity of the DF/CO^/IIe flow. Emission from
both DF and CO? was detected 90 to the pumping direction by a scanning
spectrometer (McPhearson 218) and by a radiometer. Each detection system
consisted of a toroidal imaging mirror, a chopper, and a PAR lock-in ampli-
fier utilizing an InSb detector for the spectrometer and HgCdTe detector for
the radiometer. In the radiometer two narrow band interference filters
(OCLD centered at the C02 (00Ol)—(10O0) transition at 10.4 fim and the (OO0!) —
(000) transition at 4. 3 pm were placed alternately In the optical path in order
to permit rapid discrimination between fluorescing transitions. The spectrom-
eter was used to determine theDF concentration. It was scanned from 3.2 to
4, 2 Jim.
The required small flow rates of DF and CO? were regulated by a
calibrated ma&^ flow controller (Matheson model 8249). The helium curtain

and duct flows were controlled by calibrated sonic orifice meter,-. Typical
composition ranged from 0. 5 to 2 percent CO , and 3 to 9 percent DF with
He comprising the balance. Such low percentages of CO? were chosen to
maximize the ratio of excited CO, to total flowing CO,. The cell pressure 4
was selected close to 76 Torr and the velocity was near to 10 cm/sec. The
latter was chosen to limit the temperature rise in the gas during irradiation,
while the former was detected by mass flow limitations of the vacuum pumps.
Some experiments were also performed at Z2H Torr, with the velocity con- 3
sequently lowered to 3. 3 x 10 cm/sec.
3. I DATA REDUCTION METHODS
The DF vibrational population distribution and the gas temperature at
the excitation region are determined from analysis of the vibration rotation
spectrum obtained by the spectrometer. The line einission intensity, I,
originating from the upper level with quantum numbers v'j' integrated along
the optical path, I, is given by
3 4 -7 IbTT V C 10
o Vj'
;N ,. * V J
,dl
iy + i w/ cm •st (1)
where v is the wavenumber (cm ), c is the speed of light, S., is the rota-
tional line strength factor, |j. is the dipole transition moment, and N ,., is
the number density of the v'j' state. The corresponding signal from the
spectrometer is
S v'j',
lJ T\-a; Volts (2)
where S is the signal in volts, il the solid angle subtended by the collection
system, A the spectrometer slit area, Tv the transmission factor of all
the optical components, ando, the detector responsivity at wavelength \ .
When the same spectrometer system is calibrated against a blackbody the
signal SRB is, ,
SBB = NBB •AX i2 Volts (3)
10

where N_R is the spectral radiance of the blackbody and A\ is the resolution
of the spectrometer in the inits of cm. Substituting the Boltzmann factor for
N r,., in equation (1), and combining equations (1) through (3), we obtain
[N (.,dl / v'j'
2j' + 1 g (
kT/hcB
N N ,dl
BB AK • S
l6Tr3 x 10'7v 4c S..|ii|Z/3] o j'in RB
(4)
Analysis of equation (4) shows that a plot of In [/N ,. ,dl /(Zj' + l)] vs j'ij' + l )
should be linear provided that sell' absorption and rotational nonequilibrium
effects are negligible. The negative slope of this line equals hcB/kT and
the ordinate intercept equals ln(hcB/kT)/N ,dl. We can therefore determine
the temperature from the slope and the DF(v) concentration from the
intercept if ve assume the path length to equal the diameter of the nozzle.
Analysis of the radiometer signal to obtain CO? excited state densi-
ties differs from that given for the spectrometer insomuch as the interfer-
ence filter integrates over all emission lines. For the radiometer case we
rearrange equation (1) as
v'j'
•t • 3 4 ,n-7 I 6 TT V C 1 0
Ü H)' s., B'j' (j' + l) he kT
-R :5)
where N , is the number density of the v1 excited state, Qp is the rotational
partion function, and v' and B' the wavenumber and rotational constant of the
jth state. The signal detected by the radiometer is given by
I . sig J v'j'
il A K^X (6)
11

where the brackets denote the sum over all fluorescing j' states reduced by
the appropriate filter transmission factor, f(M» We combine equations (5)
and (6), collecting all terms independent of wavelengths.
1 • :- IT J SIS, band • F (X) • n • A • TvO \"\ (7)
where I, , is the total radiance of the vibrational band. I\ and a, are band \ X. assumed to be slowly varying functions of wavelength, and F(X.) is given by
the fraction of the total band emiasion transmitted through the filter.
r^-tl'^) •V13''"' + I)hc/kT (Ha i
'R T
and
I
i^ 3 4 ln-7 16 TT V C 10
o Nvtl
band (8b)
Similarly, the radiometer calibrate' against the blackbody yields a signal:
13 b N, f (X) dx " A'I\0x (9)
Taking the ratio of eqns. (7) and (9), the factors associated with the radio-
meter system, HA To, all cancel. Thus, we have A. \
Üi 15 li
^and • F (^
Nxf (\) dx
(10)
12

We solve for 1, ,, and knowing the transition moment of the fluoresceing
state, obtain the absolute number density.
Two situations may limit the usefulness of Eq. (10) to derive absolute
number densities from data obtained with the radiometer. First, if strong
self-absorption is present, an additional term due to self trapping must be
added to Eq. (8). Such is the case if the 4.3 \xm (00Ol) —(000) signal were
used to infer the CO? (00 1) population. This would greatly complicate the
analysis, and render the determination of number densities very question-
able. Therefore, we have derived the densities primarily from 10.6 fjim
data. Secondly, the radiometer counts photons emanating from all transi-
tions that are within the bandpass of the interference filter. Overtones and
combination bands at 4. 3 \im and 10,6 |j.rr. will be transmitted. Hence a
determination of absolute numbers densities requires additional information
about the relative intensities of these disturbing bands. In spite of these
signal analysis problems, we can derive from the measurements meaningful
data on CO^ (00 1) population densities to satisfy the objectives of this
experiment as will be discussed in more detail below.
3. 3 RESULTS
Fluorescence experiments were performed at DF mole fractions of
3 percent and 6 percent with constant total pressure ;:;:. In each case, the
C07 mole fraction was varied. The irradiation flux was 700 W/cm , Fig-
ure 7 shows a plot of the ratio of excited CO, to total CO^ as a function of
CO? mole fraction at 76 Torr, and Figure 8, shows similar data at 228 Torr.
The figures indicate that the region of low CO mole fraction Is most favor-
able for 4.3 pm oscillation. Subsequent experiments focused therefore on
CO? mole fractions ranging from 0. 5 percent to 2 percent, and DF mole
fractions from 1 percent to 9 percent. The pressure and velocity for these 4
experiments was fixed at 76 Torr and 10 cm/sec, respectively.
T. Holstein, Phys. Rev 72, 1212 (1947); 83, 1159(1951).
Fourth Monthly Progress Report, Ballistic Missile Defense Advanced Technology Center Contract DASG60-77-C-0056, July, 1977.
13

1 0
—r — - "T ■ 1
7« TOMB r.AlCULATfD
I<0( 007B
- HDf 003
— [_ ^^r
1 '
** h— i
1 1 i i
IXPERIMENfAL
f<DF 0 03
li0f ■ 0.076
006
«CO,
L 0 10 012
Figure 7. Fluorescence results at 76 Torr (helium diluent).
Figure 8. Fluorescence results at 228 Torr (helium diluent).
CAL.-UU- 1 tD
.-^ 003
EXreHI'.'.EMTAL
0 02 0 04 0 00
14
^^^■■fc. ,,......::,..:, ^...^ --,*- ■llh. ■^■iF-Mi^

Signals from both 10.6 ^im and 4. 3 fjm were monitored sequentially
by the radiometer. The CO^ (00 1) number density can then be estimated as
follows. Recalling Eq. (8b),
IfaTT v cl x 10 o
band N (11)
where I, . is written for a multipiv fluorescing vibrationai manifold. The band ^ ' 0
summation of transition moments can be rewritten as
nm N 10 V y N / . ' nm n
(12)
where Y = h1 /(^IA • (For a harmonic oscillator Y,,„=n. ) Combinino nm | nm| r 101 ,im 0
equations (1Z) and (11) and substituting into Eq. (10), the observed radiomctric
signal is
Slg TO E YnmNn (13)
n=l
where K represents all spectroscopic constants, filter factors and black body
calibration parameters. Thus the radiometer at 10. 6 |J.m signal may be
written as
I . (10. 6 fim) = K(10. 6 um) sig TO. 6 N. + 2-» Y N n-Z nm n
14)
where fiin , is the moment for the (00 1)—(100) transition. Since every
4. 3 p.m and 10. 6 |j.m photon emanates from the same common upper level,
regardless of the actual upper band distribution, we will assume the same
IS

Y for both 10.6 |j.m and 4.3 |.tm signals. The absorption coefficient
for CO., in air at 4.3 \im is 0.118 cm" for P{20). For the raHio-
meter air path of 74 cm (it was not purged) the contribution of the (00 1) -*
(00 0) transition is selectively filtered out of the 4. 3 |j.m signal, but
the 10.6 ^m radiation propagates virtually unattenuated. Thus
I . (4. 3 urn) = K(4. 3 ^.m) , J2 4^v N t. 3| Ln-Z nm nj ■15)
where (JL, , is the moment for the (00 1) — (00 0) transition.
From Eq. (14) and (15),
N. I . (10,6 urn) I . (4, 3 um)
K(10.6 (im) 10. 6 K(4. 3 |j.m) 4. 3
16)
The signal strengths obtained in the fluorescence experiment are
tabulated in Table I. The data was taken at 76 Torr with DF/CO^/He rrix- 4 2 tures flowing at 10 cm/sec irradiated with a DF flux of 1 kW/cm . Reduc-
tion of the data in Table I, using eq. (16) leads to apparent ratios between
the CO., (00 1) population density and the total CO density as follows: For
P.un Number One, the ratio is 1.5 ±0.75, for Run Two, 1.1 ±0.55, for Run
Three, 1.2 ±0.6, and for Run Four, 0.8 ±0.4. The large uncertainty arises
from the additive uncertainties associated with gas flow rate control, signal
TABLE I. FLUORESCENCE DATA
Run
Composition* Signal Strength
co2% DF% h.i (mV) ho. 6^^
1 2 3 4
0.6 1.0 1.0 2.0
4.0 7. 0
10.0 3.0
69 70 63
104
56 58 52 1 94 I
-The diluent was helium. i
16
Mb.

modulation produced by E)F laser amplitude modulation, and in temperaturr
measurem«?nt. Only values of [CO? (00 l)]/[CO ] less than 1 have physical
meaning and the fact that the error bars are justified is obvious. In spite of
the uncertainties in the experiment, it Is apparent that very large population
densities are being produced in the (00 1) level. The question of whether
actual inversion is present depends not on the experimental uncertainties,
but rather on the assumptions made in reducing the data. Their validity of
course is associated with the precise role of V-V processes in CO^ and the
actual vibrational levels which are populated. Fluorescence measurements
at other frequencies would assist in determining the population distribution,
as would 10.6 |jim gain measurements. The critical question of whether
or not the (00 1) population actually exceeds the inversion conditions is
best answered by an appropriate 4. 3 \xm measurement absorption/gain
experiment or by a laser demonstration. In view of the high probability of
success indicated by the fluorescence experiments, and the availability of
high DF pumping flux the laser demonstration will be attempted first.
17

4. 0 LASER DEMONSTRATION EXPERIMENT DESIGN
4. 1 GENERAL CONSIDERATIONS
In this section we will fUscuss the design of the 4.3 micrometer laser
demonstration experiment. The design parameters are based upon the
results of the fluorescence experiments, and existing laboratory equipment
will be used as much as possible. The expected small signal gains at both
4.3 and 10.6 micrometers have been estimated. Oscillation at 10.6 p m
must be suppressed. (This is easily done with selective reflectivity coat-
ings. ) The biggest problem in the experiment design is that of background
atmospheric carbon dioxide. Because the desired transition lower laser
level is the ground state, unexcited carbon dioxide is a strong absorber.
Therefore, this must be excluded from the optical resonator. Small signal
gain and absorption calculations will be presented in this section. The
apparatus to b? used is discussed in Appendix A.
In order to reach the laser oscillation threshold, the small signal gain
must be greater than the cavity losses. The small signal gain, g (w ) at line
center can be expressed as:
o o J ■ij'fi -Ffr r( (17)
The line profile function Hv )» lr! the Doppler domain at line center is juven
by:
U ) / M_
ZTTRT (18)
18

where M is the molecular weight, and R is the gas constant. If pressure
broadening is present, the above equation becomes
V{v ) o
M /
ZTTRT je • . [1 - erf {Z)]j (19)
with Z def ned by:
/, = (In Z 1/ZWL W
D (20)
where W. and W^ are the Lorentian pressure broadening andDoppler broaden
ing half-width parameters respectively. The number density N . can be
expressed as
IN . vi
N . v (2j + 1) e -Bj(j+1) hc/kT
QR (21)
By substituting equations (19) and (21) into equation (17), we obtain for a
P-branch line
ü 3h J
2 hcB -Bj" (j" +1 he
kT
/ M
V 2TTRT
2i5.i"l Nv'^
. M {e7 ■ [i-rf(Z)]} (22)
Based upon the fluorescen.. ;n' 'ourements described previously, the
anticipated s mall signal gain rnav "e stimatod for appropriately chosen condi-
tions. Typical laser demonstrat! .! experiment conditions are listed in Table 11.
The DF pump flux will be in excess of 1 kW/cm . For an anticipated inversion
density of I x 1 0 molecules/cm , the small signal gains at 10.6 fj,m and
4. 3 p.m are 1. 1 percent per cm and 174 percent per cm respectively.
19

TABLE II. BASELINE CONDIirONS AND PARAMETERS FOR LASER DEMONSTRATION EXPERIMENTAL ORTL CELL
ORTL Mixture: 93% He
6% DF
1% CO.,
Pres^are: 76 Torr
"V'elocity: 10 cm/sec
Temperature: 400K
Linewidths (half width at half maximum):
AwD(10.6HLm) = 1. 0 x 10"3 cm"1
-3 -1 Av (4, 3 fim) = 2. 5 x 10 cm
D
Av L
- 3 -1 * 5. 5 x 10 cm
Wavelengths:
v (18) - 946 cm" at 10.6 um o ^
v (18) = 2335 cm at 4. 3 |j.m
Transition moments:
i ,2 -39 3 , :::;;: im 1.5x10 rrg cm at 10. b |i.m
2 - 3 7 3 :':;'; ''•■ ||i| = 10 erg cm at 4. 3 ^m
R. L. Abrams, Appl. Phys. 2J, 609 (1974). We have assumed the same broadening efficiency for DF as for CO-,.
C. Cousin, C. Rosetti, and C. Meyer, Comp. Rend. B 268, 1640 (1969).
R. A. McClatchey, AFCRL Atmosphere Absorption Line Parameters Compilation, TR-73-0096 (1973),
20

A closed cavity demonstration experiment is anticipated, where laser
oscillation is detected by monitoring the scattering from one of the 4. 3 fim
resonator mirrors with a radiometer. The total loss will be determined by
primarily by residual CO- absorption and will be about 1 percent. If the
above inversion density or slightly more is achieved, laser oscillation
at both 10.6 )j.m and 4.3 fj.m could be achieved, (The use of coatings
with low reflectivity at 10.6 \im is anticipated, to suppress 10.6 \iin
oscillation. ) It is also interesting to calculate the threshold inversion
density under these conditions. For a round trip gain length of 6 mm, 14 a 1 percent loss implies an inversion density requirement of 10 per
cm at 4. 3 [im and of 1. 6 x 10 per cm at 10. 6 y.m to reach threshold. In
view of the results discussed in Section 2, such an inversion density is highly
probable.
The single most important contribution to loss at 4. 3 \j.m is the
presence c unexcited CO? within the resonator cavity. Sources of unexcited
CO, in the apparatus described in the next section include diffusion out of the
irradiated ^one, turbulent mixing of the duct and curtain flows, CO- impurity
in the nttrogen gas used to purge the CO? mirror housings, and leakage of air
into the optical path. Extreme care must be taken in order to eliminate each
of these sources. In the apparatus described in the appendix, a helium cur-
tain surrounds the active ORTL medium. The curtain extends radially 4.8
mm from the ORTL nozzle walls. The DF/CO?/He mixture flows so that
it is downstream of the excitation zone after 70 psec. During that time the
CO can diffuse approximately 0.8 mm in the transverse direction. There-
fore laminar diffusion cannot transport any CO? across the helium curtain.
The effect of turbulent diffusion was examined experimentally by sampling
the ORTL cell volume outside the helium curtain with a i.^ss spectrometer.
The detection limit was 1/1000 of the ORTL flow oensity. With only CO?
flowing in the nozzle, and the curtain turned on, no CO? was detected. The
typical CO? impurity level in the nitrogen purge gas is 0. 5 ppm or less than 12 3 10 per cm at 76 Torr. The approximate absorption coefficient is 1.74 x
10 cm /molecule, leading to an estimated loss of less than 0. 01 percent
in the proposed experiment. Such a small loss should be easily overcome by
the expected gain. A general criterion for successfully overcoming the
21

absorption problem can be derived. The round trip small signal gain
is given by twice the gain length, L,r, times the inversion density, ■XL
N ,-N , times 1.74 x 10" . This must exceed the actual resona-
tor losses, L, added to the losses due to unexcited CO-. This absorption
!r>5S is given by twice the ditference between the resonator length, Lp, and
the gain length, times the unexcited CO- density, NRKG, times 1. 74 x 10 .
Thus the maximum tolerable unexcited CO,, density is given by
ZN-^ (LD - L„) 1.74 x lO'16 + L = 3. 48 x 10"16 L„(N ,-N ,.)
A 4. 3 |im resonator will oscillate if
L„(N ,-N ,,) - 2.9 x 10 L N ,. G V v^
BKG hu-L„
4.2 EXPERIMENTAL APPARATUS
The assembly of a new ORTL experimental facility at Hughes has been
completed during the reporting period of this contract. While the facility was
designed and built around a pre-existing Hughes DF laser, as part of another
contract*, this facility will be used for the demonstration experiment on the
present program. Specific pieces of hardware for the ORTL cell for this
experiment have been funded by the present program. The overall facility
is described in Appendix A.
The CO;, ORTL resonator for the 4. 3 |am demonstration experiment
will consist of a flat 99. 8 percent total reflector, and a 1 meter radius
dielectric coated concave mirror with 99 percent reflectivity at 4. 3 [xm, sep-
arated by 45 cm. (The concave mirror reflectivity is less than 10 percent at
10, 6 p.m. ) Scatter off the dielectric coating will be imaged onto an InSb
detector/radiometer equipped with a 4. 3 |.im interference filter. Lasing
in this geometry is in essence a closed cavity demonstration, with the
radiometer serving as the power meter. This concept has been tested with
Contract DASG60-77-C-0056, sponsored by Ballistic Missile Defense Advanced Technology Center.
22

a DF laser, and shown to be capable of detecting a 1 (jiwatt signal. In
conjunction with the radiometer, a shutter interposed in the resonator path
which will block oscillation, will be used to modulate the radiometer signal.
Laser oscillation will be distinguished from fluorescence since for the latter,
shattering the cavity will reduce the radiometer sign by a factor of two. For
the former, the factor will be much greater. The entire radiometer path
length will be purged with ultrapure N?(CO? < 0. 5 ppm).
23

5.C FUTURE PLANS
5. 1 IMMEDIATE PLANS
The results of the fluorescence experiments are extremely encourag-
ing. The signal strengths detected indicate that very large fractions of the
total C07 population have been vibrationally excited. In fact under some
conditions the fluorescence data indicates that the population inversion
required is for 4. 3 |am laser oscillation has been achieved. In view of these
facts, the most reasonable next step is to attempt to observe 4. 3 micrometer
laser oscillation. It is anticipated that the required apparatus, as described
in Section 4, will be available early in the next stage of this program. Sig-
nificantly higher DF pump flux than was used in the fluorescence experiments
will also be available, if required. Therefore, an attempt at laser oscilla-
tion is planned as the next step in the current program.
If this attempt is successful, a series of experiments aimed at char-
acterizing performance as a function of ORTL gas mixture, CO? concentra-
tion, GRTL gas temperature and pressure, and DF pump flux will be under-
taken. Additional experiments oriented toward refineing our understanding
of the kinetics of the DF:CO? ORTL system under conditions of high flux
irradiation are also being considered. Small signal gain measurements at
10- 6 micrometers will be made on another program under similar conditions.
This should yield far more reliable data on CO- (00 1) population in the
absence of lasing than can be obtained from fluorescence experiments.
Resonance absorption (or amplification) measurement at 4. 3 pm would
define the relative (00 0) and ground state population. In order to do such
an experiment, an appropriate source of 4. 3 (jim radiation must be found.
The feasibility of using the fluorescent emission of an electric discharge
designed for efficient pumping of a conventional laboratory CO? laser is
being investigated for this purpose.
Information about higher vibration-.! level population can be obtained
by repeating the fluorescence experiments and simultaneously observing the
fluorescent emission from higher v~ levels, e. g. , (00 3). This can very
easily be done and would provide a great deal of information. Of course,
such an experiment would not indicate the population densities when laser
24

oscillation is allowed, but is aimed at understanding the kinetics of this
system.
5.2 IMPLICATIONS FOR FUTURE WORK
In view of the favorable experimental results obtained so far, and
an anticipated successful laser demonstration experiment, it is useful
to IOOK ahead toward a possible demonstration of a realistic 4, 3 micrometer
DF:CO? ORTL system. A system using a 230 kW DF laser was discussed in
the Introduction. However, the basic design concepts and efficiencies can
be verified with a much smaller system. Accordingly the ORTL model
has been used to generate preliminary design parameters for a laboratory
demonstration device which would be large enough to verify efficiency predic-
tions, and beam quality, and which would be amenable to detailed diagnos-
tics. Postulating a 93:6:1 mixture of H?:DF:CO? operating at one-third
atmosphere and 300K with an ORTL cell geometry of 3 cm x 0. 3 cm x 0. 3 cm
(volume = 0.27 cm"), and an inlet Mach number of approximately 0. 3, a
50 percent output couf.ing resonator yields 450 Watts of 4. 3 micrometer
radiation for an abso bed DF power of 630 Watts. This corresponds to a
conversion efficienc of over 70 percent and an output power extraction of
1.66 MWatts/liter. The calculated rise in ORTL gas temperature is only
22 K. Such a device would serve to verify the model prediction and
experimentally demonstrate the usefulness of the 4. 3 micrometer DFrCO-,
ORTL concept.
25

Appendix A. Intacavity ORTL Facility
This facility will permit irradiation of the ORTL cell dt flux densities
up to 100 KW/cm . A photograph of the facility is shown in Figure A and a
schematic is shown in Figure B. The apparatus is designed to permit either
laser or fluorescence experiments to be conducted in the "intracavity1' con-
figuration. Pursuant to the above goal the apparatus can accommodate
advanced resonator concepts, such as concentric DF laser cavity configura-
tions with spherical or cylindrical mirrors. A summary of the design fea-
tures of the new facility is listed in Table A„
The apparatus was constructed with three design objectives in mind.
The DF resonator necessitated a vibrationally stable platform. The concen-
tric configuration required a stable and resettable resonator distance.
Finally, flexibility to change ORTL nozzles, and to run with or without Brewster
windows was desired. Vibrational stability was attained by first placing all
components on a 4' x 8' vibration isolation optical table. (Newport Research
Corp. Model RS-48.) The DF and CO? mirrors are held in Burleigh mirror
mounts, capable of 1 arc second resolution^ To permit operation without
Brewster windows, the apparatus had to be evacuable. Thus each mirror mount
is bolted to a massive (»50 lb) aluminum base. A Dewar is fitted over each
mirror mount, and c jnnected to the DF laser head by bellows. In this manner,
vibrations from the laser head or stresses due to evacuation, are transmitted
first to the base, and then to the mirror mounts. The design maximum
inward deflection for any box cover or wall is 0. Ü03 inch. Each mirror can
be adjusted under vacuum through a rotating vacuum feedthrough whose shaft
attaches to the mirror mount micrometer via a flexible bellows.
The resonator length is held stable by means of two, 1 inch diameter
mirror rods 2 meters in length. The expansion over a 1. 5 meter length
assuming a 10 F temperature gradient is 13 |j.m, 20 times less than the limit
for stable concentric resonator operation. The Invar rods are attached to
the mirror boxes through roller bearings (Thompson) located directly under-
neath each mirror mount. The mirror housings are able to slide free on the
This facility was partially funded by Contract DASG60-77-C-0056, spon- sored by Ballistic Missile Defense Advanced Technology Center and Hughes Independent Research and Development.
26

Figure A. Intracavity ORTL, Facility,
27
n,,-

VIBRATION ISOLATED TABLE
NOZZLE ORTL BELLOWS
INVAR RODS
Ml BREWSTER SLIT OF LASER WINDOW
M3 M2
Figure B, Schematic of Intracavity ORTL Facility.
TABLE A. CHARACTERISTICS OF THE NEW INTRACAVITY ORTL FACILITY
DF Laser:
DF Laser Resonator length
Length stability needed for concentric operation
150 cm
300 |J.m
Resonator length change for a 10 F temperature change 13 fim
ORTL:
Mechanical resonance frequency of the Invar rods
ORTL resonator length
Maximum ORTL gain length
Minimum ORTL gain length
3 kHz
45 cm
3. 0 cm
0. 1 cm
Intracavity DF Flux:^
250 W at 7 percent outcoupling
1, 5 KW at 7 percent outcoupling
25 KW/cm
150 KW/cm'
:A focused region of 4 mm x 7 mm is assumed
Z6

optical table through ball bearing stages located at each corner of the box.
In this manner the weight of the boxes is supported by the table, not the mir-
ror, while the separation between the boxes is held constant by the Invar.
One of the DF laser mirrors is mounted on a translation stage driven by a
PZT translator (Burleigh Inchworm) capable of 0. 2 fim resolution and 1 inch
extension (see Figure C). Angular orientation can be adjusted manually.
In addition, each micrometer is equipped with a PZT pusher which allows
continuous adjustment over 150 ^radians. Each of these manipulations can
he performed under vacuum. The ORTL cell is modular in construction. Any nozzle or helium
curtain smaller than three cm in length can be inserted. The h'slium curtain
is injected radially about the nozzle, so no voids are created when different
nozzles are installed. Pressure and temperature of the gas stream is
measured through parts located on the ORTL lid. The ORTL flow stream
is isolated from the DF laser by a Brewater window.
29

Figure C DF laser mirror mounting.
30
. _ . . ..: T