oahuhousingoutlook sept 2011
TRANSCRIPT

8/3/2019 OahuHousingOutlook Sept 2011
http://slidepdf.com/reader/full/oahuhousingoutlook-sept-2011 1/11
September 2011 Quick Facts
A RESEARCH TOOL PROVIDED BY THE
HONOLULU BOARD OF REALTORS®
Housing SupplyOverview
5.5 8.85.45.9
Pending Sales 2
Days on Market Until Sale 4
Percent of Original List Price Received 6
Inventory of Homes for Sale 8
Months Supply of Inventory 10
Current as of October 6, 2011. All data from HiCentral MLS, Ltd.. Powered by 10K Research and Marketing.
Click on desired metric to jump to that page.
Months Supply
Condo
Months Supply
Previously Owned
Months Supply
New Construction
Months Supply
Single-Family

8/3/2019 OahuHousingOutlook Sept 2011
http://slidepdf.com/reader/full/oahuhousingoutlook-sept-2011 2/11
Pending Sales Single-Family Homes OnlyA count of properties on which offers have been accepted. Based on a rolling 12-month total.
285
574
430
523 532
405
222
97
335
615
474450
501
355
271
94
$350,000 and Below $350,001 to$475,000
$475,001 to$550,000
$550,001 to$650,000
$650,001 to$800,000
$800,001 to $1.1M $1.1M to $1.9M $1.9M and Above
By Price Range9-2010 9-2011
+ 17.5%
2,972
96
3,005
90
Previously Owned New Construction
By Construction Status9-2010 9-2011
+ 7.1% + 10.2% + 22.1% - 3.1% + 1.1% - 6.3%- 14.0% - 5.8% - 12.3%
By Price Range 9-2010 9-2011 Change 9-2010 9-2011 Change 9-2010 9-2011 Change
$350,000 and Below 285 335 + 17.5% 282 332 + 17.7% 3 3 0.0%
$350,001 to $475,000 574 615 + 7.1% 551 581 + 5.4% 23 34 + 47.8%
$475,001 to $550,000 430 474 + 10.2% 420 461 + 9.8% 10 13 + 30.0%
$550,001 to $650,000 523 450 - 14.0% 510 437 - 14.3% 13 13 0.0%
$650,001 to $800,000 532 501 - 5.8% 511 489 - 4.3% 21 12 - 42.9%
$800,001 to $1.1M 405 355 - 12.3% 391 346 - 11.5% 14 9 - 35.7%
$1.1M to $1.9M 222 271 + 22.1% 216 268 + 24.1% 6 3 - 50.0%
$1.9M and Above 97 94 - 3.1% 91 91 0.0% 6 3 - 50.0%
All Single-Family Homes 3,068 3,095 + 0.9% 2,972 3,005 + 1.1% 96 90 - 6.3%
All data from HiCentral MLS, Ltd. Powered by 10K Research and Marketing. | Click for Cover Page | 2
All Properties Previously Owned New Construction

8/3/2019 OahuHousingOutlook Sept 2011
http://slidepdf.com/reader/full/oahuhousingoutlook-sept-2011 3/11
Pending Sales Condo Properties OnlyA count of properties on which offers have been accepted. Based on a rolling 12-month total.
382334
535
631
724
643
550
257
497
444
539 537
710
613
491
311
$150,000 andbelow
$150,001 to$200,000
$200,001 to$250,000
$250,001 to$300,000
$300,001 to$375,000
$375,001 to$475,000
$475,001 to$700,000
$700,001 andabove
By Price Range9-2010 9-2011
3,725
331
3,736
406
Condo - Fee Simple Condo - Leasehold
By Condo Type9-2010 9-2011
+ 30.1%
3,976
80
4,054
88
Previously Owned New Construction
By Construction Status9-2010 9-2011
+ 32.9% + 0.7% - 10.7% + 21.0% + 2.0% + 10.0%+ 0.3% + 22.7%- 14.9% - 1.9% - 4.7%
By Price Range 9-2010 9-2011 Change 9-2010 9-2011 Change 9-2010 9-2011 Change
$150,000 and below 382 497 + 30.1% 381 497 + 30.4% 1 0 - 100.0%
$150,001 to $200,000 334 444 + 32.9% 332 444 + 33.7% 2 0 - 100.0%
$200,001 to $250,000 535 539 + 0.7% 535 536 + 0.2% 0 3 0.0%
$250,001 to $300,000 631 537 - 14.9% 631 536 - 15.1% 0 1 0.0%
$300,001 to $375,000 724 710 - 1.9% 724 699 - 3.5% 0 11 0.0%
$375,001 to $475,000 643 613 - 4.7% 634 589 - 7.1% 9 24 + 166.7%
$475,001 to $700,000 550 491 - 10.7% 535 477 - 10.8% 15 14 - 6.7%
$700,001 and above 257 311 + 21.0% 204 276 + 35.3% 53 35 - 34.0%
All Price Ranges 4,056 4,142 + 2.1% 3,976 4,054 + 2.0% 80 88 + 10.0%
By Condo Type 9-2010 9-2011 Change 9-2010 9-2011 Change 9-2010 9-2011 Change
Condo - Fee Simple 3,725 3,736 + 0.3% 3,645 3,648 + 0.1% 80 88 + 10.0%
Condo - Leasehold 331 406 + 22.7% 331 406 + 22.7% 0 0 0.0%
All Condo Types 4,056 4,142 + 2.1% 3,976 4,054 + 2.0% 80 88 + 10.0%
All data from HiCentral MLS, Ltd. Powered by 10K Research and Marketing. | Click for Cover Page | 3
All Properties Previously Owned New Construction
8/3/2019 OahuHousingOutlook Sept 2011
http://slidepdf.com/reader/full/oahuhousingoutlook-sept-2011 4/11
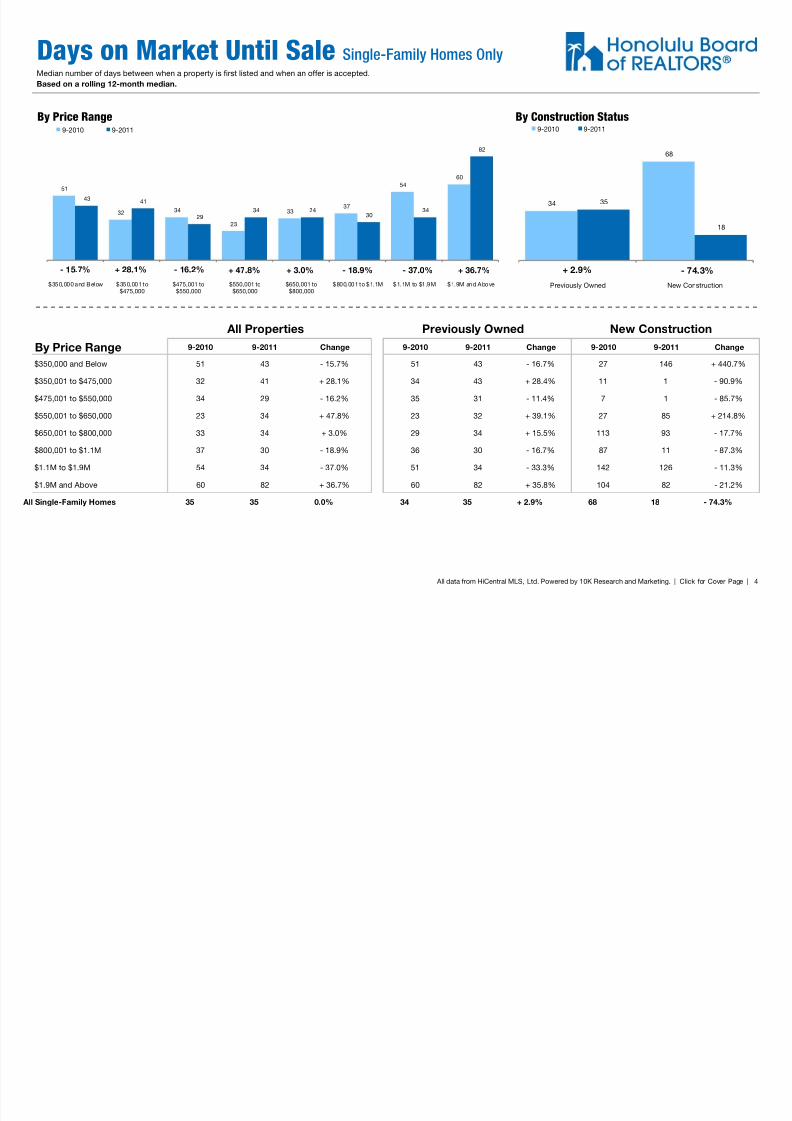
Days on Market Until Sale Single-Family Homes OnlyMedian number of days between when a property is first listed and when an offer is accepted.
Based on a rolling 12-month median.
51
3234
2333
37
54
60
43 41
2934 34
3034
82
$350,000 and Below $350,001 to$475,000
$475,001 to$550,000
$550,001 to$650,000
$650,001 to$800,000
$800,001 to $1.1M $1.1M to $1.9M $1.9M and Above
By Price Range9-2010 9-2011
- 15.7%
34
68
35
18
Previously Owned New Construction
By Construction Status9-2010 9-2011
+ 28.1% - 16.2% - 37.0% + 36.7% + 2.9% - 74.3%+ 47.8% + 3.0% - 18.9%
By Price Range 9-2010 9-2011 Change 9-2010 9-2011 Change 9-2010 9-2011 Change
$350,000 and Below 51 43 - 15.7% 51 43 - 16.7% 27 146 + 440.7%
$350,001 to $475,000 32 41 + 28.1% 34 43 + 28.4% 11 1 - 90.9%
$475,001 to $550,000 34 29 - 16.2% 35 31 - 11.4% 7 1 - 85.7%
$550,001 to $650,000 23 34 + 47.8% 23 32 + 39.1% 27 85 + 214.8%
$650,001 to $800,000 33 34 + 3.0% 29 34 + 15.5% 113 93 - 17.7%
$800,001 to $1.1M 37 30 - 18.9% 36 30 - 16.7% 87 11 - 87.3%
$1.1M to $1.9M 54 34 - 37.0% 51 34 - 33.3% 142 126 - 11.3%
$1.9M and Above 60 82 + 36.7% 60 82 + 35.8% 104 82 - 21.2%
All Single-Family Homes 35 35 0.0% 34 35 + 2.9% 68 18 - 74.3%
All data from HiCentral MLS, Ltd. Powered by 10K Research and Marketing. | Click for Cover Page | 4
All Properties Previously Owned New Construction

8/3/2019 OahuHousingOutlook Sept 2011
http://slidepdf.com/reader/full/oahuhousingoutlook-sept-2011 5/11
Days on Market Until Sale Condo Properties OnlyMedian number of days between when a property is first listed and when an offer is accepted.
Based on a rolling 12-month median.
61
46
3430
27 27
33
46
55
50
41
36 37
31
41
51
$150,000 andbelow
$150,001 to$200,000
$200,001 to$250,000
$250,001 to$300,000
$300,001 to$375,000
$375,001 to$475,000
$475,001 to$700,000
$700,001 andabove
By Price Range9-2010 9-2011
32
61
39
52
Condo - Fee Simple Condo - Leasehold
By Condo Type9-2010 9-2011
- 9.1%
35
18
41
4
Previously Owned New Construction
By Construction Status9-2010 9-2011
+ 8.7% + 20.6% + 24.2% + 10.9% + 17.1% - 77.8%+ 21.9% - 15.6%+ 20.0% + 37.0% + 14.8%
By Price Range 9-2010 9-2011 Change 9-2010 9-2011 Change 9-2010 9-2011 Change
$150,000 and below 61 55 - 9.1% 61 55 - 9.8% 51 0 - 100.0%
$150,001 to $200,000 46 50 + 8.7% 46 50 + 8.7% 232 0 - 100.0%
$200,001 to $250,000 34 41 + 20.6% 34 41 + 20.6% 0 33 0.0%
$250,001 to $300,000 30 36 + 20.0% 30 36 + 20.0% 0 0 0.0%
$300,001 to $375,000 27 37 + 37.0% 27 37 + 37.0% 0 0 0.0%
$375,001 to $475,000 27 31 + 14.8% 27 31 + 14.8% 37 52 + 41.1%
$475,001 to $700,000 33 41 + 24.2% 33 42 + 25.8% 46 0 - 100.0%
$700,001 and above 46 51 + 10.9% 52 63 + 21.2% 0 0 0.0%
All Condos 35 40 + 14.3% 35 41 + 17.1% 18 4 - 77.8%
By Condo Type 9-2010 9-2011 Change 9-2010 9-2011 Change 9-2010 9-2011 Change
Condo - Fee Simple 32 39 + 21.9% 33 40 + 21.2% 43 18 - 58.1%
Condo - Leasehold 61 52 - 15.6% 61 52 - 15.6% 0 0 0.0%
All Condos 35 40 + 14.3% 35 41 + 17.1% 18 4 - 77.8%
All data from HiCentral MLS, Ltd. Powered by 10K Research and Marketing. | Click for Cover Page | 5
All Properties Previously Owned New Construction

8/3/2019 OahuHousingOutlook Sept 2011
http://slidepdf.com/reader/full/oahuhousingoutlook-sept-2011 6/11
Pct. Of Orig. Price Received Single-Family Homes OnlyPercentage found when dividing a property’s sales price by its original list price, then taking the average for all properties sold,
not accounting for seller concessions. Based on a rolling 12-month average.
93.1%
96.1% 96.1%96.7% 96.3%
94.7%
91.7%
88.0%
93.5%
95.7%96.8%
95.9% 96.4%
94.6%
92.9%
86.6%
$350,000 and Below $350,001 to$475,000
$475,001 to$550,000
$550,001 to$650,000
$650,001 to$800,000
$800,001 to $1.1M $1.1M to $1.9M $1.9M and Above
By Price Range9-2010 9-2011
+ 0.5%
95.3%95.1%95.2%
96.2%
Previously Owned New Construction
By Construction Status9-2010 9-2011
- 0.4% + 0.7% + 1.2% - 1.7% - 0.1% + 1.1%- 0.8% + 0.1% - 0.1%
By Price Range 9-2010 9-2011 Change 9-2010 9-2011 Change 9-2010 9-2011 Change
$350,000 and Below 93.1% 93.5% + 0.5% 93.1% 93.6% + 0.6% 97.1% 88.6% - 8.7%
$350,001 to $475,000 96.1% 95.7% - 0.4% 96.0% 95.7% - 0.4% 99.6% 97.9% - 1.7%
$475,001 to $550,000 96.1% 96.8% + 0.7% 96.0% 96.8% + 0.8% 101.2% 99.8% - 1.4%
$550,001 to $650,000 96.7% 95.9% - 0.8% 96.7% 95.9% - 0.8% 97.2% 97.4% + 0.1%
$650,001 to $800,000 96.3% 96.4% + 0.1% 96.3% 96.4% + 0.1% 96.8% 97.6% + 0.8%
$800,001 to $1.1M 94.7% 94.6% - 0.1% 94.7% 94.5% - 0.2% 93.9% 97.5% + 3.8%
$1.1M to $1.9M 91.7% 92.9% + 1.2% 92.1% 92.9% + 0.9% 82.8% 87.6% + 5.8%
$1.9M and Above 88.0% 86.6% - 1.7% 88.3% 86.6% - 1.9% 85.4% 86.5% + 1.3%
All Single-Family Homes 95.3% 95.2% - 0.1% 95.3% 95.2% - 0.1% 95.1% 96.2% + 1.1%
All data from HiCentral MLS, Ltd. Powered by 10K Research and Marketing. | Click for Cover Page | 6
All Properties Previously Owned New Construction

8/3/2019 OahuHousingOutlook Sept 2011
http://slidepdf.com/reader/full/oahuhousingoutlook-sept-2011 7/11
Pct. Of Orig. Price Received Condo Properties OnlyPercentage found when dividing a property’s sales price by its original list price, then taking the average for all properties sold,
not accounting for seller concessions. Based on a rolling 12-month average.
88.1%
93.0%
94.9%95.8%
96.7% 96.4%95.6%
92.5%
89.9%
92.8%
94.9%95.8% 96.1% 96.4% 96.2%
93.7%
$150,000 andbelow
$150,001 to$200,000
$200,001 to$250,000
$250,001 to$300,000
$300,001 to$375,000
$375,001 to$475,000
$475,001 to$700,000
$700,001 andabove
By Price Range9-2010 9-2011
92.6%
87.6%
95.3%
87.7%
Condo - Fee Simple Condo - Leasehold
By Condo Type9-2010 9-2011
+ 2.1%
94.7%
95.5%
94.6%
100.3%
Previously Owned New Construction
By Construction Status9-2010 9-2011
- 0.2% - 0.0% + 0.6% + 1.4% - 0.1% + 5.0%+ 2.9% + 0.1%+ 0.0% - 0.7% + 0.1%
By Price Range 9-2010 9-2011 Change 9-2010 9-2011 Change 9-2010 9-2011 Change
$150,000 and below 88.1% 89.9% + 2.1% 88.1% 89.9% + 2.1% 85.5% 0.0% - 100.0%
$150,001 to $200,000 93.0% 92.8% - 0.2% 93.0% 92.8% - 0.2% 102.7% 0.0% - 100.0%
$200,001 to $250,000 94.9% 94.9% - 0.0% 94.9% 94.9% - 0.0% 0.0% 95.5% 0.0%
$250,001 to $300,000 95.8% 95.8% + 0.0% 95.8% 95.8% + 0.0% 0.0% 0.0% 0.0%
$300,001 to $375,000 96.7% 96.1% - 0.7% 96.7% 96.1% - 0.7% 0.0% 0.0% 0.0%
$375,001 to $475,000 96.4% 96.4% + 0.1% 96.3% 96.3% - 0.0% 99.7% 102.1% + 2.4%
$475,001 to $700,000 95.6% 96.2% + 0.6% 95.6% 96.1% + 0.5% 94.8% 102.7% + 8.4%
$700,001 and above 92.5% 93.7% + 1.4% 92.3% 93.1% + 0.9% 95.3% 99.2% + 4.1%
All Condos 94.7% 94.7% - 0.0% 94.7% 94.6% - 0.1% 95.5% 100.3% + 5.0%
By Condo Type 9-2010 9-2011 Change 9-2010 9-2011 Change 9-2010 9-2011 Change
Condo - Fee Simple 92.6% 95.3% + 2.9% 87.6% 87.7% + 0.1% 90.6% 95.5% + 5.5%
Condo - Leasehold 87.6% 87.7% + 0.1% 0.0% 0.0% 0.0% 0.0% 0.0% 0.0%
All Condos 94.7% 94.7% - 0.0% 94.7% 94.6% - 0.1% 95.5% 100.3% + 5.0%
All data from HiCentral MLS, Ltd. Powered by 10K Research and Marketing. | Click for Cover Page | 7
All Properties Previously Owned New Construction

8/3/2019 OahuHousingOutlook Sept 2011
http://slidepdf.com/reader/full/oahuhousingoutlook-sept-2011 8/11
Inventory of Homes for Sale Single-Family Homes OnlyThe number of properties available for sale in active status at the end of the most recent month. Based on one month of activity.
224
264
184
205217
200
221 226
124
176
153
198
254
203195
183
$350,000 and Below $350,001 to$475,000
$475,001 to$550,000
$550,001 to$650,000
$650,001 to$800,000
$800,001 to $1.1M $1.1M to $1.9M $1.9M and Above
By Price Range9-2010 9-2011
- 44.6%
1,678
63
1,429
57
Previously Owned New Construction
By Construction Status9-2010 9-2011
- 33.3% - 16.8% - 11.8% - 19.0% - 14.8% - 9.5%- 3.4% + 17.1% + 1.5%
By Price Range 9-2010 9-2011 Change 9-2010 9-2011 Change 9-2010 9-2011 Change
$350,000 and Below 224 124 - 44.6% 221 117 - 47.1% 3 7 + 133.3%
$350,001 to $475,000 264 176 - 33.3% 255 167 - 34.5% 9 9 0.0%
$475,001 to $550,000 184 153 - 16.8% 182 150 - 17.6% 2 3 + 50.0%
$550,001 to $650,000 205 198 - 3.4% 198 195 - 1.5% 7 3 - 57.1%
$650,001 to $800,000 217 254 + 17.1% 209 244 + 16.7% 8 10 + 25.0%
$800,001 to $1.1M 200 203 + 1.5% 191 195 + 2.1% 9 8 - 11.1%
$1.1M to $1.9M 221 195 - 11.8% 207 185 - 10.6% 14 10 - 28.6%
$1.9M and Above 226 183 - 19.0% 215 176 - 18.1% 11 7 - 36.4%
All Single-Family Homes 1,741 1,486 - 14.6% 1,678 1,429 - 14.8% 63 57 - 9.5%
All data from HiCentral MLS, Ltd. Powered by 10K Research and Marketing. | Click for Cover Page | 8
All Properties Previously Owned New Construction

8/3/2019 OahuHousingOutlook Sept 2011
http://slidepdf.com/reader/full/oahuhousingoutlook-sept-2011 9/11
Inventory of Homes for Sale Condo Properties OnlyThe number of properties available for sale in active status at the end of the most recent month. Based on one month of activity.
310298 306
273
314
257275 278
215
162
190
240261 261 254
283
$150,000 andbelow
$150,001 to$200,000
$200,001 to$250,000
$250,001 to$300,000
$300,001 to$375,000
$375,001 to$475,000
$475,001 to$700,000
$700,001 andabove
By Price Range9-2010 9-2011
1,890
421
1,595
271
Condo - Fee Simple Condo - Leasehold
By Condo Type9-2010 9-2011
- 30.6%
2,238
73
1,800
66
Previously Owned New Construction
By Construction Status9-2010 9-2011
- 45.6% - 37.9% - 7.6% + 1.8% - 19.6% - 9.6%- 15.6% - 35.6%- 12.1% - 16.9% + 1.6%
By Price Range 9-2010 9-2011 Change 9-2010 9-2011 Change 9-2010 9-2011 Change
$150,000 and below 310 215 - 30.6% 310 214 - 31.0% 0 1 0.0%
$150,001 to $200,000 298 162 - 45.6% 298 162 - 45.6% 0 0 0.0%
$200,001 to $250,000 306 190 - 37.9% 305 189 - 38.0% 1 1 0.0%
$250,001 to $300,000 273 240 - 12.1% 272 222 - 18.4% 1 18 + 1700.0%
$300,001 to $375,000 314 261 - 16.9% 309 248 - 19.7% 5 13 + 160.0%
$375,001 to $475,000 257 261 + 1.6% 248 252 + 1.6% 9 9 0.0%
$475,001 to $700,000 275 254 - 7.6% 259 248 - 4.2% 16 6 - 62.5%
$700,001 and above 278 283 + 1.8% 237 265 + 11.8% 41 18 - 56.1%
All Price Ranges 2,311 1,866 - 19.3% 2,238 1,800 - 19.6% 73 66 - 9.6%
By Condo Type 9-2010 9-2011 Change 9-2010 9-2011 Change 9-2010 9-2011 Change
Condo - Fee Simple 1,890 1,595 - 15.6% 1,818 1,532 - 15.7% 72 63 - 12.5%
Condo - Leasehold 421 271 - 35.6% 420 268 - 36.2% 1 3 + 200.0%
All Condo Types 2,311 1,866 - 19.3% 2,238 1,800 - 19.6% 73 66 - 9.6%
All data from HiCentral MLS, Ltd. Powered by 10K Research and Marketing. | Click for Cover Page | 9
All Properties Previously Owned New Construction
8/3/2019 OahuHousingOutlook Sept 2011
http://slidepdf.com/reader/full/oahuhousingoutlook-sept-2011 10/11
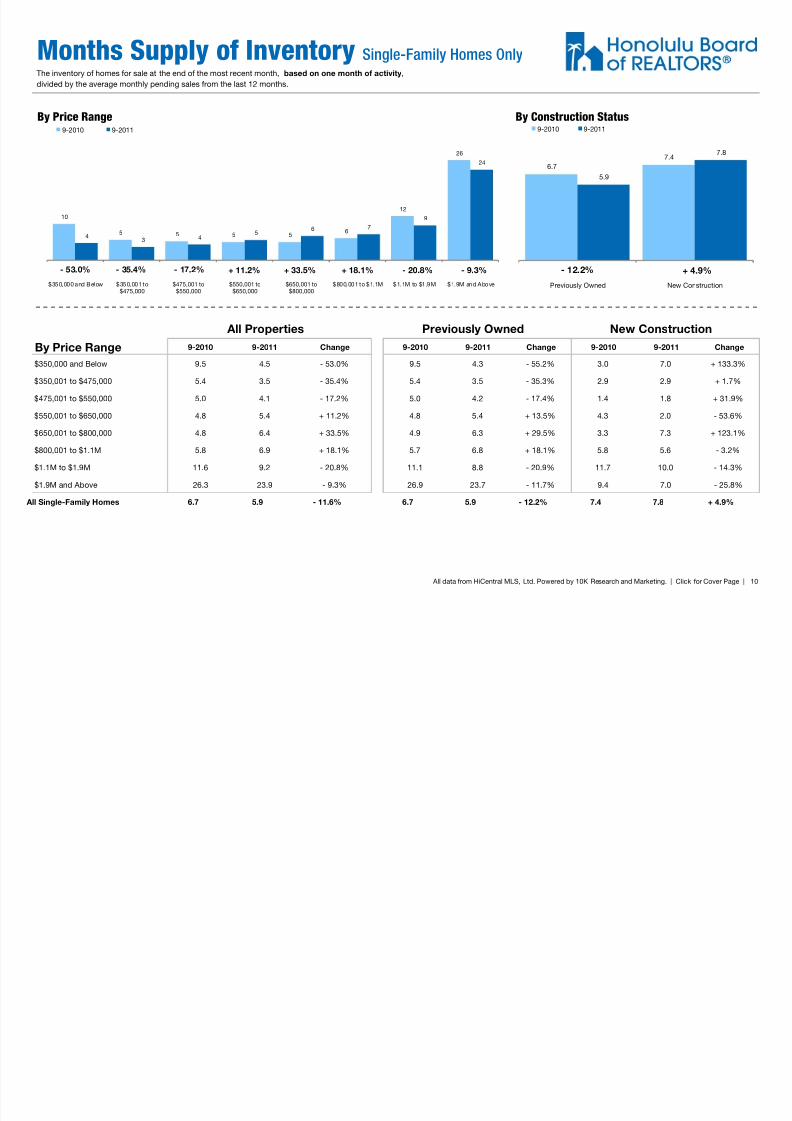
Months Supply of Inventory Single-Family Homes OnlyThe inventory of homes for sale at the end of the most recent month, based on one month of activity,
divided by the average monthly pending sales from the last 12 months.
10
5 5 5 56
12
26
43 4
56 7
9
24
$350,000 and Below $350,001 to$475,000
$475,001 to$550,000
$550,001 to$650,000
$650,001 to$800,000
$800,001 to $1.1M $1.1M to $1.9M $1.9M and Above
By Price Range9-2010 9-2011
- 53.0%
6.7
7.4
5.9
7.8
Previously Owned New Construction
By Construction Status9-2010 9-2011
- 35.4% - 17.2% - 20.8% - 9.3% - 12.2% + 4.9%+ 11.2% + 33.5% + 18.1%
By Price Range 9-2010 9-2011 Change 9-2010 9-2011 Change 9-2010 9-2011 Change
$350,000 and Below 9.5 4.5 - 53.0% 9.5 4.3 - 55.2% 3.0 7.0 + 133.3%
$350,001 to $475,000 5.4 3.5 - 35.4% 5.4 3.5 - 35.3% 2.9 2.9 + 1.7%
$475,001 to $550,000 5.0 4.1 - 17.2% 5.0 4.2 - 17.4% 1.4 1.8 + 31.9%
$550,001 to $650,000 4.8 5.4 + 11.2% 4.8 5.4 + 13.5% 4.3 2.0 - 53.6%
$650,001 to $800,000 4.8 6.4 + 33.5% 4.9 6.3 + 29.5% 3.3 7.3 + 123.1%
$800,001 to $1.1M 5.8 6.9 + 18.1% 5.7 6.8 + 18.1% 5.8 5.6 - 3.2%
$1.1M to $1.9M 11.6 9.2 - 20.8% 11.1 8.8 - 20.9% 11.7 10.0 - 14.3%
$1.9M and Above 26.3 23.9 - 9.3% 26.9 23.7 - 11.7% 9.4 7.0 - 25.8%
All Single-Family Homes 6.7 5.9 - 11.6% 6.7 5.9 - 12.2% 7.4 7.8 + 4.9%
All data from HiCentral MLS, Ltd. Powered by 10K Research and Marketing. | Click for Cover Page | 10
All Properties Previously Owned New Construction

8/3/2019 OahuHousingOutlook Sept 2011
http://slidepdf.com/reader/full/oahuhousingoutlook-sept-2011 11/11
Months Supply of Inventory Condo Properties OnlyThe inventory of homes for sale at the end of the most recent month, based on one month of activity,
divided by the average monthly pending sales from the last 12 months.
9.610.3
6.8
5.0 5.1 4.7
5.9
13.2
5.4 4.5 4.25.4 4.5 5.1
6.3
11.2
$150,000 andbelow
$150,001 to$200,000
$200,001 to$250,000
$250,001 to$300,000
$300,001 to$375,000
$375,001 to$475,000
$475,001 to$700,000
$700,001 andabove
By Price Range9-2010 9-2011
6.0
14.6
5.2
8.4
Condo - Fee Simple Condo - Leasehold
By Condo Type9-2010 9-2011
- 44.0%
6.6
11.1
5.4
8.8
Previously Owned New Construction
By Construction Status9-2010 9-2011
- 56.7% - 38.3% + 6.6% - 15.3% - 18.1% - 20.6%- 13.2% - 42.7%+ 8.8% - 10.7% + 9.0%
By Price Range 9-2010 9-2011 Change 9-2010 9-2011 Change 9-2010 9-2011 Change
$150,000 and below 9.6 5.4 - 44.0% 9.6 5.3 - 44.4% 0.0 0.0 0.0%
$150,001 to $200,000 10.3 4.5 - 56.7% 10.4 4.5 - 56.9% 0.0 0.0 0.0%
$200,001 to $250,000 6.8 4.2 - 38.3% 6.8 4.2 - 38.0% 0.0 1.0 0.0%
$250,001 to $300,000 5.0 5.4 + 8.8% 5.0 5.0 + 1.2% 0.0 18.0 0.0%
$300,001 to $375,000 5.1 4.5 - 10.7% 5.0 4.4 - 12.3% 0.0 4.7 0.0%
$375,001 to $475,000 4.7 5.1 + 9.0% 4.6 5.2 + 12.0% 7.9 3.5 - 55.3%
$475,001 to $700,000 5.9 6.3 + 6.6% 5.7 6.3 + 9.7% 7.1 3.0 - 57.8%
$700,001 and above 13.2 11.2 - 15.3% 14.0 12.0 - 14.0% 9.8 5.0 - 49.7%
All Price Ranges 6.7 5.5 - 18.0% 6.6 5.4 - 18.1% 11.1 8.8 - 20.6%
By Condo Type 9-2010 9-2011 Change 9-2010 9-2011 Change 9-2010 9-2011 Change
Condo - Fee Simple 6.0 5.2 - 13.2% 5.9 5.1 - 13.0% 10.9 8.4 - 23.2%
Condo - Leasehold 14.6 8.4 - 42.7% 14.6 8.3 - 43.2% 0.0 0.0 0.0% All Condo Types 6.7 5.5 - 18.0% 6.6 5.4 - 18.1% 11.1 8.8 - 20.6%
All data from HiCentral MLS, Ltd. Powered by 10K Research and Marketing. | Click for Cover Page | 11
All Properties Previously Owned New Construction