object-oriented residential building land-use … · object-oriented residential building land-use...
TRANSCRIPT
ASPRS 2010 Annual Conference San Diego, California ♦ April 26-30, 2010
OBJECT-ORIENTED RESIDENTIAL BUILDING LAND-USE MAPPING USING LIDAR AND AERIAL PHOTOGRAPHS
Xuelian Meng, Lecturer
Department of Geography, Texas A&M University 810 O&M Building, College Station, Texas 77843-3147
Department of Geography, Texas State University-San marcos
601 University Drive, San Marcos, TX 78666 [email protected]
Nate Currit, Assistant Professor
Geography Department, Texas State University-San Marcos 601 University Drive, San Marcos, TX 78666
Le Wang, Associate Professor Department of Geography, State University of New York at Buffalo
105 Wilkeson Quad, Buffalo, NY 14261 [email protected]
Xiaojun Yang, Associate Professor
Department of Geography, Florida State University P.O. Box 3062190, Tallahassee, FL 32306-2109
Email: [email protected] ABSTRACT Human activities have transformed at least one-third of the Earth’s surface in the past century, and land-cover and land-use analyses play a critical role in human-environment interaction analysis. Land-use analysis, especially for residential land uses, is comparably more challenging than land cover as land use categories relate less directly to the physical reflectance obtained by remote sensors; however, land-use classification recently attracts a growing attention because of the advancement in high-resolution imagery and the demand to improve intra-urban structure mapping. Current methods focus more on pixel- and parcel-based analysis but relatively less on object-oriented studies based on meaningful urban elements. This research presents an approach to detect and separate residential land uses on a building scale directly from remotely sensed imagery to enhance urban land-use analysis. Specifically, the proposed methodology applies a multi-directional ground filter to generate a bare ground surface from lidar data, then utilizes a morphology-based building detection algorithm to identify buildings from lidar and aerial photographs, and finally separates residential buildings using a supervised C4.5 decision tree analysis based on seven selected building land-use indicators. Successful execution of this study produces three independent methods, each corresponding to the steps of the methodology: lidar ground filtering, building detection, and building-based object-oriented land-use classification. Furthermore, this research provides a prototype as one of the few early explorations of building-based land-use analysis and a successful separation of more than 79.73% of residential buildings based on an experiment on an 8.25-km2 study site located in Austin, Texas.
INTRODUCTION
Urban land-use analysis is critical in analyzing human-environment interactions. Researchers have conducted many experiments to classify built-up land, forest, water, agriculture, and other land-use or land-cover types (Bruzzone and Carlin, 2006; Frate et al., 2007; Houghton, 1994; Huang et al., 2008). Separating residential land uses from other land-uses within urban areas, however, has proven to be surprisingly troublesome (Gong and Howarth,

ASPRS 2010 Annual Conference San Diego, California ♦ April 26-30, 2010
1992; Herold et al., 2003; Lu and Weng, 2006). Although high-resolution images have recently become more available for land-use classifications, an increasing spatial resolution does not guarantee improved classification accuracy by traditional classifiers due to increases in class complexity (Barnsley et al., 2001; Martin et al., 1988). New approaches are needed that utilize the detailed texture information available in high-resolution imagery to improve urban land-use studies.
Current urban land-use classification algorithms can be grouped into three categories: pixel-based, parcel-based, and object-oriented (Wu, 2006). Pixel-based methods classify individual pixels into land-use categories. Most pixel-based classification algorithms assume the spectral distribution of each class is normal and perform poorly where this condition is not met. However, when image spatial resolution increases (e.g. from 30 meters to 1 meter), objects within a land-use type have unique colors and textures due to the variety of features visible at high resolution. As a result, a land-use category in high-resolution imagery more likely has a complex multi-modal spectral distribution, leading to statistical bias and inaccurate classification results (Herold et al., 2003; Myint, 2003).
Incorporating neighborhood context into the pixel-based classification process, by including surrounding pixel values in a pre-defined neighborhood, provides a promising alternative. Barnsley and Barr (1996) first utilized the Maximum Likelihood Classifier (MLC) to separate SPOT images into broad land-cover types and then conducted a kernel-based spatial reclassification based on an adjacency matrix to reclassify the broader land-cover classes into the following land-use types: low and medium density residential, commercial/industry, arable crops, pasture, woodland, bare soil, and water. The results yielded a kappa coefficient of 92.1 with no accuracy report for individual residential land-use types. Gong and Howarth (1992) applied a textual classification based on the frequency matrix and gray-level vector to classify urban land uses into 14 classes including new and old urban residential, rural residential and industrial land uses. Their experiment showed that the contextual classification improved the land-use classification from a kappa coefficient of 0.462 to 0.616. However, the window size for calculating neighborhood context has a significant influence on land-use classification accuracy (Gong and Howarth, 1992).
Researchers are exploring new approaches, notably parcel-based and object-oriented analyses, to solve the problems of traditional pixel-based land-use classifications. Instead of classifying individual pixels, parcel-based classification algorithms classify pixel groups defined by land-cover polygons available in existing GIS data or through image segmentation (Aplin et al., 1999; Wu, 2006; Zhan et al., 2000). Researchers then utilize the relationships between land cover and land use to classify land-cover parcels into land-use categories based on adjacency relationships and analytical processes (Barnsley et al., 2003; Barnsley and Barr, 1997; Bauer and Steinnocher, 2001). Herold et al. (2003) first manually delineated land-cover parcels based on visual interpretation on IKONOS images, and then applied the E-cognition software to incorporate spatial structure and texture information to classify the land parcels into nine urban land uses including four levels of residential land use density. Bauer and Steinnocher (2001) conducted similar research based on the MLC-derived land cover classes from IKONOS images. Pacifici et al. (2009) experimented with urban land-use classification based on high-resolution Quickbird and WorldView panchromatic images using a neural network and texture analysis. The results showed that applying neural network classification only on panchromatic images generate poor results (Kappa coefficient below 0.378), but that incorporating texture features with the panchromatic images significantly increased the accuracy (Kappa coefficient above 0.798). Applying an additional neural network to optimize and select the most distinguishable bands improved the overall kappa coefficient to be over 0.904. However, there were no accuracy reports for individual classes, such as residential land uses.
Studies have proven the accurate classification of residential land uses is surprisingly difficult to achieve. Researchers often seek help from existing land-use or census maps (Wu et al., 2006; Lu and Weng, 2006). Lu and Weng (2006) claimed there was a direct relationship between urban land uses and impervious surfaces and population density. In their experiment on ETM+ images, the authors first calculated surface temperature using the thermal band and found that higher surface temperatures mostly occurred around commercial or other non-residential land–use areas. The temperature gradually decreased based on residential density, and displayed the lowest values on forest and water. Then, the authors integrated the impervious surface and census population density maps within a rule-based land-use classification system to classify the study site into four residential land uses (low, medium, high and very high intensity), urban non-residential land use, non-urban, and water. Although the authors utilized census population data, the four residential land uses were proven to be most difficult to classify as the accuracies range from 54.55% to 82.46% with an average accuracy of 68%.
Object-oriented classifications detect and label objects that usually correspond to specific urban elements, such as buildings, impervious surfaces and others, and provide a different approach to simulate visual land-use interpretation logic. Targeting actual urban elements with the aid of adjacent features makes object-oriented classification similar to visual image interpretation. One advantage of this approach is that it is easier to assign

ASPRS 2010 Annual Conference San Diego, California ♦ April 26-30, 2010
attributes (e.g. area, parameter, compactness, shape, and distance to the nearest road) to individual objects. However, relatively little object-oriented classification research has being done to date.
Instead of directly classifying land uses based on buildings, some researchers select several study sites, each containing a single land use type, to represent the variety of urban land uses and to examine their characteristic differences based on selected properties associated with each land use. Wu et al. (2006) selected two pure test images for each of the five building land-use types (mobile home, single family, multi-family, commercial, and industry) and explored the response of land-use classification based on variogram analysis by alternating critical input parameters such as the widow size and lag value. To test the possibility of separating residential and non-residential buildings, Barr et al. (2004) selected several residential and industrial zones containing single land use type, applied the graphical structural analysis software SAMS based on building vectors to examine the statistical characteristics of building parameters such as area, compactness, degree, and distance, and evaluated the building-level land-use separability based on the Mann-Whitney U-test. A similar test was applied to a lidar-derived building map instead of the existing building data (Barnsley et al., 2003) and accompanying land-cover vector data (Barnsley and Barr, 1997).
This study explores the possibility of improving urban land-use classification by basing classifications on buildings and building-associated attributes derived from remotely sensed imagery. Using lidar imagery, a road network map, and vegetation index data derived from high-resolution spectral imagery, we test three methods to detect buildings and building-associated attributes, and to identify residential buildings using an object-oriented supervised decision tree classification algorithm. The following sections present the study site, and describe the data and three-step methodology used to identify residential buildings.
STUDY SITE AND DATA COLLECTION
Austin is the Texas State capital and is the state’s fourth-largest city with a population of 709,893 according to the 2006 estimation (United State Census Bureau, 2009). Austin is located between the three largest cities in Texas, Dallas, Houston, and San Antonio, and has been a migrant population destination in recent decades (City of Austin, 2009). In fact, Austin is the third fastest growing city in the nation based on censuses from 2000 to 2006 (Christie, 2007). Since the 2000 general population census, the trend of rapid urbanization has increased in Austin with tremendous building development and change within and around the city and along the two major highways, U.S. Interstate Highway 35 (IH-35) and the Texas State Highway Loop 1. The 8.24 km2 study site for this research is located in the southern part of the city and contains various land-use types including downtown commercial areas, residential zones with dense trees, part of the campus of the University of Texas at Austin, government buildings, and IH-35 (Figure 1).
This research utilizes three data sources to develop and test a new approach to directly identify buildings and infer land-use information based on building-associated attributes: (1) lidar data (2) a six-inch resolution digital aerial photograph, and (3) a road map. The raw lidar data was generated in 2000 through the Optech ALTM lidar sensor and contains three components: the first return, the last return, and intensity (City of Austin, 2009). The first return measures the laser backscatters from the surface of objects and is often used to generate ground surface models. The last return measures the last backscatters from where laser beams can reach because laser beams can penetrate deeper in vegetation canopies. The lidar dataset has an average density of three points per square meter in this urban area. For this research we first apply an outlier removal process based on Delaunay Triangulation to filter out random noises that may be backscatter from birds, airplanes or other objects and then transform the point clouds into a 1-meter resolution raster data by assigning the elevation of the nearest point found within a specified distance of the pixel. No-data value is assigned when no points are found within the specified distance (Meng, Wang, Silván-Cárdenas, and Currit, 2009; Meng, 2005).
The original six-foot aerial photograph was collected in 2000 with three visible bands and a near-infrared band (City of Austin, 2009). We resample the six-foot resolution photograph to one-meter resolution imagery using cell locations that match the lidar dataset. Then we calculate the standard Normalized Difference Vegetation Index (NDVI) based on red and near-infrared bands (Jensen, 2000). In this research, we manually generate a year-2000 road map by referencing the available 2003 road network file to the year-2000 aerial photograph and utilize the major road surfaces coded as 210 (edge of pavement) to calculate the distance from buildings to the nearest major roads.

ASPRS 2010 Annual Conference San Diego, California ♦ April 26-30, 2010
Figure 1. Study site location in Austin, Texas.
DETECTING RESIDENTIAL BUILDINGS FROM LIDAR AND AERIAL PHOTOGRAPHS
The first step in our methodology is to filter the ground surface from the lidar data, leaving tall object that are potentially buildings, trees and others. We use the Multi-Directional Ground Filtering (MGF) algorithm for this purpose. Second, we detect actual buildings from the lidar-based potential buildings and the NDVI data. We use a morphology-based building detection algorithm for this task. Finally, we identify seven building attributes and classify residential buildings using the supervised C4.5 algorithm. Figure 2 outlines the conceptual design of the proposed framework. The methodology proposed and tested for the final step is heretofore untested. Multi-Directional Ground Filtering The Multi-Directional Ground Filtering (MGF) algorithm illustrated as in Figure 3 was previously tested on 15 urban and rural sites using ground reference data provided by the International Society for Photogrammetry and Remote Sensing (ISPRS) (Sithole and Vosselman 2004) (Meng, Wang, Silván-Cárdenas, and Currit 2009). Compared to the performance of eight other algorithms, the MGF algorithm was the second best overall and the best performing algorithm for three study sites (Sithole and Vosselman, 2004). We found that the MGF algorithm was robust to two commonly required parameters – slope and elevation difference, and operated especially well in urban environments. Therefore, we apply the MGF algorithm to the Austin study site in this research to filter the ground surface and generate a Digital Elevation Model (DEM).

ASPRS 2010 Annual Conference San Diego, California ♦ April 26-30, 2010
Morphology-Based Building Detection
After ground filtering and DEM generation, we apply a modified morphology-based building detection method to separate buildings from non-buildings. Meng, Wang, and Currit (2009) originally developed this method to extract buildings from lidar without the aid of aerial photographs. In this research, we incorporate NDVI data derived from a four-band digital aerial image into the morphology-based building detection algorithm to facilitate the removal of dense trees and improve the accuracy of the building detection process (Figure 4).
After applying the MGF algorithm to remove ground pixels, the remaining pixels at the Austin site are mainly composed of vegetation, buildings, and other objects like short walls and vehicles. Buildings differ from other objects in size, shape, height, and texture. Elevation differences based on the differences between the lidar first and last returns are important indicators of tall vegetation and are used to separate buildings from trees. The morphology-based building detection method we use performs three pixel-based building structure operations to break non-building blocks into smaller fragments. A building recovery process then refills holes in buildings for pixels wrongly removed in the previous steps. Finally, we convert building candidates into vectors, and then an object-based analysis further removes non-building parcels with minimum area and compactness thresholds. Object-Oriented Building Urban Land-Use Classification
Identifying building land uses from the buildings derived from remotely sensed imagery involves three steps: selecting land-use indicators associated with buildings, calculating land-use indicator statistics, and performing the land-use classification. Trained image interpreters can visually identify building land-use functions utilizing certain context analyses, which include color, size, shape, texture, green space, parking space, the distance to roads, and others. Human eyes have the special ability to naturally group image features as objects and identify land uses based on a complex decision making system; however, a human designed automated system may not be able to easily identify those indicators or other ancillary information (Quackenbush, 2004). An alternative approach is to learn from the human visual identification process and simplify the process to make it feasible for automated simulation. Single-family residential, multi-family residential and non-residential buildings usually have some common characteristics in developed countries (Barnsley et al., 2003; Jensen, 2000). Important characteristics of US residential and non-residential buildings are listed in Table 1. Because not every characteristic is detectable directly from remotely sensed imagery or available from existing GIS data, we select characteristics from Table 1 that are detectable from remotely sensed imagery or ancillary data sources (Table 2). For example, green spaces, such as grass and trees, often surround residential buildings. Parking lots or concrete surfaces tend to be found surrounding
Building detection
Lidar ground filtering
Lidar data Aerial Photograph
NDVI calculation
Object-oriented building land-use classification
Figure 2. Conceptual design of the building-based object-oriented land-use classification.
Ground filtering and B
uilding detection
Building land-use classification results

ASPRS 2010 Annual Conference San Diego, California ♦ April 26-30, 2010
commercial or industrial buildings compared to residential buildings. Additionally, commercial buildings are usually relatively closer to major roads so as to reduce the cost of transportation and attract customers. Because land-use characteristics differ from region to region and from developed to developing countries, it is important to understand the characteristics that identify local building types and incorporate them into the residential building classification process.
> Zt
≤ Zt
≥0 & ≤St
< 0
> St Not available
≤ Zt
Input point
> Zt Label as Non-ground Calculate |Ecurrent-ElocalMinimum |
Calculate slope Do nothing
Label as previous point
Calculate Ecurrent-EnearestGround
Label as ground
Figure 3. Flow chart of the labeling process of the MGF algorithm. St is the threshold of the maximum ground elevation, and Zt is the threshold of the maximum ground elevation difference (from Meng, Wang, Silván-Cárdenas, and Currit, 2009).

ASPRS 2010 Annual Conference San Diego, California ♦ April 26-30, 2010
Figure 4. Flow chart of the modified morphology-based building detection.
We then design seven statistics associated with each building as illustrated in Figure 5 based on detectable characteristics in Table 2 and use the statistics to classify residential and non-residential buildings. These seven statistics include three building-based attributes that were calculated in the building detection process: (1) area, (2) height, and (3) compactness. The other four statistics are based on the building’s spatial context and adjacency relationships, including (4) the shortest distance to the major roads, (5) the area of green space within a buffer distance of existing buildings, (6) the area of parking spaces within a buffer distance of existing buildings, and (7) the block building density. The definition of block building density in this research is calculated by dividing the number of buildings within a block by the area of the block, where a block is defined as the polygon surrounded by street.
We classify buildings as residential or non-residential by using the seven building-associated statistics as inputs to the C4.5 decision tree classifier. This research selects the C4.5 decision tree classifier, which is used in a variety of land classification applications (Rogan et al., 2008; Homer et al., 2004; Friedl et al., 1999). The C4.5 decision tree classifier was first introduced in computer science utilizing information theory to automatically generate splitting nodes for decision tree analysis (Quinlan, 1993). The algorithm use the gain ratio as in equation 1 to determine splitting thresholds
gain ratio(X)=gain(X)/split info(X) (1) where gain(X) is the measurement of information entropy loss when attribute X is chosen for the test to divide and split info(X) measures the estimated information generated after assigning training samples to n classes. For algorithm details, see Quinlan (1993). The output of the C4.5 algorithm is a set of rules for distinguishing residential and non-residential buildings, as well as reliability statistics.
First-Last First-DEM
NDVI Building structure filtering
Building recovering
Area Compactness
Building Candidates
Lidar first return
Ground filtering
Ground Non-ground
DEM generation
DEM
Lidar last return NDVI

ASPRS 2010 Annual Conference San Diego, California ♦ April 26-30, 2010
Table 1. Characteristics of Different Building Land-use Types in Developed Countries
Single-family house
• A single driveway • One front sidewalk leading to the front door a front yard • A backyard (often fenced) • A garage or car port. • It is usually ≤3 stories in height. • Space between houses • Building density • Roof types • Size • Distance to major roads
Single-family residential
Small Mobile-home
• Much smaller than other single-family homes • Rarely have a garage (but may have a carport) • May or may not have a paved driveway or sidewalk. • Roofs can be flat or pitched
Multi-family residential
Multi-family residential
• Large collective above- or below-ground parking garages, parking lots, or concrete ground covers
• May be ≥2 stories in height • Share front or back yards • Green spaces • Outside swimming pools • Some have fences • Recreation courts • Similar building shape and size • More than one sidewalk • Some are in residential areas and are usually surrounded
by residential buildings • Distance to major roads
Large
• Large building sizes • Next to large or small non-residential buildings • Along major roads • Huge open parking spaces in rural areas • High-rise buildings in downtown • May have multiple AC units Non-
residential
Smaller
• Size may equal or larger than single-family house • Some storage or equipment room maybe smaller • Along major roads or at intersections • Next to non-residential buildings • Shared parking lots or no parking lots in downtown
Table 2. Filtered Elements and Characteristics for Building Land-Use Classification
Target elements Source Selected characteristics
Buildings Detected Height, area, roof type, distance to the closest building, census block building density and building size diversity within a block
Green spaces Detected Size: small, middle, and large grass or trees Water bodies Detected Size, shape Parking lots or concrete ground covers Detected Size, area Roads GIS data Classified roads from GIS data, two or three classes

ASPRS 2010 Annual Conference San Diego, California ♦ April 26-30, 2010
Figure 5. Conceptual framework of the decision tree building-based land-use classification.
AUSTIN SITE VERIFICATION
We design this object-oriented building land-use classification method to directly detect residential buildings from remotely sensed imagery for wide applications. However, proper verification process is necessary to adapt this method to local environment for the selection of parameters. In this research, the verification processes involve three procedures corresponding to ground filtering, building detection and building land-use classification.
For the ground filtering process, our previous research tested the multi-directional ground filtering process on the fifteen study sites provided by ISPRS website and indicated a 3×3 window size for the local minimum elevation search (Meng, Wang, Silván-Cárdenas, and Currit 2009). In order to validate the ground filtering process in Austin site, we apply the MGF algorithm to another 0.016 km2 Austin site from the same year-2000 lidar data source (Figure 6). We select the ground filtering parameters when the algorithm achieves the highest accuracy based on a ground truth data generated by manual editing referencing to segmentation and a field survey on May 7, 2005 (Meng, 2005). Then we apply the ground filtering process to the 8.24 km2 study site using a slightly adjusted parameters based on visual inspection.
For the building detection verification, we validated the morphology-based building detection process on a 0.67 km2 Austin site from the same lidar source (Meng, Wang, and Currit, 2009). We evaluated the building detection performance in the Austin area base on a building map and field trip in 2007. We then applied the NDVI-integrated method as in Figure 4 to the bigger study site using those parameters and a 0.2 NDVI threshold. A smaller compactness threshold is necessary in the bigger site because of the smaller residential buildings on the right part.
Spatial statistic calculation and classification accuracy evaluation are the major procedure for validation of the building land-use classification. When calculating statistics, we applied the polygon road map from the City of Austin to extract major roads and blocks. Major roads were used to calculate the distance from buildings to the nearest major roads. We calculated the area of ground parking spaces within a 10-meter buffer distance to each building based on the potential ground parking spaces after removing roads and vegetation from the lidar ground filtering results. Polygons surrounded by roads served as blocks to calculate block building density by dividing the number of buildings within a block by the area of the block. To calculate the area of greenness within a buffer distance, we calculated NDVI using the red and near-infrared bands of the multispectral image and applied a
ASPRS 2010 Annual Conference San Diego, California ♦ April 26-30, 2010
threshold of 0.2 to filter out green areas including trees and grass. Then we calculated the area of green space within a 10-meter buffer distance to buildings. To assess the performance of the building land-use classification, we randomly selected training and testing sets from the lidar-derived building map and surveyed the building land-use properties based on a field trip in December of 2008.
RESULTS AND DISCUSSION
Our ground filtering validation process yields a 97.4% overall accuracy and a 0.95 Kappa coefficient on the test site in figure 6 using a 30º for the maximum ground slope, 0.5 meters for the elevation difference, and scanning directions from right to left and then from top to bottom (see Figure 8). The errors of the MGF algorithm are mainly distributed on object boundaries as indicated in Figure 8 (Meng, 2005). We then apply the MGF ground filtering process to the 8.24 km2 study site by slightly adjusting parameters based on visual inspection, especially on some spots that were troublesome to identify. Ground filtering findings indicate a reliable result using 30º for the maximum ground slope, 0.7 meters for the elevation difference, and scanning directions from each cardinal direction. Figure 9 is the interpolated lidar first return and Figure 10 is the MGF ground filtering result, where black stands for non-ground pixels and the rest stands for ground pixels rendered based on elevation.
In the building detection process, we applied the morphology-based building detection method on the lidar first and last returns of the building test site using a 0.2-meter threshold for the elevation difference between the first and last return, a 2-meter height threshold to remove off-terrain objects lower than the minimum building height, and a 40-m2 area threshold to remove objects smaller than the minimum building size. Figure 11 is the final building detection results, and the accuracy assessments yield a 95.46% overall accuracy and a 0.89 Kappa coefficient (Meng, Wang, and Currit, 2009). For the bigger site with the aid of NDVI from aerial photographs, we applied the modified morphology-based building detection method as in Figure 4 using the same parameters listed above, a 0.2 NDVI threshold, and a smaller compactness threshold. Figure 12 is the results of final building candidates overlaid on top of the first return lidar image of the bigger study site. The results show that this method successfully identifies most buildings. A few buildings, such as storage outbuildings, that are smaller than the minimum building threshold may be reasonably removed from the building candidates based on our previous study (Meng, Wang, and Currit, 2009).
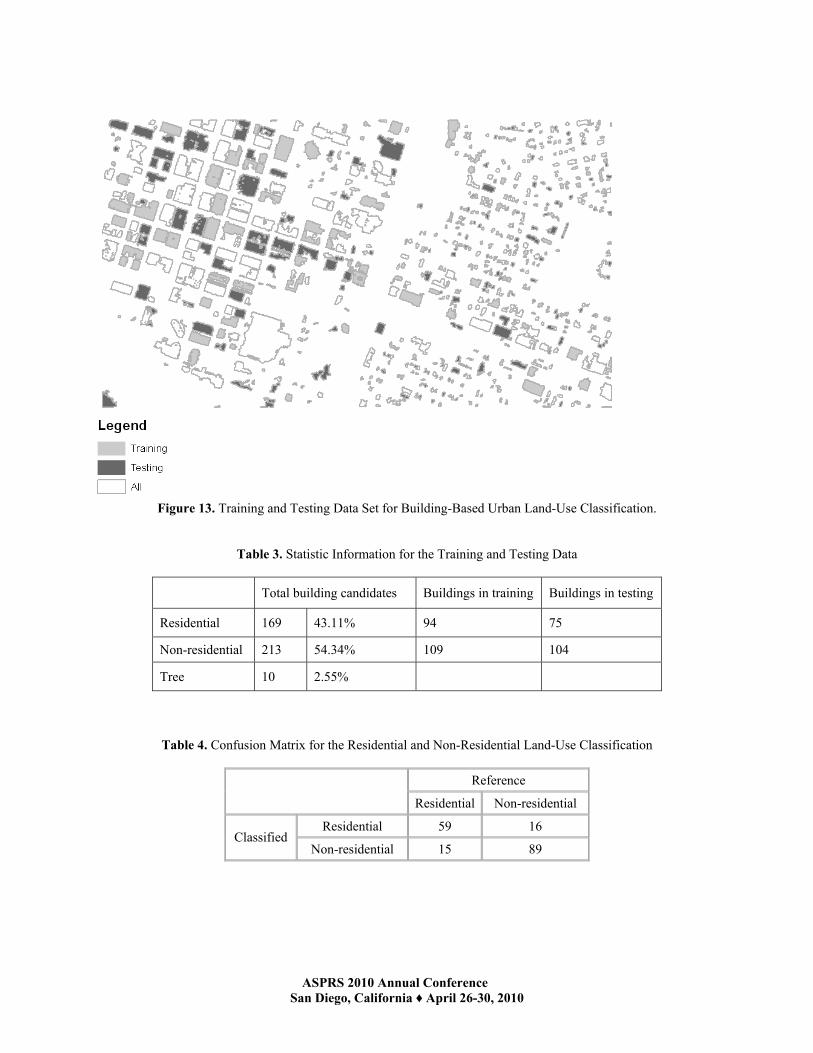
In the building land-use classification process, we calculated the seven spatial statistics after deriving building footprint vectors in previous processes and applied a supervised building land-use classification based on a random training and test samples. Table 3 lists the number of buildings in both training and testing sets, and indicates that around 10 tree polygons were not removed from the buildings – about 2.55% of the sampled building set. Figure 13 shows the spatial distribution of the training and testing sets over the whole study site. After running the C4.5 decision tree classification, this experiment reported 82.68% for the overall accuracy, 79.73% for residential buildings, and 84.76% for non-residential buildings. Table 4 shows the confusion matrix with the number of buildings for residential and non-residential buildings.
Overall, this research applied a three-step approach to directly detect buildings and separate residential buildings from remotely sensed imagery. Our test on the 8.24 km2 Austin study site successfully detected almost 80% of the residential buildings based on three data sources: lidar data, aerial photographs and road maps.

ASPRS 2010 Annual Conference San Diego, California ♦ April 26-30, 2010
Figure 6. Interpolated Lidar first return image for ground filtering validation (Meng, 2005).
Figure 7. The lidar first return and building ground truth data overlay (size is changed for displaying purpose) (Meng, Wang, and Currit, 2009).

ASPRS 2010 Annual Conference San Diego, California ♦ April 26-30, 2010
(A) Ground truth data (B) The MGF ground filtering result
(C) Non-ground errors (D) Ground errors
Figure 8. Ground filtering results and error spatial distribution (modified from Meng, 2005).

ASPRS 2010 Annual Conference San Diego, California ♦ April 26-30, 2010
Figure 9. Interpolated Lidar first return.
Figure 10. Ground filtering results from the interpolated first return image. White stands for ground feature rendered in elevation and black represents non-ground features.

ASPRS 2010 Annual Conference San Diego, California ♦ April 26-30, 2010
Figure 11. Building detection results for the building detection test site.
Figure 12. Building detection results overlain on top of the lidar first return image of the study site.
ASPRS 2010 Annual Conference San Diego, California ♦ April 26-30, 2010
Figure 13. Training and Testing Data Set for Building-Based Urban Land-Use Classification.
Table 3. Statistic Information for the Training and Testing Data
Total building candidates Buildings in training Buildings in testing
Residential 169 43.11% 94 75
Non-residential 213 54.34% 109 104
Tree 10 2.55%
Table 4. Confusion Matrix for the Residential and Non-Residential Land-Use Classification
Reference
Residential Non-residential
Residential 59 16 Classified
Non-residential 15 89

ASPRS 2010 Annual Conference San Diego, California ♦ April 26-30, 2010
CONCLUSIONS
Land-use classification is a challenging task in urban remote sensing, especially for residential land uses. Residential land uses relate closely to human activities and population distribution and have attracted a growing concern in urban land-use studies. Researchers have explored more pixel- and parcel-based approaches but little about object-oriented methods. Furthermore, ancillary land-use information or census population data are often necessary to improve urban land-use classification as land-use types relate less directly to physical reflectance of remotely sensed imagery. We then propose a three-step approach to directly detect buildings and separate residential buildings from remotely sensed imagery based on three data sources: lidar data, aerial photographs and road maps.
We proposed three new methods to fulfill this object-oriented urban land-use mapping task: a multi-directional ground filtering (MGF) algorithm, a morphology-based building detection method, and an object-oriented building land-use classification. In the experiments based on sites in Austin, Texas, this research applied the MGF algorithm to separate ground from other features in lidar data and generate bare Earth DEM model, utilized the morphology-based building detection method to extract buildings from lidar data and aerial photographs, and then designed an object-oriented building-based urban land-use classification approach to separate residential buildings.
In the building-based land-use classification process, we designed and calculated seven spatial statistics associated with buildings to characterize land-use types. The statistics are (1) building area, (2) height, (3) compactness, (4) the distance to major roads, (5) the area of green spaces within a buffer distance, (6) the area of parking space within a buffer distance, and (7) the building density within a block. We then applied the supervised C4.5 decision tree classification method to separate residential and non-residential buildings. Verification of results was based on a random-sample gathered in the field. Based on the experiment, around 2.55% of buildings were actually trees that the building detection method failed to remove. The building-based classification method, however, successfully identified 79.73% of the residential buildings. Furthermore, the experimented verification processes provide practically value to adapt these methods to local environment for large area DEM, building, and building land-use mapping for various applications.
ACKNOWLEDGEMENT
This study was supported by grants to Le Wang from the National Science Foundation (BCS-0822489).
REFERENCES
Aplin, P., P. Atkinson, and P. Curran, 1999. Fine spatial resolution simulated satellite sensor imagery for land cover mapping in the United Kingdom, Remote Sensing of Environment, 68(3): 206-216.
Barnsley, M.J., and S.L. Barr, 1996. Inferring urban land use from satellite sensor image using Kernel-based spatial
Reclassification, Photogrammetric Engineering & Remote Sensing, 62(8): 949-958. Barnsley, M.J., and S.L. Barr, 1997. Distinguishing urban land-use categories in fine spatial resolution land-cover
data using a graph-based, structural pattern recognition system, Computers, Environment and Urban Systems, 21(3/4): 209-225.
Barnsley, M.J., L. Møller-Jensen, and S.L. Barr, 2001. Inferring urban land use by spatial and structural pattern Recognition, In Remote sensing and urban analysis (J. Donnay, M.J. Barnsley, and P.A. Longley, editors). Taylor & Frances, London, pp. 115-144.
Barnsley, M. J., A.M. Steel, and S.L. Barr, 2003. Determining urban land use through an analysis of the spatial composition of buildings identified in LIDAR and multispectral image data, In Remotely Sensed Cities (V. Mesev, editor), Taylor & Frances, New York, pp. 83-108.
Barr, S., M.J. Barnsley, and A. Steel, 2004. On the separability of urban land-use categories in fine spatial scale land-cover data using structural pattern recognition, Environment and Planning B:Planning and Design, 31: 397-418.
Bauer, T., and K. Steinnocher, 2001. Per parcel land use classification in urban areas applying a rule-based Technique, GeoBIT/GIS, 6: 24-27.

ASPRS 2010 Annual Conference San Diego, California ♦ April 26-30, 2010
Bruzzone, L., and L. Carlin, 2006. A multilevel context-based system for classification of very high spatial resolution images, IEEE Transactions on Geoscience and Remote Sensing, 44(9): 2587-2600.
Christie, L., 2007. The Fastest Growing U.S. Cities, CNNMoney.com, URL: http://money.cnn.com/2007/06/27/ real_estate/fastest_growing_cities/, Cable News Network (last date accessed 5 April 2009).
City of Austin, 2009. Austin, Texas: Basic Facts, URL: http://www.ci.austin.tx.us/citymgr/basicfac.htm (last date accessed 5 April 2009).
Frate, F.D., F. Pacifici, G. Schiavon, and C. Solimini, 2007. Use of neural networks for automatic classification from high-resolution images, IEEE Transactions on Geoscience and Remote Sensing, 45(4): 800-809.
Friedl, M.A., C.E. Brodley, and A.H. Strahler, 1999. Maximizing land-cover classification accuracies produced by decision trees at continental to global scales, IEEE Transactions on Geoscience and Remote Sensing, 37(2): 969−977.
Gong, P., and P.J. Howarth, 1992. Freqency-based contextual classification and gray-level vector reduction for land-use identification, Photogrammetric Engineering & Remote Sensing, 58(4): 423-437.
Herold, M., X. Liu, and K. Clarke, 2003. Spatial metrics and image texture for mapping urban land use, Photogrammetric Engineering & Remote Sensing, 69(6): 991-1001.
Homer, C., C. Huang, L. Yang, B. Wylie, and M. Coan, 2004. Development of a 2001 national land-cover database for the United States, Photogrammetric Engineering & Remote Sensing, 70(3): 829−840.
Houghton, R.A., 1994. The worldwide extent of land-use change, Bioscience, 44(5): 305-313. Huang, X., L. Zhang, and P. Li, 2008. Classification of very high spatial resolution imagery based on the fusion of
edge and multispectral information, Photogrammetric Engineering & Remote Sensing, 74(12): 1585-1596. Jensen, J., 2000. Remote Sensing of the Environment: An Earth Resource Perspective, Prentice Hall, Saddle River. Lu, D., and Q. Weng, 2006. Use of impervious surface in urban land-use classification, Remote Sensing of
Environment, 102: 146-160. Martin, L., P.J. Howarth, and G. Holder, 1988. Multispectral classification of land use at the urban-rural fringe
using SPOT satellite data, Canadian Journal of Remote Sensing, 14: 72-79. Meng, X., 2005. A slope- and elevation-based filter to remove non-ground measurements from airborne LIDAR
Data, UCGIS Summer Assembly, June 28-July 1, 2005, Jakson Hole, Wyoming. Meng, X., L. Wang, N. Currit, 2009. Morphology-based building detection from airborne LIDAR data,
Photogrammetric Engineering & Remote Sensing, 75(4): 427-442. Meng, X., L. Wang, J.L. Silván-Cárdenas, N. Currit, 2009. A multi-directional ground filtering algorithm for
airborne LIDAR, ISPRS Journal of Photogrammetry and Remote Sensing, 64(1): 117-124. Myint, S.W., 2003. The use of wavelets for feature extraction of cities from satellite sensor images, In Remotely
Sensed Cities (V. Mesey, editor). Taylor & Frances, New York, pp. 109-134. Pacifici, F., M. Chini, and W.J. Emery, 2009. A neural network approach using multi-scale textural metrics from
very high-resolution panchromatic imagery for urban land-use classification, Remote Sensing of Environment, 113: 1276-1292.
Quackenbush, L.J., 2004. A review of techniques for extracting linear features from imagery, Photogrammetric Engineering & Remote Sensing, 70(12): 1383-1392.
Quinlan, J.R., 1993. C4.5: Programs for Machine Learning, Morgan Kaufmann Publishers. Rogan, J., J. Franklin, D. Stow, J. Miller, C. Woodcock, and D. Roberts, 2008. Mapping land-cover modifications
over large areas: a comparison of machine learning algorithms, Remote Sensing of Environment, 112(5): 2272-2283.
Sithole, G., Vosselman, G., 2004. Experimental comparison of filter algorithms for bare earth extraction from airborne laser scanning point clouds, ISPRS Journal of Photogrammetry and Remote Sensing, 59 (1_2): 85-101.
United States Census Bureau, 2009. States & County Quickfacts. URL: http://quickfacts.census.gov/qfd/states/48/4805000.html (last date accessed 5 April 2009).
Wu, S., 2006. Incorporating GIS and remote sensing for census population desegregation, PhD Dissertation, Texas State University-San Marcos. 130p.
Wu, S., B. Xu, and L. Wang, 2006. Urban land-use classification using variogram-based analysis with an aerial Photograph, Photogrammetric Engineering & Remote Sensing, 72(7): 813-822.
Zhan, Q., M. Molenaar, and B. Gorte, 2000. Urban land use classes with fuzzy membership and classification Based on integration of remote sensing and GIS, International Archives of Photogrammetry and Remote Sensing, 33: 1751-1759.