observation -based study on aerosol optical depth and
TRANSCRIPT
Observation-based study on aerosol optical depth and particle size in partly cloudy 1
regions 2
T. Várnai1,2, A, Marshak2, and T. F. Eck3,4 3
1Joint Center for Earth System Technology, University of Maryland Baltimore County. 4
2Climate and Radiation Laboratory, NASA Goddard Space Flight Center. 5
3Universities Space Research Association. 6
4Biospheric Sciences Laboratory, NASA Goddard Space Flight Center. 7
8
Corresponding author: Tamás Várnai ([email protected]) 9
10
Key Points: 11
• Correlation between cloud cover and aerosol optical depth is positive at most locations12
except deserts, for all seasons and aerosol types.13
• Increased cloudiness is associated with populations of either smaller or larger aerosol14
particles.15
• Quality assessment flags based on local variability help identifying aerosol populations16
affected by surrounding clouds.17
18

2
Abstract 19
This study seeks to help better understand aerosol-cloud interactions by examining statistical 20
relationships between aerosol properties and nearby low-altitude cloudiness using satellite data. 21
The analysis of a global dataset of MODIS (Moderate Resolution Imaging Spectroradiometer) 22
observations reveals that the positive correlation between cloudiness and aerosol optical depth 23
(AOD) reported in earlier studies is strong throughout the globe and during both winter and 24
summer. Typically, AOD is 30-50% higher on cloudier-than-average days than on less cloudy 25
days. A combination of satellite observations and MERRA-2 global reanalysis data reveals that 26
the correlation between cloud cover and AOD is strong for all aerosol types considered: sulfate, 27
dust, carbon, and sea salt. 28
The observations also indicate that in the presence of nearby clouds, aerosol size distributions 29
tend to shift toward smaller particles over large regions of the Earth. This is consistent with a 30
greater cloud-related increase in the AOD of fine mode than of coarse mode particles. The 31
greater increase in fine mode AOD implies that the cloudiness-AOD correlation does not come 32
predominantly from cloud detection uncertainties. Additionally, the results show that aerosol 33
particle size increases near clouds even in regions where it decreases with increasing cloudiness. 34
This suggests that the decrease with cloudiness comes mainly from changes in large-scale 35
environment, rather than from clouds increasing the number or the size of fine mode aerosols. 36
Finally, combining different aerosol retrieval algorithms demonstrated that quality assessment 37
flags based on local variability can help identifying when the observed aerosol populations are 38
affected by surrounding clouds. 39
40
41
42
3
1 Introduction 43
Clouds, aerosols, and their interactions are among the largest sources of uncertainty in 44
estimating human impacts on climate. As stated in the Intergovernmental Panel on Climate 45
Change 5th Assessment Report (IPCC AR5, 2013) Chapter 7, “Clouds and aerosols continue to 46
contribute the largest uncertainty to estimates and interpretations of the Earth’s changing 47
energy budget ... the quantification ... of aerosol–cloud interactions continues to be a challenge.” 48
Satellite observations have helped improve our understanding of aerosol-cloud 49
interactions by providing observations on the relationships between aerosol and cloud properties. 50
For example, analyzing a 4-year long global dataset of satellite observations, Loeb and Manalo-51
Smith (2005) found a positive correlation between cloud fraction (CF) and aerosol optical depth 52
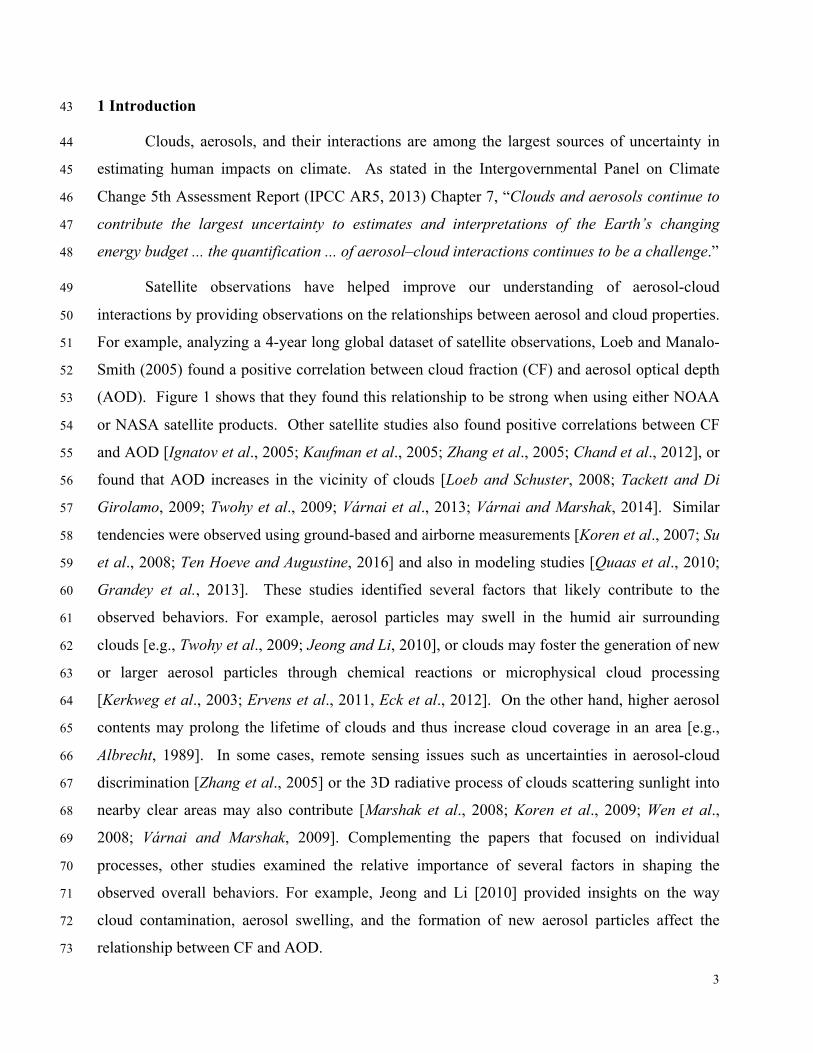
(AOD). Figure 1 shows that they found this relationship to be strong when using either NOAA 53
or NASA satellite products. Other satellite studies also found positive correlations between CF 54
and AOD [Ignatov et al., 2005; Kaufman et al., 2005; Zhang et al., 2005; Chand et al., 2012], or 55
found that AOD increases in the vicinity of clouds [Loeb and Schuster, 2008; Tackett and Di 56
Girolamo, 2009; Twohy et al., 2009; Várnai et al., 2013; Várnai and Marshak, 2014]. Similar 57
tendencies were observed using ground-based and airborne measurements [Koren et al., 2007; Su 58
et al., 2008; Ten Hoeve and Augustine, 2016] and also in modeling studies [Quaas et al., 2010; 59
Grandey et al., 2013]. These studies identified several factors that likely contribute to the 60
observed behaviors. For example, aerosol particles may swell in the humid air surrounding 61
clouds [e.g., Twohy et al., 2009; Jeong and Li, 2010], or clouds may foster the generation of new 62
or larger aerosol particles through chemical reactions or microphysical cloud processing 63
[Kerkweg et al., 2003; Ervens et al., 2011, Eck et al., 2012]. On the other hand, higher aerosol 64
contents may prolong the lifetime of clouds and thus increase cloud coverage in an area [e.g., 65
Albrecht, 1989]. In some cases, remote sensing issues such as uncertainties in aerosol-cloud 66
discrimination [Zhang et al., 2005] or the 3D radiative process of clouds scattering sunlight into 67
nearby clear areas may also contribute [Marshak et al., 2008; Koren et al., 2009; Wen et al., 68
2008; Várnai and Marshak, 2009]. Complementing the papers that focused on individual 69
processes, other studies examined the relative importance of several factors in shaping the 70
observed overall behaviors. For example, Jeong and Li [2010] provided insights on the way 71
cloud contamination, aerosol swelling, and the formation of new aerosol particles affect the 72
relationship between CF and AOD. 73
4
74
Figure 1. Relationship over global oceans between regional cloud fraction and mean aerosol 75
optical depth. This figure is a reproduction of Fig. 6a in Loeb and Manalo-Smith [2005]. Both 76
curves are based on data from the Terra satellite’s MODIS instrument, but they were obtained 77
using two different cloud masking algorithms: a NOAA algorithm and the NASA algorithm used 78
for producing the operational aerosol product. 79
80
Despite the numerous insights provided by such studies, some important questions still 81
remain. This paper examines two such questions: (i) How does the CF-AOD relationship vary 82
with location and aerosol type? (ii) What is the relationship between cloudiness and aerosol 83
particle size distributions? (We note that, in addition to being important for radiative transfer 84
and other physical and chemical processes, particle size is also a key factor in the aerosol index 85
that is becoming more commonly used in aerosol-cloud studies (e.g., Chen et al., 2014).) These 86
questions are addressed through a statistical analysis of MODIS (Moderate Resolution Imaging 87
Spectroradiometer) observations, sometimes in conjunction with MERRA-2 (Modern-Era 88
Retrospective analysis for Research and Applications, Version 2) global reanalysis data on 89
aerosol properties. First, Section 2 examines the relationship between cloud fraction and aerosol 90
optical depth, then Section 3 examines cloud-related variations in aerosol particle size. Finally, 91
Section 4 provides a brief summary. 92
93
Cloud Fraction (%)
0.64
4-µm
Aer
osol
Opt
ical
Dep
th

5
2 Relationship between cloud fraction and aerosol optical depth 94
Let us begin by analyzing the statistical relationship between CF and AOD (at 550 nm) 95
using the MODIS Aqua Level 3 joint atmospheric product (Collection 6 version of MYD08 96
product files, see Platnick et al. [2015]). This product provides daily average values of aerosol 97
and cloud properties on a 1° by 1° horizontal grid covering the whole globe. (At low to mid 98
latitudes this daily average comes from a single observation in the early afternoon.) Our study 99
uses daytime average values for June-July-August (JJA) and December-January-February (DJF) 100
from 2012 to 2014. We note that our analysis does not use observations that indicate complete 101
cloud cover or completely clear sky in an area, due the lack of aerosol or cloud data on such 102
days. Also, in order to focus on aerosol-cloud interactions for low clouds, data values were used 103
only when the MODIS-estimated mean cloud top height of a partly cloudy grid box [e.g., Baum 104
et al., 2012] was below 3 km. While this altitude limit eliminates the consideration of high 105
clouds that are irrelevant to aerosols that occur mostly at lower altitudes, we note that some 106
eliminated clouds that have high tops but low cloud base may have even greater influence on 107
aerosols than the thinner, low-level clouds considered in this study. 108
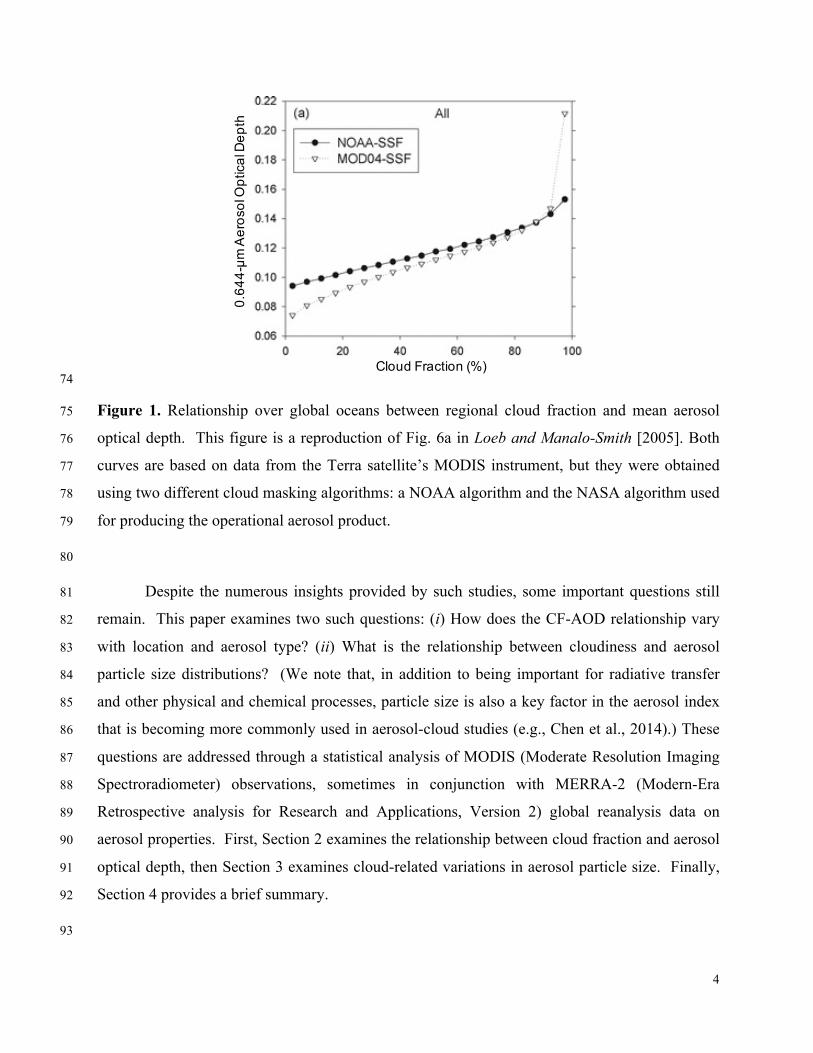
Figure 2a shows that the correlation between daily daytime average CF and AOD values 109
for June, July, and August (JJA) is positive over much of the globe, with the exception of some 110
desert areas. Panel b then shows that over most areas, AOD is substantially higher—typically by 111
30-50%—on days when the cloud cover exceeds the local seasonal average than on days when 112
cloud cover is below average. The results indicate that the global overall and regional 113
relationships found in earlier studies truly extend over most of the globe (as opposed to coming 114
either from a few dominating regions, or from some regions of the Earth being systematically 115
both cloudier and more aerosol-laden than others). Also, the results are consistent with the 116
results of Loeb and Schuster [2008], who found that cloud cover tended to be higher on more 117
aerosol-laden days. We note that the results are similar for December, January, and February 118
(DJF), though DJF data covers polar regions in the southern rather than northern hemisphere, due 119
to seasonal changes in illumination and snow cover. 120
In order to examine how the CF-AOD relationship depends on aerosol type, we combine 121
the MODIS data with aerosol type information from the MERRA-2 global reanalysis. The 122
reanalysis data is provided by the GEOS-5 (Goddard Earth Observing System Model, Version 5) 123
6
global model that incorporates the GOCART (Goddard Chemistry, Aerosol, Radiation, and 124
Transport) aerosol model [Chin et al., 2002]. GOCART keeps track of five aerosol species: black 125
and organic carbon, dust, sea salt, and sulfates. For simplicity, our analysis combines the black 126
and organic carbon species into a single category. We note that while GOCART assimilates 127
observations of aerosol amounts from MODIS, the distribution of various aerosol species comes 128
from the model itself. 129
130
Figure 2. Geographical distribution of the relationship between cloud fraction and mean aerosol 131
optical depth (at 550 nm) in JJA. (a) Map of CF-AOD correlation. (b) and (c) Maps of the 132
relative and absolute differences between AOD values measured on days when cloud cover was 133
higher or lower than the median cloud cover of each location. 134
135
a
CorrelationofAOD&CF
a
RelativedifferenceAOD(highCF)– AOD(lowCF)
AOD(allCF)
b c
AbsolutedifferenceAOD(highCF)– AOD(lowCF)

7
Figure 3 shows the CF-AOD correlation derived from the MODIS data, but considering 136
only those days when MERRA-2 indicated that a certain aerosol type dominated in the region 137
(providing more than 50% of the total AOD in MERRA-2). Naturally, this means that 138
observations from days with multiple evenly mixed aerosol types were not used. Moreover, the 139
maps constructed separately for each aerosol type have large empty areas where the particular 140
aerosol type never dominated. Overall, the results show a strong CF-AOD correlation for all 141
aerosol types, even for the relatively less hygroscopic desert dust. This finding in consistent with 142
the results in Gryspeerdt et al. [2016], which indicate that the AOD of various aerosol species 143
calculated in the MACC global reanalysis increases systematically with CF. 144
145
Figure 3. Maps of local CF-AOD correlation considering for each location only those days in 146
JJA when the MERRA-2 reanalysis indicated that a single aerosol type dominated in 1° by 1° 147
area. (a) Days dominated by sulfate aerosols (b) Days dominated by carbon aerosols (c) Days 148
dominated by desert dust (d) Days dominated by sea salt. Zero values (white) indicate locations 149
where there were not enough days dominated by a particular aerosol type to calculate CF-AOD 150
correlations. 151
b
CarbonSulfate
a
Dust
c
Seasalt
d
CorrelationofCF&AOD
8
152
To summarize this section, all observations either on a pixel-by-pixel basis (Level 2 data-153
product, e.g., Loeb and Manalo-Smith [2005]; Chand et al. [2012]; and Várnai and Marshak 154
[2014]) or averaged over space and time (Level 3 product) provide a clear signature of a positive 155
correlation between CF and AOD. The combination of satellite data with the global reanalysis 156
model MERRA-2 supports this correlation for all aerosol types considered. 157
158
3 Cloud-related changes in aerosol particle size 159
While all observations point to a similar statistical relationship between CF and AOD, 160
this is not the case for the relationship between CF and particle size. To examine this 161
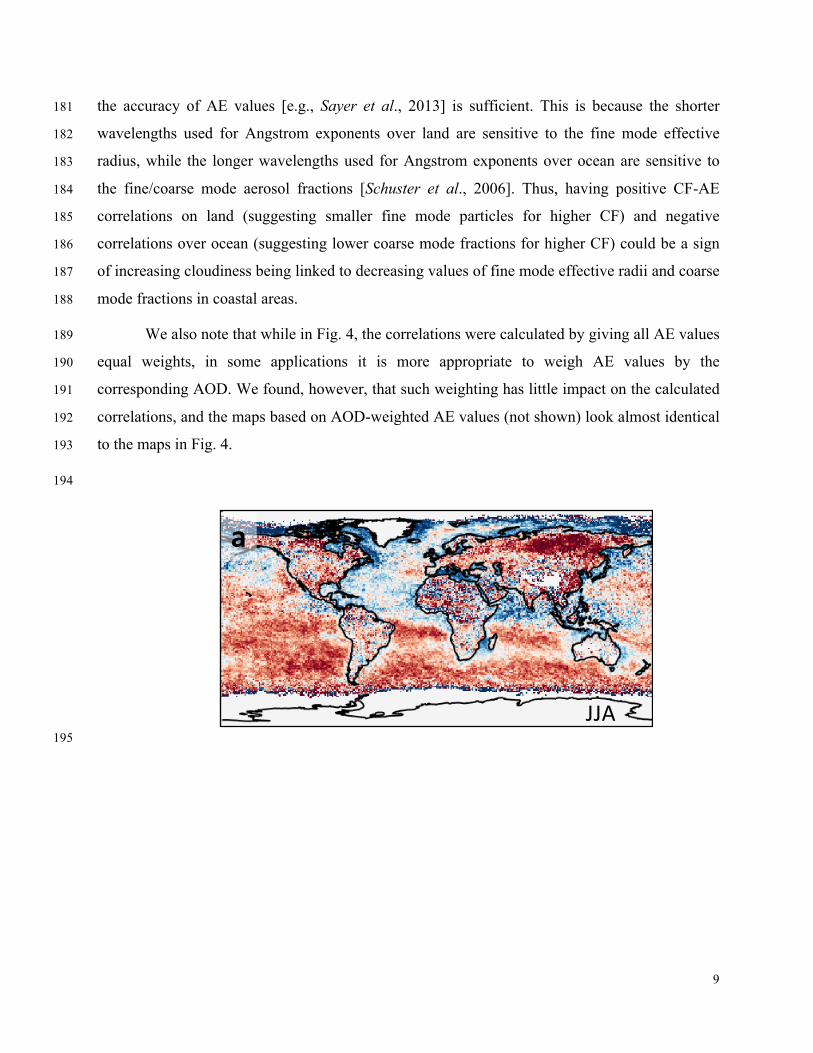
relationship, Figure 4 shows global maps of the correlation between CF and aerosol Angstrom 162
exponent (AE) in the MODIS Dark Target-Deep Blue combined product. In this product, AE 163
data comes from the Deep Blue algorithm [Hsu et al., 2004] over land (for 412-470 nm), and 164
from the Dark Target algorithm [Levy et al., 2013] over water (for 550-865 nm). Panel 4a 165
reveals that in JJA, positive correlations dominate over much of the southern hemispheric 166
oceans, but over northern hemispheric oceans there are large areas with both positive and 167
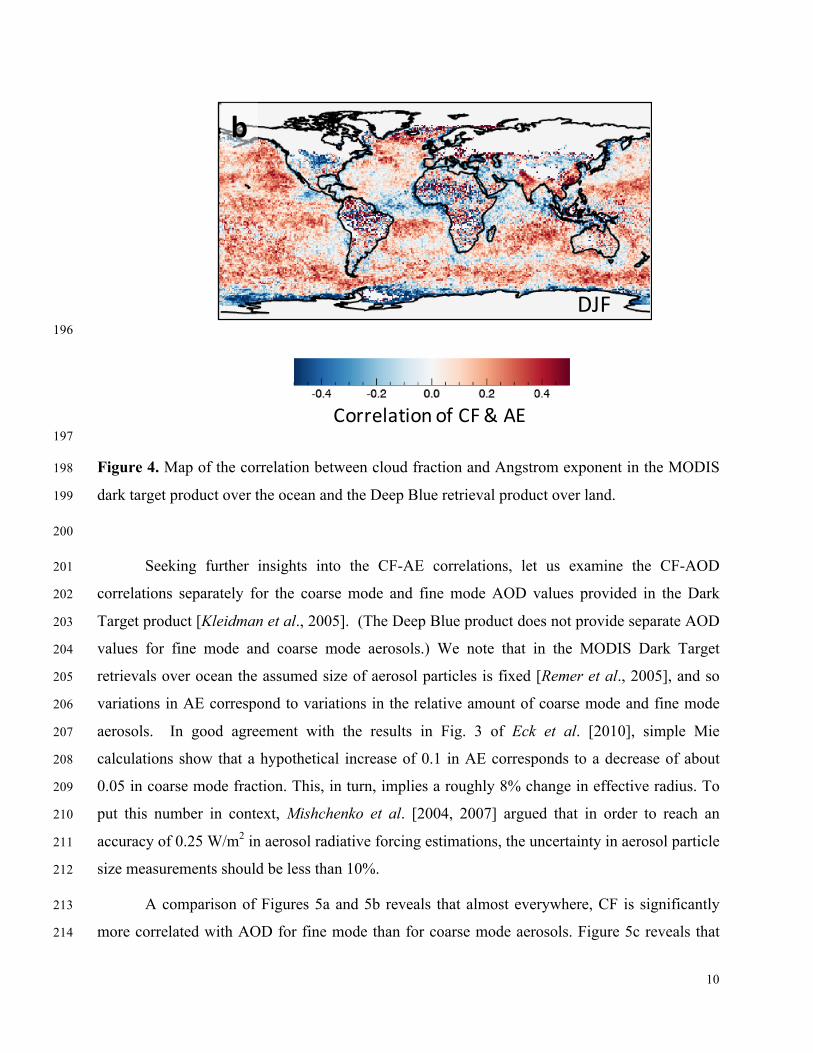
negative correlations. Panel b shows that in DJF the two hemispheres are much more similar to 168
each another, with positive but weaker correlations over most oceans. The figure also shows that 169
large areas of both positive and negative correlations occur both over land and ocean. In other 170
words, both the Dark Target and Deep Blue algorithms show that the effective aerosol particle 171
size increases with cloudiness in some areas, and decreases in others. 172
We note that reflectances are more sensitive to the size of fine mode particles at shorter 173
wavelengths than at longer ones. This means that for aerosol populations dominated by fine 174
mode, AEs involving short wavelengths will depend on the exact wavelengths used (e.g., Eck et 175
al., 1999; Reid et al., 1999). Therefore, the wavelength difference between AEs produced over 176
land and ocean may explain the jumps in CF-AE correlations that occur at many coastlines, for 177
example at the East coasts of Asia and North America in Fig. 4. 178
Let us mention that, in principle, the jump at coastlines can even help gain information on 179
coastal aerosols if we assume that aerosol populations are similar on both sides of a coastline and 180
9
the accuracy of AE values [e.g., Sayer et al., 2013] is sufficient. This is because the shorter 181
wavelengths used for Angstrom exponents over land are sensitive to the fine mode effective 182
radius, while the longer wavelengths used for Angstrom exponents over ocean are sensitive to 183
the fine/coarse mode aerosol fractions [Schuster et al., 2006]. Thus, having positive CF-AE 184
correlations on land (suggesting smaller fine mode particles for higher CF) and negative 185
correlations over ocean (suggesting lower coarse mode fractions for higher CF) could be a sign 186
of increasing cloudiness being linked to decreasing values of fine mode effective radii and coarse 187
mode fractions in coastal areas. 188
We also note that while in Fig. 4, the correlations were calculated by giving all AE values 189
equal weights, in some applications it is more appropriate to weigh AE values by the 190
corresponding AOD. We found, however, that such weighting has little impact on the calculated 191
correlations, and the maps based on AOD-weighted AE values (not shown) look almost identical 192
to the maps in Fig. 4. 193
194
195
a
JJA
10
196
197
Figure 4. Map of the correlation between cloud fraction and Angstrom exponent in the MODIS 198
dark target product over the ocean and the Deep Blue retrieval product over land. 199
200
Seeking further insights into the CF-AE correlations, let us examine the CF-AOD 201
correlations separately for the coarse mode and fine mode AOD values provided in the Dark 202
Target product [Kleidman et al., 2005]. (The Deep Blue product does not provide separate AOD 203
values for fine mode and coarse mode aerosols.) We note that in the MODIS Dark Target 204
retrievals over ocean the assumed size of aerosol particles is fixed [Remer et al., 2005], and so 205
variations in AE correspond to variations in the relative amount of coarse mode and fine mode 206
aerosols. In good agreement with the results in Fig. 3 of Eck et al. [2010], simple Mie 207
calculations show that a hypothetical increase of 0.1 in AE corresponds to a decrease of about 208
0.05 in coarse mode fraction. This, in turn, implies a roughly 8% change in effective radius. To 209
put this number in context, Mishchenko et al. [2004, 2007] argued that in order to reach an 210
accuracy of 0.25 W/m2 in aerosol radiative forcing estimations, the uncertainty in aerosol particle 211
size measurements should be less than 10%. 212
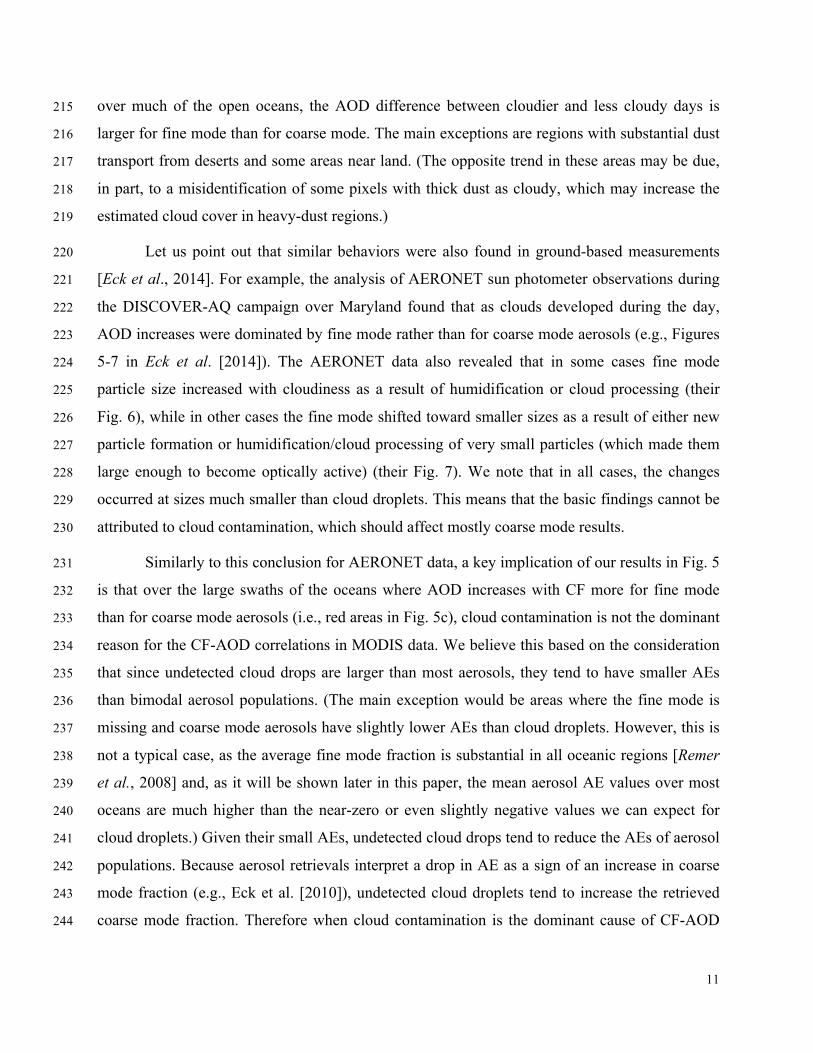
A comparison of Figures 5a and 5b reveals that almost everywhere, CF is significantly 213
more correlated with AOD for fine mode than for coarse mode aerosols. Figure 5c reveals that 214
b
DJF
CorrelationofCF&AE
11
over much of the open oceans, the AOD difference between cloudier and less cloudy days is 215
larger for fine mode than for coarse mode. The main exceptions are regions with substantial dust 216
transport from deserts and some areas near land. (The opposite trend in these areas may be due, 217
in part, to a misidentification of some pixels with thick dust as cloudy, which may increase the 218
estimated cloud cover in heavy-dust regions.) 219
Let us point out that similar behaviors were also found in ground-based measurements 220
[Eck et al., 2014]. For example, the analysis of AERONET sun photometer observations during 221
the DISCOVER-AQ campaign over Maryland found that as clouds developed during the day, 222
AOD increases were dominated by fine mode rather than for coarse mode aerosols (e.g., Figures 223
5-7 in Eck et al. [2014]). The AERONET data also revealed that in some cases fine mode 224
particle size increased with cloudiness as a result of humidification or cloud processing (their 225
Fig. 6), while in other cases the fine mode shifted toward smaller sizes as a result of either new 226
particle formation or humidification/cloud processing of very small particles (which made them 227
large enough to become optically active) (their Fig. 7). We note that in all cases, the changes 228
occurred at sizes much smaller than cloud droplets. This means that the basic findings cannot be 229
attributed to cloud contamination, which should affect mostly coarse mode results. 230
Similarly to this conclusion for AERONET data, a key implication of our results in Fig. 5 231
is that over the large swaths of the oceans where AOD increases with CF more for fine mode 232
than for coarse mode aerosols (i.e., red areas in Fig. 5c), cloud contamination is not the dominant 233
reason for the CF-AOD correlations in MODIS data. We believe this based on the consideration 234
that since undetected cloud drops are larger than most aerosols, they tend to have smaller AEs 235
than bimodal aerosol populations. (The main exception would be areas where the fine mode is 236
missing and coarse mode aerosols have slightly lower AEs than cloud droplets. However, this is 237
not a typical case, as the average fine mode fraction is substantial in all oceanic regions [Remer 238
et al., 2008] and, as it will be shown later in this paper, the mean aerosol AE values over most 239
oceans are much higher than the near-zero or even slightly negative values we can expect for 240
cloud droplets.) Given their small AEs, undetected cloud drops tend to reduce the AEs of aerosol 241
populations. Because aerosol retrievals interpret a drop in AE as a sign of an increase in coarse 242
mode fraction (e.g., Eck et al. [2010]), undetected cloud droplets tend to increase the retrieved 243
coarse mode fraction. Therefore when cloud contamination is the dominant cause of CF-AOD 244

12
correlations, AOD must increase with CF more for coarse mode than fine mode—which is not 245
the case in the red-colored areas in Fig. 5c. 246
Naturally, this does not mean that cloud contamination does not occur (for example in 247
partly cloudy pixels), or that its effect are not significant—only that in many areas it is not the 248
dominant effect. The reason why it is not dominant is that data processing algorithms take extra 249
care to minimize it. For example, the MODIS Dark Target algorithm shown in Figure 5 uses 250
several steps to screen for clouds using various tests of brightness as well as spectral and spatial 251
variability—and as an added precaution, it excludes the brightest 25% of pixels in an area even if 252
they passed all tests [Martins et al., 2002; Remer et al., 2005]. 253
254
255
256
Correla'onofCF&AOD
a b
Finemode Coarsemode

13
257
Figure 5. Map of relationships between CF and AOD separately for fine and coarse mode 258
aerosols. Panels a and b show CF-AOD correlations for (a) Fine mode; (b) Coarse mode. Panel 259
c shows where the AOD difference between cloudier and less cloudy days is larger (or smaller) 260
for fine mode than for coarse mode aerosols. The yellow rectangle in Panel c highlights the area 261
used for the analysis in Figures 6 & 7. All data is for JJA. 262
263
While it is not yet certain why fine mode AOD varies more with CF than coarse mode 264
AOD does, several factors may play a role, for example: (i) coarse mode aerosols—such as dust 265
particles in the elevated Saharan Air Layer—may float well above boundary layer clouds and 266
hence may not interact with them; (ii) fine mode aerosols are typically more hygroscopic and 267
swell more in the humid air surrounding clouds; (iii) cloud processing or new particle formation 268
may create small particles and/or more optically effective ones; (iv) sunlight scattered from 269
clouds can bias satellite retrievals toward larger AOD values and smaller aerosol sizes through 270
the 3D radiative process called bluing [Marshak et al., 2008]. To help better understand aerosol-271
cloud interactions, future studies are needed to evaluate the relative importance of such factors. 272
One possibility for further analysis is to combine data from different sources. As a first 273
step in this direction, we combine the MODIS Dark Target (DT) product with the MODIS Ocean 274
Color product [Ahmad et al., 2010]. Namely, we examine the impact of clouds on AE by 275
combining 3 km-resolution MODIS Dark Target AE values with 1 km-resolution Quality 276
c
(AODFM(highCF) – AODFM(lowCF))- (AODCM(highCF)– AODCM(lowCF))
14
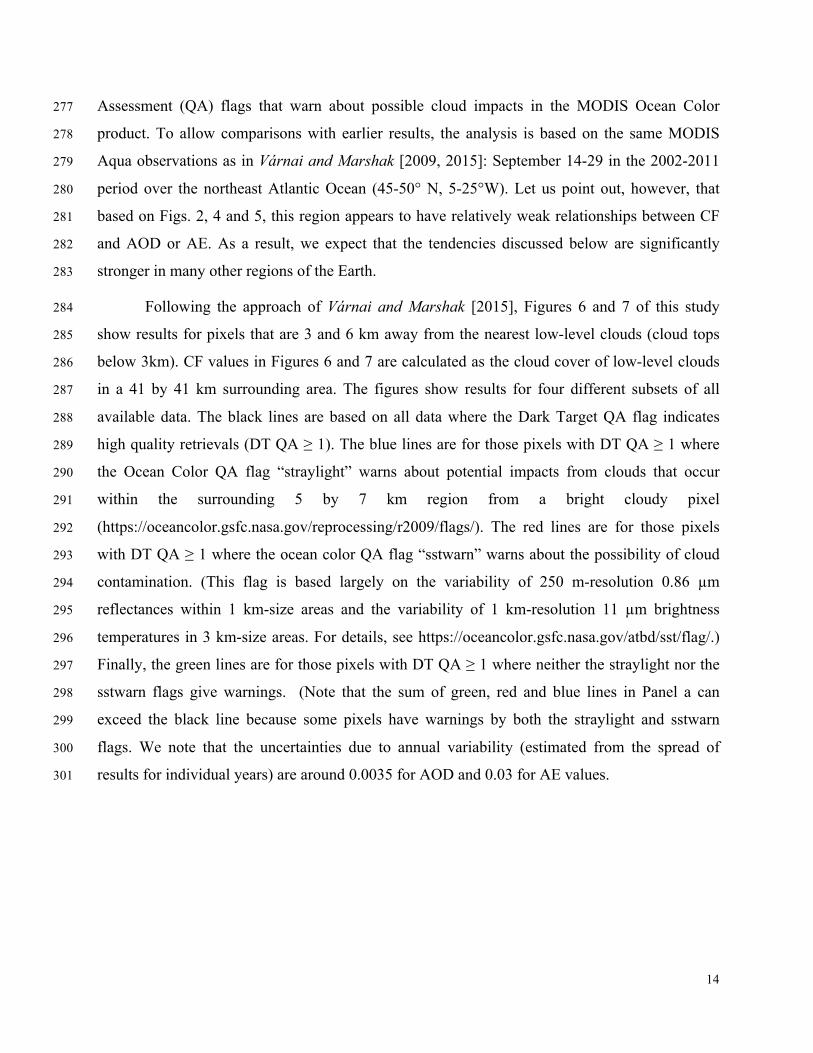
Assessment (QA) flags that warn about possible cloud impacts in the MODIS Ocean Color 277
product. To allow comparisons with earlier results, the analysis is based on the same MODIS 278
Aqua observations as in Várnai and Marshak [2009, 2015]: September 14-29 in the 2002-2011 279
period over the northeast Atlantic Ocean (45-50° N, 5-25°W). Let us point out, however, that 280
based on Figs. 2, 4 and 5, this region appears to have relatively weak relationships between CF 281
and AOD or AE. As a result, we expect that the tendencies discussed below are significantly 282
stronger in many other regions of the Earth. 283
Following the approach of Várnai and Marshak [2015], Figures 6 and 7 of this study 284
show results for pixels that are 3 and 6 km away from the nearest low-level clouds (cloud tops 285
below 3km). CF values in Figures 6 and 7 are calculated as the cloud cover of low-level clouds 286
in a 41 by 41 km surrounding area. The figures show results for four different subsets of all 287
available data. The black lines are based on all data where the Dark Target QA flag indicates 288
high quality retrievals (DT QA ≥ 1). The blue lines are for those pixels with DT QA ≥ 1 where 289
the Ocean Color QA flag “straylight” warns about potential impacts from clouds that occur 290
within the surrounding 5 by 7 km region from a bright cloudy pixel 291
(https://oceancolor.gsfc.nasa.gov/reprocessing/r2009/flags/). The red lines are for those pixels 292
with DT QA ≥ 1 where the ocean color QA flag “sstwarn” warns about the possibility of cloud 293
contamination. (This flag is based largely on the variability of 250 m-resolution 0.86 µm 294
reflectances within 1 km-size areas and the variability of 1 km-resolution 11 µm brightness 295
temperatures in 3 km-size areas. For details, see https://oceancolor.gsfc.nasa.gov/atbd/sst/flag/.) 296
Finally, the green lines are for those pixels with DT QA ≥ 1 where neither the straylight nor the 297
sstwarn flags give warnings. (Note that the sum of green, red and blue lines in Panel a can 298
exceed the black line because some pixels have warnings by both the straylight and sstwarn 299
flags. We note that the uncertainties due to annual variability (estimated from the spread of 300
results for individual years) are around 0.0035 for AOD and 0.03 for AE values. 301
15
302
Figure 6. Impact of cloud-related Quality Assessment flags in the MODIS ocean color product 303
on MODIS Dark Target aerosol data. (a) Number of pixels; (b) Aerosol Optical Depth (AOD); 304
(c) Angstrom exponent. Figure is for September 14-29 in 2002-2011, for an area over the 305
Northeast Atlantic Ocean (45-50°N, 5-25°W). Data is plotted for pixels that are 3 km away from 306
the nearest low-level cloud. 307
308
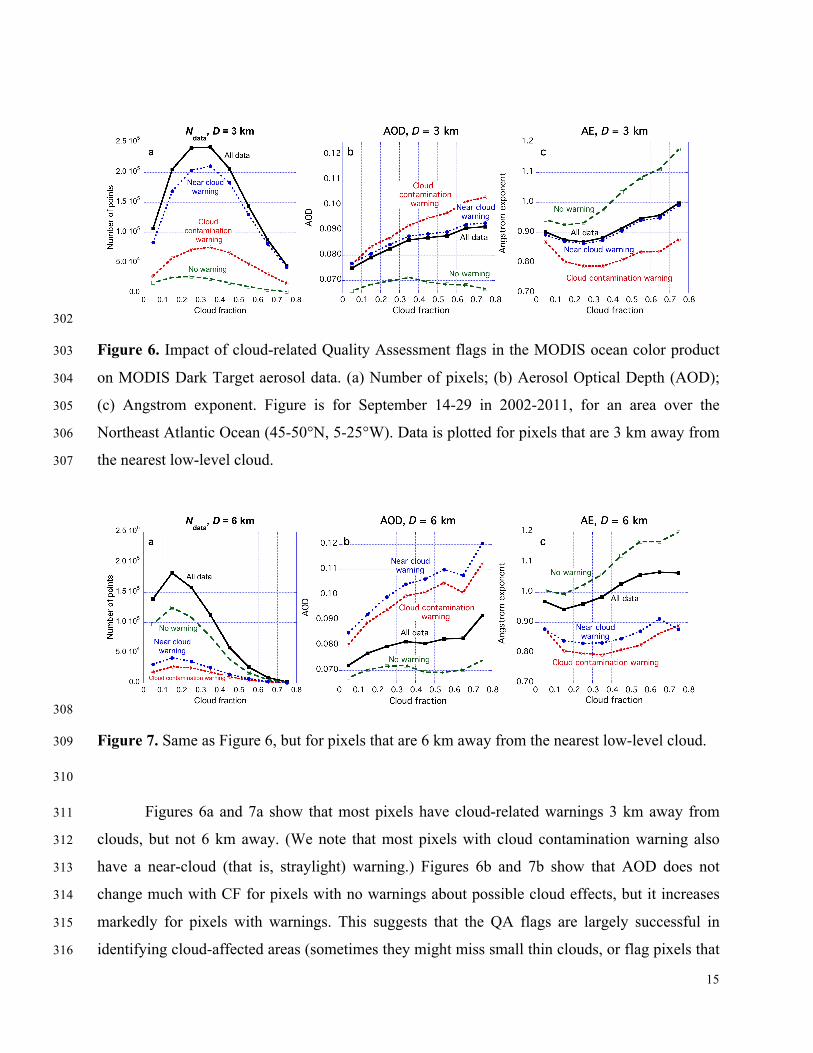
Figure 7. Same as Figure 6, but for pixels that are 6 km away from the nearest low-level cloud. 309
310
Figures 6a and 7a show that most pixels have cloud-related warnings 3 km away from 311
clouds, but not 6 km away. (We note that most pixels with cloud contamination warning also 312
have a near-cloud (that is, straylight) warning.) Figures 6b and 7b show that AOD does not 313
change much with CF for pixels with no warnings about possible cloud effects, but it increases 314
markedly for pixels with warnings. This suggests that the QA flags are largely successful in 315
identifying cloud-affected areas (sometimes they might miss small thin clouds, or flag pixels that 316
16
are near not clouds but thick aerosol plumes). Figures 6c and 7c are more complicated to 317
interpret. They show that fine mode aerosols dominated in the region, as all mean AE values are 318
higher than the 0.75 value typically associated with 50% fine mode fraction of AOD at 500 nm 319
[Eck et al., 2010]. Figures 6c and 7c also show that the (443-869 nm) AE provided in the 320
MODIS ocean color product increases (that is, effective particle size decreases) with CF for 321
pixels with no warnings. As suggested in Várnai and Marshak [2015], this may occur because 322
small pollution particles may dominate aerosol populations when cloudy weather systems bring 323
air from North America or Europe, whereas large dust or sea salt particles may dominate on less 324
cloudy days when the air is coming from deserts or subtropical oceanic areas. In contrast, the 325
effective particle size in pixels with cloud-related warnings does not change significantly with 326
CF, as the decrease with CF seen for pixels with no warnings is offset by an increase related to 327
cloud-related processes such as humidification. Particle size is markedly larger (AE is smaller) 328
for pixels with cloud-related warnings than for pixels without warnings (especially 3 km away 329
from clouds, see Fig. 6c), and this size difference increases steadily with the amount of clouds. 330
This allows us to conclude that cloud-impacted (near-cloud) pixels and possibly cloud-331
contaminated pixels tend to contain larger particles (plus cloud droplets) than other nearby 332
pixels. Finally, let us point out that the results in Figs. 6 and 7 imply that aerosol particle number 333
concentration increases with CF both for pixels with and without cloud-related warnings 334
(increasing AOD with steady particle size and steady AOD with decreasing particle size, 335
respectively). 336
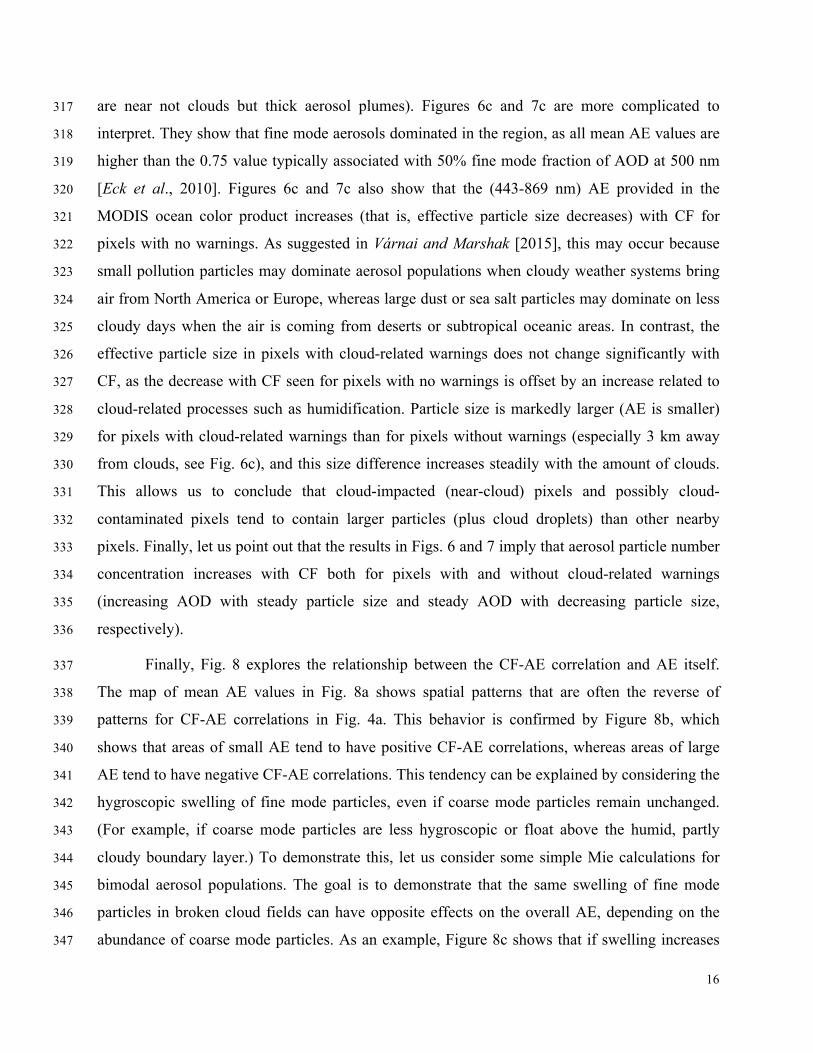
Finally, Fig. 8 explores the relationship between the CF-AE correlation and AE itself. 337
The map of mean AE values in Fig. 8a shows spatial patterns that are often the reverse of 338
patterns for CF-AE correlations in Fig. 4a. This behavior is confirmed by Figure 8b, which 339
shows that areas of small AE tend to have positive CF-AE correlations, whereas areas of large 340
AE tend to have negative CF-AE correlations. This tendency can be explained by considering the 341
hygroscopic swelling of fine mode particles, even if coarse mode particles remain unchanged. 342
(For example, if coarse mode particles are less hygroscopic or float above the humid, partly 343
cloudy boundary layer.) To demonstrate this, let us consider some simple Mie calculations for 344
bimodal aerosol populations. The goal is to demonstrate that the same swelling of fine mode 345
particles in broken cloud fields can have opposite effects on the overall AE, depending on the 346
abundance of coarse mode particles. As an example, Figure 8c shows that if swelling increases 347

17
the median radius of fine mode particles from 0.07 to 0.12 µm, the overall (550-869 nm) AE of a 348
bimodal particle population will decrease along the dashed blue line in cases of large AE (low 349
coarse mode fraction), but will increase along the solid red line in cases of small AE (high coarse 350
mode fraction). We note that the AE of the bimodal population increases along the red line even 351
though the AE of fine particles actually decreases. Specifically, as the fine mode median radius 352
increases from 0.07 to 0.12 µm and the coarse mode remains unchanged, the fine mode AE drops 353
from 1.87 to 1.43 (not shown), the coarse mode AE remains constant at -0.13 (not shown), but 354
the overall AE in Fig. 8c increases from 0.86 to 1.15. The overall AE increases because the 355
swelling enhances the radiative impact of fine particles relative to the impact of coarse mode 356
particles, and so the effective particle size of bimodal distributions shifts toward smaller sizes. 357
(We note that even the blue curve would show an initial increase if swelling started at a smaller 358
size: If fine particles started out so small that their light scattering was negligible, the overall AE 359
would start out being the coarse mode AE. As fine particles then grew larger, the overall AE 360
would increase to a value between the higher AE of fine-mode and lower AE of coarse mode.) 361
The result that the same swelling (e.g., fine mode swelling from 0.07 to 0.12 µm) can cause 362
opposite changes in AE depending on the fine/coarse mode fraction, illustrates that the sign of 363
AE variations by itself cannot reveal the direction of particle size changes. Consequently, the 364
effect of clouds on aerosol particle size cannot always be adequately described by changes in 365
Angstrom exponent alone. 366
To summarize this section, the analysis of different MODIS aerosol products showed that 367
over large regions of the Earth, effective aerosol particle size decreases with increasing 368
cloudiness. This occurs because an increase in CF implies a larger AOD growth for fine mode 369
than for coarse mode aerosols. The finding indicates that the observed correlations between CF 370
and AOD do not come primarily from cloud detection uncertainties. Moreover, this section 371
demonstrated a way in which cloud-related QA flags in the MODIS Ocean Color product can 372
help identify MODIS aerosol data impacted by nearby clouds. Finally, the results revealed a 373
duality in behaviors: Even when particle size does not increase with CF, it still increases in the 374
proximity of clouds (e.g., Figs. 6 and 7 show larger particles at 3 km than at 6 km from clouds). 375
This is possibly because variations in CF involve changes in the large-scale atmospheric 376
environment (thus in aerosols), while the approach toward clouds occurs within the same large-377
18
scale atmospheric environment and thus leads toward larger aerosol particles (as we see in both 378
Ocean Color and Dark Target MODIS products). 379
380
Figure 8. Relationship between CF-AE correlation and particle size. (a) Map of Dark Target 381
mean AE values for JJA; (b) Comparison of individual values in the maps in Figures 4a and 8a. 382
The position of each dot along the x-axis represents the mean AE value of a grid point in Fig 8a, 383
while the position along the y-axis represents the CF-AE correlation of the same grid point in 384
Fig. 4a. (c) Change in the overall AE of bimodal aerosol distributions when the size of fine mode 385
particles increases through hygroscopic swelling. The plot shows results from Mie calculations 386
assuming Models #2 and #9 of the MODIS Dark Target (ocean) algorithm for the fine and coarse 387
modes, respectively (Levy et al., 2013). As Table 2 of Remer et al. (2005) shows, the median 388
radii are 0.06 µm and 0.5 µm for the “unswollen” fine and coarse modes, respectively, while the 389
standard deviations of lognormal size distributions are 0.6 µm and 0.8 µm, and the effective radii 390
are 0.15 and 2.5 µm for the two modes, respectively. Hygroscopic swelling of fine mode 391
b
a
Angstromexponent
c
19
particles is simulated using the approach in Gassó et al. (2000). As fine particles swell from a 392
median radius of 0.06 µm to 0.28 µm, their effective radius increases from 0.15 µm to 0.7 µm. 393
The printed coarse mode fraction (CMF) values indicate what fraction of 550 nm optical 394
thickness is due to coarse mode particles before any swelling. As fine mode particles swell, this 395
fraction decreases. 396
397
4 Summary 398
The ultimate goal of this paper is to help better understand aerosol-cloud interactions—a 399
leading cause of uncertainties in our estimates of human impacts on climate. To this end, it 400
examines the statistical relationships between aerosol properties and the amount and distance of 401
surrounding clouds in observations taken by the MODIS satellite instrument. 402
First, the paper sought a more detailed picture of the positive correlation between cloud 403
fraction and aerosol optical depth reported in earlier studies. Analyzing a global dataset of daily 404
mean aerosol and cloud properties over a 1° by 1° latitude-longitude grid during three summers 405
and winters, the study found that the positive correlation in earlier global statistics is strong 406
throughout the globe in both winter and summer (as opposed to coming from a few dominating 407
regions or from systematic differences between clouds and aerosols in different regions or 408
seasons). Over much of the globe, aerosol optical depth (AOD) was found to be 30-50% higher 409
on days that were cloudier than average than on days that were less cloudy than average. 410
Combining MODIS observations with MERRA-2 global reanalysis data on aerosol type 411
revealed that the correlation between cloud cover and AOD was strong for all considered aerosol 412
types: sulfate, dust, carbon, and sea salt. 413
After the initial focus on AOD, the paper examined how aerosol size distribution 414
(characterized through the Angstrom Exponent) changes in the presence of nearby clouds. We 415
found strong regional variations in the size distribution shifts that occur near clouds. Some large 416
regions displayed shifts toward larger aerosols near clouds that is intuitively consistent with 417
aerosol growth in the humid air surrounding clouds or the presence of undetected cloud particles, 418
and is also consistent with CALIOP results in Yang et al. [2014]. Other large regions, however, 419
clearly showed shifts toward smaller aerosols near clouds in three different operational MODIS 420
20
aerosol products: the Dark Target and Deep Blue products in this study, and in the Ocean Color 421
product in Várnai and Marshak [2015]. The results also indicated that the quality assessment 422
flags in the Ocean Color product can help us compare aerosol properties provided in the Dark 423
Target product at pixels likely affected and by clouds and at pixels likely not affected. 424
A more detailed look at the MODIS results revealed that when aerosol particle size 425
distributions shift toward smaller particles in cloudier regions, this is due to a greater increase in 426
the AOD of fine mode than coarse mode aerosols. The greater increase in fine mode AOD 427
implies that the CF-AOD correlation discussed here and in earlier studies does not come 428
predominantly from cloud contamination. 429
Additionally, the results revealed a duality in behaviors: Even when aerosol particle size 430
does not increase with CF, it still increases in the proximity of clouds. This is because variations 431
in CF involve changes in the large-scale atmospheric environment and thus in aerosols, while the 432
approach toward clouds occurs within the same large-scale atmospheric environment and leads 433
toward larger aerosol particles. This implies that aerosol behaviors in partly cloudy regions are 434
not dominated by a single factor and instead involve several factors: some change (increase or 435
decrease) particle size throughout the cloudy regions, while others increase particle size in the 436
vicinity of individual clouds. Such factors include hygroscopic swelling, meteorological 437
covariation of cloudiness and aerosols, 3D radiative interactions (bluing), undetected cloud 438
droplets, new particle formation through liquid phase chemical processes, and cloud processing 439
that merges aerosol particles via the collision-coalescence and eventual evaporation of cloud 440
droplets forming around them. The importance of each of these factors need to be evaluated in 441
future studies. 442
The results also revealed that the hygroscopic swelling of fine mode particles can either 443
decrease or increase the overall Angstrom exponent of bimodal particle populations. The 444
swelling of fine mode particles always decreases their own Angstrom exponent, but at the same 445
time it can enhance the radiative impact of fine mode particles relative to coarse mode particles, 446
if coarse mode aerosols are less hygroscopic or float above the humid, partly cloudy boundary 447
layer. The greater relative importance of the fine mode can in turn lead to an increase in overall 448
Angstrom exponent. This implies that the sign of Angstrom exponent variations does not 449

21
necessarily indicate the direction of particle size changes, and that the effect of clouds on aerosol 450
particle size cannot always be adequately described by changes in Angstrom exponent alone. 451
Although the methodology of data processing is also likely to impact the magnitude or in 452
some cases even the sign of near-cloud particle size changes [e.g., Ignatov et al., 2005], the 453
finding of similar behaviors in three operational data products that use very different cloud 454
detection, data selection, and aerosol retrieval algorithms suggests that the observed behaviors 455
are not caused by data processing issues. We note, however, that CALIOP does not seem to 456
show the diversity of behaviors observed by MODIS, and further study is needed to determine 457
whether differences in cloud detection or data sampling may contribute to CALIOP consistently 458
reporting larger particles near clouds [e.g., Yang et al., 2014]. 459
460
Acknowledgments 461
We gratefully acknowledge support for this research by the NASA Radiation Sciences 462
Program managed by Hal Maring. We are grateful to Stephanie Huang for providing insights 463
into near-cloud trends in Aeronet observations. We also thank Alexander Ignatov, Johannes 464
Quaas, and Weidong Yang for insightful discussions and help. The MODIS data used in this 465
study was obtained from the NASA Level-1 and Atmosphere Archive & Distribution System 466
(https://ladsweb.modaps.eosdis.nasa.gov). 467
468
References 469
Ahmad, Z., B. A. Franz, C. R. McClain, E. J. Kwiatkowska, J. Werdell, E. P. Shettle, and B. N. 470
Holben (2010), New aerosol models for the retrieval of aerosol optical thickness and normalized 471
water-leaving radiances from the SeaWiFS and MODIS sensors over coastal regions and open 472
oceans, Appl. Opt., 49, 5545–5560. 473
Albrecht, B. A. (1981), Parameterization of trade-cumulus cloud amount, J. Atmos. Sci., 38, 97–474
105. 475
22
Baum, B., W. Menzel, R. Frey, D. Tobin, R. Holz, S. Ackerman, A. Heidinger, and P. Yang 476
(2012), MODIS Cloud-Top Property Refinements for Collection 6. J. Appl. Meteor. Climatol., 477
51, 1145–1163, doi: 10.1175/JAMC-D-11-0203.1. 478
Chand, D., R. Wood, S. Ghan, M. Wang, M. Ovchinnikov, P. J. Rasch, S. Miller, B. Schichtel, T. 479
Moore (2012), Aerosol optical depth enhancement in partly cloudy conditions. J. Geophys. Res., 480
117, D17207, doi:10.1029/2012JD017894. 481
Chen, Y-C., M. W. Christensen, G. L. Stephens, and J. H. Seinfeld (2014), Satellite-based 482
estimate of global aerosol–cloud radiative forcing by marine warm clouds. Nature Geoscience, 7, 483
643-646. 484
Chin, M., P. Ginoux, S. Kinne, B. N. Holben, B. N. Duncan, R. V. Martin, J. A. Logan, A. 485
Higurashi, and T. Nakajima (2002), Tropospheric aerosol optical thickness from the GOCART 486
model and comparisons with satellite and sunphotometer measurements, J. Atmos. Sci. 59, 461–487
483. 488
Eck, T. F., B. N. Holben, J. S. Reid, O. Dubovik, A. Smirnov, N. T. O'Neill, I. Slutsker, and S. 489
Kinne (1999), Wavelength dependence of the optical depth of biomass burning, urban and desert 490
dust aerosols, J. Geophys. Res., 104, 31 333-31 350. 491
Eck, T. F., B. N. Holben, A. Sinyuk, R. T. Pinker, P. Goloub, H. Chen, B. Chatenet, Z. Li, R. P. 492
Singh, S. N. Tripathi, J. S. Reid, D. M. Giles, O. Dubovik, N. T. O'Neill, A. Smirnov, P. Wang, 493
X. Xia (2010), Climatological aspects of the optical properties of fine/coarse mode aerosol 494
mixtures, J. Geophys. Res., 115, D19205, doi: 10.1029/2010JD014002. 495
Eck, T. F., B. N. Holben, J. S. Reid, D. M. Giles, M. A. Rivas, R. P. Singh, S. N. Tripathi, C. J. 496
Bruegge, S. Platnick, G. T. Arnold, N. A. Krotkov, S. A. Carn, A. Sinyuk, O. Dubovik, A. Arola, 497
J. S. Schafer, P. Artaxo, A. Smirnov, H. Chen, and P. Goloub (2012), Fog- and cloud-induced 498
aerosol modification observed by the Aerosol Robotic Network (AERONET), J. Geophys. Res., 499
117, D07206, doi:10.1029/2011JD016839. 500
Eck, T. F., B. N Holben, J. S. Reid, A. Arola, R. A. Ferrare, C. A. Hostetler, S. N. Crumeyrolle, 501
T. A. Berkoff, E. J. Welton, S. Lolli, A. Lyapustin, Y. Wang, J. S. Schafer, D. M. Giles, B. E. 502
23
Anderson, K. L. Thornhill, P. Minnis, K. E. Pickering, C. P. Loughner, A. Smirnov, and A. 503
Sinyuk, (2014), Observations of rapid aerosol optical depth enhancements in the vicinity of 504
polluted cumulus clouds, Atmos. Chem. Phys., 14, 11633-11656, doi:10.5194/acp-14-11633-505
2014. 506
Ervens, B.; B. J. Turpin, R. J. Weber (2011), Secondary organic aerosol formation in cloud 507
droplets and aqueous particles (aqSOA): A review of laboratory, field and model studies, Atmos. 508
Chem. Phys. 2011, 11, 11069–11102. 509
Grandey, B. S., Stier, P., and Wagner, T. M.: Investigating relationships between aerosol optical 510
depth and cloud fraction using satellite, aerosol reanalysis and general circulation model data, 511
Atmos. Chem. Phys., 13, 3177-3184, https://doi.org/10.5194/acp-13-3177-2013, 2013. 512
Gryspeerdt, E., J. Quaas, and N. Bellouin (2016), Constraining the aerosol influence on cloud 513
fraction, J. Geophys. Res., 121, 3566–3583, doi:10.1002/2015JD023744. 514
Hsu, N. C., S.-C. Tsay, M. D. King, and J. R. Herman (2004), Aerosol properties over bright-515
reflecting source regions, IEEE Trans. Geosci. Remote Sens., 42(3), 557–569, 516
doi:10.1109/TGRS.2004.824067. 517
Ignatov A., P. Minnis, N.G. Loeb, B. Wielicki, W. Miller, S. Sun-Mack, D. Tanre, L.A. Remer, 518
I. Laszlo, E. Geier (2005), Two MODIS aerosol products over ocean on the Terra and Aqua 519
CERES SSF, J. Atmos. Sci., 62, 1008-1031. 520
IPCC AR5 (2013), Climate Change 2013: The Physical Science Basis. Contribution of Working 521
Group I to the Fifth Assessment Report of the Intergovern- mental Panel on Climate Change 522
[Stocker, T.F., D. Qin, G.-K. Plattner, M. Tignor, S.K. Allen, J. Boschung, A. Nauels, Y. Xia, V. 523
Bex and P.M. Midgley (eds.)]. Cambridge University Press, Cambridge, United Kingdom and 524
New York, NY, USA, 1535 pp. 525
Jeong, M. J., and Z. Li (2010), Separating real and apparent effects of cloud, humidity, and 526
dynamics on aerosol optical thickness near cloud edges. J. Geophys. Res., 115, D00K32. 527

24
Kaufman, Y., Koren, I., Remer, L., Rosenfeld, D., Rudich, Y. 2005. The Effect of Smoke Dust 528
and Pollution Aerosol on Shallow Cloud Development Over the Atlantic Ocean. Proceedings of 529
the National Academy of Sciences, 102, 11207-11212. doi: 10.1073/pnas.0505191102. 530
Kerkweg, A.; S. Wurzler, T. Reisin, A. Bott (2003), On the cloud processing of aerosol particles: 531
An entraining air-parcel model with two-dimensional spectral cloud microphysics and a new 532
formulation of the collection kernel, Q. J. Roy. Meteorol. Soc., 129, 1–18. 533
Kleidman, R. G., N. T. O'Neill, L. A. Remer, Y. J. Kaufman, T. F. Eck, D. Tanré, O. Dubovik, 534
and B. N. Holben (2005), Comparison of Moderate Resolution Imaging Spectroradiometer 535
(MODIS) and Aerosol Robotic Network (AERONET) remote-sensing retrievals of aerosol fine 536
mode fraction over ocean, J. Geophys. Res., 110, D22205, doi:10.1029/2005JD005760. 537
Koren, I., L. A. Remer, Y. J. Kaufman, Y. Rudich, and J. V. Martins (2007), On the twilight 538
zone between clouds and aerosols. Geophys. Res. Lett., 34, L08805, 539
doi:10.1029/2007GL029253. 540
Koren, I., G. Feingold, H. Jiang, and O. Altaratz (2009), Aerosol effects on the inter-cloud region 541
of a small cumulus cloud field, Geophys. Res. Lett., 36, L14805, doi:10.1029/2009GL037424. 542
Levy, R. C., Mattoo, S., Munchak, L. A., Remer, L. A., Sayer, A. M., Patadia, F., and N. C. Hsu 543
(2013), The Collection 6 MODIS aerosol products over land and ocean. Atmos. Meas. Tech., 6, 544
2989–3034. doi:10.5194/amt-6-2989-2013 545
Loeb, N. G., and N. Manalo-Smith (2005), Top-of-Atmosphere direct radiative effect of aerosols 546
over global oceans from merged CERES and MODIS observations. J. Climate, 18, 3506–3526. 547
doi: 10.1175/JCLI3504.1. 548
Loeb, N. G., and G. L. Schuster (2008), An observational study of the relationship between 549
cloud, aerosol and meteorology in broken low-level cloud conditions. J. Geophys. Res., 113, 550
D14214, doi:10.1029/2007JD009763. 551
Marshak A., G. Wen, J. Coakley, L. A. Remer, N. G. Loeb, R. F. Cahalan (2008), A simple 552
model for the cloud adjacency effect and the apparent bluing of aerosols near clouds. J. Geophys. 553
Res., 113, D14S17. 554
25
Martins, J. V., D. Tanré, L. A. Remer, Y. J. Kaufman, S. Mattoo, and R. Levy (2002), MODIS 555
cloud screening for remote sensing of aerosol over oceans using spatial variability. Geophys. 556
Res. Lett., 29, 8009, doi:10.1029/2001GL013252. 557
Mishchenko, M.I., B. Cairns, J.E. Hansen, L.D. Travis, R. Burg, Y.J. Kaufman, J.V. Martins, and 558
E.P. Shettle (2004), Monitoring of aerosol forcing of climate from space: Analysis of 559
measurement requirements. J. Quant. Spectrosc. Radiat. Transfer, 88, 149-161, 560
doi:10.1016/j.jqsrt.2004.03.030. 561
Mishchenko, M.I., B. Cairns, G. Kopp, C.F. Schueler, B.A. Fafaul, J.E. Hansen, R.J. Hooker, T. 562
Itchkawich, H.B. Maring, and L.D. Travis (2007), Accurate monitoring of terrestrial aerosols and 563
total solar irradiance: Introducing the Glory mission, Bull. Amer. Meteorol. Soc., 88, 677-691, 564
doi:10.1175/BAMS-88-5-677. 565
Platnick, S., et al., (2015), MODIS Atmosphere L2 Joint Atmosphere Product. NASA MODIS 566
Adaptive Processing System, Goddard Space Flight Center, USA: 567
http://dx.doi.org/10.5067/MODIS/MYDATML2.006 568
Quaas, J., B. Stevens, P. Stier, and U. Lohmann (2010), Interpreting the cloud cover – aerosol 569
optical depth relationship found in satellite data using a general circulation model. Atmos. Chem. 570
Phys., 10, 6129–6135, doi:10.5194/acp-10-6129-2010. 571
Reid, J. S., T. F. Eck, S. A. Christopher, P. V. Hobbs, and B. Holben (1999), Use of the 572
Ångstrom exponent to estimate the variability of optical and physical properties of aging smoke 573
particles in Brazil, J. Geophys. Res., 104(D22), 27473–27489, doi:10.1029/1999JD900833. 574
Remer, L. A., Y. J. Kaufman, D. Tanre, S. Mattoo, D. A. Chu, J. V. Martins, R. R. Li, C. Ichoku, 575
R. C. Levy, R. G. Kleidman, T. F. Eck, E. Vermote, and B. N. Holben (2005), The MODIS 576
aerosol algorithm, products and validation. J. Atmos. Sci., 62, 947-973. 577
Remer, L. A., R. G. Kleidman, R. C. Levy, Y. J. Kaufman, D. Tanré, S. Mattoo, J. V. Martins, 578
C. Ichoku, I. Koren, H. Yu, and B. N. Holben (2008), Global aerosol climatology from the 579
MODIS satellite sensors. J. Geophys. Res., 113, D14S07, doi:10.1029/2007JD009661. 580
26
Sayer, A. M., N. C. Hsu, C. Bettenhausen, and M.-J. Jeong (2013), Validation and uncertainty 581
estimates for MODIS Collection 6 “Deep Blue” aerosol data, J. Geophys. Res., 118, 7864–7872, 582
doi:10.1002/jgrd.50600. 583
Schuster, G. L., O. Dubovik, and B. N. Holben (2006), Angstrom exponent and bimodal aerosol 584
size distributions, J. Geophys. Res., 111, D07207, doi:10.1029/2005JD006328. 585
Su, W., G. L. Schuster, N. G. Loeb, R. R. Rogers, R. A. Ferrare, C. A. Hostetler, J. W. Hair, and 586
M. D. Obland (2008), Aerosol and cloud interaction observed from high spectral resolution lidar 587
data. J. Geophys. Res., 113, D24202, doi:10.1029/2008JD010588. 588
Tackett, J.L. and L. Di Girolamo (2009), Enhanced aerosol backscatter adjacent to tropical trade 589
wind clouds revealed by satellite-based lidar. Geophys. Res. Lett., 36, L14804, doi: 590
10.1029/2009GL039264. 591
Ten Hoeve, J. E., and J. A. Augustine (2016), Aerosol effects on cloud cover as evidenced by 592
ground-based and space- based observations at five rural sites in the United States, Geophys. 593
Res. Lett., 43, 793–801, doi:10.1002/2015GL066873. 594
Twohy, C. H., J. A. Coakley Jr., W.R. Tahnk (2009), Effect of changes in relative humidity on 595
aerosol scattering near clouds. J. Geophys. Res., 114, D05205. 596
Várnai, T., and A. Marshak (2009), MODIS observations of enhanced clear sky reflectance near 597
clouds. Geophys. Res. Lett., 36, L06807, doi:10.1029/2008GL037089. 598
Várnai, T., and A. Marshak (2014), Near-cloud aerosol properties from the 1-km resolution 599
MODIS ocean product. J. Geopys. Res., 119, doi:10.1002/2013JD020633. 600
Várnai, T., and A. Marshak (2015), Effect of cloud fraction on near-cloud aerosol behavior in the 601
MODIS atmospheric correction ocean color product. Remote Sens., 7, 5283-5299; 602
doi:10.3390/rs70505283. 603
Várnai, T., A. Marshak, and W. Yang (2013), Multi-satellite aerosol observations in the vicinity 604
of clouds. Atmos. Chem. Phys., 13, 3899-3908, doi:10.5194/acp-13-3899- 2013. 605
27
Wen G., A. Marshak, and R. F. Cahalan (2008), Importance of molecular Rayleigh scattering in 606
the enhancement of clear sky radiance in the vicinity of boundary layer cumulus clouds. J. 607
Geophys. Res., 113, D24207, doi:10.1029/2008JD010592. 608
Yang, W, A. Marshak, T. Várnai and R. Wood (2014), CALIPSO observations of near- cloud 609
aerosol properties as a function of cloud fraction. Geoph. Res. Lett., 41, doi: 610
10.1002/2014GL061896. 611
Zhang, J., J. S. Reid, and B. N. Holben (2005), An analysis of potential cloud artifacts in MODIS 612
over ocean aerosol optical thickness products. Geophys. Res. Lett., 32, L15803, 613
doi:10.1029/2005GL023254. 614
615