observation of fetal development in alpacas at …the fetal skull was measured for both the bpd...
TRANSCRIPT

1
OBSERVATION OF FETAL DEVELOPMENT IN ALPACAS AT SPECIFIC GESTATIONAL AGES USING ULTRASOUND, FETAL
DISSECTION, AND COMPUTER AIDED TOMOGRAPHY TECHNIQUES
A Capstone Experience Manuscript
Presented by
Lauren Melle
Completion Date: May 2011
Approved By:
Dr. Stephen Purdy, Department of Veterinary and Animal Sciences
Dr. Alan Richmond, Department of Biology

2
ABSTRACT Title: Observation of Fetal Development in Alpacas at Specific Gestational Ages using
Ultrasound, Fetal Dissection, and Computer Aided Tomography Techniques
Author: Lauren Melle, Animal Science
CE Type: Independent Capstone Thesis
Approved By: Dr. Stephen Purdy, Department of Veterinary and Animal Science
Approved By: Dr. Alan Richmond, Department of Biology
The alpaca, Vicugna pacos is a valued species in South America and of growing
popularity in the United States. Relatively little is understood about the reproduction of this
species. This study attempts to observe the specific developments of the fetal alpaca throughout
early gestation. The identification of these developmental events using three methods:
ultrasonography, actual fetal dissections, and computer-aided tomography scans, will aid in
identifying trends in development. Six fetal specimens were followed using ultrasound, which is
the common field method, up until different gestational ages (154 days, 126, 103, 102, 74, and
42 day twins). Fetuses were then terminated at specific gestational ages in order to observe the
development that had occurred up until time of termination and compare findings with that
observed during gestation using ultrasound. CAT scan images of the specimens were then used
to compare to ultrasound and dissection data. Comparisons among the three methods resulted in
the determination of normal ranges of development at specific gestational ages and the accuracy
of the ultrasound field method as a accurate method in following the developments of alpaca
fetal development. Lastly, this study presents previously unknown findings on the developments
of the fetal alpaca.

3
1. Introduction
The alpaca, Vicugna pacos, is a domesticated species of South American camelid that is
extensively used as a source of livelihood. While the importance of the alpaca for meat, hides,
and fiber in South America dates back thousands of years, the popularity of the alpaca has only
recently grown in the United States. In the United States alpacas are primarily raised as
investment animals and bred for superior genetics relating to fiber and show conformation.
While the popularity of the alpaca has significantly increased and continues to grow, relatively
little is understood about reproduction in this species. In order to continue the growth and
improvement of the alpaca industry it is necessary to explore the reproductive cycle and fetal
development of this species.
Alpacas are induced ovulators, which means that copulation and penetration of the cervix
must occur for ovulation and subsequent fertilization in order to obtain a pregnancy. Due to the
fact that alpacas are induced ovulators, they do not show a defined estrous cycle, which can
result in varying lengths of receptivity and non-receptivity. The uterine horn is similar to that of
Bovine with long horns and a short uterine body. The uterine horns and ovaries are unfixed due
to lack of ligamentous structures. The placentation is epithelochorial and fills both horns (Aiello,
1998).
The detection of ovulation can be confirmed through transrectal ultrasound around 3-4
days1 after breeding when a corpus luteum is visible and the female shows signs of sexual non-
receptivity. Pregnancy can be determined at approximately 15 days using transrectal ultrasound
through the identification of a pre-implantation conceptus. According to a study in 2003, at day
15 after copulation, the blastocyst is completely free in the uterine lumen and can transverse the

4
two uterine horns until implantation occurs at approximately day 20 and placentation is observed
on ultrasound at day 45 (Olivera, 2003).
While the early part of gestation has been studied to an extent, little is know about the
development of the fetus as it relates to growth and structural development after 40 days. As
mentioned in the previous paragraph, there is a definitive field method for confirming pregnancy;
however, there is no field method for determining gestational age or to determine if proper
growth of the fetus is occurring. Determining gestational age is a tool that would be useful
during abortions, when the breeding date is unknown, or, as in the case with many South
American alpaca producers, males and females are kept in the same pasture, and occasionally
without a breeding management program (Herrera, 2002). In addition, knowledge of gestational
age and proper fetal development is useful for studies using alpacas as a animal model. These
studies often require normal developing fetuses at a particular age in gestation (Gazitua, 2001).
In previous research gestational age has been determined in the Equine and in the llama
using the measurements of the limbs, skull, and abdomen on aborted fetal specimens (Herrera,
2002). Other studies used ultrasound examinations in order to obtain measurements (Grazitua,
2001). However, no study has attempted to correlate both ultrasound data and aborted fetal
measurements in order to show progression of fetal development and growth at specific
gestational ages.
This study will attempt to show normal alpaca fetal development as defined by the
studied specimens. It will also attempt to determine trends of development and growth of the
fetal alpaca at several different time points throughout gestation from day 42 through day 154
using trans-rectal ultrasound during gestation, and then fetal measurements post-termination. In
addition, this study seeks to show the accuracy of ultrasound examinations, the current field

5
method, as it relates to viewing specific fetal structures that represent the progression of fetal
development. This will be accomplished through the comparison of ultrasound images to CAT
scan images, and actual fetal dissections and measurements.
1Unpublished findings from the University of Massachusetts Amherst
2. Methods and Materials
This study followed five female alpacas from the time of breeding through the time of
termination of the pregnancy. Animals were all healthy and had at least one normal pregnancy
prior to the study. Females were followed for two semesters where some had multiple
pregnancies. The animals were kept in a group pen and turned out on pasture during daylight.
Sexual receptivity was tested every other day in order to determine if the females were
receptive. All females were tested even if a pregnancy was already established. This was to
reaffirm the continuing presence of the corpus luteum (CL). Males were haltered and brought to
the female alpaca pen where they were allowed to approach the females for breeding. If the
female alpaca assumed the sternal recumbent position, also known as cushing, she was
considered to be receptive. The degree of receptivity was also noted. In certain cases females
would cush immediately after being mounted by the male, but in other instances, the male would
mount the female for an extended time before the female cushed. The male was ultimately
removed from the female if cushing did not occur after one minute. Females that did not cush
immediately were considered to be “less” receptive. Every female that cushed during the sexual

6
receptivity testing was examined by transrectal ultrasound using a 5 MHz linear probe. The left
and right ovaries were examined for the presence of follicles. Follicles that exceeded 5mm in
diameter were considered to be of ovulatory size. Dominance follicles that suppressed the growth
of neighboring follicles were not seen. Several observations revealed ovaries with multiple large
follicles.
Females that displayed receptive behavior and had a follicle that exceeded 5 mm were
bred. Breeding lasted 15-20 minutes and a semen sample was collected post-copulation and
evaluated for a separate study. Post-breeding females were examined using transrectal ultrasound
every other day throughout the study.
Ovulation for bred females was confirmed when the presence of the CL was documented
and the female no longer displayed sexual receptivity. Contractility of the uterine horns was also
documented and graded on a scale of 1-3 where 3 is highest amount of contractility. The
presence of the embryonic vesicle was recorded, as well as, the embryonic vesicle as it moved
between the uterine horns prior to implantation. The embryonic vesicle was compressed by the
uterine horn contracting. This phenomenon was documented on film. The embryo proper was
measured in length as seen in Figure 14, in order to show the progression of fetal growth. When
cephalization was visible via ultrasound, the fetus was measured from the crown of the head to
the rump as seen in Figure 15.
The skull diameter was measured in two ways during the ultrasound examination. The
biparietal skull diameter (BPD) measured the distance between the parietal bones of the skull as
illustrated in Figure 13. The incisor to occipital diameter (IOD) measured from the distal part of
the incisor to the occipital as illustrated in Figure 14. The diameter of the orbit (OD) was
measured as shown in Figure 22 and ossification was observed (Figure 21). This structure has

7
been studied in Equine in order to determine gestational age using transrectal ultrasonographic
measurements and was found to be a method of estimating gestational age, (Turner, 2006). The
neck length (NL) was determined as Figure 23 indicates and ossification of the cervical vertebrae
(Figure 27). Abdominal length (Abl), height (Abh), and width (Adw) were not measured during
the ultrasound examinations due to the positioning of the fetus in utero, however, these structures
were measured on the actual fetuses (Figure 37). Total limb length (TLL) was measured as is
illustrated in Figure 28; however, individual bones were not observable. The stomach diameter
(SD) was measured as shown in Figure 31.
Each alpaca was examined every other day during gestation and the above structural
measurements recorded when they were visible. Pregnancies were terminated at specified time
points using 3cc subcutaneous prostaglandin injection. The time of injection will be considered
the time of abortion for the fetal specimen and gestational age will reflect the date of termination.
It is assumed that no growth occurred between the time of the prostaglandin injection and the
time of fetal expulsion. Prostaglandin injection was administered during the routine ultrasound
examination. Females who received the prostaglandin injection were confined to a small pen
where they did not have access to open pastures. They were held in this smaller pen until the
fetus had been passed. Females were still examined every other day during this period, as well
as, post expulsion of the fetus in order to track uterine regression for the purpose of another
study.
Date of fetal expulsion was recorded for each of the fetal specimens. When fetuses were
discovered, larger fetuses (102, 103, 126, and 154 days) were injected with formaldehyde and
then stored in clear glass jars containing 10% formaldehyde. Smaller specimens (42 day twins

8
and 74 day) were not injected, but were immediately stored in clear glass jars containing the 10%
formaldehyde. All fetuses were stored in 10% formaldehyde while they were not in use.
Prior to taking measurements, all fetuses were transferred to jars containing distilled
water and ethanol. The 102, 103, 126, and 154 day fetuses were transferred to the water and 10%
ethanol mixture several days before they were able to be worked with. All measurements were
taken using digital calipers. Crown rump length (CRL) was measured on all of the fetuses
(Figure 37). The fetal skull was measured for both the BPD (Figure 41), and IOD (Figure 40).
The abdominal width (abw) (Figure 38), abdominal height (abh), and abdominal length (abl)
were all measured. The neck length (NL) was measured, as well as, orbit diameter (OD) (Figure
40). The total length of the limb buds were recorded for the 42 day fetuses (Figure 34). For the
older fetuses the length of the humerus (h), radius (r), and carpus to hoof (c-h) measurements
were taken. The femoral length (f), metatarsus (mt), and tarsus to hoof (t-h) lengths were taken
(Figure 40).
While ultrasound measurements and fetal measurements provide two methods with which
to document fetal growth, a further method was employed in this study. Computer aided
tomography images (CAT scan images) of each of the fetuses were obtained. A Nana C.T.
manufactured by XRadia was performed on the 42 day twins in 13 micro sections. A Micro C.T.
was performed on the 74 day fetus using an Explore CT120 (manufactured by G.E.) in 100
micron sections. This data showed specific organ systems, skeletal system, and the muscular
system without blunt dissections of the specimens. This procedure also allows for not only
volumes of additional data for future studies, but also a three method comparison on the fetal
developments during alpaca gestation.

9
Female Alpaca Records
Female Alpaca Records
Alpaca Age (years) Height (inches) Weight (lbs) Number of Crias Female A 4 38.5 220 1 Female B 12 36.0 197 8 Female C 5 37.5 183 2 Female D 6 37.5 140 2* Female E 8 37.0 203 3*
Table A: Female alpaca records. *Female D had one healthy cria and one with a congenital defect that was euthanized shortly after birth. *Female E had two healthy crias and one stillborn.
Fetus Observed and Time of Termination of Pregnancy
Alpaca Fetus Observed
(days) Drug Administered
Injection to Expulsion (days)
Female A 154 150 µg
cloprostenol (PGF2α) SQ
4
Female B 126 3 doses of 150 µg
cloprostenol (PGF2α) SQ
2 after 3rd dose
Female C 103 150 µg
cloprostenol (PGF2α) SQ
4
Female D 102 150 µg
cloprostenol (PGF2α) SQ
3
Female E (2) 42 , 74 150 µg
cloprostenol (PGF2α) SQ
3
Table B: Dam and fetus observed and termination of pregnancy.

10
Initial Appearance of the Fetal Skull
First Appearance of Cephalization
Fetal Age (days) Initial Appearance of Fetal Skull (days) 154 (A) 71 120 (B) Unknown* 103 (C) 47 102 (D) 59 74 (E) 60
Table 1: Shows the cephalization (first appearance of the fetal skull) and the gestational age at which it was observed using linear probe ultrasound. *120 day fetus (B) was not studied during early gestation and thus occurrence of cephalization was not observed.
During the early embryonic stage of the specimens, the skull and other fetal structures
were not readily visible. The specimen appeared to be single echodense mass as seen in Figure 1
showing the 154 days fetus. Between days 47-71, cephalization (first appearance of the skull)
was noted. Cephalization was determined to have occurred when the distinct difference between
the fetal body, neck, and skull was visible (Figure 2). Determination of the occurrence of
cephalization was also verified by fetal head nods which were observed. These movements
showed a distinct movement of the skull without the movement of the fetal body suggesting the
appearance and function of the skull at this time. For Female B 126 day fetus the occurrence of
cephalization was not observed in this specimen because gestation was not able to be studied
until day 111, at which time, the skull was developed showing signs of ossification and regular
occurrence of head nods.

11
Female A 154 day fetus: Cephalization
Figure 1: 154 day fetus shown at 33 days without the appearance of the head. Specimen appears as a single echodense entity without the definition of a skull.
Figure 2: 154 day fetus shown at 71 days, indicating the occurrence of cephalization. .

12
Female C 103 day fetus: Cephalization
Figure 3: 103 day fetus shown at 47 days indicating the occurrence of cephalization. .

13
Female D 102 day fetus: Cephalization
Figure 4: 102 day fetus shown at day 59 shows the occurrence of cephalization as a ventral view of the skull.
Female E 74 day fetus: Cephalization
Figure 5: 74 day fetus showing cephalization at day 60 of gestation.

14
Observed Progression of Ossification of the Skull Ossification of the skull was identified through the appearance of increased echodensity
surrounding the perimeter of the skull. The initial observed sites of ossification progressively
increased in echodensity as gestational age increased. In addition, increased ossification was
observed throughout the skull as gestation progressed. This progression was seen around day 90
to 100 as seen in Figures 7, 8, 10 and 12. These areas of increased echodensity were not able to
be identified as specific bones of the skull, but did indicate that ossification occurred during early
gestation. Ossification of the skull was observed within the range of day 70-78. Female B 126
day fetus was not studied until day 111 of gestation so the initial appearance of ossification was
not able to be noted, however, at 111 days ossification of the skull was apparent. Ossification of
the skull was not observed in Female E 74 day fetus.

15
Female A 154 day fetus: Ossification
Figure 6: 154 day fetus shown at 72 days when Figure 7 154 day fetus shown at 101 days shows ossification was first observed as an area of increased an increase in echodensity when compared with echodensity around the perimeter of the skull. Figure 6 at day 72 of gestation.

16
Female B 126 day fetus: Ossification Female B 126 day fetus at 111 days showed progressed ossification. While the initial
appearance of ossification of the skull was not visible, the extent of ossification and echodensity
of the skull is comparable to that of the 154 day fetus at 101 days (Figure 7 and 8).
Figure 8: 120 day fetus shown at 111 days shows progressed ossification.

17
Female C 103 day fetus: Ossification
Figure 9: 103 day fetus at 70 days shows Figure 10: 103 day fetus at 98 days shows ossification as an increased area of echodensity an increase in the area of high around the skull perimeter echodensity surrounding the perimeter of the skull from the dorsal view.

18
Female D 102 day fetus: Ossification
Figure 11: 102 day fetus at 78 days shows ossification. Figure 12: 102 day fetus at 84 days shows an increase in echodensity around the perimeter of the skull. IOD and BPD of the Fetal Skull Two measurements of the fetal skull were recorded via ultrasound in this study, biparietal
skull diameter (BPD) and incisor-occipital diameter (IOD). BPD was measured as the distance
between the parietal bones (Figure 13). IOD was measured from the incisor to the occipital
(Figure 14). While it was attempted to obtain these measurements during each examination,
accuracy in obtaining measurements was dependent upon the positioning of the fetus at the time
of examination. Due to this, BPD and IOD were not always ably visible. BPD and IOD showed
linear growth that correlated with gestational age (Figure 15). In addition, a normal range of
BPD and IOD measurements was generated for specific gestational ages (Figure 15).

19
Figure 13: 103 day fetus at 98 days shows Figure 14: 102 day fetus at 78 days shows the BPD measurement as the distance between IOD measurement as the distance between the the parietal bones of the skull (BPD 22mm). incisor and occipital bones of the skull (IOD 27mm)
Ultrasound BPD and IOD Measurements for Day of Gestation
Days of Gestation (days)
Female A 154 day fetus
Female B 126 day fetus
Female C 103 day fetus
Female D 102 day fetus
BPD (mm)
IOD (mm)
BPD (mm)
IOD (mm)
BPD (mm)
IOD (mm)
BPD (mm)
IOD (mm)
47 10 70 19 71 20 72 24 73 24 78 27 81 26 85 25 20 31 87 31 89 33 92 31 94 28 96 36 98 22 99 40 101 28 111 25 113 47 117 46 119 58 129 49 123 51
Table 2: Growth of BPD and IOD correlated with gestational age
using images from ultrasound examinations.
20
IOD and BPD vs Gestational Age
0102030405060708090
0 50 100 150 200
Gestational Age (days)
Gro
wth
(m
m)
BPD (mm)
IOD (mm)
Actual Fetal BPD
Actual Fetal IOD
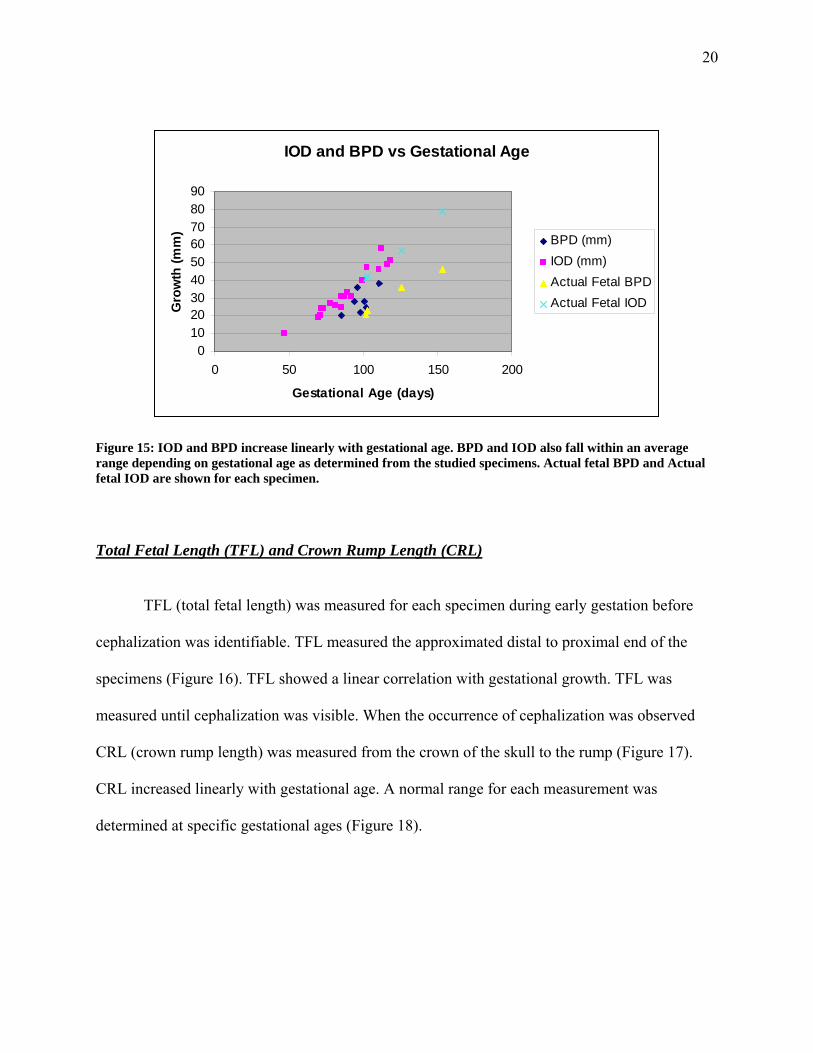
Figure 15: IOD and BPD increase linearly with gestational age. BPD and IOD also fall within an average range depending on gestational age as determined from the studied specimens. Actual fetal BPD and Actual fetal IOD are shown for each specimen. Total Fetal Length (TFL) and Crown Rump Length (CRL) TFL (total fetal length) was measured for each specimen during early gestation before
cephalization was identifiable. TFL measured the approximated distal to proximal end of the
specimens (Figure 16). TFL showed a linear correlation with gestational growth. TFL was
measured until cephalization was visible. When the occurrence of cephalization was observed
CRL (crown rump length) was measured from the crown of the skull to the rump (Figure 17).
CRL increased linearly with gestational age. A normal range for each measurement was
determined at specific gestational ages (Figure 18).

21
Figure 16: 103 day fetus at 32 days shows Figure 17: 103 day fetus at 70 days shows CRL TFL measurement (TFL 15mm) measurement (CRL 56mm)
TFL and CRL Correlated with Gestational Age
Gestational Age (days)
154 day fetus 103 day fetus 102 day fetus 74 day fetus 42 day fetus
(A) 42 day fetus
(B) TFL (mm)
CRL (mm)
TFL (mm)
CRL (mm)
TFL (mm)
CRL (mm)
TFL (mm)
CRL (mm)
TFL (mm)
CRL (mm)
TFL (mm)
CRL (mm)
21 7 23 13 30 11 31 5 32 15 33 12 16 5 35 12 17 38 18 15 12 40 18 13 42 10 45 26 18 47 27 24 52 28 21 54 32 35 35 56 34 35 59 26 27 40 61 37 44 63 49 36 43 66 52 54 38 68 39 46 70 56 72 60 75 65 85 70
Table 3: TFL and CRL correlated with gestational age using ultrasound images. Blank spaces are due to inability to obtain measurements.

22
TFL and CRL vs. Gestational Age
0
50
100
150
200
250
300
0 50 100 150 200
Gestational Age (days)
Gro
wth
(m
m)
TFL (mm)
CRL (mm)
Actual Fetal CRL (mm)
Figure 18: TFL and CRL increase linearly with gestational age. A normal range of TFL and CRL was determined using the fetal specimens studied. Actual fetal CRL is shown for each specimen. Growth and Ossification of the Orbit The OD (orbital diameter) was measured in all fetal specimens where it was visualized as
shown in Figure 19. Initial observation of the orbit was approximately between days 60 to 87.
Initial observation and start of ossification for Female B 126 day fetus was not recorded,
however, the first observation at day 111 showed significant development and ossification of the
orbit (Figure 22). Ossification of the orbit was observed as an increase in echodensity after day
85 (Figure 20). An increase in echodensity around the orbit after day 85 suggested a progression
of ossification that correlated with the ossification of the skull (Figure 23). OD increased linearly
with gestational age and IOD measurement (Figure 23).
23
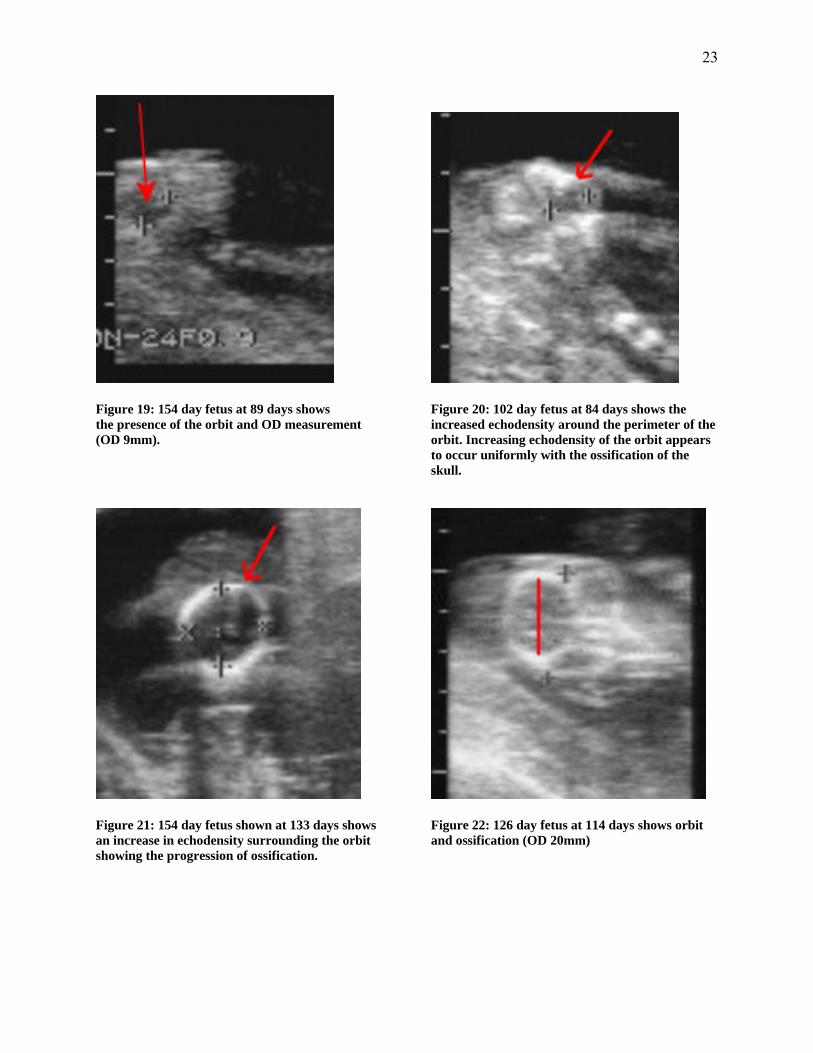
Figure 19: 154 day fetus at 89 days shows Figure 20: 102 day fetus at 84 days shows the the presence of the orbit and OD measurement increased echodensity around the perimeter of the (OD 9mm). orbit. Increasing echodensity of the orbit appears to occur uniformly with the ossification of the skull.
Figure 21: 154 day fetus shown at 133 days shows Figure 22: 126 day fetus at 114 days shows orbit an increase in echodensity surrounding the orbit and ossification (OD 20mm) showing the progression of ossification.

24
OD measurements correlated with Gestational Ages
Gestational Age
(days) Female A 154 day
fetus Female B 126 day
fetus Female C 103 day
fetus Female D 102 day
fetus OD (mm) OD (mm) OD (mm) OD (mm)
60 3 72 6 78 7 81 8 83 7 87 5 89 9 93 6 95 11
113 12 10 117 15 121 16 133 17
Table 4: Correlation of OD measurements with gestational age using ultrasound images.
Figure 23: IOD and OD both increase linearly with gestational age.
Development and Ossification of the Neck Length and Cervical Vertebrae
The development of the fetal neck was documented after cephalization was observed.
Gross measurements of the neck length (NL) were recorded, measuring below the mandible to
the approximated cranial end of the scapula (Figure 23). NL was not measured consistently, so
IOD and OD vs. Gestational Age
0 10 20 30 40 50 60 70
0 50 100 150
Days
mmIOD (mm)Orbit (mm)

25
conclusions can not be made regarding development. Ossification of the neck was determined
when there was an increase in echodensity of the cervical vertebrae allowing them to be visible
(Figure 24). Ossification of the cervical vertebrae was observed between 70-80 days.
Figure 23: 154 day fetus at 73 days shows the Figure 24: 102 day fetus at 84 days shows increase NL measurement (NL 12mm) in echodensity at the site of the cervical vertebrae.
Figure 25: 102 day fetus at 76 days shows the Figure 26: 103 day fetus at 72 days shows increase ossification of the cervical vertebrae. in echodensity of the cervical vertebrae .

26
Figure 27: 154 day fetus at 94 days shows the increase in echodensity of the cervical vertebrae.
Limb Development Initial observation of the limbs occurred at varying times for each fetal specimen ranging
from 57-70 days. The total length of the limb was measured from the approximated distal hoof to
where it appeared the limb extended from the fetal body (Figure 28). The ultrasound images are
not able to show individual bones of the limbs so total limb length (TLL) was measured. While
limb buds were present on the 42 day fetuses, these were not visible using the ultrasound
method. No limb measurements were able to be captured for Female B 126 day fetus.
27
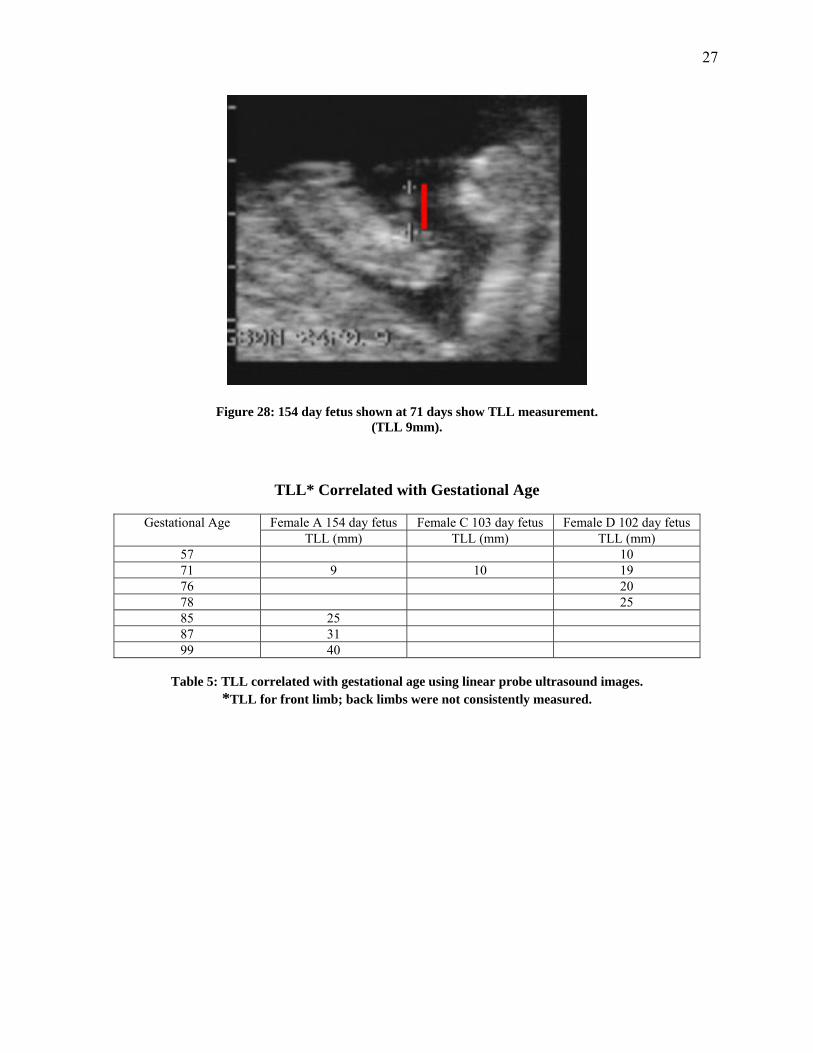
Figure 28: 154 day fetus shown at 71 days show TLL measurement. (TLL 9mm).
TLL* Correlated with Gestational Age
Gestational Age Female A 154 day fetus Female C 103 day fetus Female D 102 day fetus TLL (mm) TLL (mm) TLL (mm)
57 10 71 9 10 19 76 20 78 25 85 25 87 31 99 40
Table 5: TLL correlated with gestational age using linear probe ultrasound images.
*TLL for front limb; back limbs were not consistently measured.

28
TLL vs Gestational Age
05
1015202530354045
0 20 40 60 80 100 120
Gestational Age (days)
gro
wth
(m
m)
TLL (mm)
Figure 29: TLL versus Gestational Age shows that TLL increases linearly with gestational age. Development of the Fetal Stomach The stomach was identified as a circular area of low echodensity present in the lower
abdomen of the fetus. In early gestation, the stomach appeared as an area of low echodensity in
within the fetal body (Figure 30). As gestation progressed, the stomach appeared in the lower
abdomen of the fetus (Figure 31). The individual compartments of the stomach were not visible,
but it is hypothesized that C1 is the compartment of the stomach that is most defined on the
ultrasound images (Figure 31). The diameter of the stomach (SD) was measured throughout
gestation and appeared to increase linearly with gestational age (Figure 32).

29
Figure 30: 103 day fetus shown at 39 days Figure 31: 154 day fetus shown at 114 days shows what shows the initial appearance of the stomach appears to be C1 of the stomach. (SD 13mm) as an area of low echodensity in the approximated abdomen of the specimens. (SD 3mm)
SD Correlated with Gestational Age
Gestational Age (days)
Female A 154 day fetus
Female B 126 day fetus
Female C 103 day fetus
Female D 102 day fetus
SD (mm) SD (mm) SD (mm) SD (mm) 39 3 62 9 78 9 81 7 84 10 10 88 16 96 9
100 10 112 14 114 13 120 14
Table 6: SD correlates linearly with gestational age.

30
SD vs. Gestational Age
02468
1012141618
0 50 100 150
Gestational Age (days)
SD
(m
m)
SD (mm)
Figure 32: SD increases linearly with gestational age. The normal range for SD is determined for specified gestational ages.
Dissection and Measurement of Fetal Specimens Females A-E were followed during each of the gestations every other day and ultrasound
pictures documented the developments of the fetuses through measurements detailed in the
previous sections. At 42 days Female E’s gestation was terminated. The twin fetuses were
expelled three days after the administration of a prostaglandin injection. Female E’s second
gestation was terminated at 74 days and was expelled 3 days after the injection. Female D’s
gestation was terminated at 102 and expelled after 4 days. Female C’s gestation was terminated
at 103 days and was expelled after 2 days. Female B’s gestation was terminated at 126 days and
expelled after 2 days. Lastly, Female A’s gestation was terminated at 154 days and the fetus was
expelled after 4 days (Table B, Methods and Materials). As stated previously, fetuses were kept
in 10% formaldehyde. Larger fetuses (154, 126, 102, and 103 days) were injected with
formaldehyde. Prior to being handled, the fetuses were transferred into a 10% ethanol and
distilled water. Picture documentation was recorded for all specimens. Several structures were
measured and evaluated for comparison with ultrasound and CAT scan images. BPD was

31
measured as the distance between the two parietal bones (Figure 41), IOD was measured from
the incisor to the occipital, OD, NL, abdominal length (Abl), abdominal width (Abw) (Figure
38), abdominal height (Abh) were measured on all of the fetuses. Front limbs were measured as
humerus (H), radius (R), and carpus to hoof (c-h). Back limbs were measured as femur (F),
metatarsus (Mt), and tarsus to hoof (t-h). The 42 day twins were photographed with the fetal
membrane intact (Figure 33) and then dissected from the fetal membrane for structural
measurements (Figure 34). Limb buds were measured on the two 42 day fetuses due to the lack
of development of the limb bones. Female E 74 day fetus was also photographed inside the fetal
membrane and then dissected out and measured (Figure 35). All fetal measurements are
documented in Tables 7-11.
Figure 33: 42 day fetus (B) intact in fetal membrane.

32
Figure 34: 42 day fetus (A) dissected out of the fetal membrane. (OD= orbit diameter, IOD= incisor-occipital diameter, NL= neck length, LB= limb bud, Abh= abdominal height, Abl= abdominal length, CRL= crown rump length).
Figure 35: 74 day fetus dissected out of the fetal membrane. (OD= orbit diameter, IOD= incisor-occipital diameter, NL= neck length, h= humerus, r= radius, c-h= carpus to hock, abl= abdominal length, abh= abdominal height, f= femur, mt= metatarsus, t-h= tarsus to hock).

33
Figure 36: 102 day fetus (OD= orbit diameter, IOD= incisor-occipital diameter, NL= neck length, h= humerus, r= radius, c-h= carpus to hock, abl= abdominal length, abh= abdominal height, f= femur, mt= metatarsus, t-h= tarsus to hock).
Figure 37 :103 day fetus (CRL= crown rump length, OD= orbit diameter, IOD= incisor-occipital diameter, NL= neck length, h= humerus, r= radius, c-h= carpus to hoof, abl= abdominal length, abh= abdominal height, f= femur, mt= metatarsus, t-h= tarsus to hoof)
34
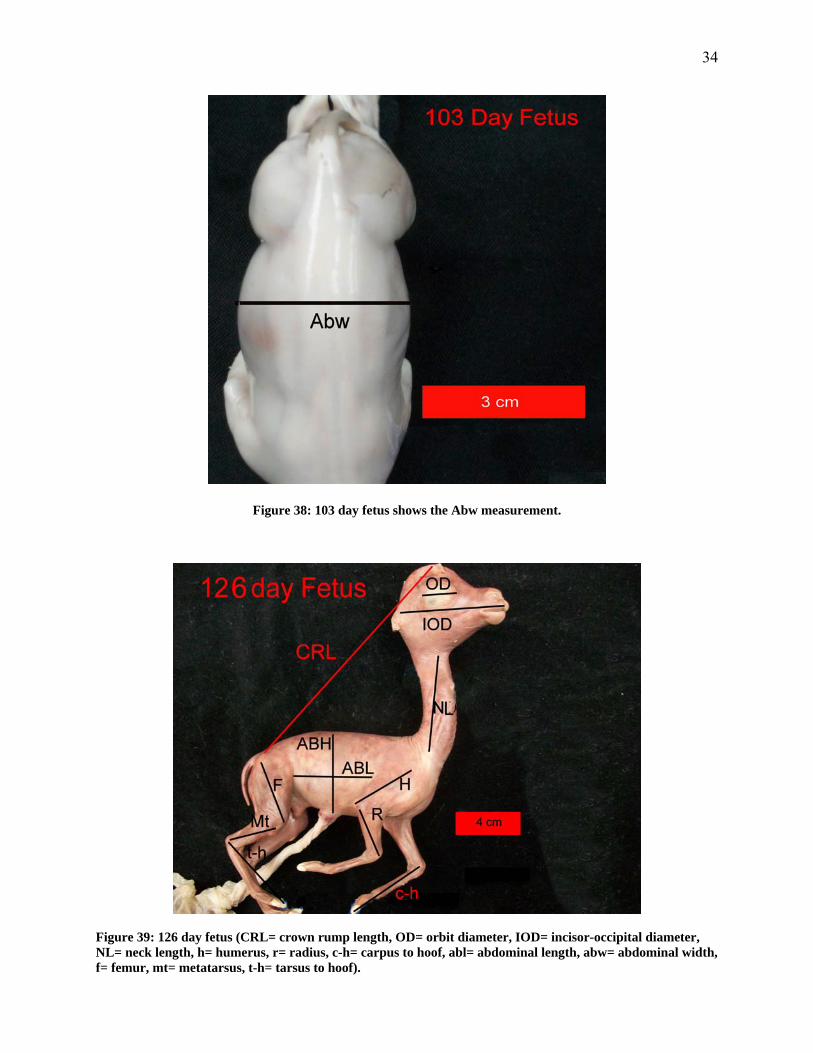
Figure 38: 103 day fetus shows the Abw measurement.
Figure 39: 126 day fetus (CRL= crown rump length, OD= orbit diameter, IOD= incisor-occipital diameter, NL= neck length, h= humerus, r= radius, c-h= carpus to hoof, abl= abdominal length, abw= abdominal width, f= femur, mt= metatarsus, t-h= tarsus to hoof).

35
Figure 40: 154 day fetus (CRL= crown rump length, OD= orbit diameter, IOD= incisor-occipital diameter, NL= neck length, h= humerus, r= radius, c-h= carpus to hoof, abl= abdominal length, abw= abdominal width, f= femur, mt= metatarsus, t-h= tarsus to hoof).
Figure 41: 154 day fetus showing BPD measurement.
36
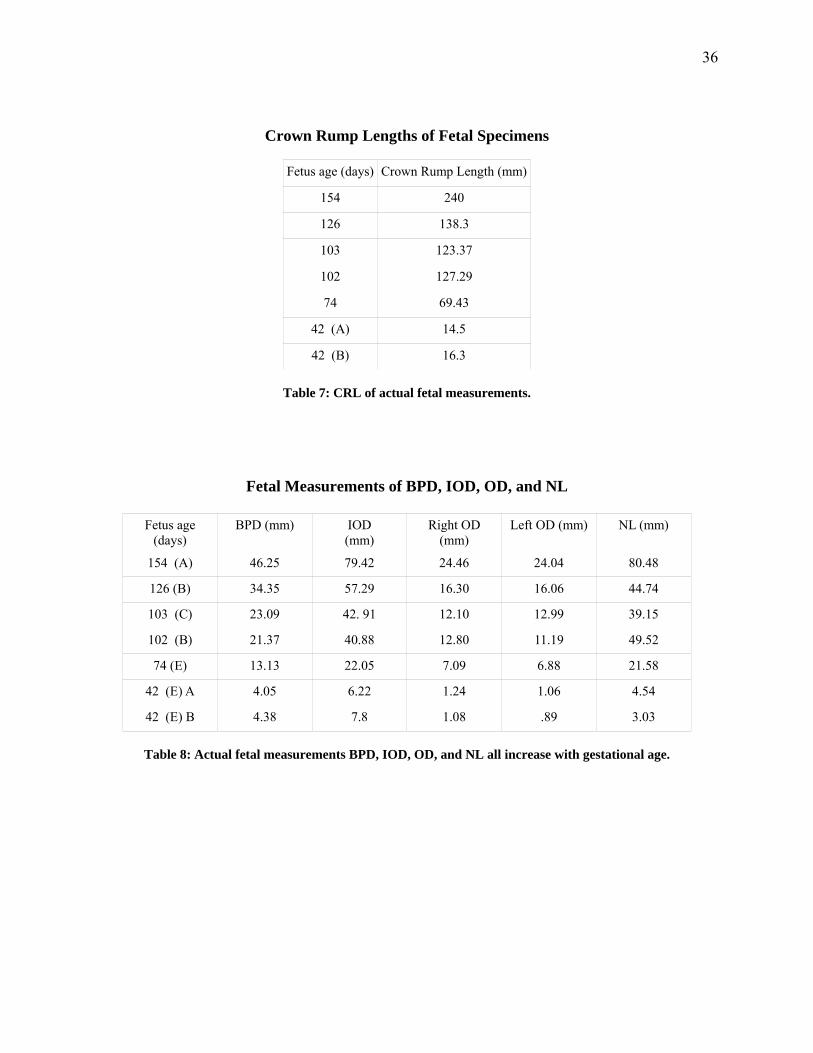
Crown Rump Lengths of Fetal Specimens
Fetus age (days) Crown Rump Length (mm)
154 240
126 138.3
103 123.37
102 127.29
74 69.43
42 (A) 14.5
42 (B) 16.3
Table 7: CRL of actual fetal measurements.
Fetal Measurements of BPD, IOD, OD, and NL
Fetus age (days)
BPD (mm) IOD (mm)
Right OD (mm)
Left OD (mm) NL (mm)
154 (A) 46.25 79.42 24.46 24.04 80.48
126 (B) 34.35 57.29 16.30 16.06 44.74
103 (C) 23.09 42. 91 12.10 12.99 39.15
102 (B) 21.37 40.88 12.80 11.19 49.52
74 (E) 13.13 22.05 7.09 6.88 21.58
42 (E) A 4.05 6.22 1.24 1.06 4.54
42 (E) B 4.38 7.8 1.08 .89 3.03
Table 8: Actual fetal measurements BPD, IOD, OD, and NL all increase with gestational age.

37
Back Limb Measurements
Fetus age (days)
Right Femur (mm)
Left Femur (mm)
Right Metatarsus
(mm)
Left Metatarsus
(mm)
Right Tarsus-Hoof (mm)
Left Tarsus-Hoof (mm)
154 (A) 64.76 64.25 62.74 63.78 76.55 78.37
126 (B) 39.99 39.47 43.02 43.06 50.50 49.64
103 (C) 31.93 32.59 30.40 31.97 32.90 29.62
102 (D) 30.77 31.78 28.70 30.49 34.75 35.22
74 (E) 15.67 16.44 13.29 12.83 14.99 15.50
Table 9: Actual fetal measurements of the hind limbs.
Front Limb Measurements
Fetus age (days) Right Humerus (mm)
Left Humerus (mm)
Right Radius (mm)
Left Radius (mm)
Right Carpus to Hoof (mm)
Left Carpus to Hoof (mm)
154 (A) 65.79 54.39 50.64 50.61 65.79 71.20
126 (B) 33.49 35.71 34.84 34.78 46.15 47.61
103 (C) 18.16 18.04 24.37 23.34 30.89 32.49
102 (D) 23.13 19.89 25.13 24.16 27.42 31.20
74 (E) 13.01 13.91 10.55 11.45 13.75 13.42
Table 10: Actual fetal measurements of the front limbs.
Limb Bud Measurements
Fetus Age (days) Front Right Limb Bud (mm)
Front Left Limb Bud (mm)
Back Right Limb Bud (mm)
Back Left Limb Bud (mm)
42 day A (E) 3.62 5.47 5.04 4.62
42 day B (E) 3.91 4.10 5.14 5.07
Table 11: Actual fetal measurements of the limb buds for the 42 day twins.

38
Abdominal Measurements
Fetus age (days) Abdominal Length (mm) Abdominal Width (mm) Abdominal Height (mm)
153 (A) 53.76 53.25 60.08
126 (B) 49.03 38.26 42.60
103 (C) 37.62 29.99 35.09
102 (D) 33.06 27.23 26.40
74 (E) 23.83 -* 18.02
42 (E) A 5.88 3.73 3.54
42 (E) B 4.20 4.73 4.61
Table 12: Actual fetal abdominal measurements.
* Abw was not able to be obtained for 74 day fetus Correlation of Computer aided tomography imaging with ultrasound images and fetal measurements shows progression of alpaca fetal growth As stated previously, fetal developments can be documented and followed using
conventional ultrasound examinations. This field method is incredibly useful for determining
whether a pregnancy is established, but as this study has proposed; it can also be used in order to
determine key fetal developments that occur during gestation. In order to confirm the accuracy of
the ultrasound field technique in identifying developmental occurrences, as well as, determining
normal fetal developments for specific time points, aborted fetal specimens of followed
pregnancies were obtained and measured. These measurements attempted to establish “normal”
sizes of fetal structures at their specific gestational ages. In order to further assess the ultrasound
technique ability as a gestational age and normal fetal development determinant, a computer
aided tomography technique was utilized. This technique sought to add a third medium of
comparison. Specific views of the fetuses were obtained using the CAT scan technique. These
views of specific structures were then compared to those obtained using the ultrasound method
and the actual fetal dissections. For the 103 and 102 day fetuses, CAT scan images were not

39
obtained so a blunt dissection of the gut was conducted in order to view the compartments of the
stomach for comparison with ultrasound images.
Progression of Development of the Stomach Development of the stomach was visualized using the CAT scan imaging, in order to
view the progression of development of the stomach into the three compartments. The individual
compartments of the stomach were not discernable using ultrasound methods so it was unclear
the extent of development that had occurred up until the time of termination of the pregnancy.
Figure 42 (Apostoli, 2004) shows the stomach anatomy of a mature alpaca.
Figure 42: Diagram shows the gastrointestinal tract of a mature alpaca.
(Apostoli, 2004)
Comparison of Stomach Development: Female A 154 day fetus Female A 154 day fetus CAT scan image of the compartments of the stomach shows a
clear depiction of compartment 1 (C1), C2, and C3 (Figure 43). Figure 45 shows the same fetus
earlier in gestation at day 114 with a stomach diameter of 13mm using ultrasound imaging. A

40
comparison in the shape and placement of the stomach inside of the fetal body suggests this is
also C1. Figure 44 shows the fetus earlier in gestation at day 98 the stomach measuring 9mm.
The similar shape also suggests that this is C1.
Figure 43: 154 day fetus CAT scan image shows C1 Figure 44: 154 day fetus ultrasound image at 98 (indicated).This shows that the stomach is days shows the assumed C1 of the stomach in a differentiated into the three compartments by similar orientation as Figure 43. (SD= 9mm) day154 of gestation. .
Figure 45: 154 day fetus ultrasound image at 114 days in similar orientation assumed C1 of the stomach (SD=13mm)

41
Comparison of the Development of the Stomach: Female B 126 day fetus CAT scan images of the 126 day fetus show the three compartmented stomach present at
day 126. C1 is visible in Figure 46. Ultrasound images of the stomach show similar shape and
orientation of the stomach when it appears as an area of low echodensity in the abdomen of the
fetus (Figure 47). This suggests that differentiation of the stomach into separate compartments
occurs during early gestation.
Figure 46: 126 day fetus CAT image shows Figure 47: 126 day fetus ultrasound image shows C1 C1. in similar orientation as Figure 46 (SD= 14mm). Comparison of Development of the Stomach: Female C 103 day fetus Female C 103 day fetus was not scanned using the CAT scan technique. In order to
compare the development of the gastrointestinal tract to that observed in the ultrasound image, a
blunt dissection of the fetus was performed. An incision was made dorsally from the umbilicus to
the caudal end of the sternum. Incisions were made ventrally towards the scapula and femor. The
42
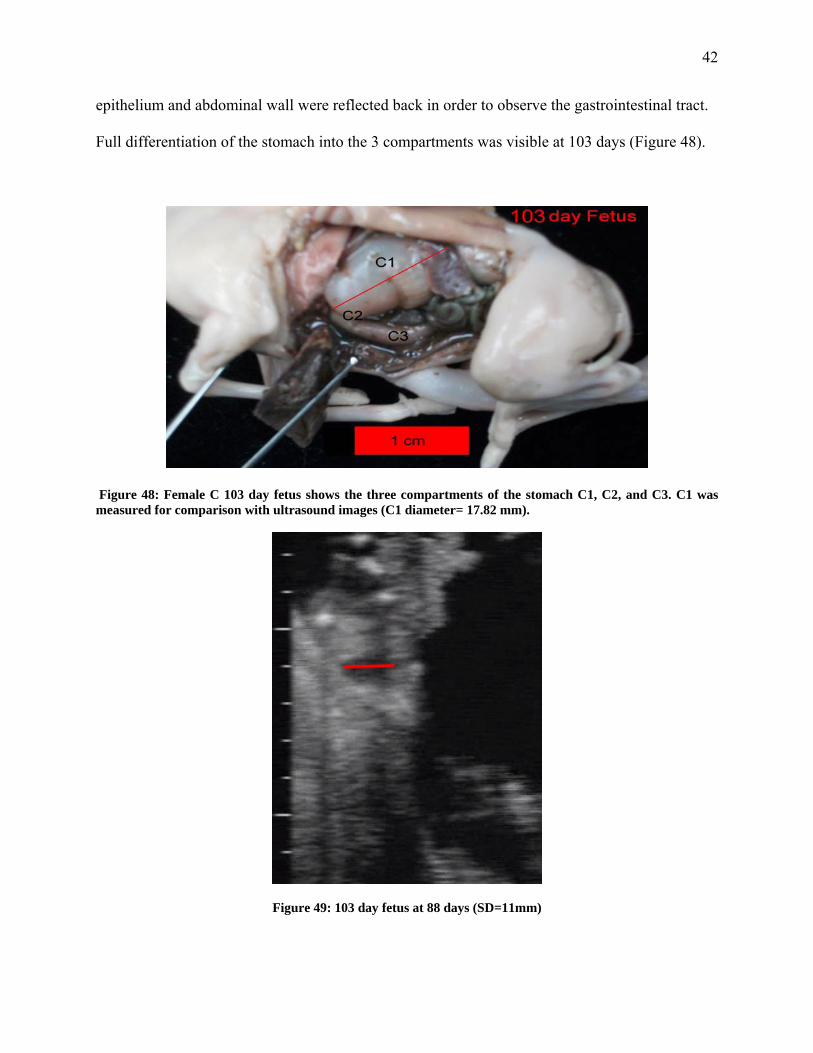
epithelium and abdominal wall were reflected back in order to observe the gastrointestinal tract.
Full differentiation of the stomach into the 3 compartments was visible at 103 days (Figure 48).
Figure 48: Female C 103 day fetus shows the three compartments of the stomach C1, C2, and C3. C1 was measured for comparison with ultrasound images (C1 diameter= 17.82 mm).
Figure 49: 103 day fetus at 88 days (SD=11mm)

43
Comparison of Development of the Stomach: Female D 102 day fetus Female D 102 day fetus was dissected according to the same procedure as Female C 103
day fetus. C1 and C3 were easily visible; however, C2 was more difficult to observe (Figure 50).
All three compartments of the stomach were differentiated by day 102. Similarities in size and
orientation it can be assumed that the SD in Figure 50 is C1.
Figure 50: 102 day fetus shows the C1 and C3 compartments of the stomach (C1 19.43mm).

44
Figure 51: 102 day fetus at 81 days (C1 7mm).
Ossification of the Skull, Orbit, and Cervical Vertebrae CAT scan imaging allowed for the viewing of ossification of the skull from both a dorsal,
ventral, and lateral view. These views were measured using ultrasound and actual fetal
measurements as BPD and IOD respectively. The ossification, seen as areas of increased
echodensity using the ultrasound imaging, was compared with the extent of ossification seen in
the CAT scan images. Ossification occurred in similar areas as seen in the two methods of
imaging. The CAT scan images also showed ossification of the orbit and cervical vertebrae. A
similar appearance was seen in the ultrasound images through increased echodensity in the same
areas as ossification in the CAT scan images. This suggests that ultrasound imaging is an
accurate indicator of ossification progression as it occurs throughout fetal development.
Ossification of the Skull, Orbit, and Cervical Vertebrae: Female A 154 day fetus
A CAT scan image of the skull from the lateral orientation IOD is shown in Figure 53
with progressed ossification. This image when compared with Figure 52, ultrasound image from
119 days, shows similar ossification of the skull. A CAT scan image showing the dorsal skeletal

45
view of the skull (Figure 56) shows similar ossification as seen in Figure 55, and in the
ultrasound image from day 98 (Figure 54). Ossification of the OD was seen in both the CAT
scan image (Figure 62) and the ultrasound images (Figure 60, 61). Ossification of the cervical
vertebrae was also seen using both methods (Figures 57, 58, 59).
. Figure 52: 154 day fetus at 119 days shows IOD Figure 53: 154 day fetus CAT scan image shows an IOD measurement of 58mm and progressed ossification as measurement of 79.42 mm. Progressed ossification shown by the areas of high echodensity surrounding the has occurred throughout the skull. perimeter of the skull.
Figure 54: 154 day fetus CAT image shows BPD Figure 55: 154 day fetus at 98 days shows measurement 46.25 mm showing ossification of the similar ossification of temporal and parietal and temporal bones. parietal bones of the skull due to high echodensity at the perimeter of the skull.

46
Figure 56: 154 day fetus CAT dorsal image of the skull showing BPD. Similar sites of ossification are present in comparison to the ultrasound
image in Figure 54.
Figure 57: 154 day fetus CAT images shows the ossification Figure 58: 154 day fetus at 94 days shows the of cervical vertebrae. ossification of the cervical vertebrae.

47
Figure 59: 154 day fetus CAT scan image shows the Figure 60: 154 day fetus at 119 days showing full ossification of the cervical vertebrae. ossification as an area of increased echodensity.
Figure 61: 154 day fetus at 133 days OD measuring Figure 62: 154 day fetus orbits (indicated) 17mm shows ossification around the orbit. measuring approximately 24mm. Extensive ossification is seen surrounding the orbit. Ossification of the Skull, Orbit, and Cervical Vertebrae: Female B 126 day fetus Ossification of the skull was visible using CAT scan images that viewed different
orientations of the skull that were also viewed using ultrasound during gestation. Lateral
orientation of the skull was not captured for Female B 126 day fetus so no comparison can be

48
made between the CAT scan images, ultrasound, and fetal measurement data. A CAT scan image
capturing the skull in the dorsal view, the orientation that was used to measure BPD, is shown in
Figure 64. Figure 64 shows widespread ossification of the skull in predominately the areas of the
parietal, temporal, and occipital bones. An ultrasound image taken earlier in gestation shows the
fetal skull in the same dorsal orientation, showing the same areas of ossification as areas of high
echodensity surrounding the perimeter of the skull (Figure 63). This comparison suggests that
ossification of the skull at 111 days is similar to that at 126 days and is visible using ultrasound.
The ossification of the cervical vertebrae was visualized using ultrasound (Figure 65).
Ossification of the cervical vertebrae was also observed in a CAT image (Figure 66).
Ossification of the orbit was also observed in CAT scan images (Figure 68).
Figure 63: 126 day fetus at 111 days shows a dorsal view Figure 64: 126 day fetus CAT image shows the of the skull. Ossification is visible as areas of high extent of ossification up to day 126. Ossifcation echodensity in the areas of the occipital, temporal, and has occurred in the occipital, parietal, and parietal bones. (BPD 25mm). temporal bones. (BPD 35mm).

49
Figure 65: 126 day fetus shown at 117 days shows the Figure 66:126 day fetus CAT image shows the ossification of the cervical vertebrae. the ossification of the cervical vertebrae.
Figure 67: 126 day fetus shown at 117 days shows Figure 68: 126 day fetus CAT image shows ossification of around the orbit. (OD 10mm) ossification surrounding the orbit. (OD 16mm) Comparison of CAT scan images, Ultrasound images, and Actual Fetal Observations of the 42 day Fetuses CAT scan images and actual fetal measurements of the 42 day fetuses revealed the
presence of structures and developments that were not visible using ultrasound images. Actual
fetal observations of the 42 day twins showed that cephalization had occurred, as well as, the
early development of the orbit (Figure 69, 70). Ultrasound images of the two fetuses at day 42

50
(day of prostaglandin injection), show a single fetal unit without the visible differentiation of the
head or presence of the orbit (Figure 71). This proves that prior to 42 days, certain fetal
structures such as the skull, orbit, and limb buds, may not be visible using linear probe
ultrasound, however, these structures are present early in gestation.
Figure 69: 42 day fetus (A) CAT image shows the Figure 70: 42 day fetus (A) shows an actual fetal presence of cephalization, orbit, and limb buds. image with the presence of cephalization, orbit, and limb buds.
Figure 71: 42 day fetus (A) shown at 42 days. Fetus appears with out evidence of cephalization, development of the orbit, or
presence of limb buds.

51
Discussion:
Normal Range and Progression of Fetal Developments
Through the use of the ultrasound method, images of the 6 specimens obtained
throughout gestation indicated that there is a normal range for the size and development of the
observed fetal structures at specific time points throughout gestation.
Initial Observation of the Fetal Skull
In this study the initial observation of the fetal skull fell within the range of 47-71 days.
This wide range is due to the positioning of the fetus in utero during the time of examination.
However, what can be concluded is that the presence of the fetal skull can be visualized during
ultrasound examinations as early as 47 days (Table 1).
Normal Range for Fetal IOD and BPD
Measurements of IOD and BPD throughout the gestations of the fetal specimens resulted
in the determination of a normal range of IOD and BPD measurements for each gestational age.
Table 2 shows ultrasound data obtained from the observation of the fetal specimens throughout
gestation. Fetal measurements for the six specimens are within a few millimeters at comparable
gestational ages. This point is also illustrated in Figure 15. Regular measurements were taken of
the IOD and BPD. The ability to obtain a BPD or IOD measurement depended on the position of

52
the fetus in utero. It can be concluded that both BPD and IOD increase linearly with gestational
age (Figure 15).
Progressive Ossification of the Skull
The first indication of ossification of the fetal skull was identified as an increased area of
echodensity that occurred around the perimeter of the skull between days 70-80 (Figures 8-11).
Ossification was observed both from the lateral view of the skull as well as the dorsal and ventral
views. The ossifications of specific bones of the skull were estimated using the ultrasound and
CAT scan images.
The hypothesis that ossification of the skull occurs within the range of gestational ages of
42-154 days was proven through the use of the CAT scan imaging technique. Figures 52-68
show that widespread ossification has occurred not only in the skull, but also throughout the fetal
body, thus proving that the ultrasound imaging method is accurate to determine the extent of
ossification of the fetal skeleton.
General Development of the Fetal Stomach
Initial appearance of the fetal stomach was identified using ultrasound imaging between
39 and 84 days of gestation (Table 6). At 39 days the appearance of the stomach was an area of
low echodensity present in the fetus (Figure 30). The continual observation of this same low
echodensity area showed that as gestation progressed the fetal stomach diameter grew linearly
with gestational age (Figure 32). In addition, a normal range of fetal stomach size was
determined for each gestational age in these specimens (Figure 32).
Ultrasound images were compared to the 126 and 154 day fetus CAT scan images and to
the fetal dissection images for the 102 and 103 day fetuses. The conclusion from this comparison

53
was that the fetal stomach structure visible during ultrasound examinations was the first
compartment (C1). This was concluded by comparing the stomach diameter measured in
ultrasound images to the actual stomach diameter measured using CAT scan images and fetal
dissections. The shape and positioning of the stomach also allowed for this conclusion. Figures
43-47 illustrate this point.
TFL and CRL Measurements
TFL was measured with ultrasound starting at the initial observation of the embryo
proper which occurred approximately between 21 and 38 days (Table 3). It was measured until
the distinction between the fetal skull and body was visible. This distinction occurred between 56
and 66 days (Table 3), after which time CRL was measured. There was an average range of TFL
and CRL for all of the specimens at specific gestational ages (Figure 18). This suggests that the
TFL and CRL increase linearly with the progression of gestation (Figure 18). Actual fetal CRL
measurements using calipers for each of the specimens also shows that there is a linear
progression of growth for CRL for fetuses with increasing gestational age (Figure 18).
Progression of Ossification and Linear Growth of the Eye and Orbit
Initial ultrasound observations of the fetal eye occurred between 60 and 70 days (Table
4), at which time ossification of the orbit was not evident (Figure 19). OD and IOD increased
linearly with increasing gestational age (Figure 23). OD increased linearly compared to IOD
which shows that growth of the fetal skull occurs uniformly and linearly with increasing
gestational age (Figure 23). Ossification of the orbit was observed during ultrasound
examinations as an area of increased echodensity around the fetal eye. This was initially
observed at approximately 85 days. It was also observed that there was an increase in the

54
echodensity of the initial echodense area representing the orbit after 85 days through 100 days.
This suggests that the ossification of the orbit may be completed at approximately 100 days
(Figures 21 and 22). Ossification of the orbit also appeared to coincide with the ossification of
other areas of the skull as seen in Figure 20. CAT scan images of the 154 day fetus and the 126
day fetus demonstrated the full ossification of the orbit which suggests that the ultrasound
images were accurate in their depiction of the progression of the ossification of the orbit (Figures
62 and 68).
Linear Growth of the Limbs with Gestational Age
Initial ultrasound observation of the limbs occurred between days 57 and 70 (Table 5).
Sufficient data was not able to be collected on the growth of the limbs due to the position of the
fetus in utero. Positioning of the fetus occasionally obstructed the view of the limbs resulting in
an inaccurate measurement or the inability to view and measure the limbs. Sufficient data was
obtained in order to conclude that TLL increases linearly with gestational age (Figure 18).
It can be concluded using the CAT scan images that limbs are present at day 42 even
when they are not visible using ultrasound methods. Limb buds were present in the fetuses that
were aborted at 42 days (Figures 69 and 70). Limbs that were developed into distinct bones were
visible in the 74 day fetus actual fetal images (Figure 36). This suggests that limb development
occurs between days 42 and 74 of gestation.
Using Ultrasound Images and Fetal Measurements to Determine Rate of Growth
Comparing the final ultrasound images of fetal structures with the actual measurements
of the terminated fetuses allowed for the determination of rate of growth for various structures.

55
The rate of growth increased linearly with gestational age so that during later gestation, fetal
growth was noted to occur more rapidly than during early gestation.
The final observation of IOD prior to termination of the pregnancy was compared with
the IOD obtained from the physical measurement of the fetal specimen. The data obtained from
these examinations was used to determine the average rate of growth per day (Table 70). The
computed average rate of growth for IOD shows that in early gestation, as seen with the 102 day
fetus, rate of growth is slower, gaining approximately 0.54 mm per day. As gestation progresses,
it can be seen that rate of growth of the IOD increases to 1.06 mm per day (Table 13).
Rate of growth was determined for the BPD and a similar trend was seen as with IOD
where rate of growth increased with increasing gestational age (Table 14). Growth rate was
determined for CRL and this trend was found with this measurement as well, except for in the 72
days fetus (Table 15). This specimen showed a 5.8 mm per day growth rate for CRL which is
unlikely when compared to the other specimens. This could be due to an inaccurate measurement
due to the position of the fetus in utero. Lastly, the growth rate of the OD was calculated (Table
16). The 126 day fetus appeared to grow at a faster rate than the 154 day fetus. This could be due
to the dam’s weight and height and the sire’s weight and height which may affect the overall
growth of the fetus (Table A, Methods and Materials).

56
Growth Rate of IOD
Fetus Age (Days)
IOD Fetal measurement
(mm)
IOD Ultrasound measurement
(mm)
Day of Gestation for Ultrasound IOD (Days)
Days Prior to Termination
(Days)
Average Growth/ Day
(mm)
154 79.4 49 121 33 1.1
103 42.9 24 72 31 0.6
102 40.9 27 78 24 0.6
Table 13: Determining growth of IOD per day. IOD of aborted fetus was measured and compared to the final
ultrasound image measurement of IOD. This resulted in an average rate of growth per day of the IOD.
Rate of Growth for BPD
Fetus Age (days)
BPD fetal measurement
(mm)
BPD Ultrasound measurement
(mm)
Day of Gestation for
Ultrasound BPD (mm)
Days Prior to Termination
(days)
Average Growth/
Day (mm)
154 46.25 25 119 35 .6 126 34.35 25 111 15 .62 103 23.09 22 98 5 .2 102 21.37 20 84 8 .17
Table 14: Determining rate of growth of BPD. BPD of the aborted fetus was measured and compared to the final ultrasound image measurement of BPD. This results in an average rate of growth per day of the BPD.
Rate of Growth for CRL
Fetus Age (days)
CRL fetal measurement
(mm)
CRL Ultrasound measurement
(mm)
Day of Gestation for
Ultrasound CRL (mm)
Day Prior to Termination
(days)
Average Growth/
day (mm)
154 240 70 85 69 2.4 126 - - - - - 103 123.37 56 70 33 2.03 102 127.29 65 75 28 2.22 72 69.43 46 68 4 5.8
Table 15: Determining rate of growth of CRL. CRL of the aborted fetus was measured and compared to the final ultrasound image measurement of CRL This results in an average rate of growth per day of the CRL.

57
Rate of Growth of OD
Fetus Age (days)
*OD fetal measurement
(mm)
OD Ultrasound measurement
(mm)
Day of Gestation for
Ultrasound OD (mm)
Days Prior to Termination
(days)
Average Growth/ day
(mm)
154 24.25 17 133 21 .3 126 16.18 10 113 13 .4 103 12.5 11 95 8 .185 102 11.99 7 83 19 .2
Table 16: Growth rate was calculated as described in the previous tables.
*OD fetal measurement is an average of both right and left OD.
Conclusions:
The field method of ultrasound examinations to identify and monitor pregnancy in the
alpaca is proven in this study as an accurate method. This was shown through the comparison of
CAT scan images and actual fetal dissections and measurements. Furthermore, these modalities
of evaluating fetal growth determined a normal range of growth for the specific structures
observed, thus establishing the normal size and development of these structures at the specified
gestational ages in these specimens. This data will aid in determining the gestational age of a
fetus during an ultrasound examination or if fetus of unknown breeding date is aborted. This data
will also aid in determining if a pregnancy is progressing normally, or if abnormal development
is occurring.
Further research is needed on this subject of fetal development in order to confirm that
these findings are valid. Observing more fetuses of different gestational ages and from different
dams would allow for the ability to generalize on alpaca fetal development. Another way to
improve this study would be to compare the fetuses based on the sires and dams. This would also
explore the possible genetic influence on fetal size and growth.

58
References
Aiello, S. E. (1998). Merck veterinary manuel . (8th ed., p. 236). Philadelphia: National
Publishing Company Inc.
Apostoli, J. (Photographer). (2004). Gastrointestinal tract of an alpaca. [Print Drawing].
Retrieved from http://www.pacificsunalpacas.com/alpacas_101/index.html
Grazitua, F. J. (2001). Predication of gestational age by ultrasonic fetometry in llamas (lama
glama) and alpacas (lama pacos). Animal Reproduction Science, 66(2001), 81-92.
Herrera, E. A. (2002). Use of fetal biometry to determine fetal age in late pregnancy
llamas. Animal Reproduction Science, 74(2002), 101-109.
Olivera, L. V. (2003). Developmental changes at the materno-embryonic interface in early
pregnancy of the alpaca, lamos pacos. Anatomy and Embryology, 207(4), 317-331.
Retrieved from http://www-ncbi-nlm-nih gov.silk.library.umass.edu/pubmed/14579154