obstacle detection using v-disparity image based on: global correlation based ground plane...
Post on 21-Dec-2015
225 views
TRANSCRIPT

Obstacle detection using v-disparity image
Based on: Global Correlation Based Ground Plane Estimation Using V-Disparity Image, By: J. Zhao, J. Katupitiya and J. Ward, 2007
Obstacle Detection with Stereo Vision for Off-Road Vehicle Navigation, By: A. Broggi, C. Caraffi, R. I. Fedriga, P. Grisleri, 2005
Real Time Obstacle Detection in Stereovision on Non Flat Road Geometry Through ”V-disparity” Representation, By: R. Labayrade, D. Aubert, J. Tarel, 2002
Presented by: Ali Agha
March 25, 2009

Motivation
Obstacle avoidance using stereo vision Points with Z > 0
The pitch angle between the cameras and the road surface will change. Therefore, we need to compute the pitch angle and disparity of ground pixels dynamically
Related work
Disparity map 3D point cloud Ground plane extraction using plane fitting obstacle detection
Yu et al (2005)
Disparity map Optical flow and ground information obstacle detection
Mascarenhas (2008) Giachetti et al (1998)
Disparity map V-disparity image and ground information obstacle detection
Labayrade (2002) Broggi (2005) Zhao (2007)
V-Disparity image
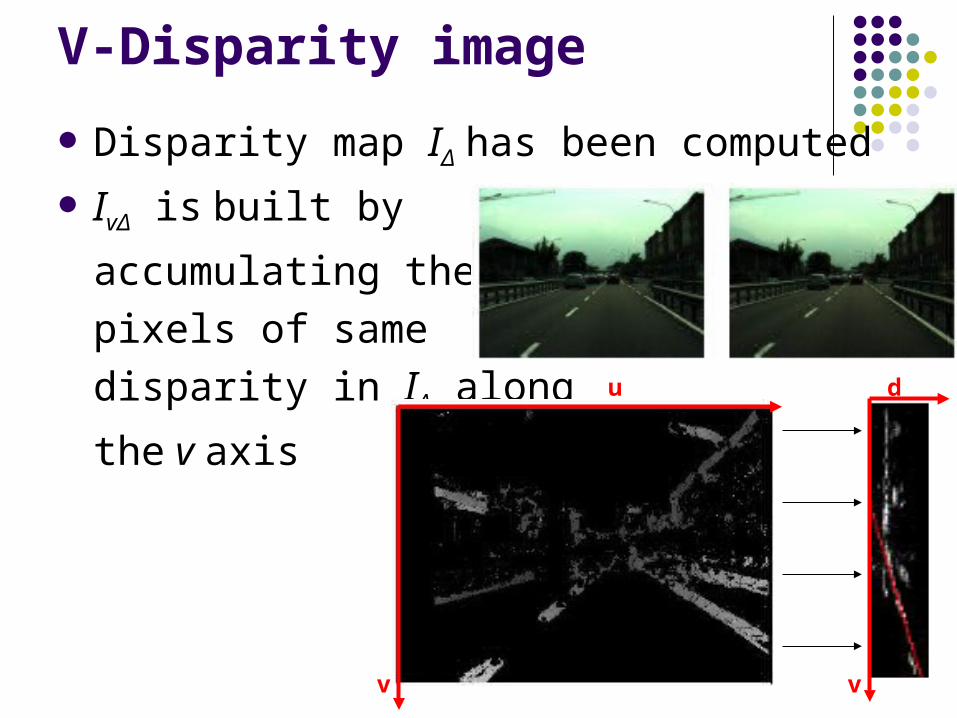
Disparity map IΔ has been computed
IvΔ is built by
accumulating the
pixels of same
disparity in IΔ along
the v axis
d
vv
u
The image of a plane in v-disparity image
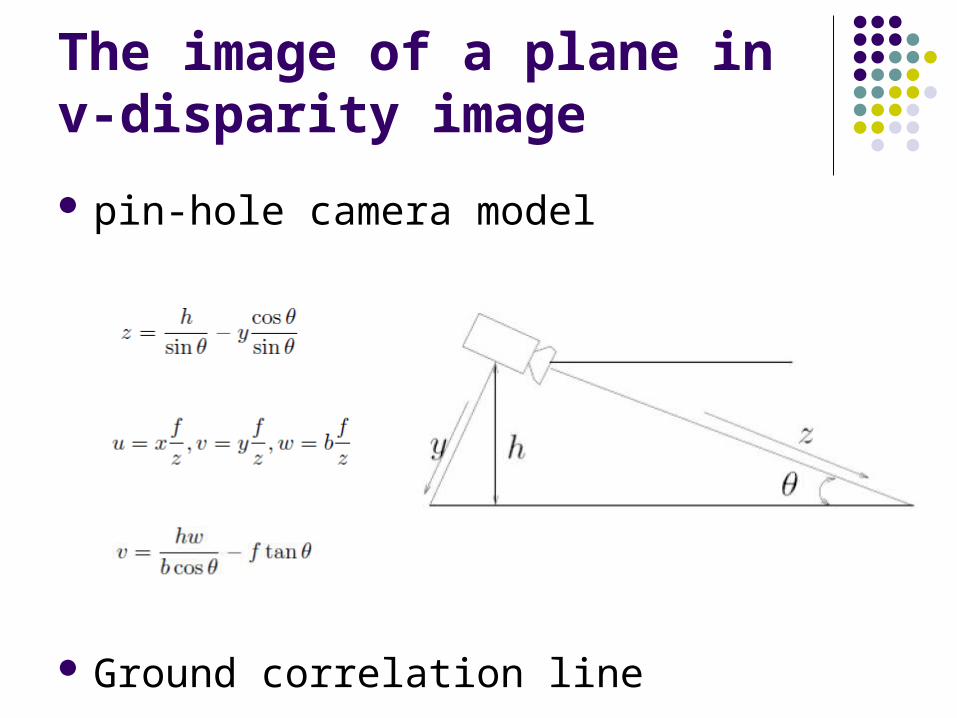
pin-hole camera model
Ground correlation line
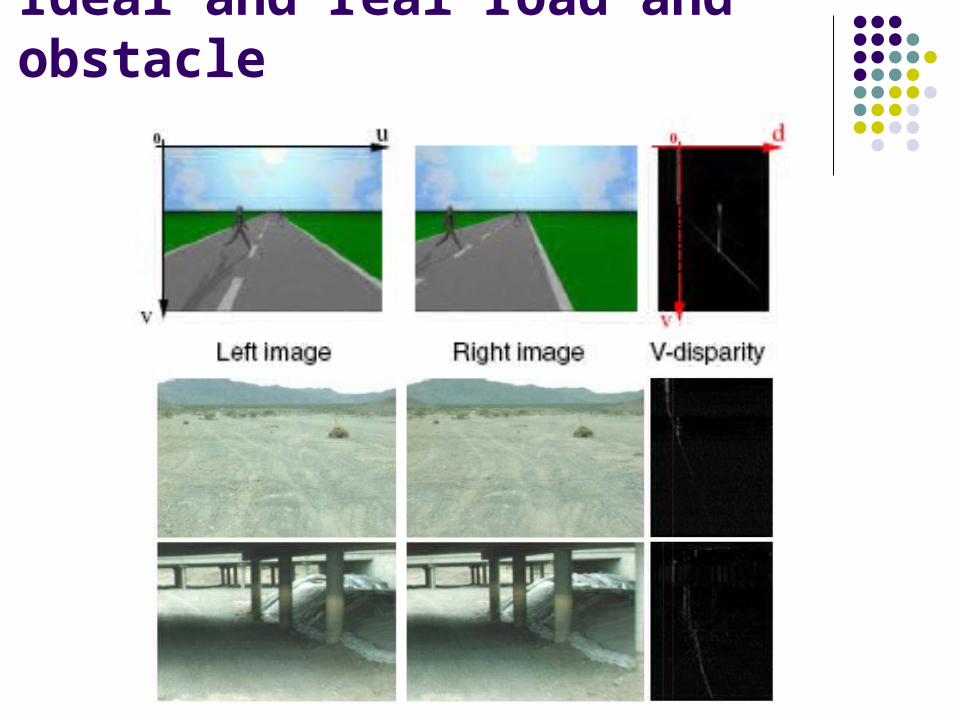
Ideal and real road and obstacle

Hough Transform
Labayrade uses Hough transform to extract the ground
correlation line

free space on the road

Robust ground correlation extraction
Broggi et al. experimentally, found that the ground correlation line during a pitch variation oscillates, parallel to itself.
Zhao et al. investigated this characteristic mathematically and gave the condition for this characteristic to be valid.

Condition derived by Zhao et al
Θs= is 7.73.
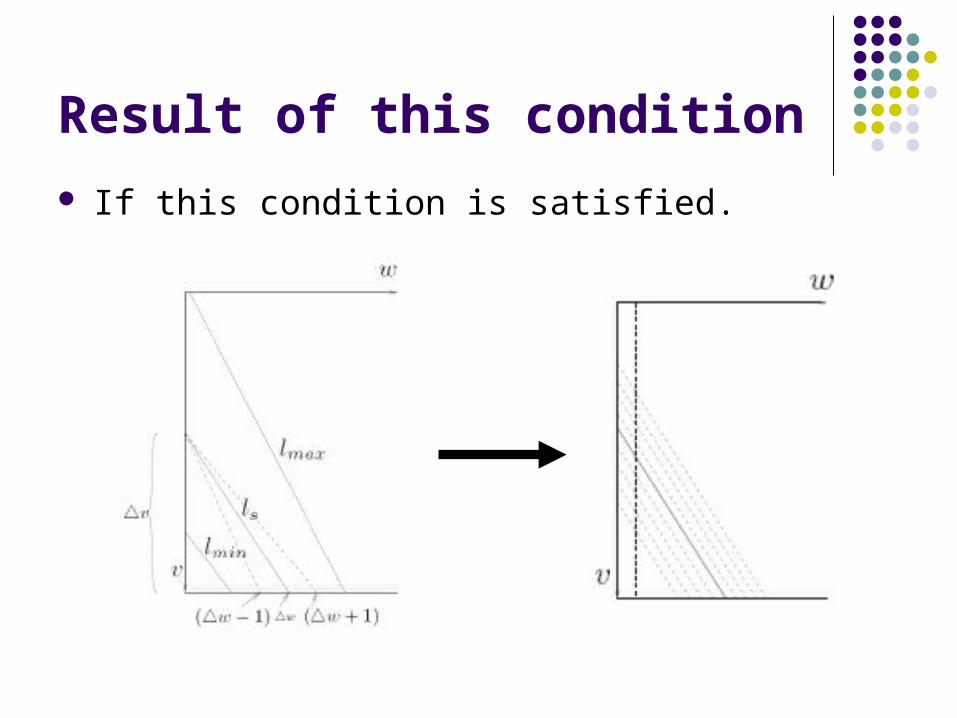
Result of this condition
If this condition is satisfied.

GLOBAL CORRELATION METHOD
Exploiting this characteristic Fast and Robust method (even in lack of distinct features)
By accumulating the matching cost (intensity of V-disparity) along each of the candidate lines and choose the one with least (most) accumulated matching cost as ground correlation line.

Verifying equations and assumptions(Road has distinct features)
Implementing the Labayrade’s work
Disparity map V-D Hough

Verifying equations and assumptions(Road has distinct features)
In the sequence of images the position of ground correlation lines is
ranging from 25 to 28. The slop(g) of ground
correlation lines
ranges from 5.5 to
5.5652.

Results Applying the method on the same images
Calculate the matching cost (associated with each candidate ground correlation lines)
matching costs associated with candidate
lines
Same as Hough
transform
GCL

Without distinct features
Disparity map V-D Hough

Without distinct features - Comparison
Hough transform and global correlation method
Hough GCL

Obstacle detection

Conclusion
This accuracy is dependant of the image quality and whether or not the ground pixel dominate this area of the image.
It seems an appropriate method for detecting obstacles such as vehicles in road in night using structured light (as the headlight of automobile)

Thank you
Questions??