occupancy-based energy management and … energy management and campus monitoring using wireless...
TRANSCRIPT

International Journal of Engineering & Technology IJET-IJENS Vol:15 No:01 56
158001-4949-IJET-IJENS © February 2015 IJENS I J E N S
Occupancy-Based Energy Management and Campus
Monitoring using Wireless Sensor Network Rashmi Priyadarshini
a, S.RN Reddy
b, R.M. Mehra
c
a. School of Engineering and Technology
Electronics and Communication Engineering
Sharda University, Greater Noida, India
[email protected] b. Department of Computer Science
IGIT, GGSIP University
Delhi, India
[email protected]. School of Engineering and Technology
Electronics and Communication Engineering
Sharda University, Greater Noida, India
Abstract-- The economic growth of developing countries leads
to a huge increase of energy use in buildings in large campus like
universities and schools. A major source of high electricity
consumption is careless usage of electricity. In most cases,
building appliances systems run on fixed schedules and do not
employ any control system based on detailed occupancy
information. This paper presents the design and deployment of
occupancy detection platform that can be used for accurate
occupancy detection and electrical appliances such as lights, fans,
air conditioners are controlled by considering the occupancy
information and weather conditions. With the help of passive
infrared sensor, infrared sensor, temperature sensor and
humidity sensor, the low cost and easily deployable multi-sensor
node based wireless sensor network is developed to achieve
effective utilization of electrical energy and manpower. The
system has been implemented in laboratories, class rooms and
staffrooms of Sharda University, Greater Noida, India. The
results show that approximately 10-19% power can be saved due
to implementation of this wireless sensor module. The security of
campus against intruders, moving in these areas after working
hours, is also provided by this system.
Index Term— Occupancy detection, Campus Monitoring,
Wireless Sensor Network, Zigbee Protocol, Energy Saving, Low
Cost, Multi-sensors Nodes
1. INTRODUCTION
In developing countries like India, commercial buildings are a
major source of high electricity consumption because of lack
of awareness and careless usage of electricity [1][2]. Various
researchers are focusing on making buildings more energy
efficient by including specific areas such as heating,
ventilation and air-conditioning(HVAC) [3][4], managing IT
energy consumption [5][6] and lighting [7] within buildings.
HVAC loads include mechanical equipments for combined
heating, ventilation and air conditioning which consumes
significant amount of energy. This consumption becomes
more significant if buildings are not designed using energy
efficiency factors such as dynamic windows shadings,
centralized ventilation and cooling/heating thermal
requirements.
Several models have been developed to monitor and
control electrical energy in buildings using occupancy
detection as a driving factor. Recent efforts have been to
optimize the occupancy detection techniques, so as to improve
the accuracy of estimating the occupancy. Tuan Anh Nguyen
[8] has given a meaningful survey on energy intelligent
buildings based on user activity. He has proposed future
perspective on user activity in contrast to other smart home
applications, such as medical monitoring and security system.
An energy intelligent building might not require cameras or
wearable tags that may be considered intrusive to the user.
Instead, Wireless Sensor Network (WSN) are today
considered the most promising and flexible technologies for
creating low-cost and easy-to-deploy sensor networks in
scenarios like those considered by energy intelligent buildings.
Rong-Shue Hsiao et. al [9] have proposed a robust WSN for
building lighting framework. Passive Infra-Red (PIR) and
microphone are used for occupancy detection. The occupancy
sensors used in this work are fairly coarse-grained and
inaccurate. Furthermore, these occupancy sensors are usually
limited in scope and only control lighting. This system can
control accurately if frequent conversation is possible. It is not
applicable for individual cabins of staff or faculty or officers
working calmly for a long period. Yuvraj et. al have proposed
a WSN for detecting the occupancy to control HVAC [10].
This system fails if the door of cabin was closed and main
occupant is sitting still on chair or door remains open while
room is unoccupied because occupancy detected by reed
switch depends on closing or opening of the door.
Approximately 19% power savings has been estimated by this
approach. Further, they have shown only occupancy detection
without considering the role of environmental conditions.
Elder Naghiyen et. al have reviewed occupancy
measurement techniques [11]. In this review PIR sensor,
Carbon Dioxide sensor and Device-free Localization have
been compared and have shown that PIR based occupancy
detection is cheap, low in energy consumption, easy to deploy

International Journal of Engineering & Technology IJET-IJENS Vol:15 No:01 57
158001-4949-IJET-IJENS © February 2015 IJENS I J E N S
and operates in real-time. Padmanabh et al. have described the
use of microphone and PIR sensors to drive efficient
scheduling of conference rooms [12]. Delaney et al. have used
PIR based wireless occupancy sensors to measure wasted
energy in lighting even when there are no occupants [13].
These efforts however neither use occupancy information to
drive actual systems nor evaluate accuracy of their detection
sensor. Other methods for detecting occupancy include sonar
based methods [14] or camera based systems [15] suffers from
cost, deployment and privacy issues. Carbon dioxide- based
occupancy detection has also been proposed but the main
limitation is delay in the response of system to detect event of
incoming people [16]. Barbato et. al have focused on
algorithms supporting user profiles based on PIR sensed data
[17]. This effort is in context of home only and is not suitable
for large campus.
This work, therefore, focused on the design and
development wireless sensor network in laboratories, class
rooms and staffrooms of Sharda University for monitoring
occupancy as well as temperature, humidity and security to
provide intelligent control on appliances. The purpose of this
system was to fulfil the occupant’s requirement for comfort as
well as reduction in energy consumption during building
operations. An estimation of reduction in energy consumption
was made using occupancy detail, weather conditions, number
of occupants per floor area, construction of sensed/controlled
area such as number of windows, materials used for walls,
floors and roofs.
2. EXPERIMENTAL
The energy-use breakdown of the department of electronics
engineering (ECE) block of Sharda University is shown in
Fig.1. The breakdown of ECE block has several subsystems:
IT loads, fans, lights and HVAC. The IT loads are irrespective
of weather, climate and seasons. In the present work, IT load
were not been controlled by occupancy driven techniques.
Lighting loads consume 16% annual electricity power of the
baseline electrical usage. In India, eight out of twelve months
are hot enough to use fans. Fan loads consume 21% annual
power consumption of the baseline electrical usage. In HVAC
load all types of air conditioners, exhausts and heaters were
included. The load consumes 38% of electrical energy per
annum of the baseline electrical usage. The baseline electrical
usage for commercial buildings is defined by Uttar Pradesh
state government [18].
Fig. 1. Energy-use breakdown of Electronics Engineering Building for one year
The proposed design controls HVAC systems along with
lights and fans based on occupancy detection to get potential
power savings per annum.
The design provides an accurate estimation of occupancy and
controlling appliances of rooms of a campus to minimize the
electrical power wastage. Fig.2 shows the block diagram of
the Wireless Sensor Network for Sharda University (WSN-
SU).

International Journal of Engineering & Technology IJET-IJENS Vol:15 No:01 58
158001-4949-IJET-IJENS © February 2015 IJENS I J E N S
Fig. 2. Block Diagram of WSN-SU
The multi sensor nodes are used to develop a reliable and low
cost WSN-SU for monitoring the occupancy, temperature,
humidity and controlling the switching ON and OFF of
electrical appliances such as lights, air conditioners, fans,
exhausts and room heaters. The system also alerts the security
by giving alarm if motion is detected in faculty rooms,
classrooms, laboratories and offices beyond working hours. It
also facilitates that occupants can change scheduled working
time if they want to do overtime or any change in predefined
working hour.
2.1. Hardware development
The WSN-SU consists of mainly two parts:
a) Sensor-actuator node
b) Base Station
a) WSN-SU sensor-actuator node
The sensor–actuator design was based on accurate and reliable
occupancy detection. False-positives (high output even no
occupancy) may lead unnecessary switching ON of the
appliances and increase energy consumption and False-
negative (low output even there is occupancy) may lead to
discomfort of occupant. The system cost was significantly
reduced as compared with commercially available wireless
motes [19] using commercially available Integrated Circuits
(ICs). The system is incrementally deployable within entire
campus, without requiring large scale modifications in the
existing wiring system. WSN-SU was designed in three
modules: First module was for occupancy detection using a
combination of sensors: PIR sensor and Infrared sensor.
Second module was for sensing of environmental conditions
using two sensors: temperature sensor and humidity sensor. To
develop an experimental test bed and to make the node of low
cost, discrete and easily available sensors/components were
used in sensor-actuator node. LM35DZ and HR202 were used
as temperature sensor and humidity sensor respectively.
LM35DZ is a precision centigrade temperature sensor which
produces the output voltage proportional to the temperature.
Table I shows the specifications of these sensors.
Table I
Specifications of the sensors.
S.N
o
Specificati
ons PIR
IR
transrecie
ver
HR20
2
LM35D
Z
1 Function
Motio
n
Detect
or
Object
Interrupt
humid
ity
sensor
Temperat
ure
Sensor
2 Operating
voltage
2.5 to
5 v
0.2 to 2.5
V 1.5 V 4 to 30 V
3 Measuring
range
0 – 9
mt 35 inch
20 to
95%R
H
-550c to
150⁰c
4 Accuracy --- ---- ±5%R
H ±1.4%
To define time schedule of sensing/control area for different
working and nonworking days, Real Time Clock (RTC) was
used in sensor node. Third Module was used to analyse the
data received from sensors and controlling appliances
according to the sensed condition. A low power and low cost
microcontroller (PIC16F877A) based on reduced instruction
set computing (RISC) architecture was used to analyse data
received from sensors and provides proper control to
appliances.
A keyboard matrix was interfaced with microcontroller to
facilitate few selected occupants to change their time schedule
as well as threshold parameters according to their need. For
reliable, low power and robust communication between node
and local base station, Zigbee protocol was used [20]. PIR
sensor, temperature sensor and humidity sensor were

International Journal of Engineering & Technology IJET-IJENS Vol:15 No:01 59
158001-4949-IJET-IJENS © February 2015 IJENS I J E N S
connected to analog-to-digital converter (ADC) pins of
microcontroller. IR sensor does not require ADC pins, since its
output is either high or low. Real Time Clock was connected
in each node with microcontroller. Fig.3 shows the snapshot of
the circuit. The node could operate with eight PIR sensors at a
time. For faculty rooms of Sharda University, this node could
monitor six cabins.
Fig. 3. Snapshot of proposed sensor node developed for Monitoring parameters
b. Base Station
Base Station was a computer connected with Zigbee module.
Universal Serial Bus to serial port connector was used to
interface the computers and Zigbee module. At base station,
Zigbee module is configured as co-ordinator. Fig.4 shows the
received data from different nodes at base station.
Fig. 4. Received Data Display on Base Station
International Journal of Engineering & Technology IJET-IJENS Vol:15 No:01 60
158001-4949-IJET-IJENS © February 2015 IJENS I J E N S
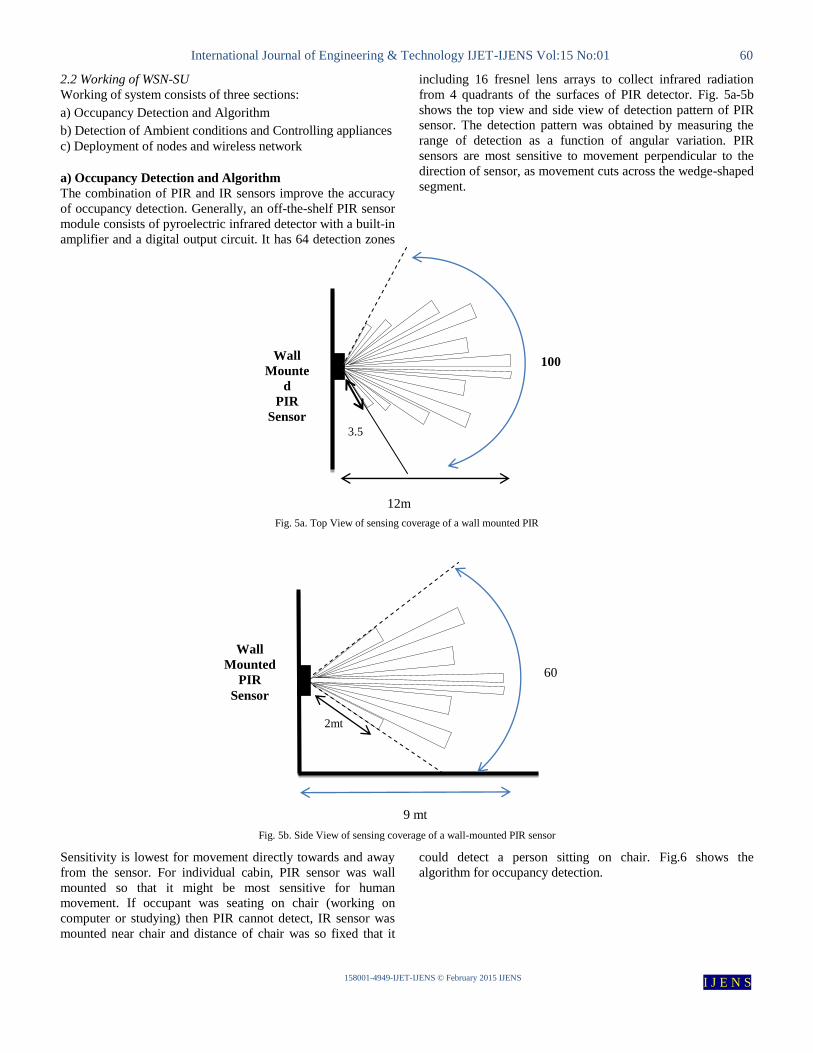
2.2 Working of WSN-SU
Working of system consists of three sections:
a) Occupancy Detection and Algorithm
b) Detection of Ambient conditions and Controlling appliances
c) Deployment of nodes and wireless network
a) Occupancy Detection and Algorithm
The combination of PIR and IR sensors improve the accuracy
of occupancy detection. Generally, an off-the-shelf PIR sensor
module consists of pyroelectric infrared detector with a built-in
amplifier and a digital output circuit. It has 64 detection zones
including 16 fresnel lens arrays to collect infrared radiation
from 4 quadrants of the surfaces of PIR detector. Fig. 5a-5b
shows the top view and side view of detection pattern of PIR
sensor. The detection pattern was obtained by measuring the
range of detection as a function of angular variation. PIR
sensors are most sensitive to movement perpendicular to the
direction of sensor, as movement cuts across the wedge-shaped
segment.
Fig. 5a. Top View of sensing coverage of a wall mounted PIR
Fig. 5b. Side View of sensing coverage of a wall-mounted PIR sensor
Sensitivity is lowest for movement directly towards and away
from the sensor. For individual cabin, PIR sensor was wall
mounted so that it might be most sensitive for human
movement. If occupant was seating on chair (working on
computer or studying) then PIR cannot detect, IR sensor was
mounted near chair and distance of chair was so fixed that it
could detect a person sitting on chair. Fig.6 shows the
algorithm for occupancy detection.
12m
100
⁰
Wall
Mounte
d
PIR
Sensor 3.5
m
9 mt
60
⁰
2mt
Wall
Mounted
PIR
Sensor

International Journal of Engineering & Technology IJET-IJENS Vol:15 No:01 61
158001-4949-IJET-IJENS © February 2015 IJENS I J E N S
Fig. 6. Algorithm for occupancy detection
In classrooms and laboratories, PIR sensors were wall mounted
and IR sensors were deployed on podium. As Instructor
stopped movement and delivered lecture at podium then IR
sensor sensed the occupancy. Fig. 7 shows the deployment of
IR sensor.
Fig. 7. Sensing coverage of a desk mounter IR sensor
b) Detection of Ambient conditions and Controlling
appliances
As soon as occupancy was detected, corresponding lights were
ON. The working hours of each sensing and controlling areas
were predefined either by occupancy pattern already collected
or by time table. Before deployment of nodes, occupancy
information of classrooms, faculty cabins, Head of the
Department (HoD) cabin and laboratories were collected by
constantly monitored the hallway to record actual occupancy
for each room. The occupancy data of different rooms were
collected for one month each during teaching period and
examination period for eight working hours per day. With 25
working days in a month, the total period amount to 200 hours.
Fig.8a and 8b show the occupancy patterns for different areas
for 200 working hours which corresponds to working hours of
one month during teaching period and examination period
respectively. Occupancy data was collected per working day
since March 2013. This data was collected by continuous
monitoring the hallways.
Fig. 8a. Occupancy detail of five zones for one teaching month
Both IR and
PIR not
detected IR and
PIR
detecte
d
IR or PIR
detected
Empty:
Appliances off
Entering:
Lights on
Occupancy:
Appliances
control
initiated
Both
IR and
PIR
not
detecte
d

International Journal of Engineering & Technology IJET-IJENS Vol:15 No:01 62
158001-4949-IJET-IJENS © February 2015 IJENS I J E N S
Fig. 8b. Occupancy detail of five zones for one examination month
The main differences in occupancy pattern during teaching
period and examination period was in the pattern of classroom,
staffrooms and laboratory. Since during examination period
most of the staff were busy in examination duties, most of the
classrooms were engaged full time for examination while
laboratories were almost free. The occupancy patterns of HoD
and researcher cabins were almost same for both the periods.
In rooms of administrative staff, working hours are to be
defined on daily basis according to their schedule. The outputs
of temperature sensor and humidity sensor were considered
only if the occupancy is detected within defined working hour
for that area. Room heaters, air conditioner, fans, exhaust fans
were controlled according to the output of temperature and
humidity sensors. Threshold of temperature depends upon the
seasons and weathers. For example, if temperature was more
than 200C, fans were ON, if it was more than 24
0C, air
conditioners were ON and if it was less than 70C, room heaters
were ON. Similarly exhaust fans were controlled by the
humidity sensors. In case of occupancy detection beyond the
limit of working hour, a buzzer blows to alert security. Fig. 9
shows the detailed algorithm of occupancy detection based
appliances control.
Fig. 9. Working Algorithm of WSN-SU
An additional facility to fix or change the working schedule as
well as the threshold parameters for controlling the appliances
was given to few selected staff as per their need using a
keyboard interfaced with the node deployed in respective
cabin. The present base station is provided with another
feature i.e. the appliances of each sensing/control area can also
be controlled through base station by feeding the desired input
from keyboard of the base station. For example
A = AC “ON”
B = AC “OFF”

International Journal of Engineering & Technology IJET-IJENS Vol:15 No:01 63
158001-4949-IJET-IJENS © February 2015 IJENS I J E N S
C = FAN “ON”
D = FAN “OFF”
E =ALL RELAYS “ON”
F = ALL RELAYS “OFF”
These commands are required if node is not working properly
or unwanted occupancy is detected in sensing/control area
within working hour.
c) Deployment of nodes and wireless network
The network topology and the physical location of sensor
nodes strongly influence the performance of the network from
perspective of reliable communication. Each sensor node was
connected to cluster head. Cluster heads were connected with
routers and routers were connected to the base station. The
network was self- organizing. WSN was on one of the floors of
ECE block which is composed of several faculty cabins, six
classrooms, one laboratory and a cabin of HoD. Fig.10a and
10b show the sensor node deployment and the network
topology respectively.
Fig. 10a. Building Floor Plan and Deployment of sensor nodes
Fig. 10b. Hierarchical cluster-based network topology

International Journal of Engineering & Technology IJET-IJENS Vol:15 No:01 64
158001-4949-IJET-IJENS © February 2015 IJENS I J E N S
3. RESULTS
3.1. Occupancy Detection Accuracy
In order to test the accuracy of the system, the situations of
entering and leaving the area same as occupants would behave
normally were simulated. In faculty and HoD rooms, the
experiment was divided into two parts. During the first part,
persons entered the room, walked around and came out.
Detection of WSN-SU perfectly matched the actual occupancy.
In second part, persons entered the room and after few minutes
of walking, sat on the chair with minimal movements. IR
sensor was mounted on desk at a certain distance from the
chair, up to a maximum 52 inches, so that it certainly senses a
person sitting on the chair. Again occupancy detection of the
node perfectly matched the actual occupancy. In classrooms
and laboratories, same types of experiments were performed
and accurate occupancy detection was obtained by the WSN-
SU system. Figs.11a-11c show experimental results of
laboratory occupancy test, staff cabin occupancy test and
classroom occupancy test respectively. Accuracy of occupancy
test was ranging from 95 to 98%. The accuracy test was done
using t-test of actual occupancy data and WSN-SU occupancy
data.
Fig. 11a. Accuracy of Occupancy detection in laboratory of WSN-SU vs. Actual occupancy

International Journal of Engineering & Technology IJET-IJENS Vol:15 No:01 65
158001-4949-IJET-IJENS © February 2015 IJENS I J E N S
Fig. 11b. Accuracy of Occupancy detection in staff cabin of WSN-SU vs. Actual occupancy
Fig. 11c. Accuracy of Occupancy detection in classroom of WSN-SU vs. Actual occupancy b) Appliances control and energy calculation

International Journal of Engineering & Technology IJET-IJENS Vol:15 No:01 66
158001-4949-IJET-IJENS © February 2015 IJENS I J E N S
To evaluate energy efficiency, electrical energy consumption
in different zones prior to the deployment of nodes was
recorded in faculty cabins, classrooms, laboratories and HoD
cabin. Sub meters were connected to measure the power
consumption of each remote area. The power consumption
would depend on seasons (summer, winter, spring and rainy
season), daily weather, construction of sensed area (sun
facings, number of windows, material type of flooring etc.),
number of occupants in the classrooms, cabins, laboratories
etc. Electrical power consumption per month was continuously
monitored since March 2013. Analysis of the collected data
revealed that in each season, two continuous months have
almost same power consumption. Those months were March-
April, May-June, July-August and December-January. Table II
shows the parameters for occupancy, temperature, humidity
and electrical loads for two such continuous months having
almost same power consumption.
Table II
Parameters for occupancy, temperature, humidity and electrical loads for two continuous months having almost same power consumption
It may be mentioned that power consumption in the month of
September was almost same as that in the month of July or
August. Similar consumption pattern was observed for October
and April, November and March and January and February.
The number of occupants in classrooms and laboratories and
workload on faculties were almost same in the month of March
and April because these were teaching months. In the months
of May and June the occupancy pattern of classrooms,
laboratories, faculty cabins were different since these were
examination months. July and August were again teaching
months and has occupancy pattern similar to March and April.
January and December were months for examination. For all
these combinations of months, for first month the power
consumption was measured without activation of sensor-
actuator node while for second month, measurements were
done with sensor-actuator node. The consumption of power
was measured with the help of sub meters connected into
sensed/controlled areas. These experiments were conducted in
five zones: Faculty cabins, HoD cabin, Researcher’s cabin,
classrooms and laboratories since these zones are different in
terms of number of occupants, occupancy patterns and
electrical loads. Figs. 12-15 show the power consumption as
function of time with and without WSN-SU in the case of
summer, winter, spring and rainy seasons.
Months Period Season Temperature
range 0C
Relative
Humidity
range
%
Appliances to be
controlled
March-
April
Teaching Spring 13 to 25 25 to 30 Lighting loads, fans
May- June Examination Summer 25 to 45 27 to 45 Lighting loads, fans,
air conditioners
July-
August
Teaching Rainy 26 to 38 75 to 80 Lighting loads, fans,
airconditioners,
exhaust fans
September Teaching Rainy 26 to 38 75 to 80 Lighting loads, fans,
airconditioners,
exhaust fans
October-
November
Teaching Post
monsoon
20 to 25 25 to 30 Lighting loads, fans
December-
January
Examination Winter 5 to 15 50 to 55 Lighting loads, room
heaters

International Journal of Engineering & Technology IJET-IJENS Vol:15 No:01 67
158001-4949-IJET-IJENS © February 2015 IJENS I J E N S
Fig. 12. Power Consumed with and without WSN-SU in May-June
Fig. 13. Power Consumed with and without WSN-SU in December-January

International Journal of Engineering & Technology IJET-IJENS Vol:15 No:01 68
158001-4949-IJET-IJENS © February 2015 IJENS I J E N S
Fig. 14. Power Consumed with and without WSN-SU in March-April
Fig. 15. Power Consumed with and without WSN-SU in July-August
It is evident that the rate of consumption of power is much
lower when the WSN-SU was activated. Fig. 12 reveals that in
summer the power saving on daily basis varies from 11% to
36%m with the use of WSN-SU. The average power savings is
21%. Fig. 13 shows power consumption rate decrements in
winters with the application of WSN-SU. The average power
savings was ~ 30% while on daily basis percentage power
saving ranges from11% to 40%. Figs. 14 and 15 show the
effect of WSN-SU on power consumption in spring and rainy
seasons respectively. In spring season average power saving
was ~23% and daily power savings ranges from 14 to 38%. In
rainy season average power saving was ~ 33% while daily
power savings ranges from 11 to 39%. Therefore, it was
revealed that with the implementation of WSN-SU a power
savings of ~21 to 33% was achieved in a year.
C. Simulation
The impact of WSN-SU on energy cost was studied using
energy plus building energy simulation program [21]
developed by US department of energy. The building model
was simulated for one year. Fig. 16 shows that the monthly
savings using our occupancy systems is between 10 to 19%.

International Journal of Engineering & Technology IJET-IJENS Vol:15 No:01 69
158001-4949-IJET-IJENS © February 2015 IJENS I J E N S
Table III shows the parameter considered for simulation in energy plus. The annual consumption of Electronics Engineering
block is 472662 kWh. At least 10% of power saving can save 47266.2 kWh per annum. Table III
Information used for the simulations
Names of Zones Classroom Staff cabin HoD cabin Researcher’s
cabin
Laboratory
Floor area(m2) 98.12 42.37 98.12 42.37 183.59
Period of
simulation
January 1 to December 31
Weather data file IND_NewDelhi.421820_ISHRAE
People Schedule Occupancy data collected before deployment(Fig. 8)
Working Hours 8:00-17:00
Cooling Set point
temperature
240C for working hours
D. Effective cost Calculation
The cost of developed node was approximately US $60 which
was less than commercially available nodes [19]. Five sensor-
actuator nodes can control 30 cabins. In terms of sensing and
controlling (occupancy detection, temperature and humidity
detection and controlling of appliances) per cabin, the cost per
node is only US$10 (US$ 60/5) which is quiet cheaper than
other proposed circuits [10]. In classrooms of seating capacity
of maximum 60 students at a time, single node is enough to
detect occupancy in different rows and controlling of 12
lights, 10 fans and at least two air conditioners. Since single
sensor-actuator node can operate with multiple sensors and
control different appliances, effective cost is much lesser than
other proposed nodes.Power consumption of node was 1.8W
using sleep mode configuration with internal wake-up using
watchdog timer. The power consumption of circuit was
calculated using OrCAD (a proprietary software tool suite
used primarily for electronic design automation) and finally
verified using multimeter.
4. CONCLUSION
The study revealed that accurate occupancy information along
with environmental conditions is critical for increasing energy
efficiency. A reliable communication was achieved between
sensor nodes and base station using Zigbee protocol. False
occupancy detection was improved using combination of PIR
and IR sensors. The use of multi-sensor nodes in WSN-SU
resulted in a cost effective and energy saving campus
monitoring system. A power savings ~10 to 19% was achieved
by the system along with the saving of manpower. The system
also provides security against theft after working hours.
ACKNOWLEDGMENT
We wish to thank Mr. Manish Shekhar, Mr. Navin Singh and
Mr. Saurabh Sinha, Graduate Engineers, Sharda University, for
sensor node development and deployment. We also wish to
acknowledge the constant inspiration and support of Dean,
School of Engineering and Technology, Sharda University.
REFERENCES
[1] Inderjeet Singh, Axel Michaelowa, Indian Urban Building Sector:
CDM Potential through Engergy Efficiency in Electricity Consumption, HWWA DISCUSSION PAPER289, Hamburgisches
Welt-Wirtschafts-Archiv (HWWA), Hamburg Institute of
International Economics,2004,ISSN 1616-4814 [2] WBCSD, Transforming the Market: Energy Efficiency in
Buildings, Survey report, The World Business Council for
Sustainable Development, April 2009.

International Journal of Engineering & Technology IJET-IJENS Vol:15 No:01 70
158001-4949-IJET-IJENS © February 2015 IJENS I J E N S
[3] V. L. Erickson, Y. Lin, A. Kamthe, R. Brahme, A. Surana, A. E.
Cerpa,M. D. Sohn, and S. Narayanan, Energy efficient building environment control strategies using real-time occupancy
measurements, Proceedings of the First ACM Workshop on
Embedded Sensing Systems for Energy-Efficiency in Buildings, pages 19–24, 2009.
[4] G. Gao and K. Whitehouse, The self-programming thermostat:
optimizing setback schedules based on home occupancy patterns, Proceedings of the First ACM Workshop on Embedded Sensing
Systems for Energy-Efficiency in Buildings, pages 67–72, 2009
[5] Y. Agarwal, S. Savage, and R. Gupta, Sleep Server: A Software-Only Approach for Reducing the Energy Consumption of PCs
within Enterprise Environments, Proceedings of USENIX Annual
Technical Symposium (USENIX ATC ’10), 2010. [6] Y. Agarwal, S. Hodges, R. Chandra, J. Scott, P. Bahl, and R.
Gupta. Somniloquy: Augmenting Network Interfaces to Reduce
PC Energy Usage, Proceedings of USENIX Symposium on Networked Systems Design and Implementation (NSDI ’09), 2009
[7] D. T. Delaney, G. M. P. O’Hare, and A. G. Ruzzelli, Evaluation of
energy-efficiency in lighting systems using sensor networks, Proceedings of the First ACM Workshop on Embedded Sensing
Systems for Energy-Efficiency in Buildings, pages 61–66, 2009.
[8] Tuan Anh Nguyen, Marco Aiello, Energy intelligent buildings based on user activity: A survey 2013, Energy and Buildings
56(2013) , pp. 244-257
[9] Rong-Shue Hsiaoa, Ding-Bing Linb, Hsin-Piao Linc, Shu-Chun Chen, and Chen-Hua Chung, A Robust Occupancy-based
Building Lighting Framework using Wireless Sensor Networks, Applied Mechanics and Materials Vols. 284-287 (2013) pp 2015-
2020,Trans Tech Publications, Switzerland.
[10] Yuvraj Agarwal, Bharathan Balaji, Rajesh K. Gupta, Jacob Lyles, Michael Wei, Thomas Weng, Occupancy-Driven Energy
Management for Smart Building Automation, BuildSys 2010
,November 2, 2010, Zurich, Switzerland [11] Eldar Naghiyev, Mark Gillott, Robin Wilson,Three unobtrusive
domestic occupancy measurement technologies under qualitative
review ,Energy and Building, Volume 69, February 2014, Pages 507-514
[12] K. Padmanabh, A. M. V, S. Sen, S. P. Katru, A. Kumar, S. P. C, S.
K.Vuppala, and S. Paul, isense: A wireless sensor network based conference room management system, Proceedings of the First
ACM Workshop on Embedded Sensing Systems for Energy-
Efficiency in Buildings, pages 37–42, 2009. [13] D. T. Delaney, G. M. P. O’Hare, and A. G. Ruzzelli, Evaluation of
energy-efficiency in lighting systems using sensor networks,
Proceedings of the First ACM Workshop on Embedded Sensing Systems for Energy-Efficiency in Buildings, pages 61–66, 2009.
[14] S. P. Tarzia, R. P. Dick, P. A. Dinda, and G. Memik, Sonar-based
measurement of user presence and attention, UbiComp, pages 89–92, 2009.
[15] T. Teixeira and A. Savvides, Lightweight people counting and
localizing for easily deployable indoors wsns, IEEE Journal of Selected Topics in Signal Processing, 2(4):493–502, August 2008.
[16] S. Wang and X. Jin, Co 2-based occupancy detection for on-line
outdoor air flow control, Indoor and Built Environment, 7(3):165–181, 1998.
[17] A. Barbato, L. Borsani, A. Capone, and S. Melzi, Home energy
saving through a user profiling system based on wireless sensors,
Conference On Embedded Networked Sensor Systems, pages 49–
54, 2009.
[18] http://www.noidapower.com/Download/Tariff.pdf [19] Michael Johnson, et.al, A Comparative Review of Wireless Sensor
Network Mote Technologies, IEEE Sensors, art. no. 5398442 , pp.
1439-1442 [20] Varchola, Michal, and Miloš Drutarovský, ZigBee based home
automation wireless sensor network, Acta Electrotechnica et
Informatica No 7.1 (2007): 4. [21] D. Crawley, L. Lawrie, and et. al. Energyplus, a new-generation
building energy simulation program, Proceedings of the
Renewable and Advanced Energy Systems for the 21st Century, April 1999.